Article

An Advanced Approach to Improve Synchronization Phase Accuracy with Compressive Sensing for LT-1 Bistatic Spaceborne SAR

1
National Key Laboratory of Microwave Imaging Technology, Aerospace Information Research Institute, Chinese Academy of Sciences, Beijing 100190, China
2
School of Electronic, Electrical and Communication Engineering, University of Chinese Academy of Sciences, Beijing 100049, China
3
Department of Space Microwave Remote Sensing System, Aerospace Information Research Institute, Chinese Academy of Sciences, Beijing 100190, China
4
College of Marine Technology, Ocean University of China, Qingdao 266100, China
*
Author to whom correspondence should be addressed.
Remote Sens. 2022, 14(18), 4621; https://doi.org/10.3390/rs14184621
Submission received: 28 July 2022 / Revised: 8 September 2022 / Accepted: 12 September 2022 / Published: 16 September 2022
(This article belongs to the Section Remote Sensing Image Processing)

Abstract

:
In the bistatic synthetic aperture radar (BiSAR) system, the unavoidable frequency deviation between the oscillators (USOs) will result in additional phase modulation in the demodulated radar signal, which significantly degrades the quality of the SAR image and digital elevation model (DEM) product. The innovative L-band spaceborne BiSAR system LuTan-1 (LT-1) employs a non-interrupted synchronization scheme to acquire the synchronization phase error. This advanced phase synchronization scheme avoids interrupting the normal BiSAR data acquisition and further increases the synchronization frequency. However, some non-ideal factors in the transmission link like attenuation, multipath effect, interference, etc., may cause the synchronization phase to be polluted by noise. A phase denoising approach based on compressive sensing (CS) is proposed to improve the accuracy of synchronization phase. The imaging phase with high signal-to-noise ratio (SNR) is input into the K-SVD algorithm to learn the prior information, and then the noise of the synchronization compensation phase is eliminated by maximum a posteriori (MAP) estimation. The data acquired from the ground validation system of the LT-1 synchronization module are adopted for the validation experiment. The proposed phase denoising method achieves higher phase synchronization accuracy compared with traditional ones. The processing results verify the effectiveness of the proposed method and demonstrate its potential for future on-orbit applications of the LT-1 mission.

1. Introduction

Bistatic synthetic aperture radar (BiSAR) refers to the SAR system in which the transmitter and receiver are equipped on two separated platforms [1,2,3]. Due to its innovative split design, BiSAR has more advantages and wider applications compared with traditional monostatic SAR, such as single-pass cross-track and along-track interferometry with flexible baseline, global coverage with frequent revisiting capability, and scattering information extraction in multi-angle [2,3]. TanDEM-X, the first spaceborne BiSAR system in the world, acquired in bistatic configuration, where one satellite transmits and both simultaneously receive the backscattered signal from the Earth’s surface, generates a fully consistent global digital elevation model (DEM) of all of the Earth’s landmasses [4,5]. Meanwhile, BiSAR and multistatic SAR (MultiSAR) have become a significant evolution direction in the field of earth observation [6]. In recent years, numerous BiSAR/MultiSAR mission plans with broad application prospects such as SAOCOM-CS [7], TanDEM-L [8], LuTan-1 (LT-1) [9], MirrorSAR [10], SESAME [11], HRWS [12], and HARMONY [13] have been proposed in succession.
As an important part of the medium- and long-term development plan for China’s civil space infrastructure, LT-1 is an innovative spaceborne L-band BiSAR Earth observation mission designed to acquire highly accurate global DEM and monitor surface deformation [9,14]. LT-1A and LT-1B satellites have been successfully launched on 26 January and 27 February 2022, respectively. Both satellites are equipped with an advanced full polarization SAR system and are able to acquire SAR image independently by a single satellite [9,15]. In the LT-1 mission, two satellites operate in the flying around mode first, then the following up mode. In the former mode, LT-1A and LT-1B satellites fly in a close formation for highly accurate DEM generation through bistatic interferometry. In the latter mode, the two satellites are distributed with a phase difference of 180° in the same orbital plane in order to monitor the surface deformation through multi-flight differential interference technology [16]. The high precision DEM and surface deformation products produced by LT-1 will serve the research and applications including land and resources, earthquake, mapping, environment, disaster reduction, and forestry. Furthermore, the LT-1 mission will demonstrate some state-of-the-art SAR technologies on orbit, such as advanced nonlinear frequency modulation (NLFM) waveform and distributed SAR imaging [16,17,18].
However, the advantages of the BiSAR system brought by the separation of transmitter and receiver accompany new challenges, especially in synchronization [19]. The synchronization problem mainly consists of three parts: beam synchronization, time synchronization, and phase synchronization [20]. Beam synchronization means that the transmitting and the receiving antennas must point at the same ground footprint simultaneously. Time synchronization refers to that the receiving windows of two satellites must be strictly aligned. Since the pulse repetition frequency (PRF) timing is derived from different oscillators (USOs), any deviation of the clock source will lead to the desynchronization of the receiving windows. This time synchronization error accumulated over time risks reducing the range width and defocusing the image. Equipped with rubidium clock USOs disciplined by the Global Navigation Satellite System (GNSS), the LT-1 system limits the time synchronization error to 60 ns at the time of 600 s data acquisition, and the frequency stability can be up to 10 11 [9]. The problem of phase synchronization refers to the fact that the demodulation frequency of the receiver is hard to be consistent with the modulation frequency of the transmitter, which originates from the difference of USOs on the two satellites and results in additional phase modulation in the demodulated signal [21,22]. The random phase error can be divided into three components: linear phase error, quadratic phase error, and higher-order phase error, which will cause linear displacement, main lobe dispersion, and side lobes increase, respectively [23,24]. In addition, the phase error will eventually be transferred to the interference phase, resulting in the decline of the accuracy of interferometric height measurement. Therefore, highly accurate phase compensation must be implemented in BiSAR/MultiSAR system.
In order to ensure the consistency of transmitter and receiver over a long period of time, many phase synchronization methods have been proposed, such as ultra-high stability frequency source [25], direct pulse synchronization [26], self-synchronization [27], continuous duplex inter-satellite link [28], simplex communication [29,30], and alternate pulse synchronization scheme [21,31]. As a proven BiSAR synchronization technology, the alternate pulse scheme is successfully applied to the TanDEM-X system, and its long-term operation performance is evaluated and verified in [32]. However, in order to exchange the synchronization pulse, the BiSAR data acquisition is interrupted [32]. The quality of SAR images and interferometric products suffer from periodic data loss. Thus, acquisition cannot be interrupted frequently. A tradeoff between the proper sampling of the random phase error and the quality of SAR images leads to the synchronization frequency equal to 5 Hz [33], which limits the accuracy of phase synchronization. As an evolutionary version of the alternate pulse scheme, a non-interrupted phase synchronization scheme is designed for the LT-1 mission [9,34,35]. With intelligent use of the duration between the end of the echo receiving window and the start of the next pulse repetition time (PRT) to exchange synchronization pulse, the LT-1 system avoids interrupting the normal BiSAR data acquisition and increases the maximum synchronization frequency to PRF/2.
Generally, the phase synchronization accuracy meets the design requirements of the LT-1 system. However, the thermal noise and signal attenuation are inescapable, and there may be potential multipath effects and radio frequency interference in the transmission link [36]. The synchronization phase will be disturbed by the noise. Under the framework of the non-interrupted synchronization scheme, the phase synchronization accuracy can be further improved by coherent integration [9]. However, when the synchronization frequency decreases, the synchronization accuracy will be reduced due to the decoherence of signals. In addition, the number of averages should be chosen carefully due to compromise between the coherence and the number of averages [24]. Liang et al. [37] proposed a phase compensation method based on Kalman filtering (KF) to improve the accuracy of phase synchronization. However, Kalman filter estimates the current state by combining the observed values and the predicted values. The predicted values come from the estimation of the previous state. Therefore, a hysteresis phenomenon occurs in the estimated result, which limits the further improvement of synchronization accuracy.
Compressive sensing (CS) provides a newly developed theoretical framework for information acquisition and signal processing, which is widely applied in information theory, image processing, optical/microwave imaging, wireless communication [38]. CS is also a powerful denoising technology, because signals can be preserved in sparse space, while the non-sparse noise can not be. The K-SVD algorithm combined with CS theory does a good job of removing Gaussian white noise from images [39,40]. Inspired by the idea of prior learning in image denoising, we proposed an advanced approach based on compressive sensing to improve synchronization phase accuracy for LT-1 mission. The higher-order term of imaging phase difference is first input into the K-SVD algorithm for learning phase structure and prior information. After obtaining the over-complete dictionary, the noise in the synchronization compensation phase is eliminated by maximum a posteriori (MAP) estimation. Finally, the denoised compensation phase is employed in phase synchronization for BiSAR. Compared with the KF method in [37], the CS method presents a higher synchronization accuracy.
This article is organized as follows. Section 2 introduces the non-interrupted synchronization scheme and its phase model of the LT-1 system. In Section 3, the phase denoise model based on compressive sensing, the K-SVD algorithm, and the processing flowchart are presented in detail. Then the effectiveness of the proposed method is confirmed by the denoising results of the data acquired in the ground validation system in Section 4. Finally, Section 5 concludes this article.

2. Phase Synchronization Scheme

In this section, an advanced non-interrupted phase synchronization scheme designed for the LT-1 mission is introduced. The phase model of the synchronization scheme is also described in detail along with the system design of the LT-1 synchronization module.

2.1. Synchronization Scheme of LT-1

In BiSAR system, the primary satellite transmits pulses to the targets, and both the slave satellite and primary satellite receive the echoes scattered from the ground simultaneously. The azimuth signal received by the slave satellite can be expressed as
s η = exp j 2 π f c τ 0 η exp j Δ φ η
where η denotes azimuth slow time, f c denotes carrier frequency, τ 0 η denotes the delay time of the target. The first exponential term represents the azimuth modulation, which is used for BiSAR imaging. Δ φ η indicates the random phase error caused by frequency deviation between USOs, which is often treated as a second-order stationary stochastic process and conforms to the power-law spectrum model. In this model, the one-sided power spectral density of the random phase noise Δ φ η is expressed as [41]
S Δ φ f = 2 a f 4 + b f 3 + c f 2 + d f 1 + e , f > 0 0 , f 0
where the coefficients a to e, respectively, represent five independent noises: random walk frequency noise, frequency flicker noise, white frequency noise, flicker phase noise, and white phase noise. The objective of phase synchronization is to measure and eliminate the above random phase noise.
According to Equation (1), if a calibration target with a known slant distance history is obtained, the phase error can be estimated after compensating the imaging phase of this target. Therefore, a pair of point targets can be specifically constructed to measure the phase error. The primary satellite sends a point target signal to the slave one to extract the synchronization phase, then the slave satellite replies with a point target signal to offset the slant distance history of the target. In the process of signal transmission, assuming that the distance is constant, half of the phase difference of the pair of signals after pulse compression is the required phase error.
The alternate pulse synchronization scheme employed by TanDEM-X is based on the above principle. However, unlike the scheme of TanDEM-X, the LT-1 mission adopts the time-division transmission mode, which avoids the interruption of normal BiSAR data acquisition and the interference of radar signals to synchronization signals [34]. The timing diagram of synchronization pulse exchange is shown in Figure 1. In the current PRT, LT-1A first transmits the radar signal and then enters the first free duration. After that, both LT-1A and LT-1B complete SAR data acquisition in the echo receiving window. Finally, in the second free duration, LT-1A transmits the synchronization pulse and LT-1B receives it. In the next PRT, after normal BiSAR data acquisition, LT-1B replies with a synchronization pulse to LT-1A. Thus, the alternate transmission of phase synchronization pulses can be realized in 2 PRTs. Therefore, the maximum synchronization frequency can reach to PRF/2 theoretically.
Several key technologies are implemented to ensure the successful operation of the non-interrupted phase synchronization scheme in the LT-1 mission [9,34]:
(1)
Timing control: the LT-1 system employs GNSS-disciplined rubidium clock USOs to calibrate time, which combines the excellent short-term stability of high-quality USO and the long-term advantages of GNSS signal. The frequency stability of the rubidium clock can be up to 10 11 , and such a stable clock source contributes to the high accuracy of timing control.
(2)
Spatial coverage: compared with the six horn antennas of TanDEM-X, only four quadrifilar helix antennas as shown in Figure 2 are equipped in LT-1, which are smaller and lighter. Each antenna is designed to be identical and with a wide beam coverage, so the transceiver antenna pair can be selected according to the principle of maximum signal-to-noise ratio (SNR) to realize 360° omnidirectional communication during an orbital period.
(3)
Signal selection: linear frequency modulation (LFM) signal with the same carrier frequency as radar signal is transmitted in synchronization link, which reduces the complexity of system design and processing algorithm. After demodulation and pulse compression, the synchronization phase can be extracted from the peak position of the synchronization signal with high SNR.
Therefore, when the LT-1 system operates in BiSAR mode, phase synchronization will not result in data loss by periodically interrupting the normal radar signals. The synchronization signal is also prevented from being jammed by the ground echo through time-division transmission. Moreover, the maximum synchronization frequency can be set to PRF/2, which contributes to reducing the interpolation and aliasing errors and improving the accuracy of phase synchronization.

2.2. System Design and Phase Model

As shown in Figure 3, the hardware structure of the LT-1 system is mainly composed of the signal generation unit (orange rectangular block), the transmit-receive unit (blue rectangular block), and the calibration unit (red rectangular block). The hardware systems of the LT-1A and LT-1B radars are completely consistent. The signal generation unit, consisting of the GNSS disciplining module, reference frequency source, and frequency modulation signal source, is employed to generate LFM signals for imaging or synchronization. The GNSS disciplining module employs the disciplined rubidium clock USOs to provide a time–frequency signal for the reference frequency source module. Multiple working frequency signals are generated by the reference frequency source and sent to the frequency modulation signal source to generate corresponding signals.
The transmit-receive unit, consisting of synchronization antennas, synchronization transceiver, microwave combination, receiver, and data former, is employed to accurately control the transmitting and receiving of synchronization pulses. At time t, the synchronization signal generated by LT-1A is transmitted by its transceiver and synchronization antenna. After the time delay of τ ab , the synchronization antenna of LT-1B detects the signal and routes it through the transceiver and microwave combination. The receiver and the data former demodulate and record the synchronization signal, respectively. At time t + τ sys ( τ sys denotes the signal exchange interval), LT-1B transmits synchronization signal through the same process as LT-1A, and LT-1A demodulates and records the received synchronization pulse after τ ba . Finally, two sets of synchronization signals are sent to the ground system for post-processing. Through performing pulse compression on synchronization signals, the synchronization phases can be extracted in those peak positions and expressed as φ ab t and φ ba t , respectively. The difference between φ ab t and φ ba t is used to obtain the synchronization compensation phase, i.e.,
φ c t = 1 2 φ ab t φ ba t .
In order to accurately detect system faults, extract and compensate the phase error introduced by system equipment, the internal calibration is indispensable. The most complex calibration unit consists of five loops: a chirp transmitting loop CT, a chirp receiving loop CR, a reference loop RE, a synchronization transmitting loop ST, and a synchronization receiving loop SR [35]. The functions and composition of each calibration loop are as follows:
1.
Loop CT monitors the phase error caused by the radar transmission link. In this loop, a calibration signal generated by the signal generation unit is sent from the transmitting unit to the antenna calibration network. Then, the signal passes through the internal calibrator and enters the receiving unit.
2.
Loop CR monitors the phase error caused by the radar receiving link. The calibration signal is sent to the internal calibrator, which then passes through the antenna calibration network and antenna receiving channel. After that, the signal enters the receiving unit and is measured.
3.
Loop RE measures the effects of redundant devices in the first two loops. The calibration signal passes through the internal calibrator and reaches the receiving unit for recording.
4.
Loop ST monitors the phase error caused by the synchronization transmission link. The calibration signal enters the internal calibrator through the synchronization transceiver. After that, the signal is collected by the receiving unit.
5.
Loop SR monitors the phase error caused by the synchronization receiving link. the calibration signal is transmitted from the internal calibrator to the synchronization transceiver. Then, the signal is recorded by the radar receiving unit for processing.
After the processing of the above calibration loop, the internal calibration compensation phase φ cal t , i.e., the phase error introduced by the hardware system, can be expressed as
φ cal t = 1 2 φ ST b t φ ST a t + 1 2 φ SR b t φ SR a t φ CR b t φ CR a t + 1 2 φ RE b t φ RE a t
where φ CR t , φ RE t , φ ST t , and φ SR t denote the phase extracted from loop CR, RE, ST, and SR, respectively. The superscript { · } a and { · } b indicate that the phases are extracted at LT-1A and LT-1B, respectively.
When in orbit, satellites are flying with high-speed. The velocity difference will lead to phase error introduced by the Doppler effect, which should be corrected according to the orbit parameters [31]. The Doppler frequency shift between LT-1A and LT-1B can be expressed as
f d t = f c v ab t / c
where v ab t and c indicate the relative velocity and the velocity of light, respectively. Therefore, the Doppler phase error is expressed as
φ dop t = π f d t τ sys .
The high-precision real-time positioning and velocity measurement of the LT-1 system contribute to the accurate correction of the Doppler effect. After combining the internal calibration compensation phase and the Doppler phase error, the accurate compensation phase of the LT-1 system can be written as
φ ac t = φ c t φ cal t φ dop t .
During ground validation, satellites are placed in the microwave darkroom. The radar signal generated by LT-1A is transmitted through the optical delay line and then received by the receivers of LT-1A and LT-1B simultaneously, so as to simulate the BiSAR data acquisition. The optical delay line ensures the high SNR of the imaging signals, which are used for the analysis of synchronization accuracy. After pulse compression of imaging signals, the phase difference can be expressed as
φ dif t = φ b t φ a t
where φ a t and φ b t represent the peak phase of imaging signal received by LT-1A and LT-1B, respectively. Thus, the residual phase error φ res t after synchronization phase compensation can be calculated by
φ res t = φ ac t φ dif t .
Finally, the synchronization accuracy of the LT-1 system can be evaluated by the standard deviation (STD) of φ res t .

3. Processing Flow

In this section, the phase denoise model is introduced at first. Then the over-complete dictionary training strategy is described in detail. The complete synchronization phase denoising flow is given in the final.

3.1. Phase Denoise Model

Ideally, the phase error caused by the frequency deviation of USOs can be well eliminated by synchronization phase compensation through Equation (7). However, the synchronization signals may suffer from the thermal noise, free space attenuation, multipath effect, radio frequency interference, etc., in the link, and the synchronization phase will be disturbed by the noise.
Consider a given measurement phase Y R N , obtained from the clean phase X R N by contamination of the measurement noise V R N . We assume that the noise V is zero-mean additive Gaussian white noise with a known STD σ , i.e.,
Y = X + V , V N 0 , σ 2 I .
Equation (10) is the synchronization phase degradation model. The phase denoise is its inverse problem, that is, to obtain the approximation X ^ of the unknown original phase X . However this inverse problem is ill-posed, which means the solution does not exist or is not unique. Fortunately, the advent of compressed sensing provides a newly developed theoretical framework for information acquisition and signal processing, which can alleviate the ill-posedness of this kind of problem.
A synchronization phase segment y i = R i Y with a length of n is extracted from the measured phase Y , where R i R n × N is the matrix that extracts the ith phase segment from the measured phase. Define a known over-complete dictionary D R n × k , where k denotes the number of atoms in the dictionary, and k > n . According to the theory of compressed sensing, each segment of the original phase can be represented sparsely by the dictionary D as
α ^ i = arg min α i α i 0 s . t . y i D α i 2 2 ε 2
where · 0 represents the L 0 -norm, which means the number of non-zero elements in the vector. · 2 represents the L 2 -norm of the vector. α ^ i R k is the sparse representation vector for y i with an accuracy of ε . It is a Non-deterministic Polynomial-time (NP) hard problem to obtain such a sparse representation. To solve it directly, all combinations need to be enumerated. According to Reference [38], when the solution is sparse enough, the non-convex optimization problem in Equation (11) can be transformed into a convex L 1 -norm optimization problem as
α ^ i = arg min α i α i 1 s . t . y i D α i 2 2 ε 2 .
The orthogonal matching pursuit (OMP) algorithm and its improved ones are utilized to find the sparse solution of the above problem [42]. When the solution is quite sparse, the OMP algorithm can obtain quite an accurate solution efficiently.
By maximum a posteriori (MAP) estimation, denoising of Y is equivalent to the energy minimization problem as
α ^ i , X ^ = arg min α i , X λ Y X 2 2 + i D α i R i X 2 2 + i μ i α i 0
where the first term demands the proximity between the measured phase Y and its denoised (and unknown) version X . λ represents the weight of the degree of proximity. The greater the λ , the closer the estimated phase to the measured phase will be. The second term demands that each phase segment can be represented up to a bounded error by coefficients α i , with respect to the dictionary D . The last term demands that the coefficients of each phase should be as sparse as possible. μ i is the weight of corresponding synchronization phase segment.
The OMP algorithm gather one atom at a time, and stop when the error y i D α i 2 2 goes below ε 2 or the number of iterations reaches the set sparsity threshold m. Therefore, after obtaining all sparse representations in Equation (12), Equation (13) is transformed into the following optimization problem as
X ^ = arg min X λ Y X 2 2 + i D α i R i X 2 2 .
The objective function above is a typical quadratic term, and its derivative to X can be written as
f X X = 2 λ X Y + 2 i R i T R i X R i T D α i = 2 λ I + i R i T R i X 2 λ Y + i R i T D α i .
So the analytical solution of Equation (14) can be obtained by making Equation (15) equal to 0 , i.e.,
X ^ = λ I + i R i T R i 1 λ Y + i R i T D α i .
As an important parameter of the algorithm, the weight of proximity λ is negatively correlated with the standard deviation of the noise V . The higher the noise level, the lower the λ to reduce the similarity between X ^ and Y for a better denoise effect. According to experience, λ = 0.01 / σ . In fact, the standard deviation σ of the noise is affected by the SNR error, the interpolation error, and the aliasing error. The LT-1 system has a high synchronization frequency, so the interpolation and aliasing errors can be ignored. σ is mainly determined by the SNR error which is given by [21]
1 2 σ 2 = 1 4 f syn SNR f syn / 2 f syn / 2 H syn f H az f 2 d f
where f syn denotes the synchronization frequency. H syn f is the noise spectrum. For additive Gaussian white noise, H syn f = 1 . H az f is the azimuth transfer function depending on the SAR imaging, which can be expressed as [21]
H a z f = sin π T a f π T a f
where T a is synthetic aperture time. SNR can be estimated from the synchronization signal after pulse compression. Therefore, the value of the parameter λ can refer to Equation (17).
After applying CS and MAP estimation, a high-precision synchronization phase can be obtained. The above analysis assumes that the over-complete dictionary D for sparse coding is already known. In the next subsection, the dictionary D will be trained by the K-SVD algorithm, and the training strategy is described in detail.

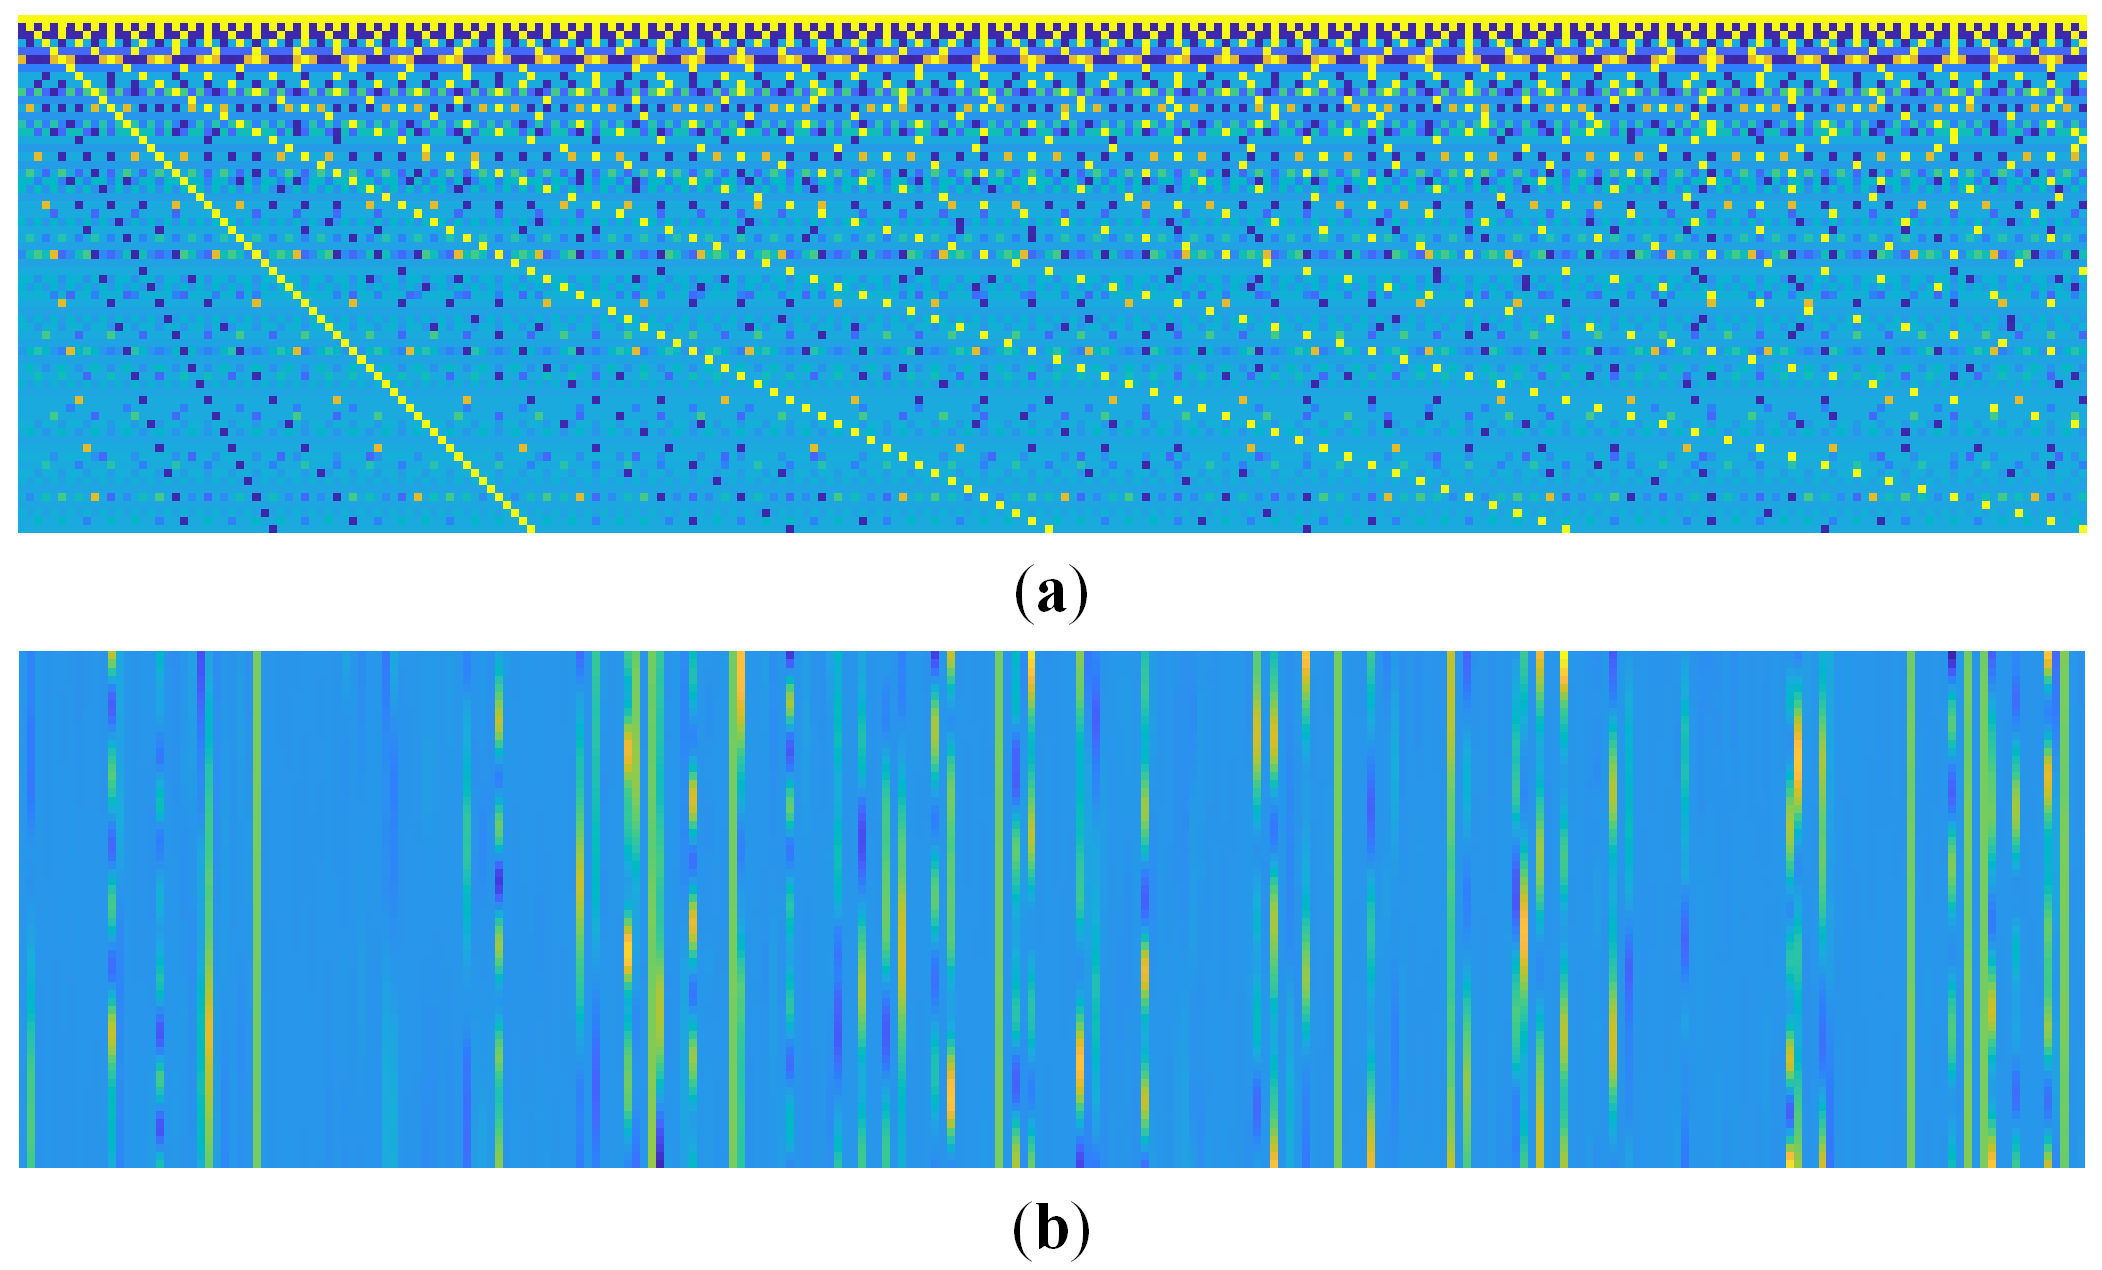
3.2. Dictionary Training

Compressed sensing denoise depends on the over-complete dictionary. Each atom in the dictionary represents a structural prototype in the original phase. Therefore, the phase has a sparse representation in the dictionary, while the noise component does not. According to this principle, the original phase can be distinguished from noise to achieve the purpose of denoising.
In order to ensure that the sparse representation of synchronization phase is sparse enough, the optimal over-complete dictionary is trained according to the characteristics of phase. Considering that the synchronization phase can be decomposed into the linear phase φ l t and the higher-order phase φ h t as
φ t = φ l t + φ h t = 2 π Δ f c t + φ h t
where Δ f c is the frequency deviation of USOs between LT-1A and LT-1B, which can be considered to be constant in a short time. After removing the linear term, the characteristics of synchronization phase are mainly reflected by the higher-order phase φ h t . In order to obtain the characteristic information and eliminate interference item, the higher-order phase φ h t separated by the least square method (LSM) is selected for training instead of the whole phase φ t .
The dictionary should represent the structural prototype of the original phase X as much as possible. However, the clean phase X is unknown. The imaging phase difference φ dif t obtained in the ground validation system is selected to approximate the clean phase. Due to the large time bandwidth product and the ideal transmission medium (optical delay line), the imaging signals exchanged between LT-1A and LT-1B have quite high SNRs. Therefore, such an approximation is reasonable. The higher-order phase of φ dif t is employed for dictionary training.
The K-SVD algorithm with an alternating optimization strategy is utilized for dictionary training [40]. The K-SVD algorithm fixes the current dictionary to solve the sparse coefficients, then updates the dictionary atom by atom. After that, new sparse coefficients are solved based on the new dictionary, and the above cycle is repeated. Finally, the appropriate sparse dictionary is obtained by approximating the local optimal to the global optimal. A proper initialization dictionary contributes to a superior reconstruction effect. The Ramanujan Sums (RS) transform matrix, which is widely used in signal processing, time–frequency analysis, and shape recognition, is selected as the initial basis [43]. Compared with the commonly used discrete cosine transform (DCT) dictionary, it can train effectively and reconstruct the information in a better way. After the training by the K-SVD algorithm, the over-complete dictionary D contains the characteristics of the clean phase, so as to obtain the prior information of the ideal synchronization phase with noise free.
The complete processing flowchart is shown in Figure 4. Since the synchronization frequency is less than PRF, the imaging phase needs to be downsampled to the synchronization frequency through uniform/non-uniform interpolation before dictionary training. After denoising, the synchronization phase should be interpolated to the same length as the imaging phase. Spline interpolation is applied in those processes to keep the phase smooth. In combination with the foregoing, the main steps of the synchronization phase denoising method can be summarized as follows:
Step 1: Extract the imaging phase difference φ dif , synchronization compensation phase φ c , and internal calibration compensation phase φ cal , and estimate the SNR of the synchronization signal.
Step 2: Downsample φ dif and extract its higher-order phase φ dif h by the least square method.
Step 3: Implement the K-SVD algorithm on the phase φ dif h to train the over-complete dictionary D .
Step 4: Separate out the linear phase φ c l and higher-order phase φ c h from the phase φ c , and get sparse coefficients α i of φ c h by the OMP algorithm.
Step 5: Obtain the compensation phase φ ^ c by adding the phase φ ^ c h denoised by Equation (16) and the phase φ c l .
Step 6: Obtain the accurate compensation phase φ ac by compensating the phase φ cal and Doppler compensation phase φ dop to the interpolated phase φ ^ c .

4. Phase Denoise Experiment and Result

In this section, the signals measured in the ground validation system for LT-1 mission are used for experiments and analyses. The performance of the proposed synchronization phase denoising method based on compressive sensing is also evaluated through contrast experiments.

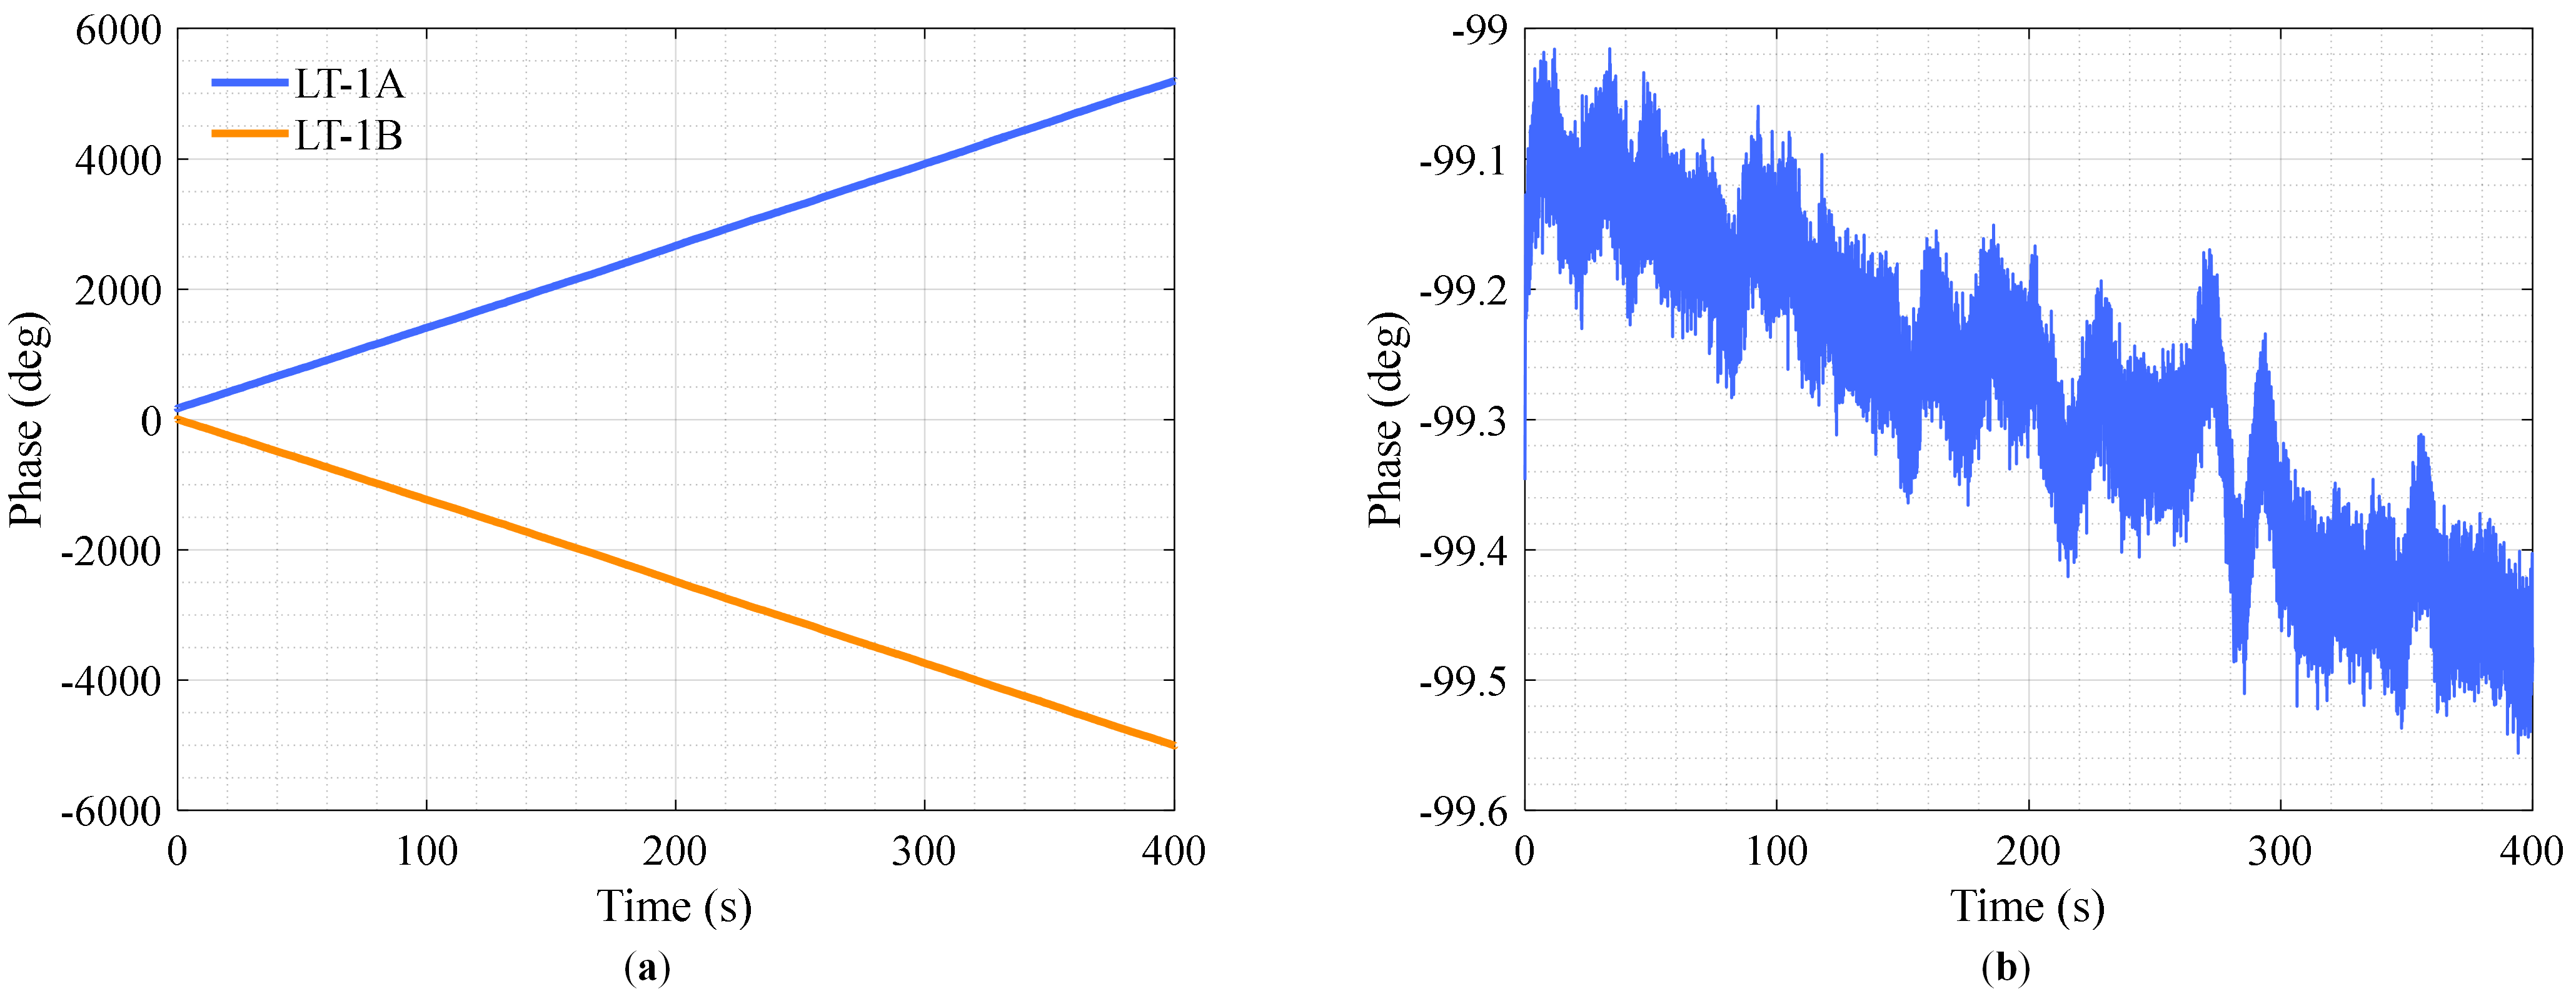
4.1. Data Acquisition and Analysis

The ground validation experiment adopts the system parameters listed in Table 1. The system simulates the exchanging of synchronization signals under different baselines by adjusting the antenna gain, and obtains the synchronization signals under different SNRs. Five groups of data including imaging signals and synchronization signals under 400 s long-time operation are collected in the ground validation experiment, and the phases are extracted after pulse compression according to the parameters in Table 1.
The SNR of each group of imaging signals after pulse compression is basically the same and maintained at a high level (69 dB), and one set of imaging phases is shown in Figure 5. Figure 5a shows the imaging phases of LT-1A and LT-1B. Since the received imaging signal of LT-1A is transmitted by itself, the imaging phase φ a is almost constant. While the received signal of LT-1B is sent by LT-1A, φ b changes versus time. The imaging phase difference between LT-1A and LT-1B is shown in Figure 5b. Figure 5c shows the linear term of the imaging phase difference separated by LSM, which can be expressed as 2 π Δ f c t . According to the fitting result, the frequency difference Δ f c of the two USOs is about −0.03 Hz in this acquisition. Figure 5d shows the higher-order phase. Compared with linear phase, the higher-order term of the imaging phase difference contains richer structures and characteristics. Therefore, it is used as for K-SVD dictionary training to learn sufficient prior information.
The synchronization phases are obtained from the synchronization signals after pulse compression, and the phases corresponding to the imaging phase above are shown in Figure 6a. Since the received synchronization signals come from the other satellite, both φ ab and φ ba changes versus time. The frequency difference between two USOs is relatively stable, so the synchronous phase shows an obvious linear trend. Finally, the synchronization compensation phase φ c can be get by Equation (3). After collecting the signals of all calibration loops, the internal calibration compensation phase that represents the hardware error of the system is shown in the Figure 6b. The range of φ cal is small, it changes less than 0.6° in the acquisition time of 400 s. However, the internal calibration compensation phase also contains linear component and phase characteristics, which can not be ignored in the process of phase synchronization. The satellites remain relatively stationary during ground verification, so the Doppler error phase was not considered in the experiment.
After preliminary compensation by Equation (9), the STD of residual phase error versus SNR is shown in Figure 7, where the SNRs are evaluated from synchronization signals after pulse compression. The synchronization accuracy increases with the rise of SNR. The theoretical value represented by the blue line is obtained from Equation (17). It can be seen that the experimental results are in good agreement with the theoretical analysis within a bounded error. The measured residual phase error is slightly higher than the theoretical value, which may be introduced by other tiny errors in the link. It is verified that Equation (17) can be employed to estimate the STD of the noise, and then for phase denoising.

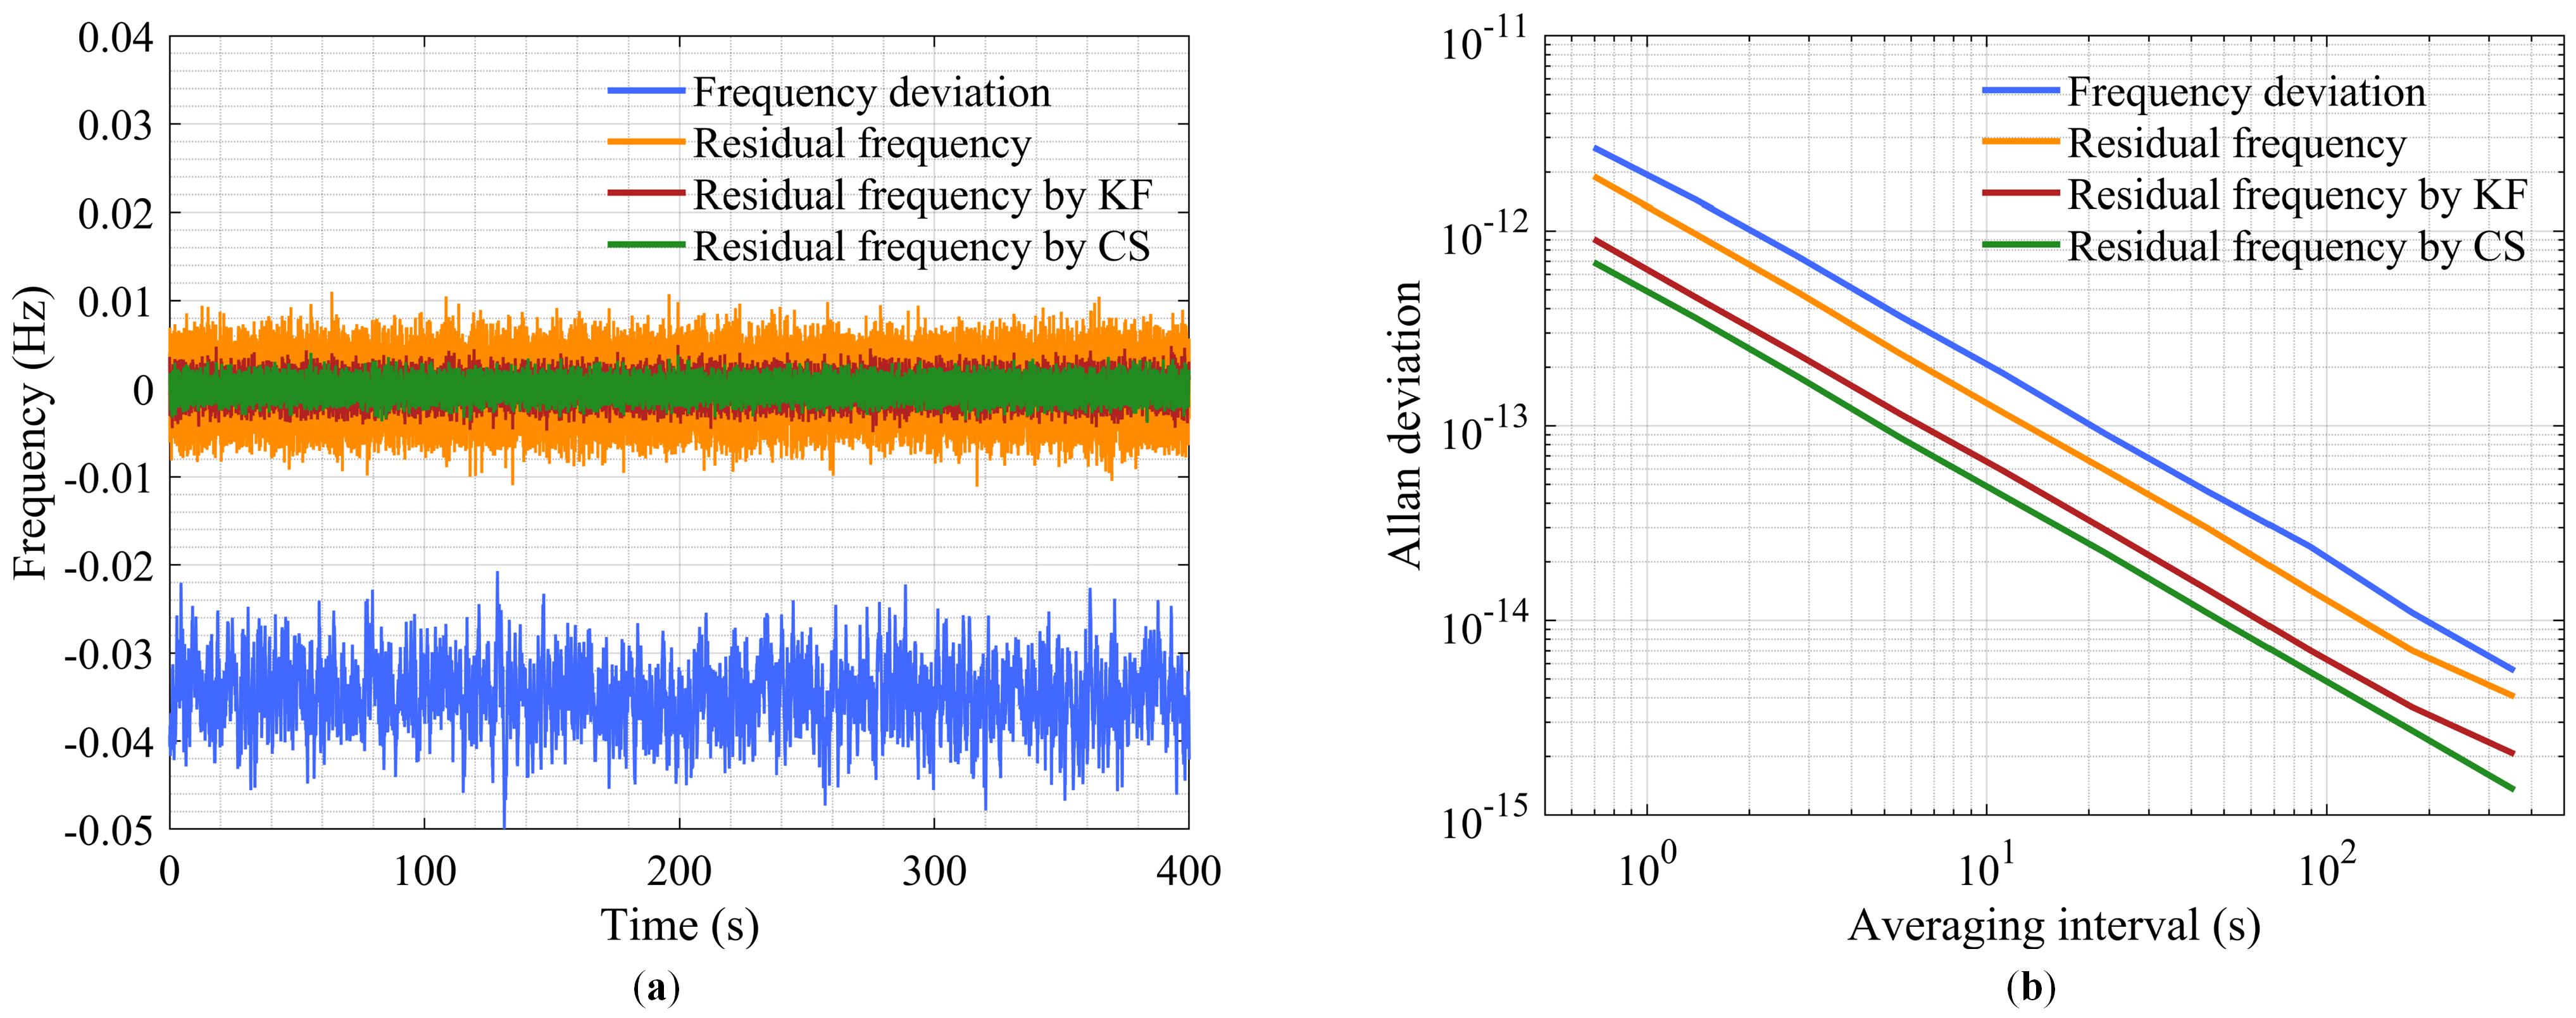
4.2. Result of Synchronization Phase Denoising

During the training of the dictionary, the corresponding parameters are listed in Table 2. A regular overlap is maintained between the phase segments to eliminate the jitter caused by phase splicing. Smaller sparsity threshold and error tolerance can train a better over-complete dictionary, but at the cost of training time. The higher-order term of imaging phase difference is input. The initial RS transform matrix and the trained sparse dictionary are shown in Figure 8. Each phase segment can be represented by a series of atoms in the adaptive learning dictionary. By splicing all phase segments, the original phase can be reconstructed with high precision. Once the dictionary is trained, it can be applied to other synchronization data one the ground or in orbit.
Taking a group of data with the lowest SNR (38 dB) as an example, the synchronization compensation phase after denoising is shown in Figure 9. Kalman filtering is also implemented for comparison [37]. The phase details in Figure 9b show that the denoising results are closer to the imaging phase difference, which indicate that both methods can effectively reduce the noise level of synchronization compensation phase. However, through careful observation, it can be found that the distance from Kalman filtered phase to the imaging phase difference is a little farther than that from the denoised phase by CS to the imaging phase difference. In addition, the Kalman filtered result shifts slightly to the right relative to the imaging phase difference. The reason for this hysteresis phenomenon is that the Kalman filter estimates the state by combining the observed and predicted values, where the predicted values are based on the previous state estimate. Thus, a time delay is inevitable. While the sparse reconstruction is based on the prior information in the dictionary, which is why it can reduce noise as much as possible without introducing time delay.
The residual phases after synchronization compensation in Figure 10 intuitively show the denoising performance. It is obvious that the residual phase of CS method is smaller than that of KF method. The phase statistical histogram of corresponding residual error is shown in the right side. The probability density function (PDF) indicates that the residual phase error conforms to the Gaussian distribution. The STD of residual error before denoising is 0.6163°. After Kalman filtering, STD drops to 0.3015°. The phase denoising method based on CS further reduces the STD to 0.2273°, which verifies its effectiveness.
To verify the effect of phase synchronization and phase denoising on SAR images, azimuth impulse response compression experiments are carried out. The parameters of the LT-1 system and the residual phases in Figure 10 are used for simulation experiments, and the experimental results are shown in Table 3. When the phase error exists, the peak position is shifted due to the influence of the linear phase. The side lobes become asymmetric due to the influence of the higher-order phase. The peak phase error is quite large, which is unacceptable for bistatic interferometry. In addition, the phase error also reduces the peak amplitude. After phase synchronization, the peak position shift is eliminated and the peak phase error is greatly reduced, but the side lobes are still slightly asymmetric and the peak amplitude is attenuated. Finally, all indexes are improved after denoising, and the results of the proposed method are closer to the theoretical values.
In addition, Figure 11a shows the frequency deviation and the residual frequency, which are derived by differentiating the imaging phase difference in Figure 9 and the residual phases in Figure 10, respectively. It can be seen that the frequency deviation between LT-1A and LT-1B is about 0.03 Hz before phase synchronization. After phase compensation, the center of residual frequency is moved to 0 Hz but still occupies a wide range. After phase denoising by CS method, the range of residual frequency is significantly narrowed. Figure 11b shows the Allan deviations of the corresponding frequency in Figure 11a. All the Allan deviations are better than 10 11 in the time interval of interest. It should be noted that white phase noise with a slope of 1 is the dominant noise in Allan deviation rather than the common white frequency noise in oscillators. This is because the phase noise is not directly sampled in the rubidium clock, but measured through the whole synchronization link. The broadband white phase noise is introduced by the devices in the link. Therefore, Figure 11b does not directly represent the frequency stability of the rubidium clock but reflects the accuracy of synchronization compensation. Due to the application of the proposed method, the Allan deviation is further improved and is superior to that of KF method. Thus, the performance of the proposed synchronization phase accuracy improvement method is verified.
The synchronization accuracy under different SNRs are also evaluated and listed in Table 4. In any case, the denoising effect of CS is no less than that of KF. However, similar to KF method, the synchronization accuracy can be significantly improved in the case of low SNR. For example, when the SNR is 38 dB, the accuracy is improved by 63.11%. When SNR is up to 60 dB, it only increases by 1.65%. This is because the noise is already at a low level, in which case the STD of the residual error has been lower than 0.1°. Therefore, when the SNR of synchronization signal is high, it can be considered that the obtained synchronization phase is credible. When the satellite is in the long baseline mode or the transmission channel is not ideal, the proposed method can play a big role in improving synchronization phase accuracy.
In summary, ground experiments verify the effectiveness of the proposed synchronization phase denoising method based on CS, which has the potential to realize high accuracy phase synchronization in the LT-1 system in orbit.

5. Conclusions

The innovative LT-1 mission employs a non-interrupted phase synchronization scheme, which exchanges the synchronization pulse by the time-division mode. Therefore, the advanced synchronization scheme avoids periodic data loss caused by interrupting the normal BiSAR acquisition. More importantly, the maximum synchronization frequency can reach half of PRF for high synchronization accuracy. An advanced denoising approach based on compressive sensing has been presented to improve the accuracy of the synchronization for the LT-1 mission. The phase model of the synchronization scheme and the system design of the LT-1 synchronization module are described in detail. Multiple sets of data acquired from the ground validation system are used to demonstrate the noise reduce performance. The effectiveness of the proposed method is verified by the processing results, which indicates that it has the potential to improve synchronization phase accuracy in future on-orbit applications.

Author Contributions

Conceptualization, Y.C. (Yonghua Cai), R.W. and D.L.; Data curation, K.L. and Y.C. (Yafeng Chen); Formal analysis, K.L. and Y.C. (Yafeng Chen); Funding acquisition, R.W.; Investigation, H.Z.; Methodology, Y.C. (Yonghua Cai), R.W. and W.Y.; Project administration, R.W. and W.Y.; Resources, Y.C. (Yafeng Chen); Software, Y.C. (Yonghua Cai) and D.L.; Validation, Y.C. (Yonghua Cai) and H.Z.; Visualization, Y.C. (Yonghua Cai); Writing—original draft, Y.C. (Yonghua Cai); Writing—review & editing, Y.C. (Yonghua Cai), R.W. and D.L. All authors have read and agreed to the published version of the manuscript.

Funding

This research was funded in part by the National Science Fund for Distinguished Young Scholars under grant number 61825106 and in part by the Medium- and Long-Term Development Plan for China’s Civil Space Infrastructure, LuTan-1.

Data Availability Statement

Not applicable.

Conflicts of Interest

The authors declare no conflict of interest.

References

  1. Soumekh, M. Bistatic synthetic aperture radar inversion with application in dynamic object imaging. IEEE Trans. Signal Process. 1991, 39, 2044–2055. [Google Scholar] [CrossRef]
  2. D’Errico, M. Distributed Space Missions for Earth System Monitoring; Springer Science & Business Media: New York, NY, USA, 2012; Volume 31. [Google Scholar]
  3. Wang, R.; Deng, Y. Bistatic SAR System and Signal Processing Technology; Springer: Singapore, 2018. [Google Scholar]
  4. Moreira, A.; Krieger, G.; Hajnsek, I.; Hounam, D.; Werner, M.; Riegger, S.; Settelmeyer, E. TanDEM-X: A TerraSAR-X add-on satellite for single-pass SAR interferometry. In Proceedings of the IGARSS 2004, 2004 IEEE International Geoscience and Remote Sensing Symposium, Anchorage, AK, USA, 20–24 September 2004; Volume 2, pp. 1000–1003. [Google Scholar] [CrossRef]
  5. Rizzoli, P.; Martone, M.; Gonzalez, C.; Wecklich, C.; Tridon, D.B.; Bräutigam, B.; Bachmann, M.; Schulze, D.; Fritz, T.; Huber, M.; et al. Generation and performance assessment of the global TanDEM-X digital elevation model. ISPRS J. Photogramm. Remote Sens. 2017, 132, 119–139. [Google Scholar] [CrossRef]
  6. Krieger, G.; Moreira, A. Multistatic sar satellite formations: Potentials and challenges. In Proceedings of the 2005 IEEE International Geoscience and Remote Sensing Symposium, IGARSS ’05, Seoul, Korea, 29–29 July 2005; Volume 4, pp. 2680–2684. [Google Scholar] [CrossRef]
  7. Gebert, N.; Carnicero Dominguez, B.; Davidson, M.W.J.; Diaz Martin, M.; Silvestrin, P. SAOCOM-CS—A passive companion to SAOCOM for single-pass L-band SAR interferometry. In Proceedings of the EUSAR 2014: 10th European Conference on Synthetic Aperture Radar, Berlin, Germany, 3–5 June 2014; pp. 1–4. [Google Scholar]
  8. Huber, S.; Villano, M.; Younis, M.; Krieger, G.; Moreira, A.; Grafmueller, B.; Wolters, R. Tandem-L: Design concepts for a next-generation spaceborne SAR system. In Proceedings of the EUSAR 2016: 11th European Conference on Synthetic Aperture Radar, Hamburg, Germany, 6–9 June 2016; pp. 1–5. [Google Scholar]
  9. Jin, G.; Liu, K.; Liu, D.; Liang, D.; Zhang, H.; Ou, N.; Zhang, Y.; Deng, Y.; Li, C.; Wang, R. An Advanced Phase Synchronization Scheme for LT-1. IEEE Trans. Geosci. Remote Sens. 2020, 58, 1735–1746. [Google Scholar] [CrossRef]
  10. Krieger, G.; Zonno, M.; Rodriguez-Cassola, M.; Lopez-Dekker, P.; Mittermayer, J.; Younis, M.; Huber, S.; Villano, M.; de Almeida, F.Q.; Prats-Iraola, P.; et al. MirrorSAR: A fractionated space radar for bistatic, multistatic and high-resolution wide-swath SAR imaging. In Proceedings of the 2017 IEEE International Geoscience and Remote Sensing Symposium (IGARSS), Fort Worth, TX, USA, 23–28 July 2017; pp. 149–152. [Google Scholar] [CrossRef]
  11. Rott, H.; López-Dekker, P.; Solberg, S.; Ulander, L.; Nagler, T.; Krieger, G.; Prats, P.; Rodriguez, M.; Zonno, M.; Moreira, A. SESAME: A single-pass interferometric SEntinel-1 companion SAR mission for monitoring GEO-and biosphere dynamics. In Proceedings of the 2017 IEEE International Geoscience and Remote Sensing Symposium (IGARSS), Fort Worth, TX, USA, 23–28 July 2017; pp. 107–110. [Google Scholar]
  12. Janoth, J.; Jochum, M.; Petrat, L.; Knigge, T. High Resolution wide Swath—The Next Generation X-Band Mission. In Proceedings of the IGARSS 2019—2019 IEEE International Geoscience and Remote Sensing Symposium, Yokohama, Japan, 28 July–2 August 2019; pp. 3535–3537. [Google Scholar] [CrossRef]
  13. López-Dekker, P.; Rott, H.; Prats-Iraola, P.; Chapron, B.; Scipal, K.; Witte, E.D. Harmony: An Earth Explorer 10 Mission Candidate to Observe Land, Ice, and Ocean Surface Dynamics. In Proceedings of the IGARSS 2019—2019 IEEE International Geoscience and Remote Sensing Symposium, Yokohama, Japan, 28 July–2 August 2019; pp. 8381–8384. [Google Scholar] [CrossRef]
  14. Jin, G.; Liu, K.; Deng, Y.; Sha, Y.; Wang, R.; Liu, D.; Wang, W.; Long, Y.; Zhang, Y. Nonlinear Frequency Modulation Signal Generator in LT-1. IEEE Geosci. Remote Sens. Lett. 2019, 16, 1570–1574. [Google Scholar] [CrossRef]
  15. Liang, D.; Liu, K.; Zhang, H.; Chen, Y.; Yue, H.; Liu, D.; Deng, Y.; Lin, H.; Fang, T.; Li, C.; et al. The Processing Framework and Experimental Verification for the Noninterrupted Synchronization Scheme of LuTan-1. IEEE Trans. Geosci. Remote Sens. 2021, 59, 5740–5750. [Google Scholar] [CrossRef]
  16. Lin, H.; Deng, Y.; Zhang, H.; Liu, D.; Liang, D.; Fang, T.; Wang, R. On the Processing of Dual-Channel Receiving Signals of the LuTan-1 SAR System. Remote Sens. 2022, 14, 515. [Google Scholar] [CrossRef]
  17. Cai, Y.; Deng, Y.; Zhang, H.; Wang, R.; Wu, Y.; Cheng, S. An Image-Domain Least L1-Norm Method for Channel Error Effect Analysis and Calibration of Azimuth Multi-Channel SAR. IEEE Trans. Geosci. Remote Sens. 2022, 60, 1–14. [Google Scholar] [CrossRef]
  18. Jin, G.; Deng, Y.; Wang, R.; Wang, W.; Wang, P.; Long, Y.; Zhang, Z.M.; Zhang, Y. An advanced nonlinear frequency modulation waveform for radar imaging with low sidelobe. IEEE Trans. Geosci. Remote Sens. 2019, 57, 6155–6168. [Google Scholar] [CrossRef]
  19. Krieger, G.; Moreira, A. Spaceborne bi-and multistatic SAR: Potential and challenges. IEE Proc.-Radar Sonar Navig. 2006, 153, 184–198. [Google Scholar] [CrossRef]
  20. Lopez-Dekker, P.; Mallorqui, J.J.; Serra-Morales, P.; Sanz-Marcos, J. Phase and temporal synchronization in bistatic SAR systems using sources of opportunity. In Proceedings of the 2007 IEEE International Geoscience and Remote Sensing Symposium, Barcelona, Spain, 23–28 July 2007; pp. 97–100. [Google Scholar] [CrossRef]
  21. Younis, M.; Metzig, R.; Krieger, G. Performance prediction of a phase synchronization link for bistatic SAR. IEEE Geosci. Remote Sens. Lett. 2006, 3, 429–433. [Google Scholar] [CrossRef]
  22. López-Dekker, P.; Mallorqui, J.J.; Serra-Morales, P.; Sanz-Marcos, J. Phase synchronization and Doppler centroid estimation in fixed receiver bistatic SAR systems. IEEE Trans. Geosci. Remote Sens. 2008, 46, 3459–3471. [Google Scholar] [CrossRef]
  23. Krieger, G. Advanced bistatic and multistatic SAR concepts and applications. In Proceedings of the European Conference on Synthetic Aperture Radar (EUSAR), Dresden, Germany, 16–18 May 2006; pp. 1–101. [Google Scholar]
  24. Liang, D.; Zhang, H.; Cai, Y.; Liu, K.; Zhang, K. An Advanced Phase Synchronization Scheme Based on Coherent Integration and Waveform Diversity for Bistatic SAR. Remote Sens. 2021, 13, 981. [Google Scholar] [CrossRef]
  25. Oelker, E.; Hutson, R.; Kennedy, C.; Sonderhouse, L.; Bothwell, T.; Goban, A.; Kedar, D.; Sanner, C.; Robinson, J.; Marti, G.; et al. Demonstration of 4.8 × 10⁻¹⁷ stability at 1 s for two independent optical clocks. Nat. Photonics 2019, 13, 714–719. [Google Scholar] [CrossRef]
  26. Zhang, H.; Deng, Y.; Wang, R.; Li, N.; Zhao, S.; Hong, F.; Wu, L.; Loffeld, O. Spaceborne/stationary bistatic SAR imaging with TerraSAR-X as an illuminator in staring-spotlight mode. IEEE Trans. Geosci. Remote Sens. 2016, 54, 5203–5216. [Google Scholar] [CrossRef]
  27. Rodriguez-Cassola, M.; Prats-Iraola, P.; Lopez-Dekker, P.; Reigber, A.; Krieger, G.; Moreira, A. Autonomous time and phase calibration of spaceborne bistatic SAR systems. In Proceedings of the EUSAR 2014: 10th European Conference on Synthetic Aperture Radar, Berlin, Germany, 3–5 June 2014; pp. 1–4. [Google Scholar]
  28. Weib, M. Synchronisation of bistatic radar systems. In Proceedings of the IGARSS 2004, 2004 IEEE International Geoscience and Remote Sensing Symposium, Anchorage, AK, USA, 20–24 September 2004; Volume 3, pp. 1750–1753. [Google Scholar]
  29. Zhang, Y.; Wang, R. An Innovative Push-To-Talk (PTT) Synchronization Scheme for Future Distributed SAR. In Proceedings of the 2021 IEEE International Geoscience and Remote Sensing Symposium IGARSS, Brussels, Belgium, 11–16 July 2021; pp. 8692–8695. [Google Scholar] [CrossRef]
  30. Zhang, Y.; Chang, S.; Wang, R.; Deng, Y. An Innovative Push-To-Talk (PTT) Synchronization Scheme for Distributed SAR. IEEE Trans. Geosci. Remote Sens. 2021, 60, 1–13. [Google Scholar]
  31. Younis, M.; Metzig, R.; Krieger, G.; Bachmann, M.; Klein, R. Performance prediction and verification for the synchronization link of TanDEM-X. In Proceedings of the 2007 IEEE International Geoscience and Remote Sensing Symposium, Barcelona, Spain, 23–28 July 2007; pp. 5206–5209. [Google Scholar]
  32. Weigt, M.; Grigorov, C.; Steinbrecher, U.; Schulze, D. Tandem-x mission: Long term in orbit synchronisation link performance analysis. In Proceedings of the EUSAR 2014: 10th European Conference on Synthetic Aperture Radar, Berlin, Germany, 3–5 June 2014; pp. 1–4. [Google Scholar]
  33. Pinheiro, M.; Rodriguez-Cassola, M.; Prats-Iraola, P.; Reigber, A.; Krieger, G.; Moreira, A. Reconstruction of Coherent Pairs of Synthetic Aperture Radar Data Acquired in Interrupted Mode. IEEE Trans. Geosci. Remote Sens. 2015, 53, 1876–1893. [Google Scholar] [CrossRef]
  34. Liang, D.; Liu, K.; Yue, H.; Chen, Y.; Deng, Y.; Zhang, H.; Li, C.; Jin, G.; Wang, R. An Advanced Non-Interrupted Synchronization Scheme for Bistatic Synthetic Aperture Radar. In Proceedings of the IGARSS 2019—2019 IEEE International Geoscience and Remote Sensing Symposium, Yokohama, Japan, 28 July–2 August 2019; pp. 1116–1119. [Google Scholar] [CrossRef]
  35. Liang, D.; Liua, K.; Zhang, H.; Liu, D.; Wang, R. An advanced non-interrupted phase synchronization scheme with internal calibration for LuTan-1. In Proceedings of the EUSAR 2021: 13th European Conference on Synthetic Aperture Radar, Online, 29 March–1 April 2021; pp. 1–5. [Google Scholar]
  36. Zhang, Y.; Zhang, H.; Ou, N.; Liu, K.; Liang, D.; Deng, Y.; Wang, R. First Demonstration of Multipath Effects on Phase Synchronization Scheme for LT-1. IEEE Trans. Geosci. Remote Sens. 2020, 58, 2590–2604. [Google Scholar] [CrossRef]
  37. Liang, D.; Liu, K.; Zhang, H.; Deng, Y.; Liu, D.; Chen, Y.; Li, C.; Yue, H.; Wang, R. A high-accuracy synchronization phase-compensation method based on Kalman filter for bistatic synthetic aperture radar. IEEE Geosci. Remote Sens. Lett. 2019, 17, 1722–1726. [Google Scholar] [CrossRef]
  38. Foucart, S.; Rauhut, H. An invitation to compressive sensing. In A Mathematical Introduction to Compressive Sensing; Springer: New York, NY, USA, 2013; pp. 1–39. [Google Scholar]
  39. Elad, M.; Aharon, M. Image denoising via sparse and redundant representations over learned dictionaries. IEEE Trans. Image Process. 2006, 15, 3736–3745. [Google Scholar] [CrossRef]
  40. Aharon, M.; Elad, M.; Bruckstein, A. K-SVD: An algorithm for designing overcomplete dictionaries for sparse representation. IEEE Trans. Signal Process. 2006, 54, 4311–4322. [Google Scholar] [CrossRef]
  41. Krieger, G.; Younis, M. Impact of oscillator noise in bistatic and multistatic SAR. IEEE Geosci. Remote Sens. Lett. 2006, 3, 424–428. [Google Scholar] [CrossRef]
  42. Tropp, J.A.; Gilbert, A.C. Signal recovery from random measurements via orthogonal matching pursuit. IEEE Trans. Inf. Theory 2007, 53, 4655–4666. [Google Scholar] [CrossRef]
  43. Chen, G.; Krishnan, S.; Bui, T.D. Matrix-based Ramanujan-sums transforms. IEEE Signal Process Lett. 2013, 20, 941–944. [Google Scholar] [CrossRef] [Green Version]
Figure 1. Timing diagram of synchronization pulse exchange.
Remotesensing 14 04621 g001
Figure 2. Quadrifilar helix antenna equipped in LT-1 [34].
Remotesensing 14 04621 g002
Figure 3. Structure block diagram the LT-1 system.
Remotesensing 14 04621 g003
Figure 4. Flowchart of the proposed algorithm.
Remotesensing 14 04621 g004
Figure 5. Imaging phase. (a) Imaging phase of LT-1A φ a and LT-1B φ b . (b) Imaging phase difference φ dif between φ a and φ b . (c) Linear term φ dif l of φ dif . (d) Higher-order term φ dif h of φ dif .
Remotesensing 14 04621 g005
Figure 6. (a) Synchronization phase of LT-1A φ ba and LT-1B φ ab . (b) Internal calibration compensation phase φ cal .
Remotesensing 14 04621 g006
Figure 7. STD of residual phase error versus SNR of synchronization signal.
Remotesensing 14 04621 g007
Figure 8. Matrix of the dictionary. (a) RS transform matrix. (b) Trained sparse dictionary.
Remotesensing 14 04621 g008
Figure 9. Result of phase denoising. (a) Synchronization phases (the phases are shifted for clear display). (b) Local zooming of synchronization phases.
Remotesensing 14 04621 g009
Figure 10. Residual phases. (a) Residual phase before denoising. (b) Statistical histogram of (a). (c) Residual phase after denoising by KF. (d) Statistical histogram of (c). (e) Residual phase after denoising by CS. (f) Statistical histogram of (e).
Remotesensing 14 04621 g010
Figure 11. Residual frequency and Allan deviations. (a) Frequency deviation and the residual frequency are derived by differentiating the imaging phase difference in Figure 9 and the residual phases in Figure 10, respectively. (b) Allan deviations of (a).
Remotesensing 14 04621 g011
Table 1. System parameters of ground validation system.
ParameterSymbolValue
Carrier frequency f c 1.26 GHz
Pulse repetition frequency PRF 1723.05 Hz
Imaging signal pulse duration T r 80 μ s
Imaging signal bandwidth B r 150 MHz
Sync. frequency f syn 143.59 Hz
Sync. signal pulse duration T syn 10 μ s
Sync. signal bandwidth B syn 150 MHz
Acquisition duration t dur 400 s
Table 2. Parameters of K-SVD Dictionary Training.
ParameterSymbolValue
Phase segment lengthn64
Phase segment overlap rater50%
Number of the atomsk256
Sparsity thresholdm4
Error tolerance ε 0.1°
Table 3. Parameters of the response after azimuth compression.
ParameterTheoreticalWith Phase ErrorBefore DenoisingDenoising by KFDenoising by CS
IRW4.90 m4.90 m4.90 m4.90 m4.90 m
PSLR (L)−13.26 dB−13.33 dB−13.25 dB−13.25 dB−13.26 dB
PSLR (R)−13.26 dB−13.19 dB−13.27 dB−13.27 dB−13.26 dB
ISLR−10.07 dB−10.07 dB−10.07 dB−10.07 dB−10.07 dB
Peak amplitude1.00000.98610.99991.00001.0000
Peak position0.0000 m0.5441 m0.0000 m0.0000 m0.0000 m
Peak phase0.0000°−87.2629°−0.2182°−0.2176°−0.1964°
Table 4. Synchronization Accuracy.
SNR (dB)Before DenoisingDenoising by KFDenoising by CS
380.6163°0.3015°0.2273°
460.2172°0.1569°0.1287°
550.0984°0.0903°0.0851°
580.0875°0.0862°0.0861°
600.0783°0.0774°0.0774°
Publisher’s Note: MDPI stays neutral with regard to jurisdictional claims in published maps and institutional affiliations.

