Abstract
Forest structure and composition have changed rapidly worldwide, presenting tendencies towards an increasing proportion of younger trees. From chronologies of tree-ring indices (TRI) and the reconstruction of the basal area increment (BAI), a dendroecological study was conducted from the perspective of the radial growth of twelve contemporary conifer species in a highly diverse region of the planet. From an elevational perspective, the TRI were associated with climate and the NDVI, while the BAI was also modeled as a potential proxy for forest productivity. Climate affects the species differently according to elevation: at 1900 m asl, Pinus caribaea, P. oocarpa and P. jeffreyi presented the lowest sensitivities to climate and drought. For their part, species occupying the intermediate part of the gradient (1901–3000 m asl), such as P. engelmannii, P. patula, P. johannis and P. maximartinezii, were very sensitive to maximum temperature (TMax), precipitation (PP) and drought during the winter–spring period. Finally, of the species distributed on the upper part of the gradient (>3000 m asl), only Abies religiosa was associated with TMax and drought; Juniperus deppeana, A. hickelii and P. hartwegii did not seem to be vulnerable to drought. Complementarily, we found significant differences in the BAI as a function of elevation, with the sites at 1001–1500 m asl presenting higher BAI. The results suggest that the growth in these forests is impacted by droughts and follows a distinct spatial pattern, with greater restriction found in mid-elevation forests. Consistent implications are also observed in BAI trends. For its part, the NDVI demonstrated a decreasing tendency in greenness from south to north, although no elevation pattern was evident. The combined proxies utilized here produced parameters that improve our understanding of forest growth and should be considered in vegetation dynamics models in order to reduce their uncertainty in the face of climate vulnerability. These forests must be sustainably managed, and it is therefore crucial to determine the influence of ecological variables on their growth.
1. Introduction
Forest ecosystems of the world are considered the main sinks of terrestrial carbon, and their goods and services supply human development at local to international scales [1]. However, these biomes present a constant dynamic of change because of their physical configuration and regimes of disturbance [2].
Intensive forest harvesting, selective logging and deforestation, among other anthropogenic factors [3,4], have rapidly produced a configuration that differs in structure and composition from that of mature to young forests [5]. In parallel, the increased severity and intensity of droughts caused by climate change have translated into increased rates of decline and mortality in various forest species worldwide [6].
Consequently, these forests experience transformations in their ecological conditions that have been the focus of research by the scientific community in the face of predicted climatic change [7,8,9]. In particular, tree growth is a component associated with forest productivity that in turn represents a key component in the terrestrial carbon cycle. Interactions with the climate have thus gained the increasing attention of ecologists [10,11,12]. It has been documented that contemporary forest ecosystems present higher growth rates over short temporal and spatial ranges that differ substantially from those of mature forests [13]. Although various studies have reported the responses of these forests to tree growth proxies [14,15,16], our knowledge of these response variables remains to be refined. Although tree growth rates depend on an extensive list of environmental variables, the scientific community agrees that tree growth rings represent a reliable source of proxies [17,18,19].
In the first instance, through chronologies of tree-ring widths, climate–tree relationships have evidenced differing responses as a function of the age and structure of the forest [20,21], showing that young forests present different adaptations to climatic vulnerability [16]. Another proxy is basal area increment, which some authors document as an indicator of productivity that can vary among species and along spatial gradients [22]. Likewise, when remote sensing is associated with dendrochronology, the ecological mechanisms that underlie forest growth can be elucidated [23,24,25]. One of the most utilized indices is the normalized difference vegetation index (NDVI) [26,27], yet this requires further research, particularly considering the availability of automated monitoring platforms that operate in near real-time (see Google Earth Engine) [28]. In this way, the convergence of discrete variables from tree rings [10] and continuous variables from NDVI [29] exponentially increase the capacity of the results in terms of the assessment of the timing and rates of forest growth. Under the premise that wood production is related to foliage activity, tree rings linked with time series of vegetation indices, such as the NDVI, have been useful for investigating changes in tree growth and forest productivity [30]. Thus, NDVI is a proxy of canopy cover that could be associated with tree rings in young forests, where it has been scarcely addressed [31].
Furthermore, in the last 20 years, Mexico has been prominent as a country with great dendroecological potential [32]. However, use has mainly been made of tree rings of wide temporal scale, selectively sampling long-lived trees growing in marginal conditions [33,34]. These forests are distinguished by wide altitudinal, climatic, topographical, and latitudinal gradients that host a great concentration of species. For their part, conifers grow from sea level to over 4000 m asl in elevation. Of the six families of conifers recognized worldwide, four are represented in Mexico. Of the 670 species of conifers in the world, 94 (14%) have a natural distribution in Mexico, and 43 are endemic, with abundant species of Pinus, Juniperus, and Abies [35]. Many of these conifers provide high volume and value to the Mexican timber industry, strengthening the economic system of the country. However, these forests are also very valuable in ecological terms because they provide ecosystem services for communities. For instance, they are significant sinks for atmospheric CO2 and constitute a source of hydric resources for human and agricultural uses [33,36].
Elevational gradients have been reported as strategic sites to assess climate-tree growth relationships, including vegetation activity, since temperature and precipitation vary along topographic gradients, as make the tree responses [37]. The prediction of forest dynamics under climate change is facilitated by understanding tree growth changes related to spatial gradients, including the spectral reflectance of tree canopies. Foliar activity depends on nutrients and photosynthetic capacities, which in turn regulate net primary productivity in forests [37].
The conjunction of a high diversity of species along Mexican ecological gradients, where the solar radiation, soil moisture, water availability, and microclimatic conditions are highly variable, offers a natural laboratory to explore the relationships between tree rings and the proxies of forest growth. Spatial parameters influence the ecology of forest ecosystems, but they remain relatively unaddressed. Taking advantage of these characteristics, and with a perspective of elevational gradients, the research questions addressed here were: (i) Is there an elevational trend in the climate response of a network of TRI chronologies of young Mexican conifers? (ii) Does BAI, as an indicator of forest growth follow an elevational pattern? and (iii) Is there a spatial relationship between chronologies and NDVI? For this purpose, we built chronologies of TRI and BAI for different young species and related them to climate and NDVI. We hypothesized that the studied species would have a spatial tendency of accentuated climatic modulation according to their elevation range. This analysis serves to improve our knowledge of the dynamic of forest growth of young trees.
2. Materials and Methods
2.1. Study Site, Study Species and Sample Collection
A total of 12 study sites were selected along an elevational gradient from 138 to 3504 m asl (Figure 1). These sites were representative of six of the ecoregions of Mexico (Figure A1). The sites were divided into three elevation classes, and samples were taken from four species per class (Table 1):
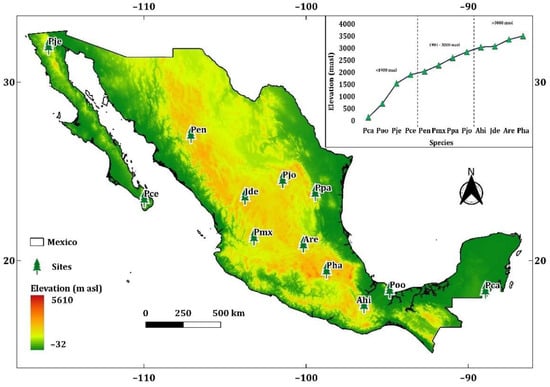
Figure 1.
Location of sampling sites of: Pinus caribaea var. hondurensis Barret & Golfari (Pca); Pinus oocarpa Schiede ex Schltdl. (Poo); Pinus jeffreyi Grev. & Balf. (Pje); Pinus cembroides subsp. lagunae (Rob. Pass.) D.K. Bailey (Pce); Pinus engelmannii Carr. (Pen); Pinus maximartinezii Rzedowski (Pmx); Pinus patula Schltdl. et Cham. (Ppa). Pinus johannis M.-F. Robert-Passini (Pjo); Abies hickelii Flous & Gaussen (Ahi); Juniperus deppeana Steud. (Jde); Abies religiosa Kunth Schltdl. et Cham. (Are); and Pinus hartwegii Lindl. (Pha). Ramp color depicts elevation range in m asl.

Table 1.
Dendrochronological statistics per species and characteristics of the sites.
Low elevation sites (<1900 m asl): Pinus jeffreyi Grev. & Balf. (Pje). Ecoregion: Mediterranean California. Trees of this species can reach up to 50 m in height and 1.5 m in diameter at breast height (DBH) and can establish in a wide elevational range from 50 to 3050 m asl. The species is tolerant of low temperatures in winter and can grow in shallow soils or even crevices in bare granite rock. Pinus cembroides subsp. lagunae (Rob. Pass.) D.K. Bailey (Pce). Ecoregion II: Sierra and Plains of El Cabo. This species is endemic to the Sierra de la Laguna, in Baja California Sur, and presents trees with height between 20 and 25 m. The species is subject to special protection, but it has been exploited for local use. Pinus caribaea var. hondurensis Barret & Golfari (Pca). Ecoregion II: Plain and Hills of the Yucatan Peninsula. Trees of this species can be 20–35 m in height, with trunks reaching a maximum diameter of 100 cm. The species inhabits acidic, well drained, sandy or gravel soils, at elevations below 500 m asl. Pinus oocarpa Schiede ex Schltdl. (Poo). Ecoregion II: Sierra Los Tuxtlas. Trees of this species can reach 30–35 m in height and up to 1.3 m in diameter. The species develops within an elevational range of 200–2700 m asl on eroded, shallow, sandy, well-drained soils of low fertility, derived from volcanic parent material.
Intermediate elevation sites (1901–3000 m asl): Pinus engelmannii Carr. (Pen). Ecoregion II: Western Sierra Madre. Trees of this species reach 20–27 m in height and 0.7–0.9 m in diameter at breast height. The species establishes at elevations of 1200–3000 m asl on poor, rocky (volcanic) soils as well as on alluvial coarse sand/gravel or loamy sand. Pinus patula Schltdl. et Cham. (Ppa). Ecoregion II: Eastern Sierra Madre. Trees of this species reach 35–40 m in height and 1 m in diameter, growing at elevations of 1500–3000 m asl in zones of abundant precipitation of 1000–2200 mm per year. Pinus maximartinezii Rzedowski (Pmx). Ecoregion II: Western Sierra Madre. Trees of this species reach 5–15 m in height and 40–50 cm in diameter, growing in rocky soils of igneous origin, in the elevation range of 1750–2400 m asl. Pinus johannis M.-F. Robert-Passini (Pjo). Ecoregion II: Warm Deserts. This species presents shrubs of 2–12 m in height and 10–80 cm in DBH. It is found at elevations of 2400–2800 m asl in very shallow soils, limited by rock or lithosols, and is endemic to Mexico.
High elevation sites (>3000 m asl): Pinus hartwegii Lindl. (Pha). Ecoregion: Transversal Neovolcanic System. Trees of this species reach 25–30 m in height. Its populations are located at elevations of 2400–4282 m asl. The soils are from both volcanic and granitic rock, of various depths but are often poor in nutrients. Abies hickelii Flous & Gaussen (Ahi). Ecoregion II: Southern Sierra Madre. Trees of this species reach 20–30 m in height and 1–1.3 m in diameter. It is found in the high mountains of the subtropical south of Mexico, at elevations of 2500–3400 m asl in soils of volcanic origin. Abies religiosa Kunth Schltdl. et Cham. (Are). Ecoregion II: Western Sierra Madre. Trees of this species reach 35–40 m in height and up to 1.80 m in diameter. It is distributed along an elevational gradient of 2400–3500 m, on slightly acidic soils of volcanic origin with a high content of organic material. Juniperus deppeana Steud. (Jde). Ecoregion II: Western Sierra Madre Piedmont. Trees of this species reach 3–10 m (or up to 20 m) in height and 20–50 cm in diameter. It develops in subhumid temperate zones, at elevations of 750–2750 m asl in sandy soils, on limestone or volcanic deposits or on other types of rock.
These are important timber species in Mexico, apart from P. maximartinezii, which is considered threatened [38]. To the best of our knowledge, seven of the twelve species have never been sampled for dendrochronological studies in Mexico: P. caribaea, P. oocarpa, P. patula, P. maximartinezii, P. johannis, A. hickelii and J. deppeana.
All of the sites corresponded to young stands in which the predominant species in each site comprised at least 70% of its basal area. From a randomly chosen central tree within the stand (DBH > 15 cm), we selected the 19 trees closest to the central tree. Using a 5-mm Pressler increment borer at breast height, we obtained at least two cores of 5 mm in diameter for each of these 20 trees. This strategy was adopted to achieve greater representativeness of the population [31].
2.2. Dendrochronological Processing
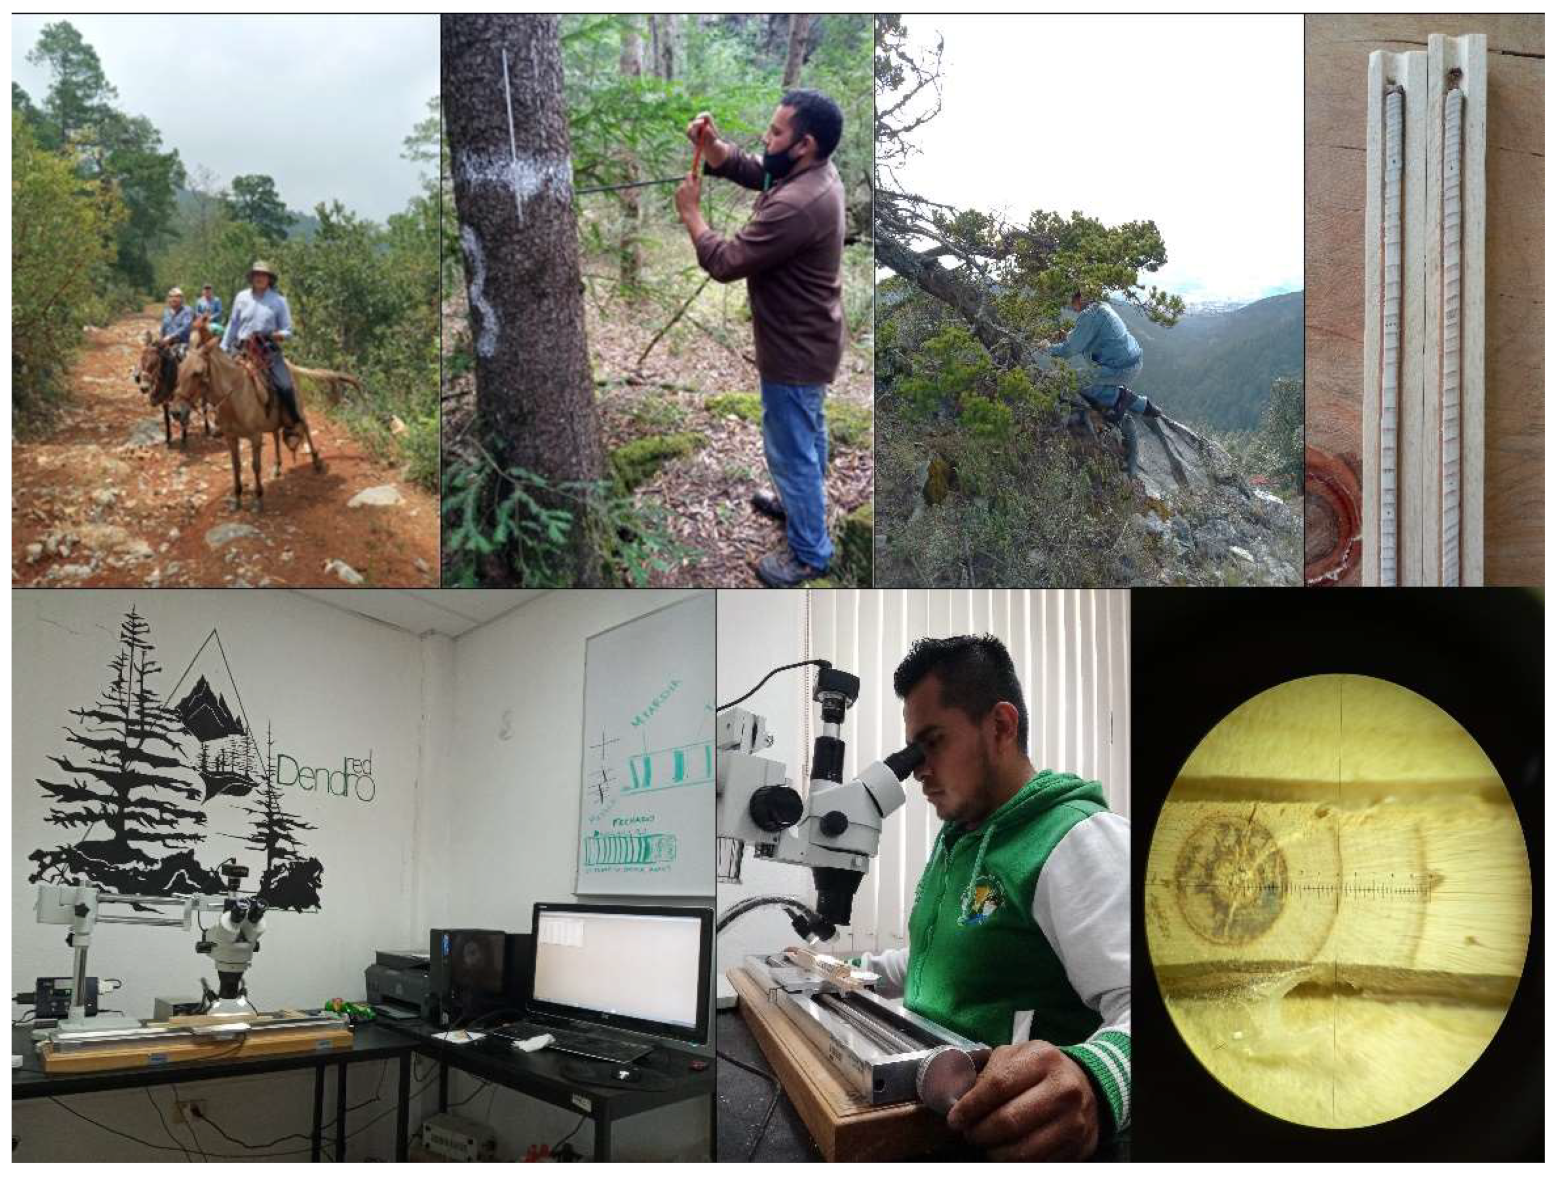
Tree-ring cores were mounted on wooden frames with polyvinyl acetate glue. The samples were polished using progressively coarse to fine sandpaper to facilitate the subsequent observation and measurement of the tree rings. Tree-ring cores of different individuals of the same species and zone were synchronized through the identification of characteristic sequences of radial growth. Tree-ring width (TRW) was measured using the VELMEX ultra-precision (0.001 microns) system (VELMEX Inc. 2016, Bloomfield, NY, USA, Figure 2). Once these measurements were completed, dating was reviewed using the program COFECHA, which compares the series taken from each tree against a master chronology for each species [39]. We constructed tree-ring residual chronologies for each species using TRW with the dplR library [40] in the software R [41]. Using a negative exponential model as a standardization process, we corrected the biological and geometric growth trends. An autoregressive model was then fitted to each of these detrended series to remove the temporal autocorrelation associated with the growth from the previous year. We also calculated the expressed population signal (EPS) for the period 1985–2019 to determine the suitability of the species chronologies in terms of capturing the hypothetical population signal (EPS > 0.85) [42].

Figure 2.
Gathering and processing dendroecological data.
2.3. Climate-Drought-Growth Relationships
Pearson correlation analysis was conducted in order to evaluate the responses of wood growth to the climatic variables, relating the residual chronologies to the monthly variables of precipitation (PP) and maximum (TMax) and minimum (Tmin) temperature. The climatological data of these sites were obtained from the Climate Explorer website https://climexp.knmi.nl/start.cgi accessed on 13 December 2021 [43] and extracted at a resolution of 0.5° from the database CRU TS v. 4.04 [44].
To compare the growth responses to drought among the twelve species across the study sites, the Standardized Precipitation-Evapotranspiration Index (SPEI) was used [45]. The data were extracted from the SPEI webpage (https://spei.csic.es/, accessed on 13 December 2021) at a resolution of 0.5° from the database CRU TS v. 4.03 with a scale of 1 to 48 months from January to December of the years of growth for all species.
2.4. Effect of Elevation on Basal Area Increment
Given that the increase in the basal area is an indicator of potential productivity in a site [46], the BAI of the twelve species was calculated complementarily from raw measurements of ring width using the following formula (Equation (1)):
where R is the radius of the tree excluding bark at the diameter at breast height and t is the year of formation of the ring. First, the BAI at sampling (core) level was obtained, and then the annual mean BAI for each species was calculated. The library dplR (Dendrochronology Program Library in R) was used to calculate both the BAI and the mean [40].
We assessed the effect of elevation ranks on basal area increment using a Kruskal–Wallis rank-sum test, a nonparametric test equivalent to analysis of variance that determines whether or not a statistically significant difference exists between the medians of three or more independent groups. Finally, where the result of the Kruskal–Wallis test was statistically significant, a Dunn test was conducted to determine which groups were different [47]. These tests were conducted using the PMCMRplus package [48] in R.
2.5. Effect of Latitude on NDVI
The NDVI for each site was extracted from satellite images of MODIS, which measures the reflected solar spectral radiances. We calculated Pearson correlations between NDVI values and TRI with respect to elevation but found no significant results. An analysis was therefore conducted including the interaction between latitude and the elevational ranges. For the NDVI (Equation (2)), we used the global dataset taken from Google Earth Engine [28] through MODIS (Moderate-Resolution Imaging Spectroradiometer) (see https://lpdaac.usgs.gov/products/mod13a1v006/, accessed on 12 December 2021). For each site, we obtained monthly values from the calculation for the period between 2000 and 2020.
where NIR and RED are the near infrared and red values, respectively.
This approach assumed that the NDVI values at the pixel level represented the trees sampled [49]. However, our spatial data considered coexisting tree and shrub species and the understory, which present wider seasonal dynamics. The variation of NDVI throughout the latitudinal range was investigated via a linear model using the function lm in the ‘stats’ package of R [41]. In this model, we included elevation (categorical) and latitude (continuous), as well as the interaction between these factors, as predictor variables (Equation (3)). Residual plots were used to assess the homogeneity of variance and normality of residuals:
where = the mean annual NDVI value at tree i location, = latitude of tree i at j elevation class, = effect of the j elevation class, interaction term and error term. are the regression coefficients.
3. Results
3.1. Climate–Drought–Growth Relationships
In general, the populations of species established on the intermediate elevational gradient presented greater sensitivity to climatic conditions and drought. In particular, they showed negative and significant associations with TMax, and the PP positively influenced the radial growth of these species.
The climate–tree growth correlations showed differing relationships among species, allowing them to be grouped into three elevation bands. In the first instance, the lower elevation sites (<1900 m asl) presented low but significant sporadic correlations with the climatic variables (p < 0.05). TMax was positively related to the growth of P. caribaea in Nov (lowercase months represent the previous growth year), but P. oocarpa presented a negative relationship in Oct (Figure 3a and Figure A2a). Concerning the Tmin, P. caribaea had a positive correlation in MAY (uppercase months represent the current growth year), while P. jeffreyi had a negative correlation in Jul. The correlations between precipitation and growth were positive in FEB at the locality of P. oocarpa (Figure 3b and Figure A2b).
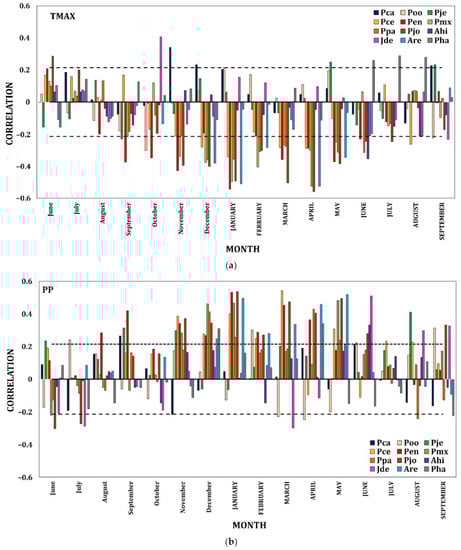
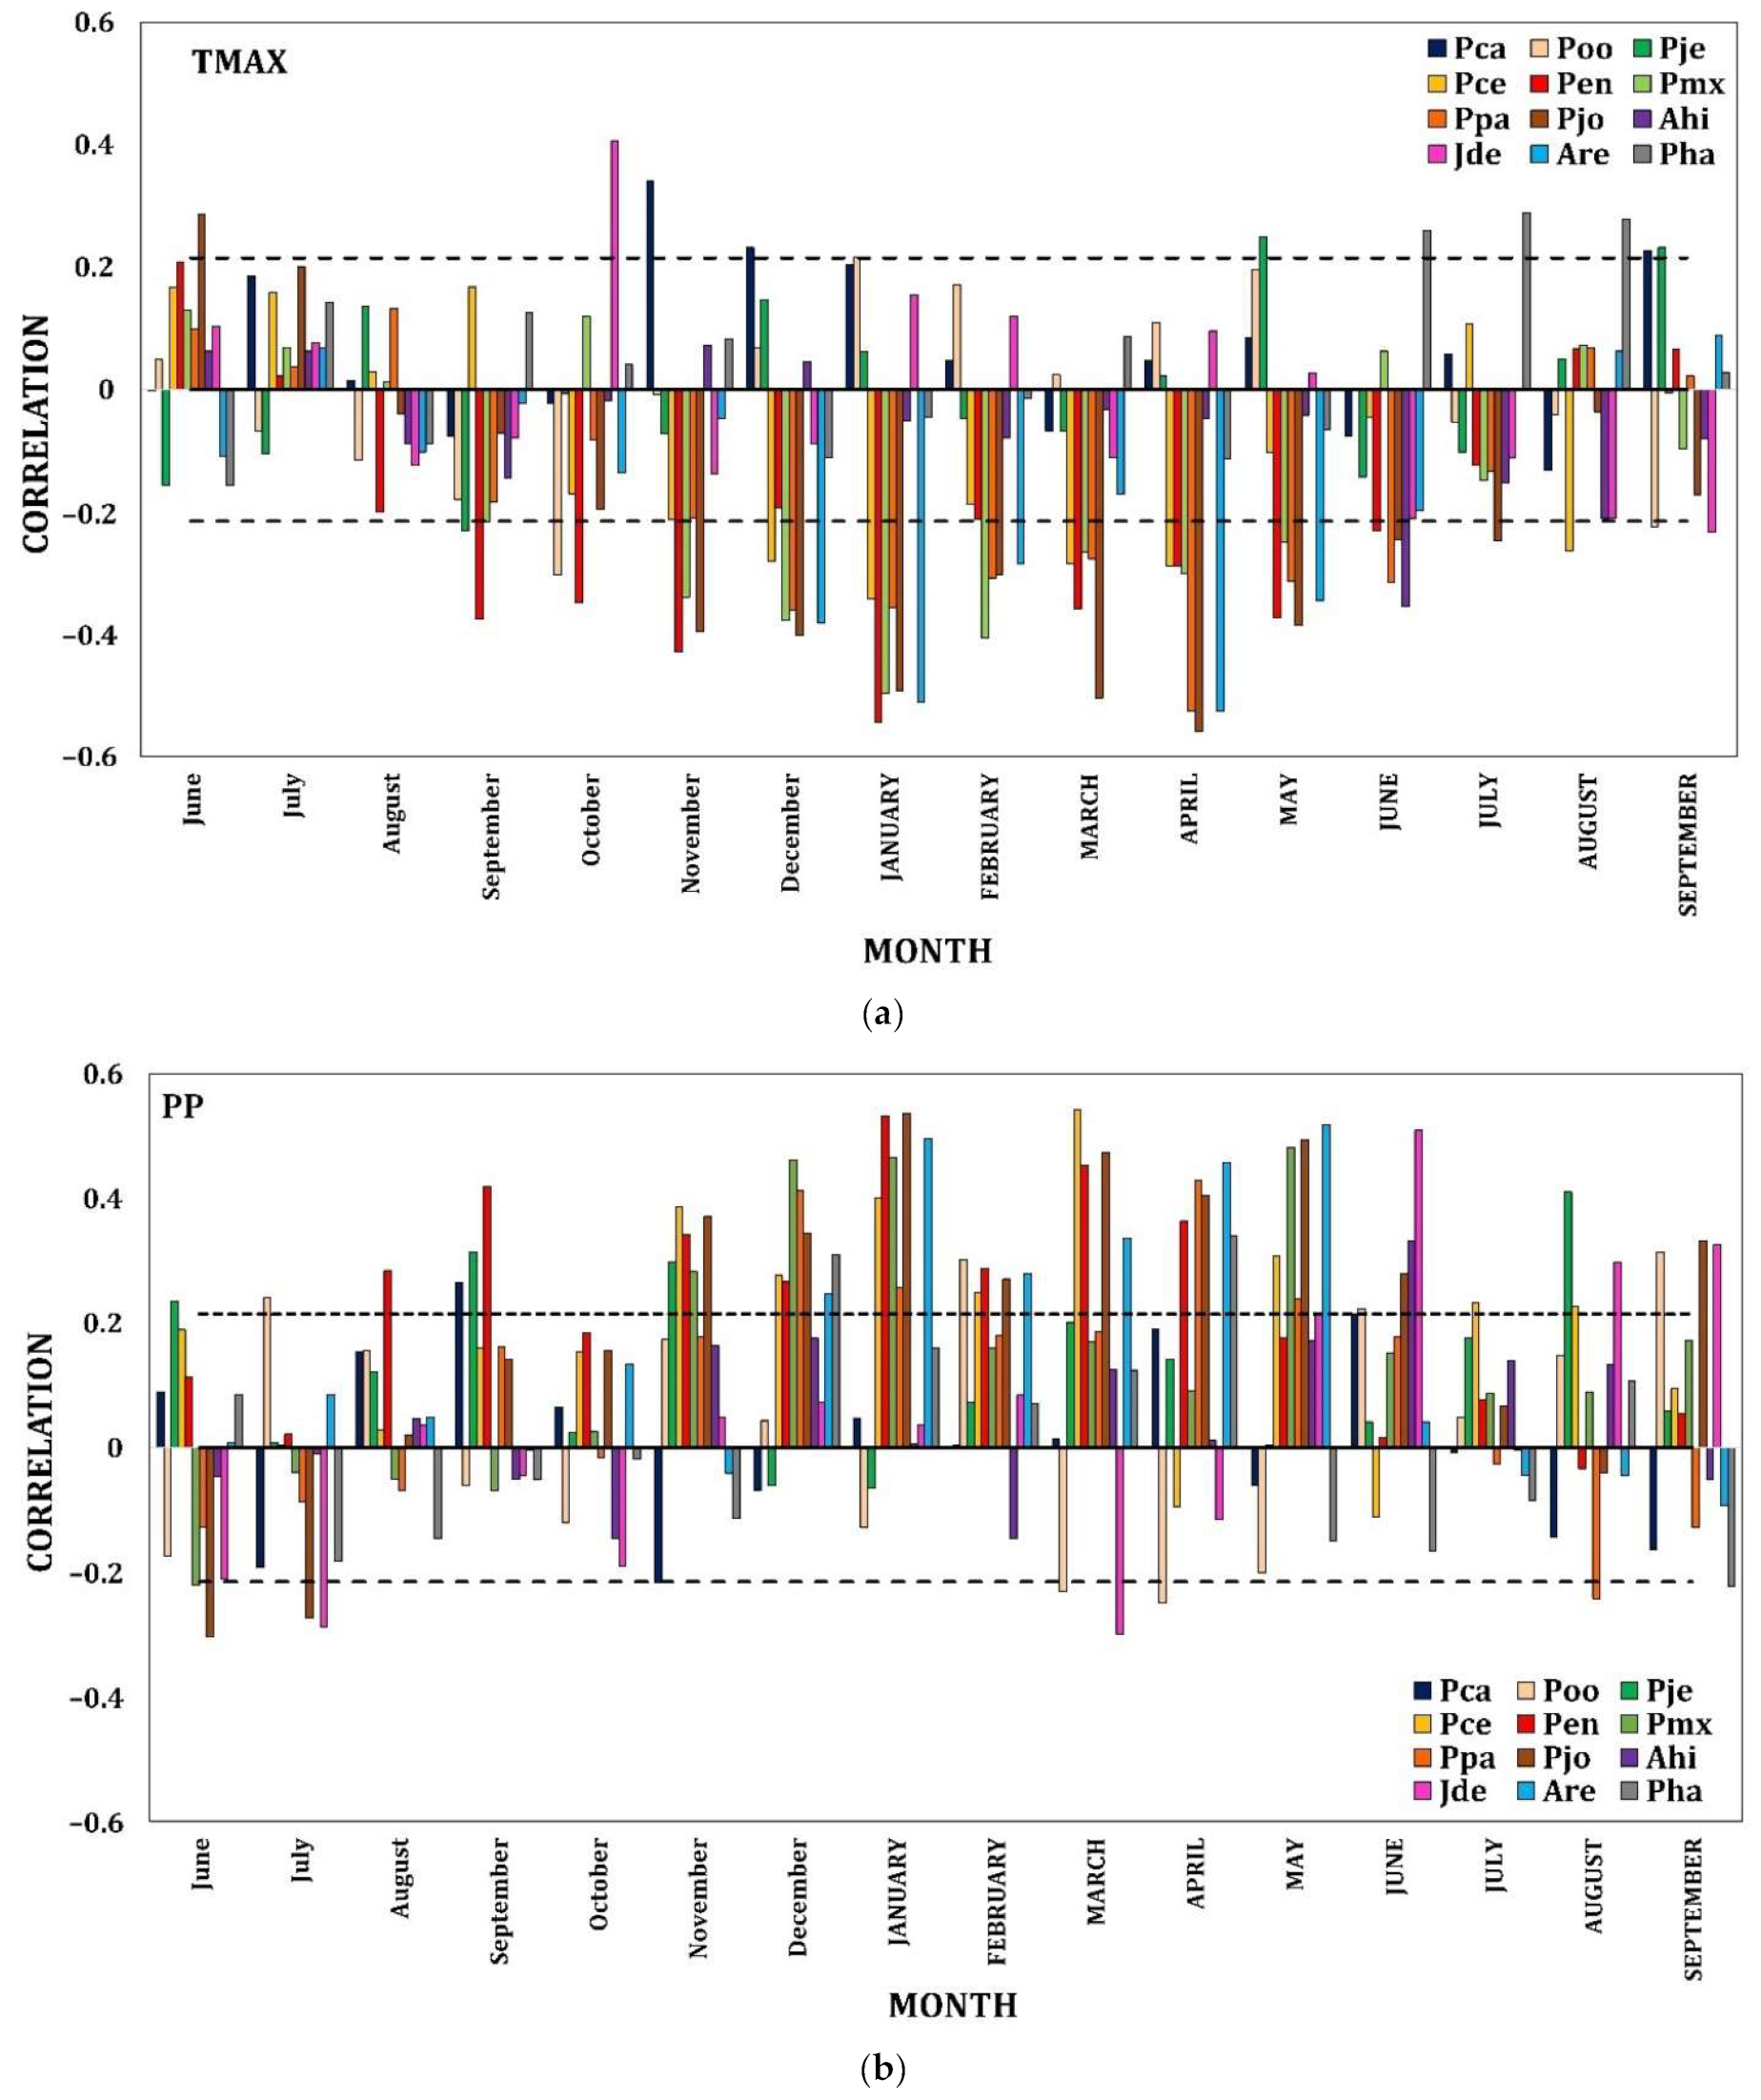
Figure 3.
Radial growth–climate associations. Coefficients of correlation (Pearson) between TMax (a) and PP (b) and the ring width index (RWI) of twelve conifer species as a function of elevation. Significant positive and negative correlations among monthly values from the previous Jun to SEPTEMBER of the year of growth and the chronologies of ring width are shown. Dashed horizontal line shows the 0.05 significance level.
At the intermediate elevational gradient (1901–3000 m asl), uniform temporal patterns of association were distinguished for almost all of the species with respect to climate. TMax from Sep to JUL negatively affected growth in the four species P. engelmannii, P. maximartinezii, P. patula, and P. johannis (Figure 3a and Figure A2a). The Tmin in Dec benefitted the growth of P. engelmannii and P. maximartinezii, while there were negative associations with P. engelmannii in JUN and P. johannis in JAN, APR and MAY. PP had a corresponding temporal effect for all of the species from Aug to JUN (Figure 3b and Figure A2b).
On the highest part of the gradient (>3000 m asl), TMax showed a negative effect on Abies hickelii in JUN and Abies religiosa in Dec, JAN, FEB, APR and MAY but was positively correlated with J. deppeana in Oct and Pinus hartwegii in JUN and AUG (Figure 3a and Figure A2a). Tmin had a negative relationship with J. deppeana in Jun, Jul and Sep but was positively correlated to P. hartwegii in MAY. Finally, and in a shorter temporal distribution, PP presented positive correlations with all the species in Nov and JUN for A. hickelii; JUN, AUG, and SEP for J. deppeana; JAN, APR and MAY for A. religiosa and during Dec and APR for P. hartwegii (Figure 3b and Figure A2b).
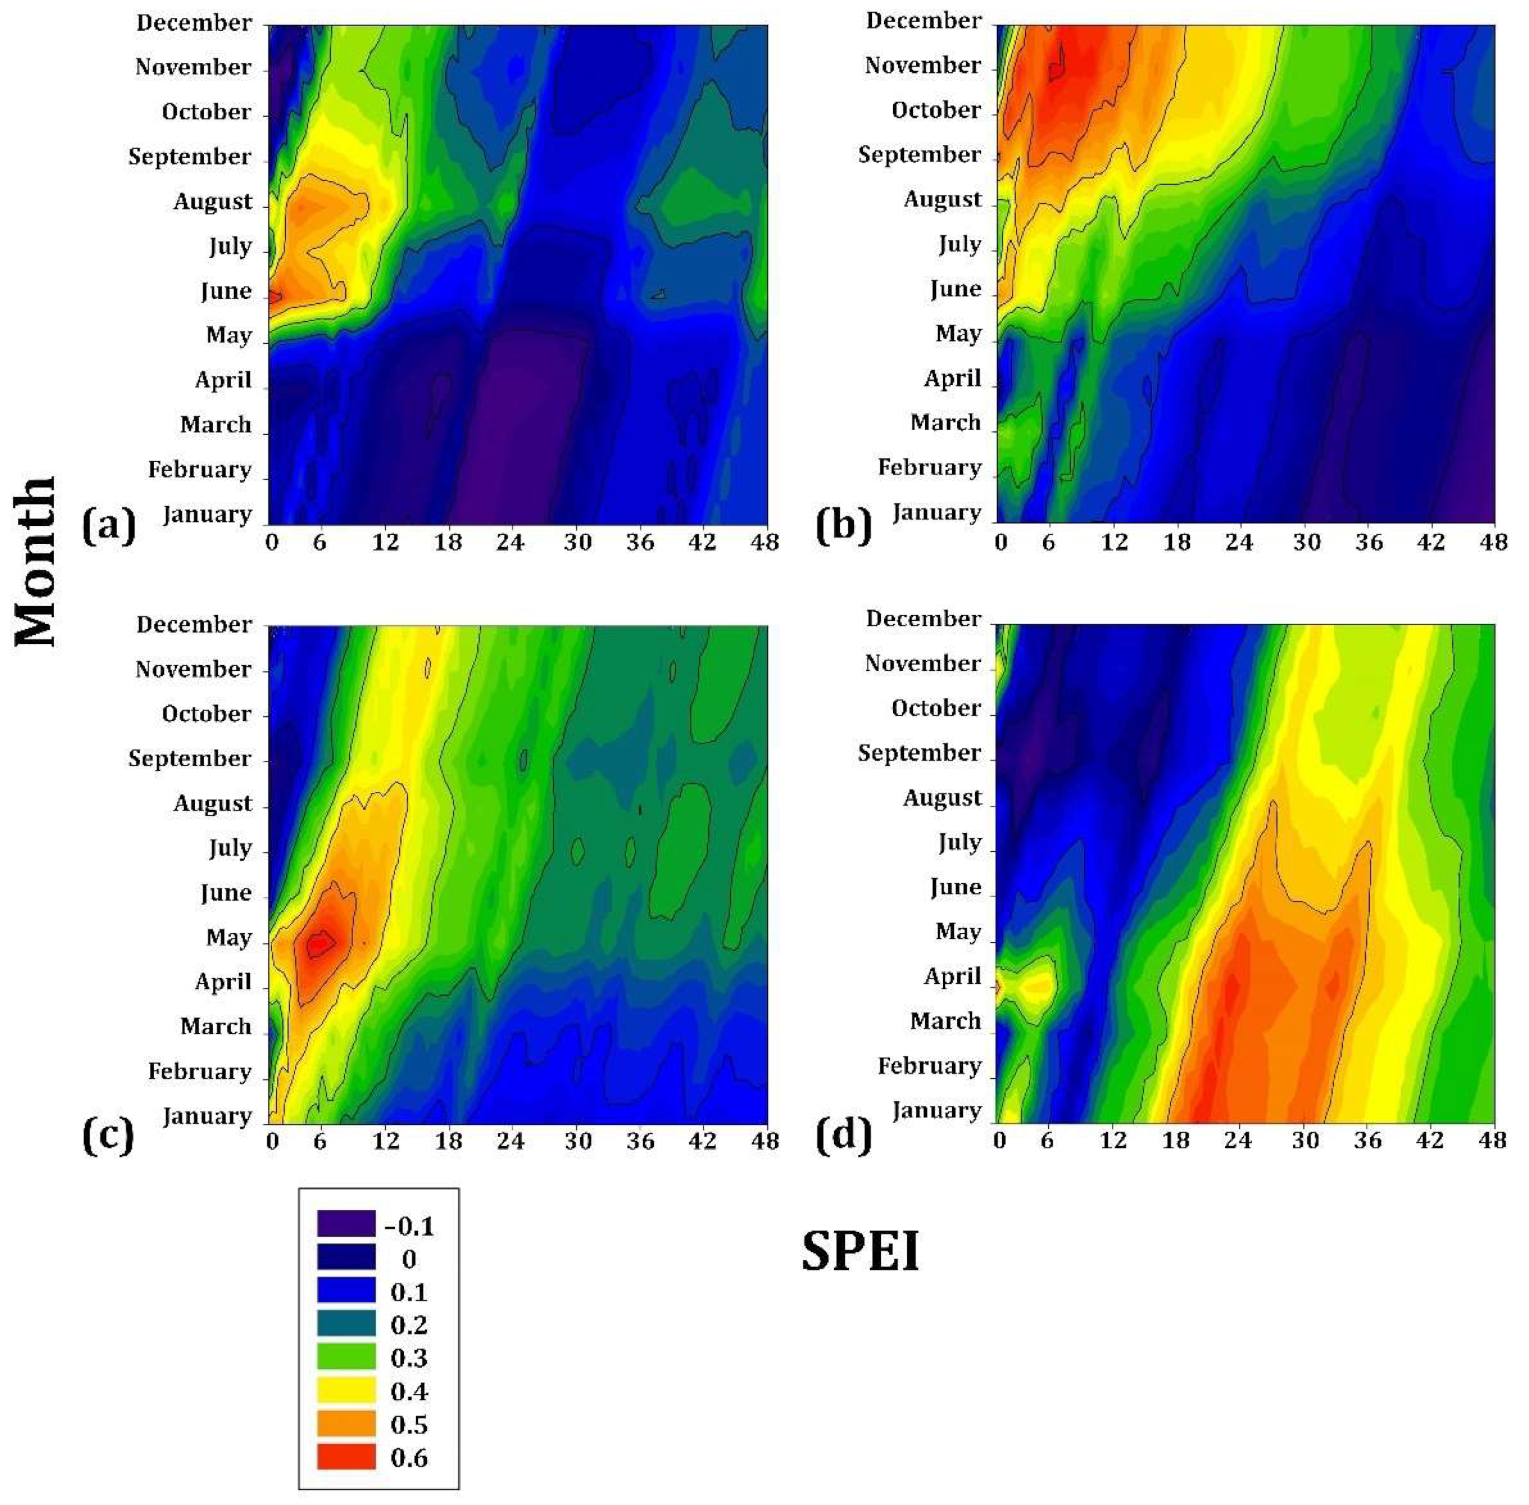
Pinus caribaea presented very low sensitivity to drought (r = 0.15) during the period JAN to JUL, an accumulated drought period of 8–12 months. Similarly, P. oocarpa presented low correlation coefficients (r = 0.25) from JAN to JUL but for a cumulative drought period of 28–32 months. P. jeffreyi is associated during AUG to DEC (r = 0.3) for a cumulative drought period of 4–8 months. Finally, P. oocarpa from Chiapas seems to present the greatest sensitivity within this gradient since it is correlated with the drought (r = 0.4) during APR and MAY in a cumulative drought period of 4 to 8 months (Figure 4).

Figure 4.
Drought–growth associations calculated for four Mexican conifer species (at <1900 m asl) by relating the SPEI drought index to the residual growth-ring width chronologies. The SPEI was calculated in scales of 1 to 48 months (x axes) from JAN to DEC in the current year of growth (y axes). (a) Pinus caribaea var. hondurensis; (b) P. oocarpa; (c) P. jeffreyi; (d) P. cembroides. The Pearson correlation coefficients (r) are indicated using color scales.
On the intermediate gradient, the associations with drought were more significant than those presented with the species of lower elevation. Pinus engelmannii showed a positive association during the period JAN to DEC (r = 0.5) (i.e., practically the entire year) for a cumulative drought period of 4–16 months. Pinus johannis is also positively associated from JAN to DEC (r = 0.6) for a cumulative drought period of 4–12 months. In a subgroup of temporal tendency, P. maximartinezii presented a high association (r = 0.6) with the months of FEB to MAY, for cumulative drought values of 4–8 months, and P. patula was associated in the period MAR to JUN (r = 0.6) for 4–8 months (Figure 5).

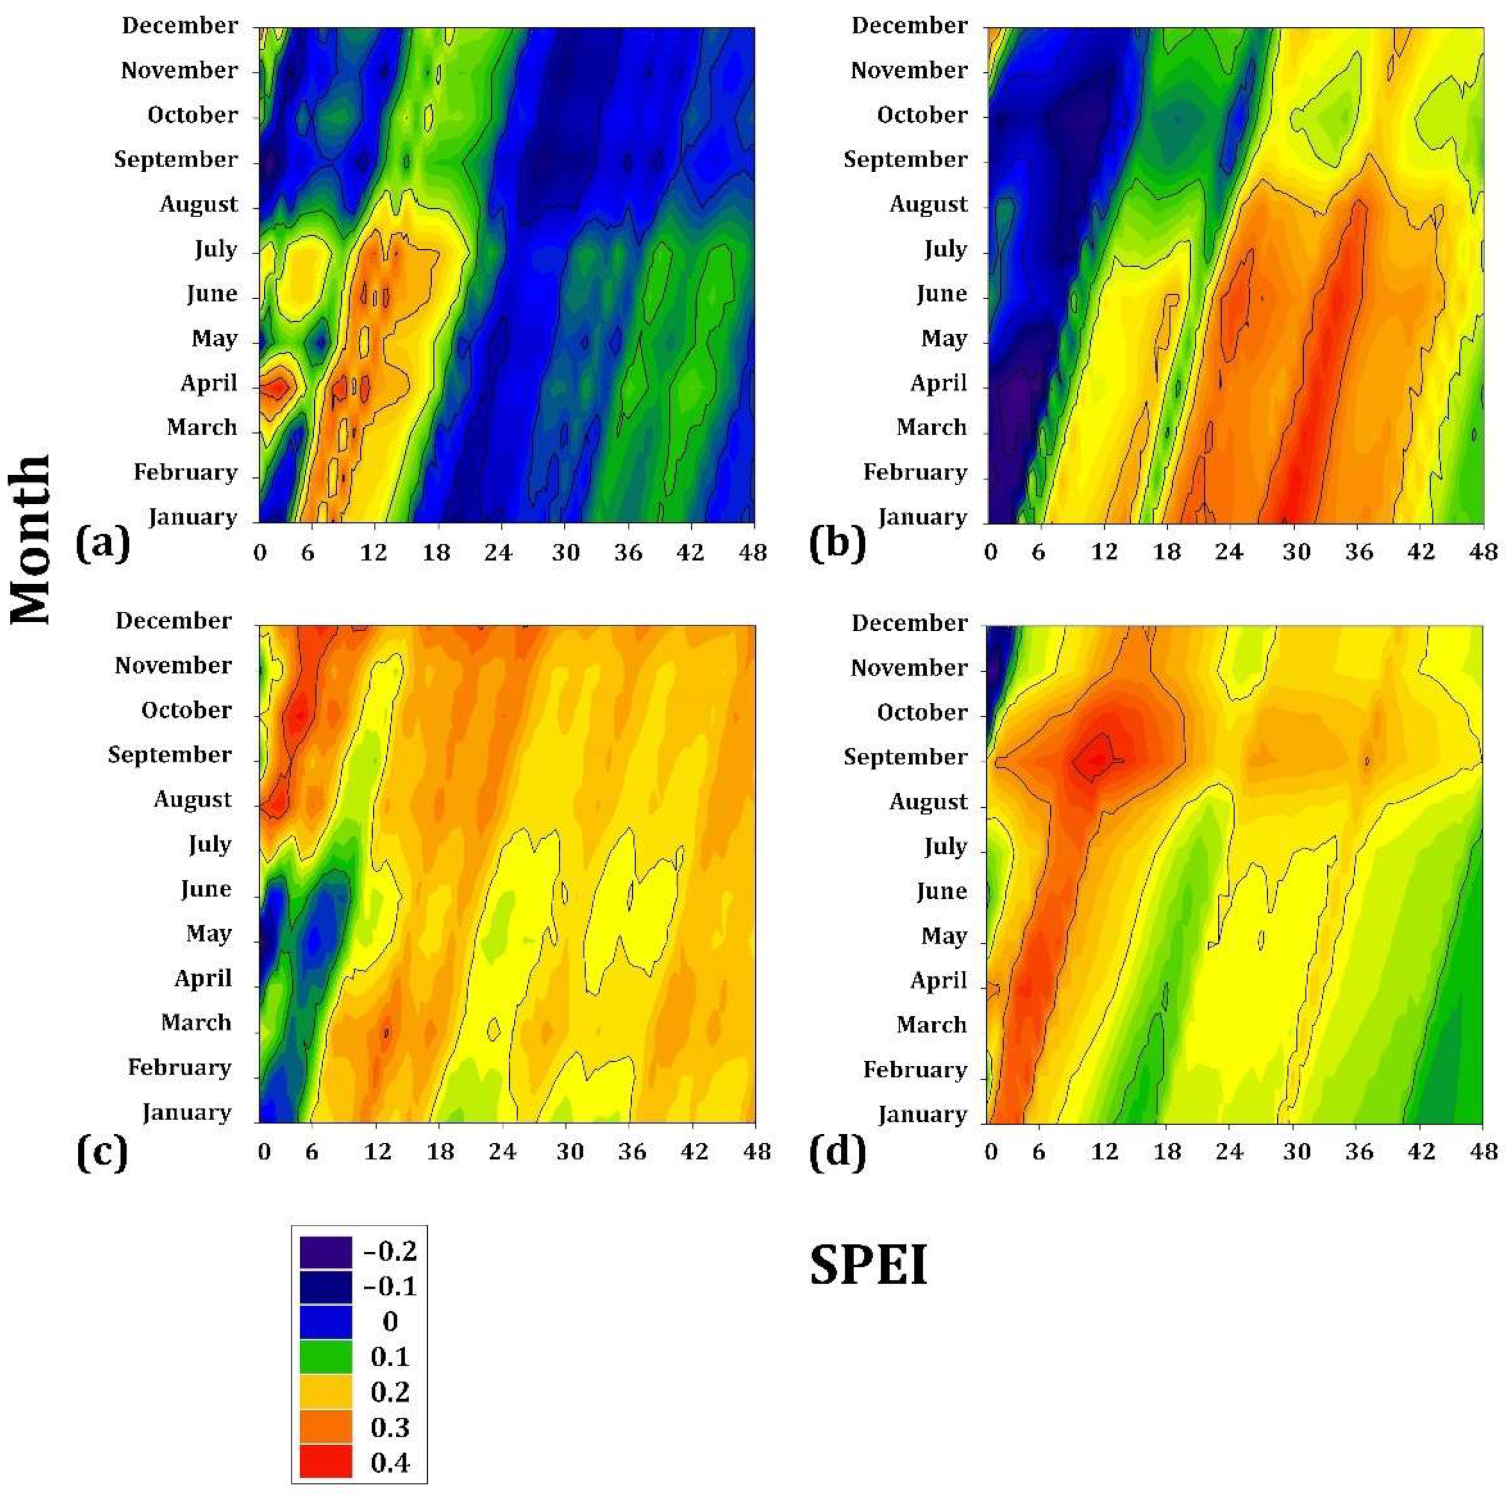
Figure 5.
Drought–growth associations calculated for four Mexican conifer species (1901–3000 m asl) by relating the SPEI drought index to the residual growth–ring width chronologies. The SPEI was calculated in scales of 1 to 48 months (x axes) from JAN to DEC in the current year of growth (y axes). (a) Pinus engelmannii; (b) Pinus maximartinezii; (c) Pinus patula; (d) Pinus johannis. The Pearson correlation coefficients (r) are indicated using color scales.
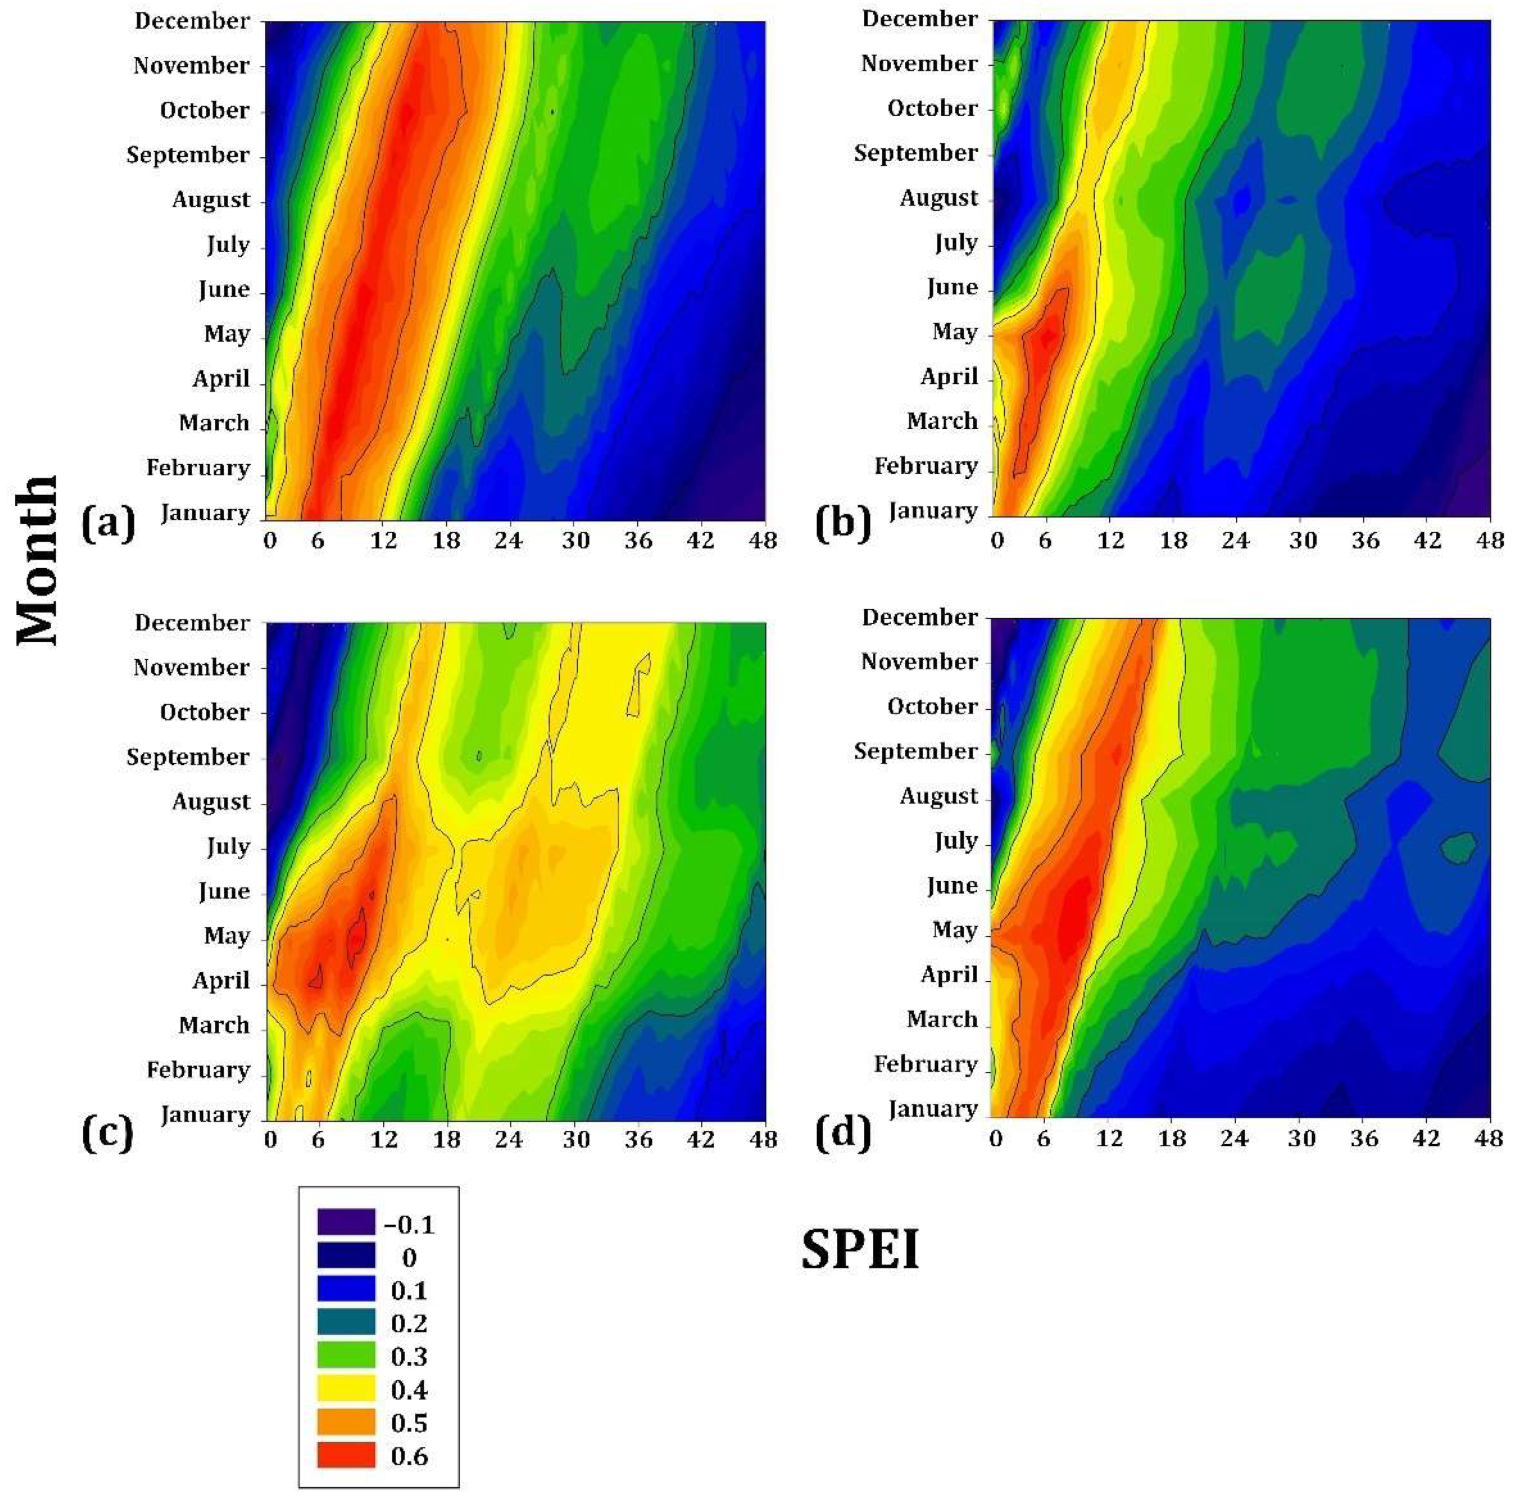
In the highest gradient, P. hartwegii presented the lowest correlation coefficient (r = 0.2) for drought from JAN to JUL, with a cumulative drought of 16–32 months, followed by A. hickelii (r = 0.3) from MAY to AUG with cumulative drought values of 4–8 months. Juniperus deppeana was associated mainly with the drought from SEP to DEC (r = 0.4) for a cumulative drought of 4–12 months. Finally, A. religiosa had the most significant sensitivity to drought (r = 0.6) from APR to JUN, particularly in MAY (r = 0.7) for a cumulative drought of 4–8 months (Figure 6).

Figure 6.
Drought–growth associations calculated for four Mexican conifer species (>3000 m asl) by relating the SPEI drought index to the residual growth–ring width chronologies. The SPEI was calculated in scales of 1 to 48 months (x axes) from JAN to DEC in the current year of growth (y axes). (a) Abies hickelii; (b) Juniperus deppeana; (c) Abies religiosa; (d) Pinus hartwegii. The Pearson correlation coefficients (r) are indicated using color scales.
3.2. Effect of Elevation on Basal Area Increment
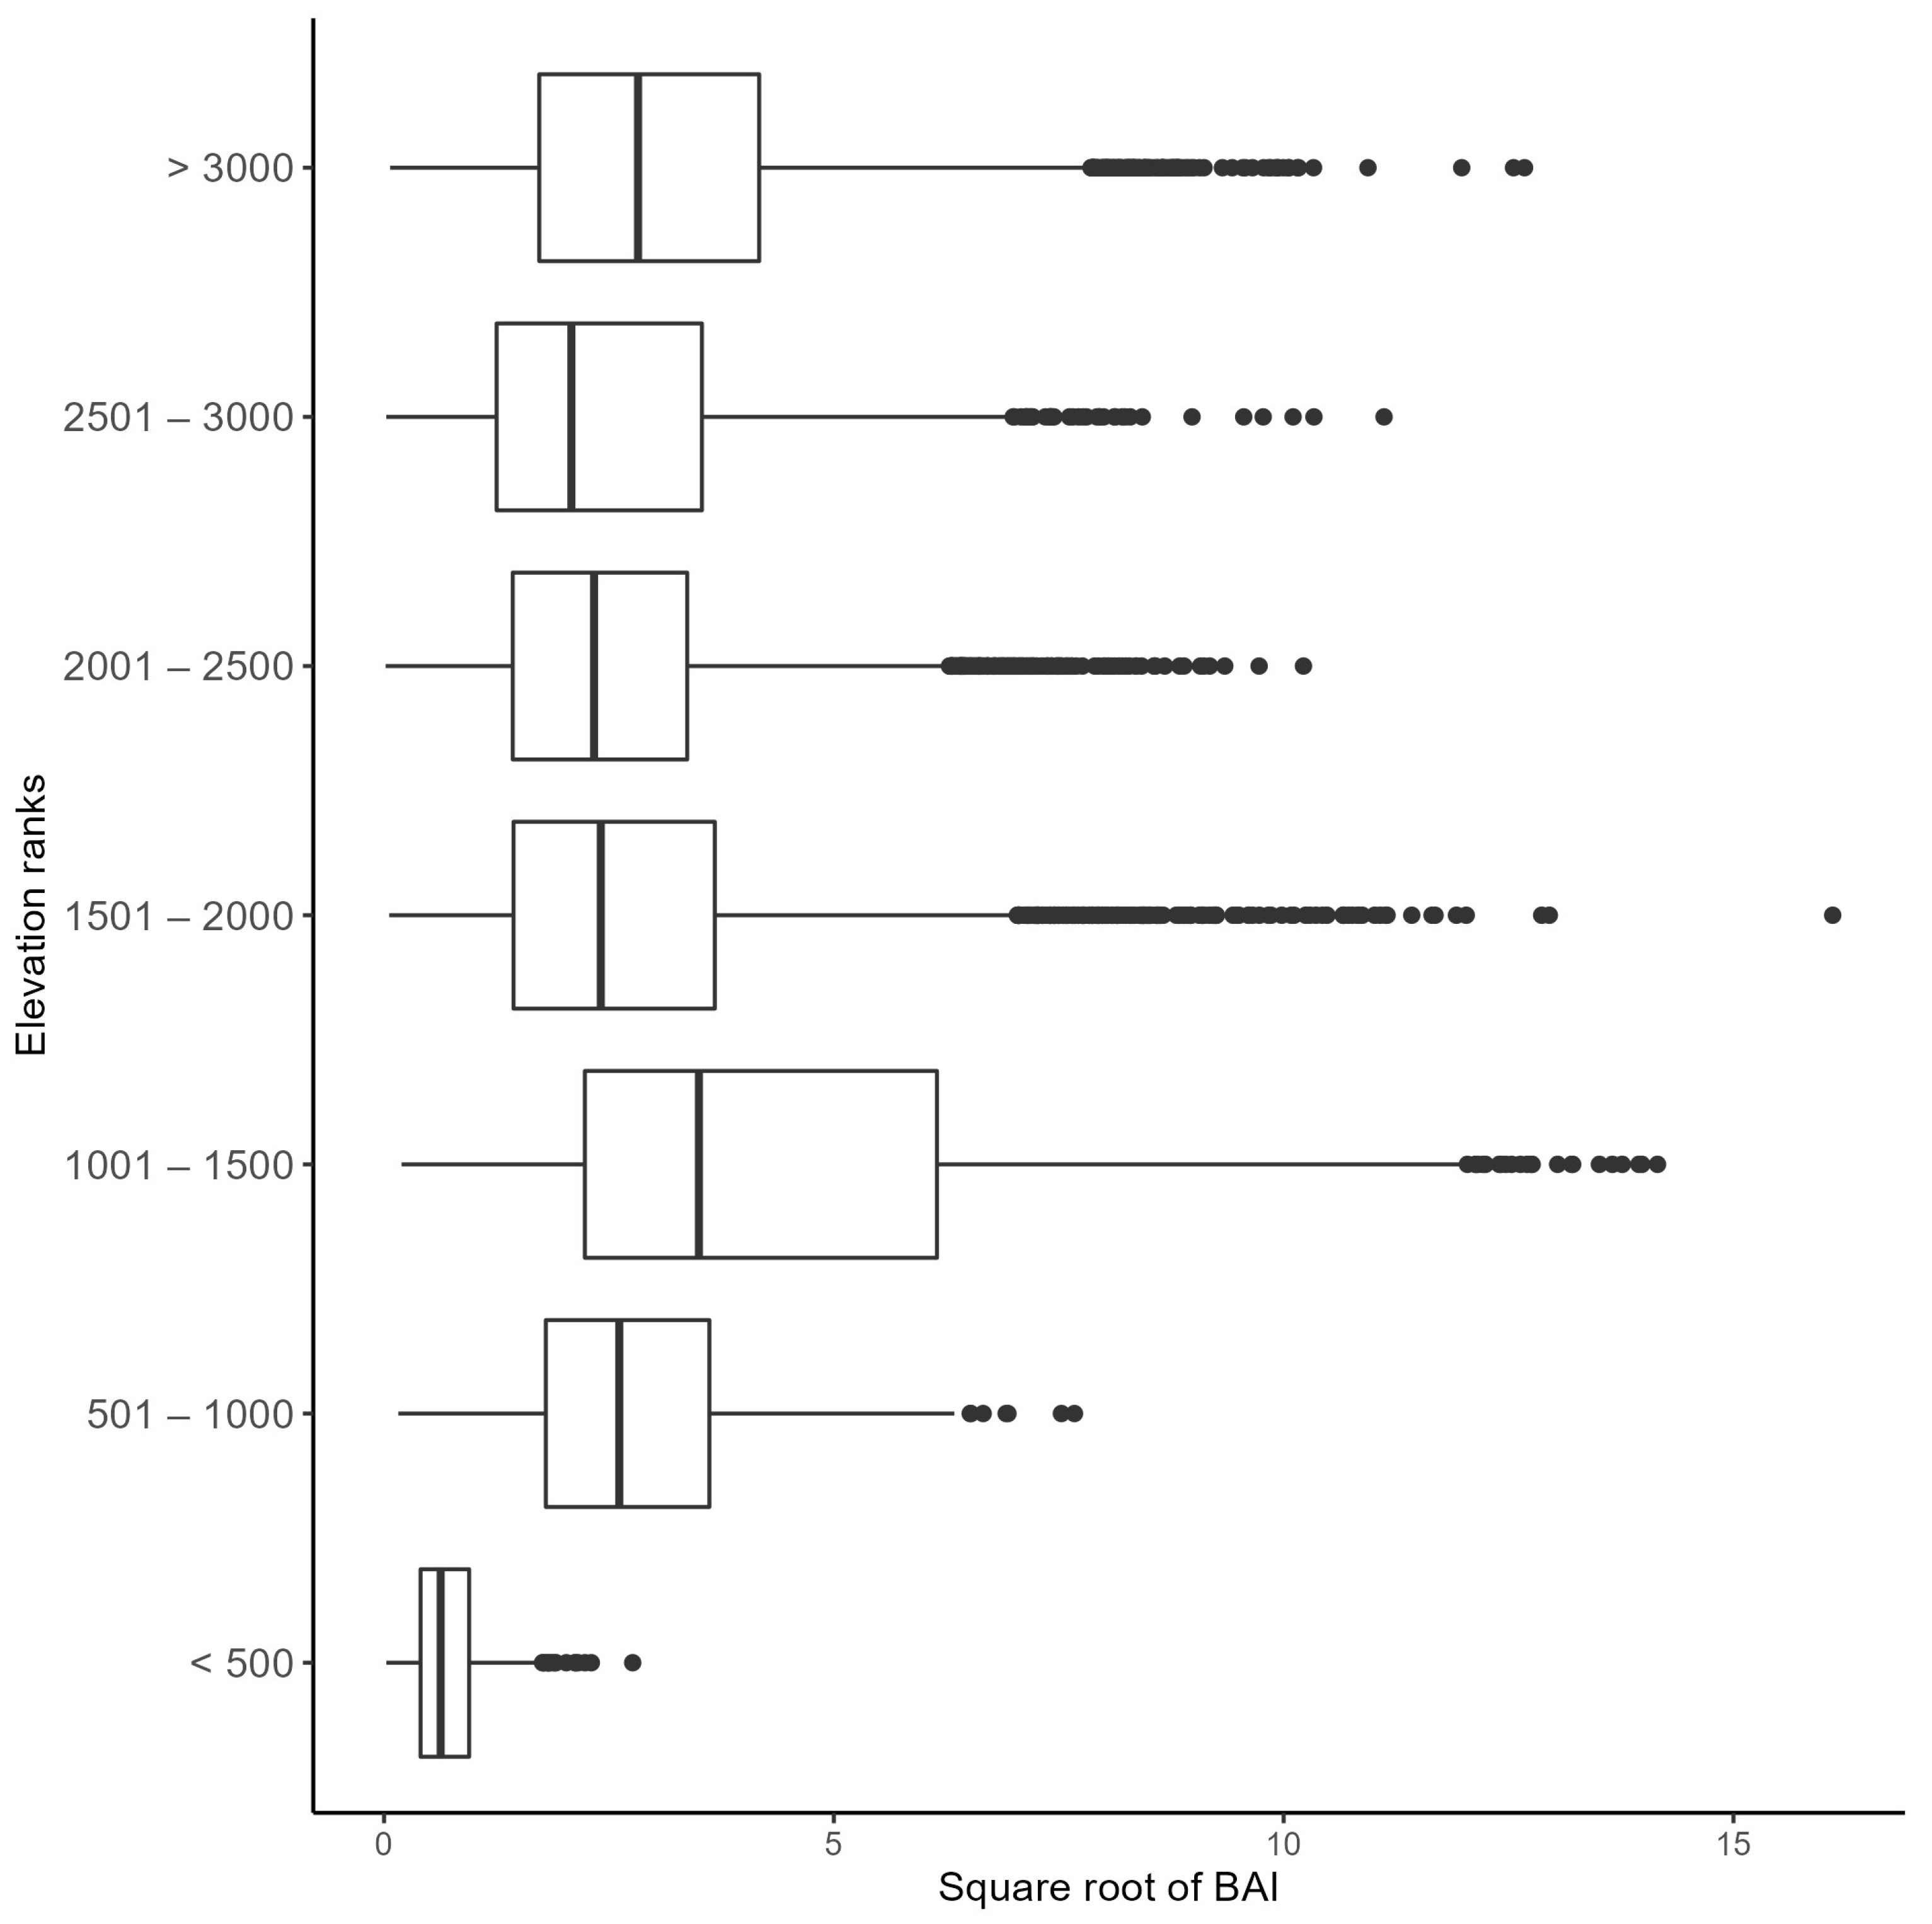
The Kruskal–Wallis rank–sum test showed a significant difference in BAI in at least one elevation rank group (p ≤ 0.01). Consequently, a Dunn test showed significant differences (p ≤ 0.01) among all groups evaluated. Figure 7 shows the range of increment of each group assessed, in which the elevation ranges from 1001 to 1500 m asl presented the highest values. On the other hand, the cores extracted at an elevation of <500 m asl had the lowest values.
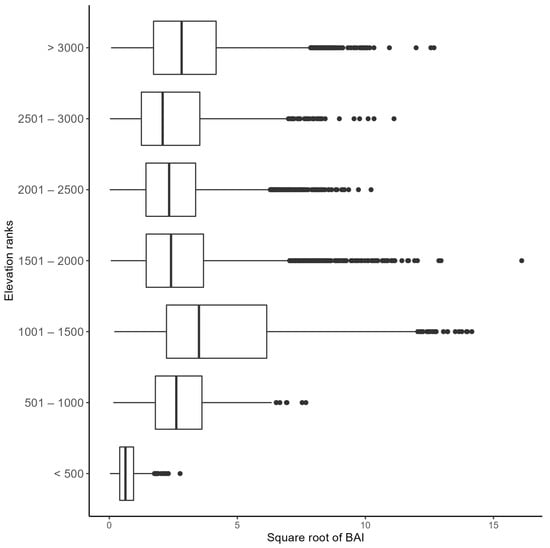
Figure 7.
Basal area increment (BAI) (m2 year−1, x axis) of the twelve studied conifer species grouped according to elevation class (in meters, y axis).
3.3. Effect of Latitude on NDVI
The mean NDVI values of the different studied conifers ranged from 0.27 in P. jeffreyi in Baja California Norte (31.9° N) to 0.60 in A. hickelii found in Oaxaca (17.4° N) (Figure A3). We found a significant relationship between conifer greenness, measured as the mean NDVI values, and latitude across the Mexican territory (p < 0.001). In general, there is a decreasing trend of NDVI across the latitudinal range, with higher NDVI values presented in southern species compared with the species of more northerly distribution (Figure 8). However, the slope of this association differed for each elevation class (significant interaction Latitude × Elevation; p = 0.016). We found a decrease in NDVI as latitude increases at low and intermediate elevation ranges, although this decrease was sharper at the high elevation range. This outcome highlighted the fact that the southern conifers that developed at higher elevations present greater potential growth than those at lower elevations. In contrast, northern conifers at high elevations showed lower growth than those at intermediate and low elevation ranges.
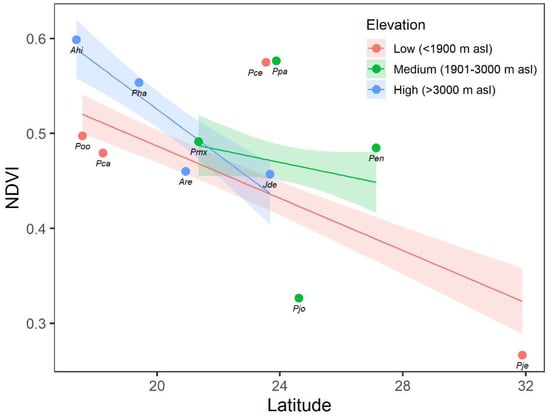
Figure 8.
Linear relationship between the normalized difference vegetation index (NDVI) and latitude using data collected from different conifer species across the Mexican territory in the following elevation classes: low (<1900 m asl; red points and lines), intermediate (1901–3000 m asl; green points and lines), and high (>3000 m asl; blue points and lines). Points indicate the observed annual mean NDVI in each species for the period 2000–2020. Lines and shaded regions represent the predicted values and the 95% confidence band from the linear fit, respectively.
4. Discussion
This study was conducted in the “natural laboratory” of the forest ecosystems of Mexico, where wide variation exists in terms of soil depth, moisture content and availability of water, as well as microclimatic variation. Here, non-traditional sampling was successfully implemented for dendroecological purposes. Contemporary and spatially conglomerated stands were sampled, in contrast to traditional dendrochronological sampling focusing on marginal trees [33]. The radial growth response to climatic conditions and drought was explored in young Mexican conifer species using an elevational approach. The forest growth of the 12 populations was analyzed from two perspectives: (1) the index of greenness (NDVI) on the altitudinal and latitudinal gradients and (2) the BAI on the altitudinal gradient. By combining tree rings, BAI and NDVI, different facets of the ecological functioning of the forest are represented, so the results broaden our knowledge of forest growth dynamics. This also contributes to the sensitivity or complacency of the study species to the climatic conditions. These results are important since suitable management actions can subsequently be taken to mitigate the predicted consequences of climatic change (increased intensity and severity of droughts) [50].
4.1. Climate–Growth Relationships
The current study examined several species that have not been analyzed before from a dendroecological perspective. Among these, P. caribaea, P. oocarpa, A. hickelii and J. deppeana present themselves as complacent towards the climatic conditions and drought, showing a null response to the climate attributed to the specific conditions of the microsite of the establishment. In contrast, Pinus patula, P. maximartinezii and P. johannis were found to be very sensitive to the climate and drought. In particular, the temperatures from the previous winter to the summer of the year of growth, and the precipitation in the previous winter and in April of the year of growth, significantly influenced the radial growth of these species. This phenomenon has been widely documented in other conifer species in Mexico, such as Pseudotsuga menziesii [33], Pinus arizonica, P. engelmannii, P. durangensis, P. leiophylla, P. lumholtzii [51], P. cembroides and P. engelmannii [52].
The results show that all species respond differently to the variables studied but that sensitivity to drought differs among species following an elevational pattern. The radial increase seems to be mainly influenced by maximum temperature and precipitation, the suggested explanation for which is that vapor pressure deficit (VPD) affects radial growth [53]. There are differences in sensitivity to climate according to the species, which are clearly grouped by elevation class. Species at low elevations show minor sensitivity to climate. At the same time, TMax and PP negatively affected those species in the intermediate range, mainly from the previous year to the current year of growth.
On the lowest gradient, the species seem not to have climatic limitations. On the intermediate gradient, the four species are susceptible to climatic variability and drought, which coincides with multi-species analyses at similar elevations [52,53]. Differences in the correlations between growth and the climate and drought vary as a function of the elevation and biome type. These differences are more accentuated in the sites of intermediate latitudes and elevations between 1200 and 1600 m asl. Drought is the main limiting factor for the growth of trees, particularly in forests established in zones of intermediate elevation and those prone to drought, such as transition zones. This suggests that the drought impacts are increasing in these biomes [54], wich eventually could lead to the movement of the treeline of various species towards sites at higher elevations. On the highest gradient, Abies hickelii and Pinus hartwegii presented lower sensitivity to climatic changes, benefitting from the higher temperatures. It is widely documented that drought is one of the main factors that influence the decline and mortality of trees at the global level in different types of ecosystems [6]. Our results show that drought negatively affects the radial growth of forest species, particularly those that grow on low and intermediate elevational gradients. This coincides with recently published findings that populations of trees established at higher elevations (>3000 m asl) seem to develop a greater tolerance to drought [54].
Contrasting growth responses to the climate were detected among the study sites. However, these differing responses could have been attributed to specific responses of the species to climatic variability and drought. It is evident that elevation is a factor that influences the responses of species. This is explained by the regional variations in environmental variables such as temperature and precipitation, as well as in abiotic variables such as the topography of the site, for example, temperature as a function of slope.
Other possible causes are precipitation, relative humidity, and solar radiation [54]. Slope aspect and the local drainage characteristics of the soil, as well as elevation, influence tree growth. Soil type is another factor for consideration, and one that merits more detailed study since the species that establish in well-drained soils are more vulnerable to drought stress [55]. Species at the sites at intermediate elevation presented greater sensitivity to climatic conditions. Three of these species are representative of the ecoregion Temperate Sierras and one species of North American Deserts. Sites at low and high elevations are not subjected to the climatic variability that predominates in the sites at an intermediate elevation. Three high elevation sites were located in the ecoregion Temperate Sierras and one in Southern Semi-arid highlands. These sites are colder and more humid than those of intermediate elevation. In these sites, only the radial growth of Abies religiosa presented a negative relationship with TMax. This agrees with that found in sites of the western United States of America and is attributed to the allocation of carbon for the respiration process during periods of high temperatures [56]. On the other hand, two low elevation sites belong to the ecoregion Tropical Wet Forests, one to Tropical Dry Forests and another to Mediterranean California, which experience higher temperatures and more precipitation [55].
Evidence has recently been observed of an uncoupling between tree growth and temperature trends [54,57]. Considering the expected yearly increase in mean temperature of 1 °C globally and 0.74 °C in Mexico [50,58], these differences have potentially significant implications. This is particularly true in sites at an intermediate elevation, where TMax limits growth. Huang et al. [59] record differing responses of Canadian boreal species to temperature and drought from a latitudinal perspective. Specifically, summers with high temperatures can increase the hydric stress and limit growth in the most southerly sites. In contrast, this same temperature increase causes a favorable effect on radial growth in the species established in sites in the north.
In short, the heterogeneity of the landscape modulated by physical factors produces different responses of radial growth to hydroclimatic variations. Consequently, some species are complacent while others tend to be more sensitive. Therefore, the gradient used here was considered appropriate for discerning these ecological mechanisms, although more research with more site-specific data is required. We found an elevational pattern in the modulation of the radial growth of the species in climatic terms. The results of the correlations suggest that forest growth is being impacted by recurrent droughts and follows a defined spatial pattern, with greater restriction found in mid-elevation forests. These results are relevant given the importance and cover of the forest in the country, as well as the fact that these sites at intermediate elevation represent biomes that cover 22% (Temperate Sierras) and 30% (North American Deserts) of the national territory [60].
4.2. Effect of Elevation and Latitude on Forest Growth
BAI as a proxy of productivity is also associated with tree age. Young stands present higher growth rates and vigor [61]. This is confirmed in studies conducted in Mexico on P. hartwegii that report a trend of maximum BAI in the juvenile stage of the trees [62]. Similarly, Coomes and Allen [63] conclude that tree growth declines at higher elevations, leading to the stunting of trees and the presentation of more open canopies. Nevertheless, the increase was minimal for trees at elevations less than 500 m asl. The climatic conditions at this elevation could therefore be unfavorable for the species evaluated. In addition, we attribute this to the increased number of species at lower elevations [64], which increases the competition among tree species and has a negative effect on the BAI of coniferous species.
A descending trend in greenness was observed as a function of latitude. The species located more to the south presented a higher NDVI than those located more to the north (Figure 8), i.e., the index of greenness seems to be related to geographic factors at the site level. Since biomass is an important component of radial growth and the NDVI reflects this potential productivity [27], our results seem reasonable since the equatorial and tropical species accumulate greater biomass and thus present a higher NDVI. However, the species growing in the north of Mexico, for which growth is dictated by moisture availability [65], exhibit lower radial growth. For this reason, stronger relationships between NDVI and tree-ring widths are expected in cases where atmospheric conditions become warmer. At the ecosystem level, Coulthard et al. [66] demonstrated that the chronologies of arid sites are more strongly correlated with NDVI. Findings in the Siberian taiga also indicate that the growth responses to climatic conditions diminish along the latitudinal gradient from south to north [67,68]. However, the increase in productivity at the global level attributed to fertilization by CO2 cannot be disregarded as a cause of these NDVI values [61], particularly in heterogeneous environments such as those studied here. For example, similar studies indicate that this can be attributed to the density of the forest [27]. The high productivity values represented by the NDVI and the BAI in southern sites and in those of low elevation, respectively, can be explained by changes in the establishment and density of the stand and the size and number of leaves [62].
Previous studies have found that the link between NDVI and TRI produces mixed results [66,69]. However, we found a positive relationship in general terms, and although there can be strong intra-site variation [27], our findings could help to calibrate global models. Our sampling did not discriminate against individuals, thus achieving a homogeneous spatial unit of tree distribution and a uniform reflectance of the canopy for improved detection by the spectral sensor. Consequently, the accuracy of our results is greater than those using data from dispersed trees and those growing in marginal conditions [33]. As such, we hypothesized that an analysis of forest growth through the NDVI linked to tree rings must be focused on changing the sampling system for spatially uniform units and of greater resolution, which would increase the accuracy and utility of the correlations between NDVI and annual radial growth. The advent of technologies such as GEE [28] and the use of unmanned aerial vehicles (UAVs) offer promising perspectives [70].
To the best of our knowledge, this is the first study to address a multispecies perspective in forests of high diversity such as those found in the Mexican territory. A decreasing trend was found in forest growth along the latitudinal gradient, with marked radial growth patterns at different elevations. Studies at the global level suggest that increased concentrations of CO2 and deposition of N are drivers of forest productivity [54,61]. This was beyond the scope of the present study; however, our results improve the understanding of the growth responses of young conifer species from elevational and latitudinal perspectives.
We recognize that the links between tree growth and NDVI may be influenced by other factors not considered in this study, such as microsite and slope aspects (exposure) and the productive capacity of the sites. For example, it has been reported that NDVI can be influenced by stand density, forest management type, the presence of a rocky substrate, herbaceous vegetation, pests, and diseases [25].
Despite the advantages of our approach in terms of suitability for extracting long-term NDVI series, we recognize that further research is required, for instance to address the residual effects of atmospheric correction [71,72], including cloud and aerosol noise [73], which would enhance the quality of the long-term NDVI time series. On the other hand, we highlight limiting factors, such as optical properties and canopy structural attributes, which must be measured in situ [74].
The complexity of the biophysical conditions of the Mexican territory is strategic for assessing changes among species growing in different geographical conditions. The dendroecological analysis was able to substantially explain the forest growth dynamics, which are traditionally explained by the time series of radial growth through correlation coefficients [75]. The common variability of growth along bioclimatic gradients shows that there is spatial geographical synchrony, which is mainly attributed to climatic forces and other abiotic variables, such as species-specific plasticity and microsite conditions. Specifically, the forcing ecological variables have the greatest repercussions on the populations of intermediate elevation and those distributed in the north of Mexico. However, the need to complement the analysis methods and enrich the coverage of chronologies, including the measurement of specific-site parameters at finer scales (e.g., site index and microsite characteristics), as well as xylogenesis connections and remote sensing, etc., are recognized as limitations.
5. Conclusions
This comprehensive analysis allowed us to study the radial growth and potential forest productivity of contemporary conifer species, and their responses to climatic and drought conditions. The considerable hydroclimatic variations present along the studied gradient confers differentiated growth responses that are presumably attributed to species, elevation, or climate. The radial growth of young species is differently affected according to elevation range, with sensitivity accentuated in the intermediate range of 1901 to 3000 m asl. Species such as P. engelmannii, P. patula, P. maximartinezii and P. johannis are highly responsive to changes in climatic variables and drought index. Cold/humid and warm/dry conditions are the main drivers that promote and limit radial growth, respectively. Forest growth depends on several factors in addition to stand age, establishment, and density. This analysis shows that altitudinal and latitudinal gradients also influence tree growth.
The knowledge generated here should be incorporated into the planning of sustainable management actions that allow for better species adaptation and thus conservation in the face of the impacts of climatic change, particularly for the most vulnerable species. Therefore, we encourage systematic dendroecological evaluations in a multispecies context and over-broad biogeographic scales as a meaningful approach to improve our understanding of young forest dynamics in the face of climate variability.
Author Contributions
M.P.-G., conceived and designed the experiment, led the data analysis, wrote, and edited the original manuscript; J.A.S.-R., processed data, conducted formal analyses, wrote the manuscript. J.R.P.-M. conducted formal analyses and wrote the manuscript. E.D.V.-V. gathered and processed field data and performed software and data curation. All authors have read and agreed to the published version of the manuscript.
Funding
This research was funded by CONACYT for project A1-S-21471.
Data Availability Statement
Not applicable.
Acknowledgments
We thank Andrés Cruz (El Capy), Ciriaco Rangel Alonso, David Ezequiel Chávez Martínez, Emmanuel Cruz Canela, Esteban Casillas Núñez, Feliciano González Ávila, Gustavo Castañeda Rosales, Ing. Esaúl López Mendoza, Ing. Leonel Carmona Duarte, Ing. Mauro Ramírez Alavez, Ing. Sergio Ruíz Soto, José Alberto Ramos Caballero, José Antonio Álvaro Méndez, José Cruz Delgado Campos, Julio Godínez Rojo, M.C. Adrián Jesús Mendoza Herrera, Maximiliano García Flores, Miguel Hernández Espejel, Oscar Alfredo Díaz Carrillo, Roberto Carlos Valadez Castro, and Rubén Darío Appel Espinoza for the support provided for data collection. We gratefully acknowledge the Dirección General de Vida Silvestre, SEMARNAT (Secretaría de Medio Ambiente y Recursos Naturales, Mexico) and Holística Consultores Ambientales HCA S.C., for facilitating field sampling. We thank Marcos González-Cásares for his support on early versions of the manuscript, as well the four reviewers and the editor for their valuable assistance.
Conflicts of Interest
The authors declare no conflict of interest.
Appendix A

Figure A1.
Ecoregions of Mexico.
Figure A1.
Ecoregions of Mexico.
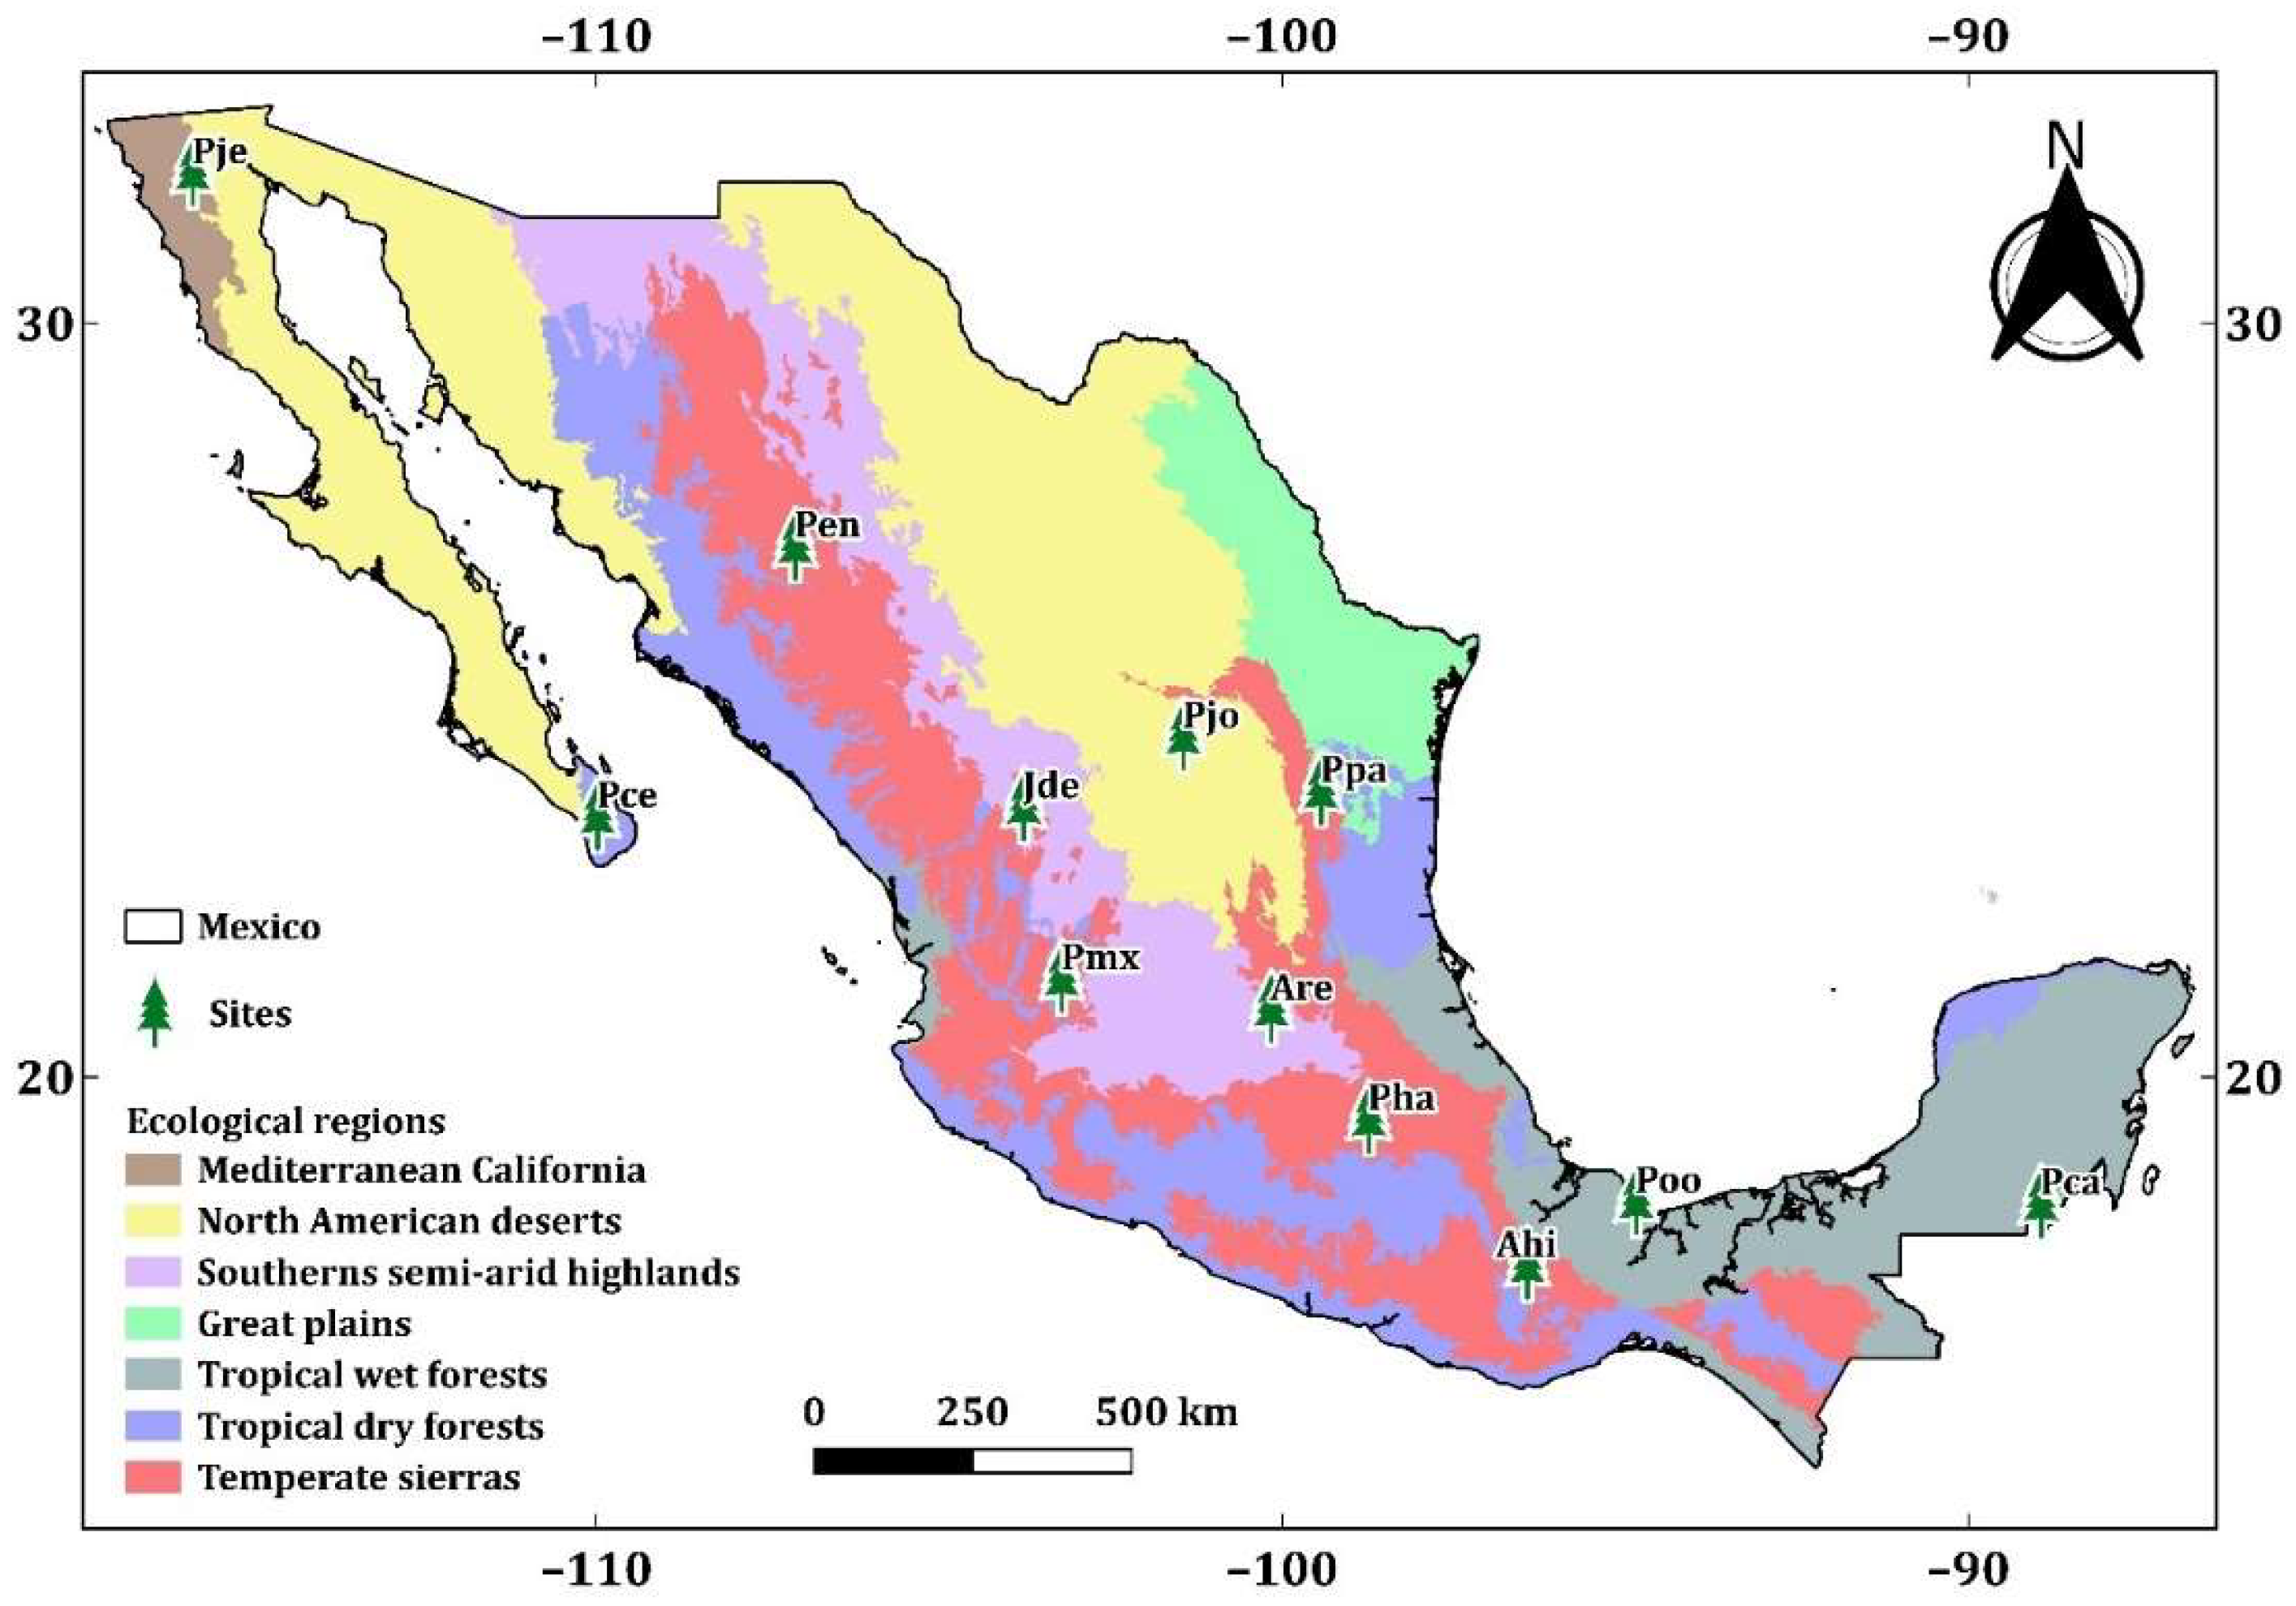

Figure A2.
Radial growth–climate associations. Correlation coefficients (Pearson) between TMax (a) and PP (b), with the RWI of the twelve conifer species as a function of elevation. Significant (p < 0.05) positive (blue dots) and negative (red dots) correlations among monthly values (from the previous Sep to AUG of the growth year) of TMax and PP and ring width chronologies.
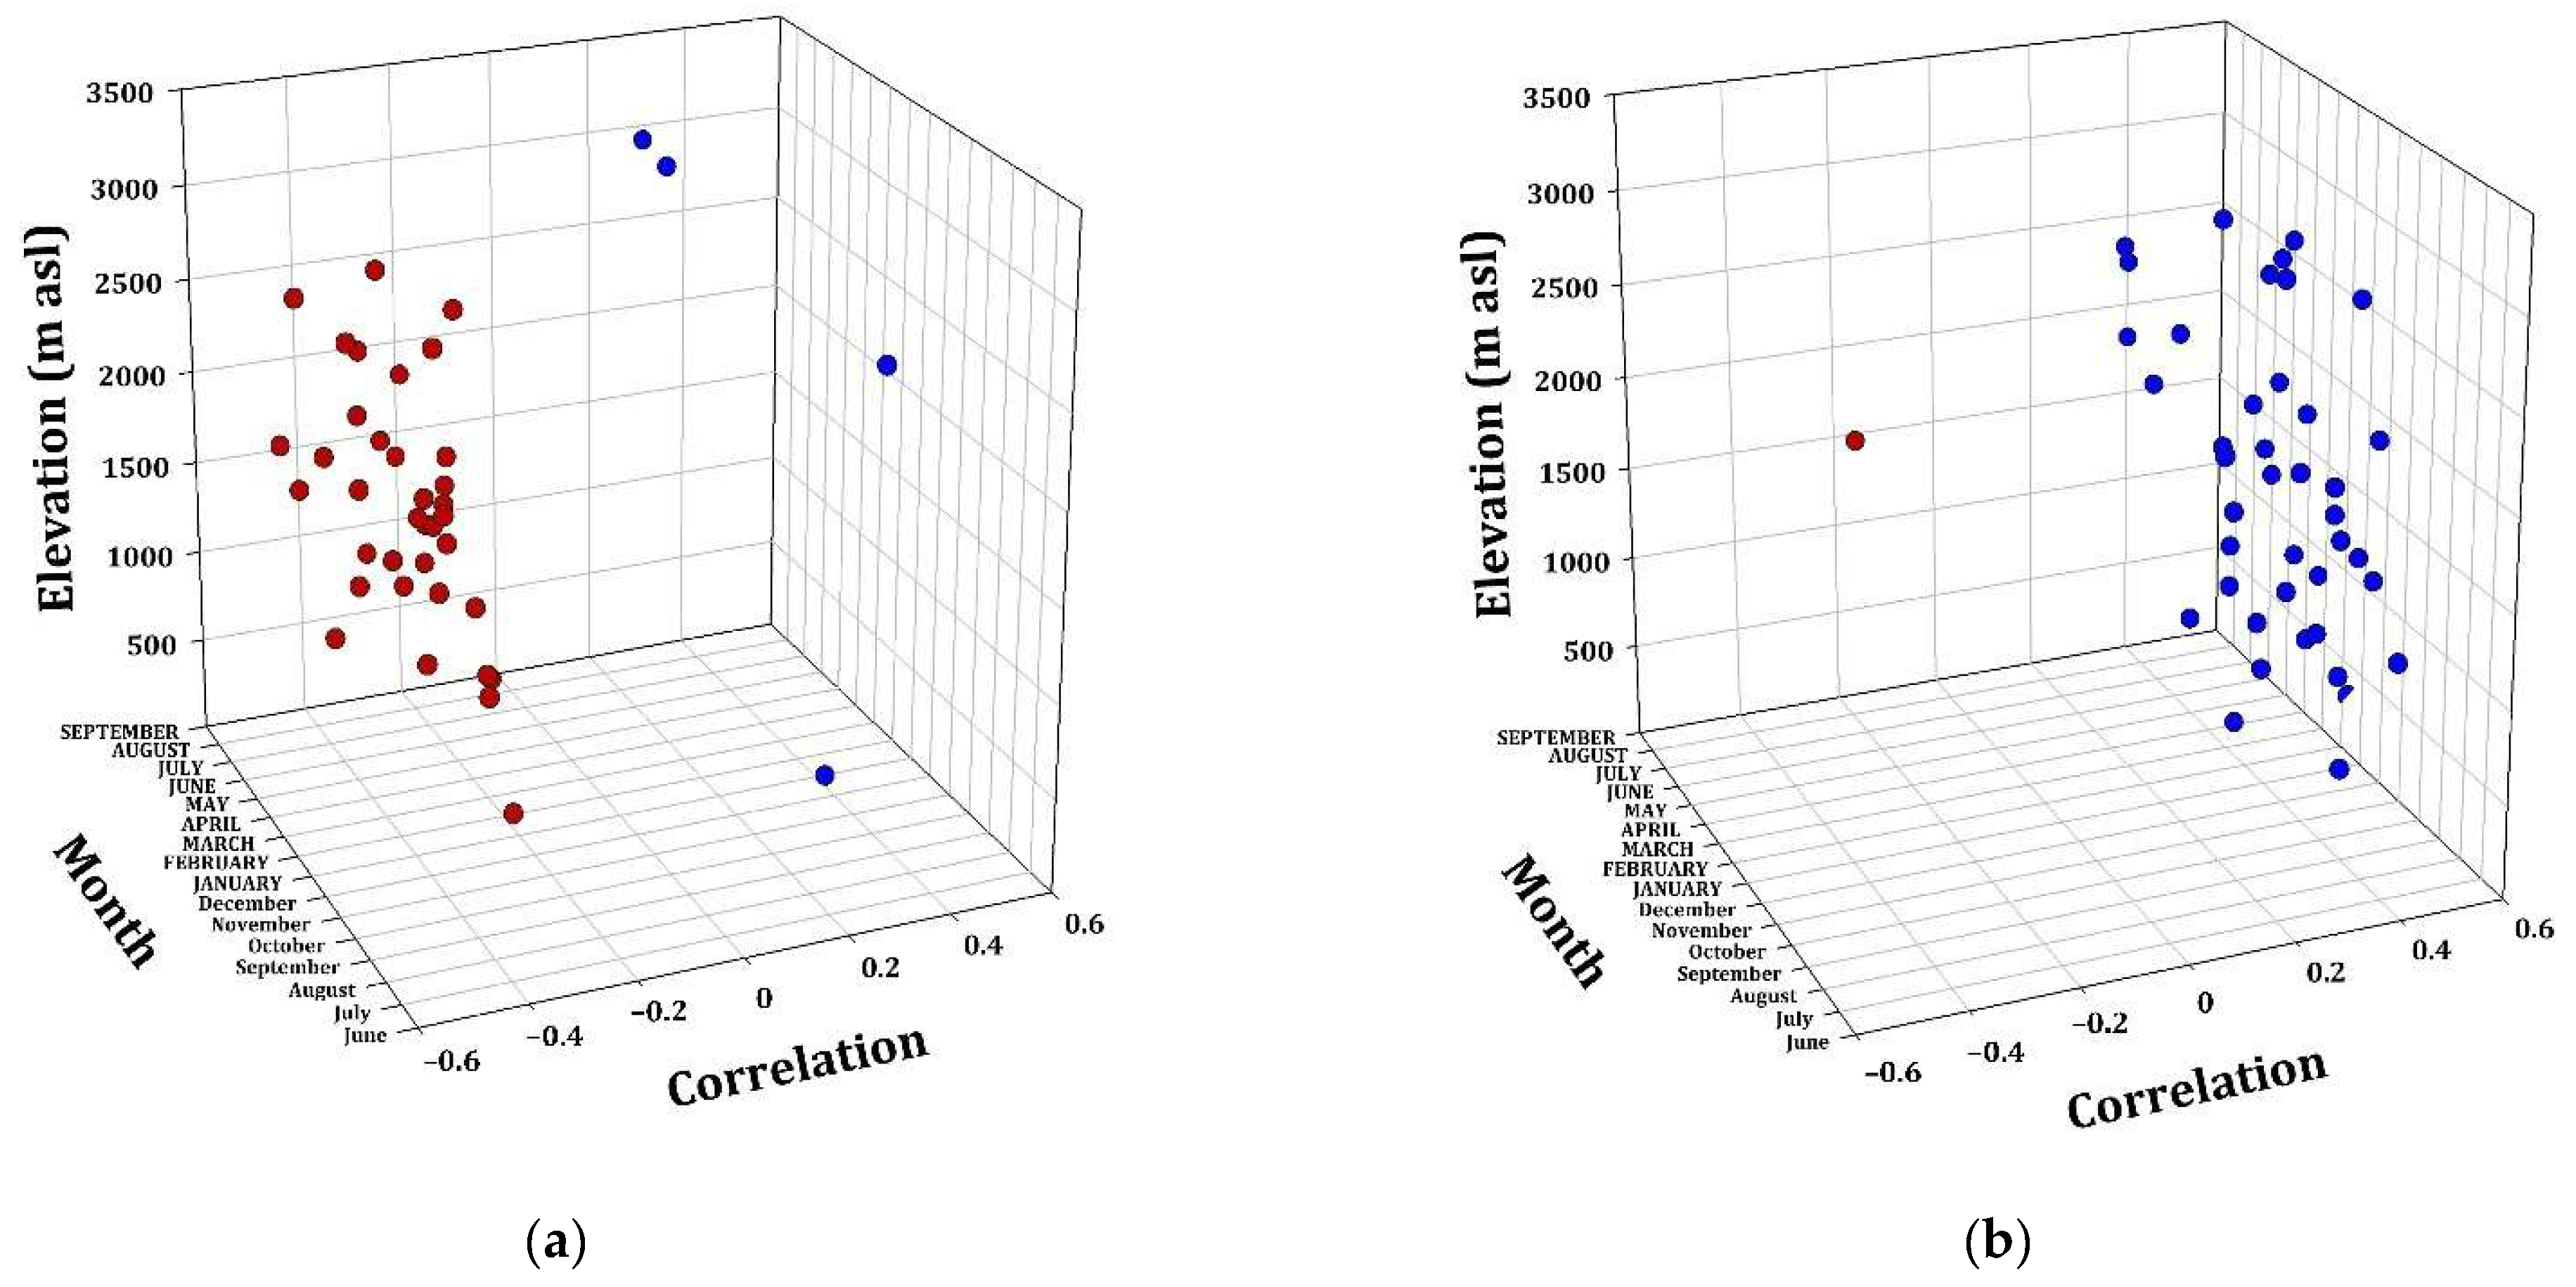
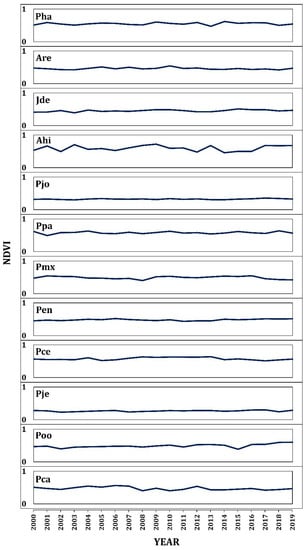
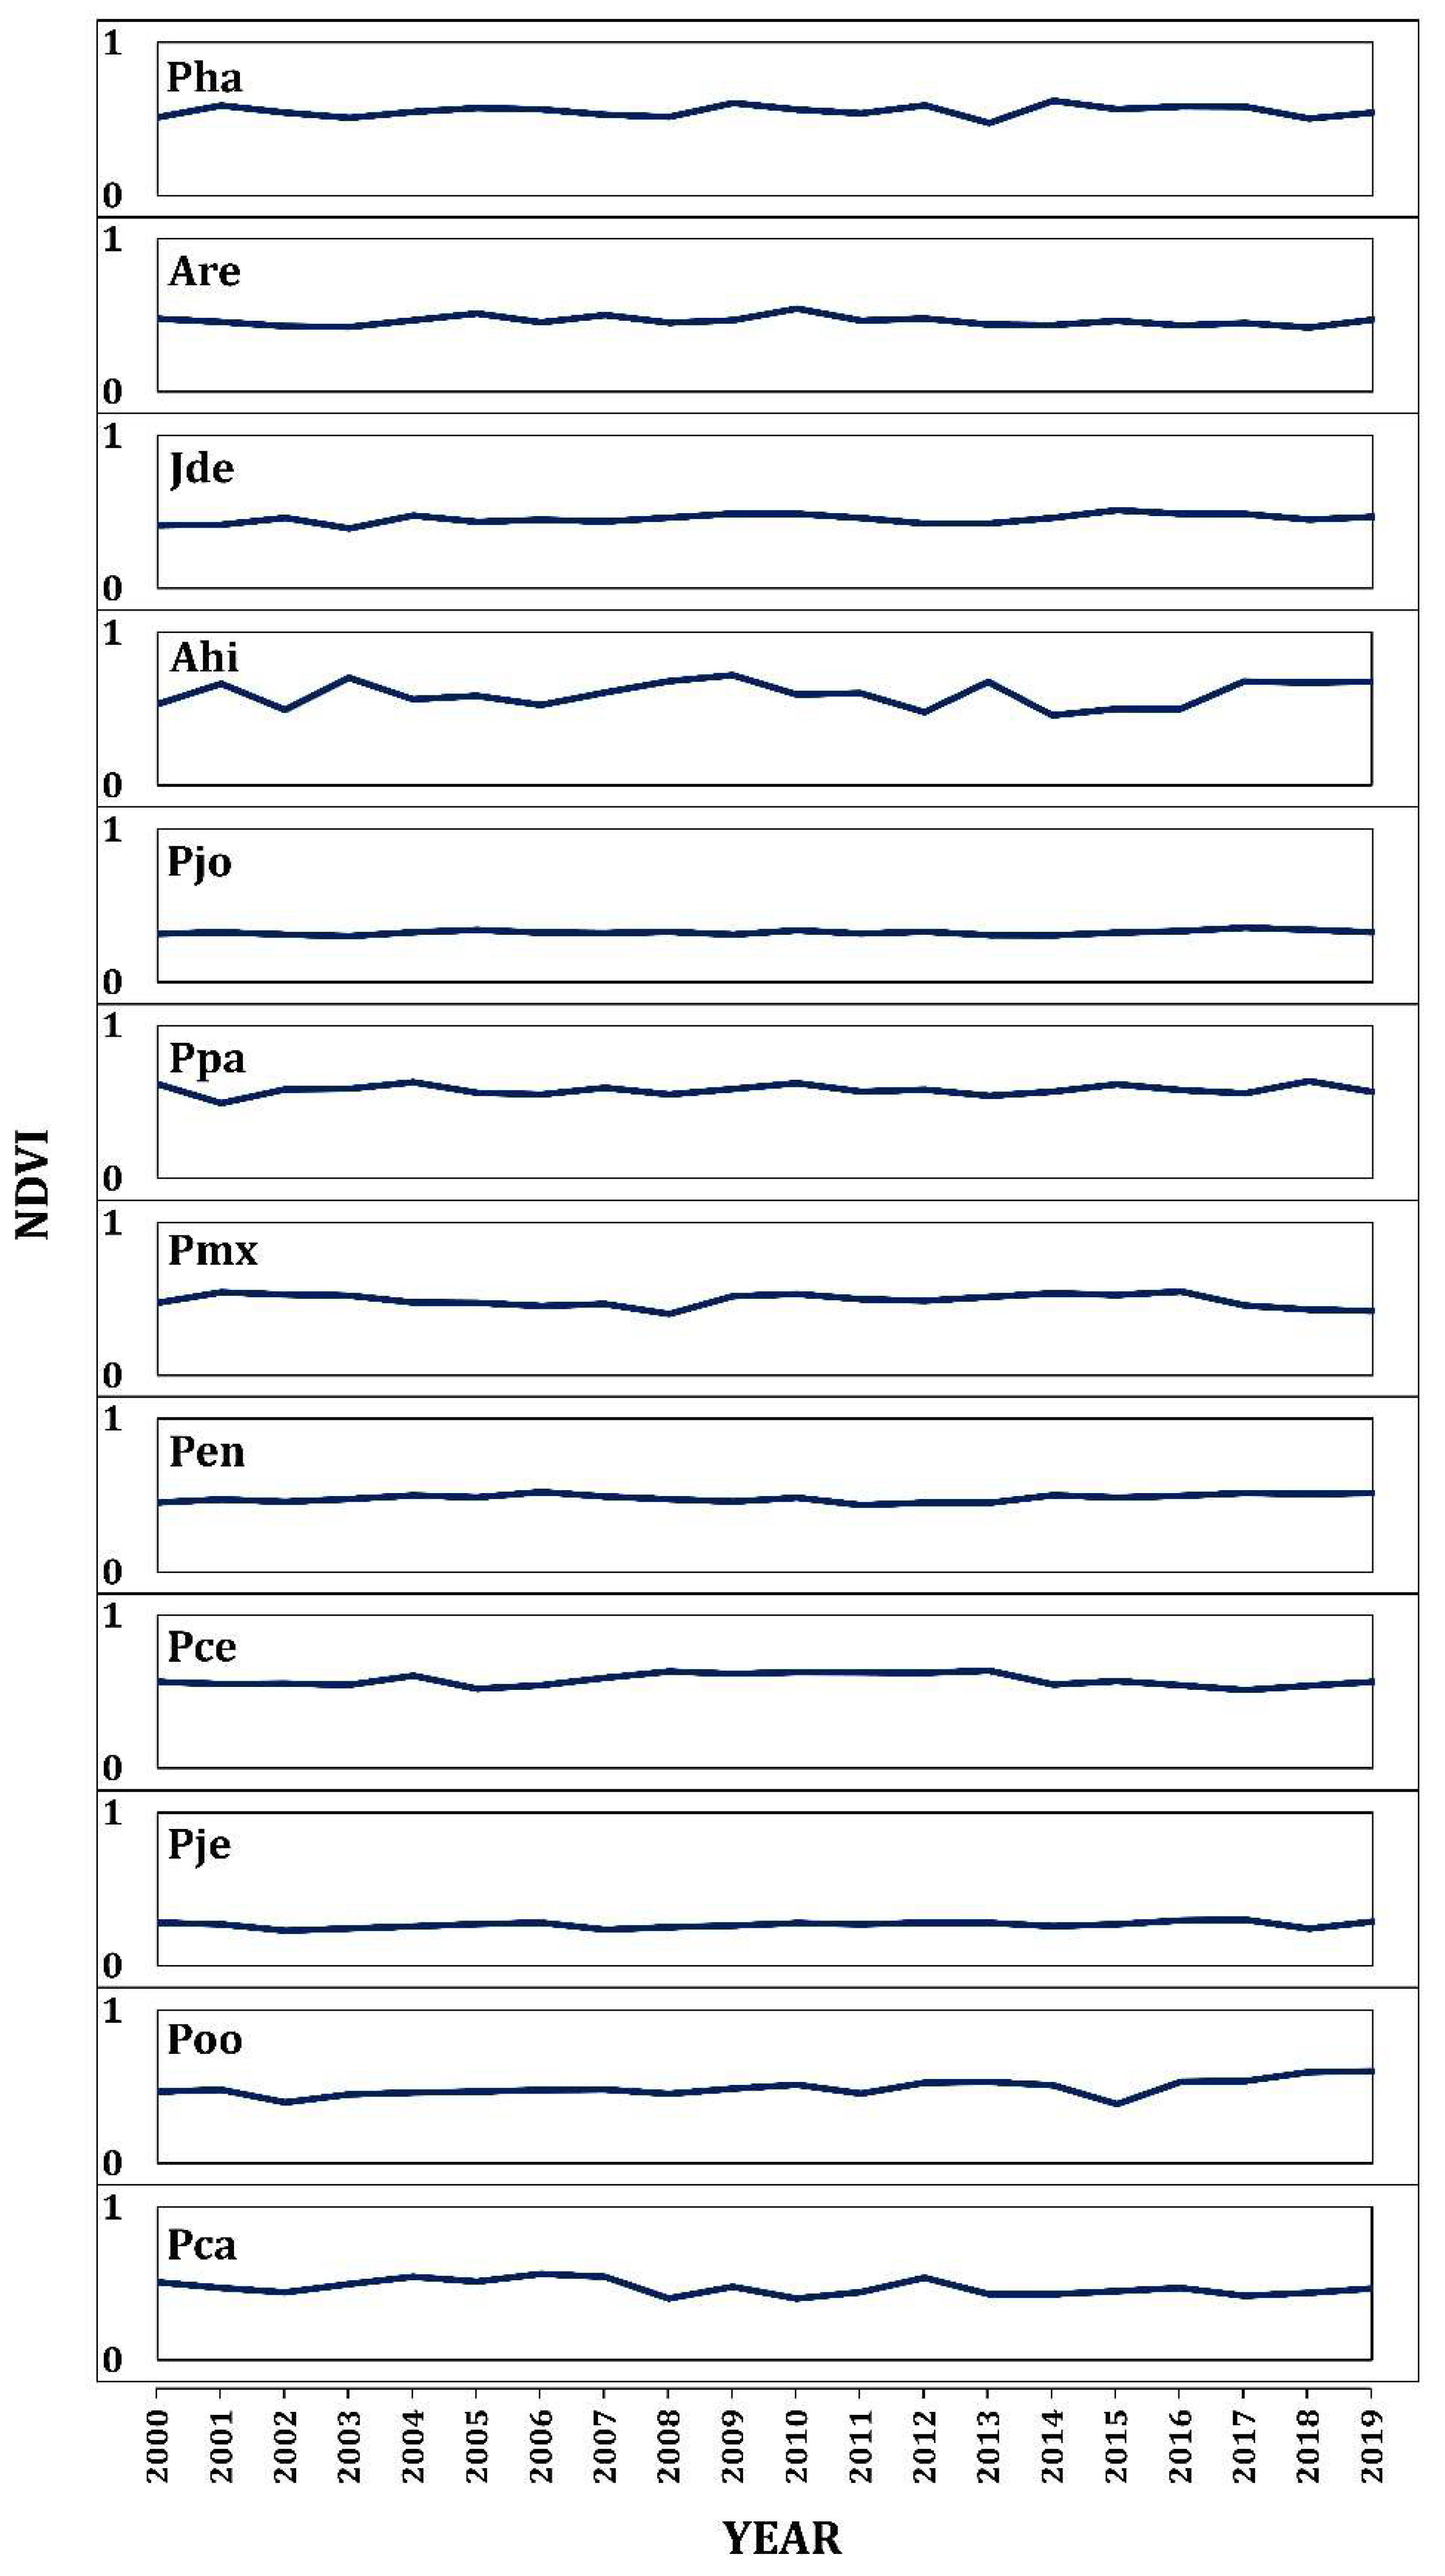
Figure A3.
Annual average of NDVI for twelve studied species.
Figure A3.
Annual average of NDVI for twelve studied species.
References
- Brockerhoff, E.G.; Barbaro, L.; Castagneyrol, B.; Forrester, D.I.; Gardiner, B.; González-Olabarria, J.R.; Lyver, P.O.; Meurisse, N.; Oxbrough, A.; Taki, H.; et al. Forest Biodiversity, Ecosystem Functioning and the Provision of Ecosystem Services. Biodivers. Conserv. 2017, 26, 3005–3035. [Google Scholar] [CrossRef]
- Kuuluvainen, T.; Gauthier, S. Young and Old Forest in the Boreal: Critical Stages of Ecosystem Dynamics and Management under Global Change. For. Ecosyst. 2018, 5, 26. [Google Scholar] [CrossRef]
- Torres-Rojo, J.M.; Moreno-Sánchez, R.; Mendoza-Briseño, M.A. Sustainable Forest Management in Mexico. Curr. For. Rep. 2016, 2, 93–105. [Google Scholar] [CrossRef]
- Grantham, H.S.; Duncan, A.; Evans, T.D.; Jones, K.R.; Beyer, H.L.; Schuster, R.; Walston, J.; Ray, J.C.; Robinson, J.G.; Callow, M.; et al. Anthropogenic Modification of Forests Means Only 40% of Remaining Forests Have High Ecosystem Integrity. Nat. Commun. 2020, 11, 5978. [Google Scholar] [CrossRef]
- Kuuluvainen, T.; Angelstam, P.; Frelich, L.; Jõgiste, K.; Koivula, M.; Kubota, Y.; Lafleur, B.; Macdonald, E. Natural Disturbance-Based Forest Management: Moving beyond Retention and Continuous-Cover Forestry. Front. For. Glob. Change 2021, 4, 629020. [Google Scholar] [CrossRef]
- Allen, C.D.; Macalady, A.K.; Chenchouni, H.; Bachelet, D.; McDowell, N.; Vennetier, M.; Kitzberger, T.; Rigling, A.; Breshears, D.D.; Hogg, E.H.; et al. A Global Overview of Drought and Heat-Induced Tree Mortality Reveals Emerging Climate Change Risks for Forests. For. Ecol. Manag. 2010, 259, 660–684. [Google Scholar] [CrossRef]
- Báez, S.; Malizia, A.; Carilla, J.; Blundo, C.; Aguilar, M.; Aguirre, N.; Aquirre, Z.; Álvarez, E.; Cuesta, F.; Duque, Á.; et al. Large-Scale Patterns of Turnover and Basal Area Change in Andean Forests. PLoS ONE 2015, 10, e0126594. [Google Scholar] [CrossRef]
- Aquilué, N.; Filotas, É.; Craven, D.; Fortin, M.-J.; Brotons, L.; Messier, C. Evaluating Forest Resilience to Global Threats Using Functional Response Traits and Network Properties. Ecol. Appl. 2020, 30, e02095. [Google Scholar] [CrossRef]
- Mina, M.; Messier, C.; Duveneck, M.; Fortin, M.-J.; Aquilué, N. Network Analysis Can Guide Resilience-Based Management in Forest Landscapes under Global Change. Ecol. Appl. 2021, 31, e2221. [Google Scholar] [CrossRef]
- Babst, F.; Alexander, R.; Szejner, P.; Bouriaud, O.; Klesse, S.; Roden, J.; Ciais, P.; Poulter, B.; Frank, D.; Moore, D.J.P. A Tree-Ring Perspective on the Terrestrial Carbon Cycle. Oecologia 2014, 176, 307–322. [Google Scholar] [CrossRef] [Green Version]
- Xu, K.; Wang, X.; Liang, P.; An, H.; Sun, H.; Han, W.; Li, Q. Tree-Ring Widths Are Good Proxies of Annual Variation in Forest Productivity in Temperate Forests. Sci. Rep. 2017, 7, 1945. [Google Scholar] [CrossRef]
- Wang, J.; Jiang, F.; Wang, H.; Qiu, B.; Wu, M.; He, W.; Ju, W.; Zhang, Y.; Chen, J.M.; Zhou, Y. Constraining Global Terrestrial Gross Primary Productivity in a Global Carbon Assimilation System with OCO-2 Chlorophyll Fluorescence Data. Agric. For. Meteorol. 2021, 304, 108424. [Google Scholar] [CrossRef]
- Ruiz-Benito, P.; Madrigal-González, J.; Ratcliffe, S.; Coomes, D.A.; Kändler, G.; Lehtonen, A.; Wirth, C.; Zavala, M.A. Stand Structure and Recent Climate Change Constrain Stand Basal Area Change in European Forests: A Comparison Across Boreal, Temperate, and Mediterranean Biomes. Ecosystems 2014, 17, 1439–1454. [Google Scholar] [CrossRef]
- Ryan, M.G.; Binkley, D.; Fownes, J.H. Age-Related Decline in Forest Productivity: Pattern and Process. Adv. Ecol. Res. 1997, 27, 213–262. [Google Scholar]
- He, L.; Chen, J.M.; Pan, Y.; Birdsey, R.; Kattge, J. Relationships between Net Primary Productivity and Forest Stand Age in US Forests. Glob. Biogeochem. Cycles 2012, 26, 1–19. [Google Scholar] [CrossRef]
- Pompa-García, M.; Hadad, M.A. Sensitivity of Pines in Mexico to Temperature Varies with Age. Atmósfera 2016, 29, 209–219. [Google Scholar] [CrossRef]
- Metsaranta, J.M.; Bhatti, J.S. Evaluation of Whole Tree Growth Increment Derived from Tree-Ring Series for Use in Assessments of Changes in Forest Productivity across Various Spatial Scales. Forests 2016, 7, 303. [Google Scholar] [CrossRef]
- Teets, A.; Fraver, S.; Hollinger, D.Y.; Weiskittel, A.R.; Seymour, R.S.; Richardson, A.D. Linking Annual Tree Growth with Eddy-Flux Measures of Net Ecosystem Productivity across Twenty Years of Observation in a Mixed Conifer Forest. Agric. For. Meteorol. 2018, 249, 479–487. [Google Scholar] [CrossRef]
- Xu, K.; Wang, X.; Liang, P.; Wu, Y.; An, H.; Sun, H.; Wu, P.; Wu, X.; Li, Q.; Guo, X.; et al. A New Tree-Ring Sampling Method to Estimate Forest Productivity and Its Temporal Variation Accurately in Natural Forests. For. Ecol. Manag. 2019, 433, 217–227. [Google Scholar] [CrossRef]
- Mérian, P.; Lebourgeois, F. Size-Mediated Climate–Growth Relationships in Temperate Forests: A Multi-Species Analysis. For. Ecol. Manag. 2011, 261, 1382–1391. [Google Scholar] [CrossRef]
- Trouillier, M.; van der Maaten-Theunissen, M.; Scharnweber, T.; Würth, D.; Burger, A.; Schnittler, M.; Wilmking, M. Size Matters—A Comparison of Three Methods to Assess Age- and Size-Dependent Climate Sensitivity of Trees. Trees 2019, 33, 183–192. [Google Scholar] [CrossRef]
- Lockwood, B.R.; Maxwell, J.T.; Robeson, S.M.; Au, T.F. Assessing Bias in Diameter at Breast Height Estimated from Tree Rings and Its Effects on Basal Area Increment and Biomass. Dendrochronologia 2021, 67, 125844. [Google Scholar] [CrossRef]
- Babst, F.; Esper, J.; Parlow, E. Landsat TM/ETM+ and Tree-Ring Based Assessment of Spatiotemporal Patterns of the Autumnal Moth (Epirrita Autumnata) in Northernmost Fennoscandia. Remote Sens. Environ. 2010, 114, 637–646. [Google Scholar] [CrossRef]
- Erasmi, S.; Klinge, M.; Dulamsuren, C.; Schneider, F.; Hauck, M. Modelling the Productivity of Siberian Larch Forests from Landsat NDVI Time Series in Fragmented Forest Stands of the Mongolian Forest-Steppe. Environ. Monit. Assess. 2021, 193, 200. [Google Scholar] [CrossRef] [PubMed]
- Wang, Z.; Lyu, L.; Liu, W.; Liang, H.; Huang, J.; Zhang, Q.-B. Topographic Patterns of Forest Decline as Detected from Tree Rings and NDVI. CATENA 2021, 198, 105011. [Google Scholar] [CrossRef]
- Zheng, W.; Liu, Y.; Yang, X.; Fan, W. Spatiotemporal Variations of Forest Vegetation Phenology and Its Response to Climate Change in Northeast China. Remote Sens. 2022, 14, 2909. [Google Scholar] [CrossRef]
- Brehaut, L.; Danby, R.K. Inconsistent Relationships between Annual Tree Ring-Widths and Satellite-Measured NDVI in a Mountainous Subarctic Environment. Ecol. Indic. 2018, 91, 698–711. [Google Scholar] [CrossRef]
- Gorelick, N.; Hancher, M.; Dixon, M.; Ilyushchenko, S.; Thau, D.; Moore, R. Google Earth Engine: Planetary-Scale Geospatial Analysis for Everyone. Remote Sens. Environ. 2017, 202, 18–27. [Google Scholar] [CrossRef]
- Roces-Díaz, J.V.; Vayreda, J.; De Cáceres, M.; García-Valdés, R.; Banqué-Casanovas, M.; Morán-Ordóñez, A.; Brotons, L.; de-Miguel, S.; Martínez-Vilalta, J. Temporal Changes in Mediterranean Forest Ecosystem Services Are Driven by Stand Development, Rather than by Climate-Related Disturbances. For. Ecol. Manag. 2021, 480, 118623. [Google Scholar] [CrossRef]
- Correa-Díaz, A.; Silva, L.C.R.; Horwath, W.R.; Gómez-Guerrero, A.; Vargas-Hernández, J.; Villanueva-Díaz, J.; Velázquez-Martínez, A.; Suárez-Espinoza, J. Linking Remote Sensing and Dendrochronology to Quantify Climate-Induced Shifts in High-Elevation Forests Over Space and Time. J. Geophys. Res. Biogeosci. 2019, 124, 166–183. [Google Scholar] [CrossRef]
- Vivar-Vivar, E.D.; Pompa-García, M.; Rodríguez-Trejo, D.A.; Leyva-Ovalle, A.; Wehenkel, C.; Carrillo-Parra, A.; Moreno-Anguiano, O. Drought responsiveness in two Mexican conifer species forming young stands at high elevations. For. Syst. 2021, 30, e012. [Google Scholar] [CrossRef]
- Acosta-Hernández, A.C.; Pompa-García, M.; Camarero, J.J. An Updated Review of Dendrochronological Investigations in Mexico, a Megadiverse Country with a High Potential for Tree-Ring Sciences. Forests 2017, 8, 160. [Google Scholar] [CrossRef]
- Villanueva Díaz, J.; Cerano Paredes, J.; Fulé, P.Z.; Cortés Montaño, C.; Vázquez Selem, L.; Yocom, L.L.; Ruiz-Corral, J.A. Cuatro Siglos de Variabilidad Hidroclimática En El Noroeste de Chihuahua, México, Reconstruida Con Anillos de Árboles. Investig. Geogr. 2015, 1, 141–153. [Google Scholar] [CrossRef]
- Herrera-Soto, G.; González-Cásares, M.; Pompa-García, M.; Camarero, J.J.; Solís-Moreno, R. Growth of Pinus Cembroides Zucc. in Response to Hydroclimatic Variability in Four Sites Forming the Species Latitudinal and Longitudinal Distribution Limits. Forests 2018, 9, 440. [Google Scholar] [CrossRef]
- Gernandt, D.S.; Pérez-de la Rosa, J.A. Biodiversidad de Pinophyta (Coníferas) En México. Rev. Mex. Biodivers. 2014, 85, 126–133. [Google Scholar] [CrossRef]
- Malhi, Y.; Silman, M.; Salinas, N.; Bush, M.; Meir, P.; Saatchi, S. Introduction: Elevation gradients in the tropics: Laboratories for ecosystem ecology and global change research. Glob. Change Biol. 2010, 16, 3171–3175. [Google Scholar] [CrossRef]
- Cleveland, C.C.; Townsend, A.R.; Taylor, P.; Alvarez-Clare, S.; Bustamante, M.M.; Chuyong, G.; Dobrowski, S.Z.; Grierson, P.; Harms, K.E.; Houlton, B.Z.; et al. Relationships among net primary productivity, nutrients and climate in tropical rain forest: A pan-tropical analysis. Ecol. Lett. 2011, 14, 939–947. [Google Scholar] [CrossRef]
- Farjon, A.; Filer, D. An Atlas of the World’s Conifers: An Analysis of Their Distribution, Biogeography, Diversity and Conservation Status; Brill: Leiden, The Netherlands, 2013; ISBN 978-90-04-21181-0. [Google Scholar]
- Holmes, R.L. Computer assisted quality control. Tree Ring Bull. 1983, 43, 69–78. [Google Scholar]
- Bunn, A.G. A Dendrochronology Program Library in R (DplR). Dendrochronologia 2008, 26, 115–124. [Google Scholar] [CrossRef]
- R Core Team. R: A Language and Environment for Statistical Computing; R Foundation for Statistical Computing: Vienna, Austria, 2013. [Google Scholar]
- Wigley, T.M.L.; Briffa, K.R.; Jones, P.D. On the Average Value of Correlated Time-Series, with Applications in Dendroclimatology and Hydrometeorology. J. Clim. Appl. Meteorol. 1984, 23, 201–213. [Google Scholar] [CrossRef]
- Trouet, V.; Oldenborgh, G.J. Van KNMI Climate Explorer: A Web-Based Research Tool for High-Resolution Paleoclimatology. Tree Ring Res. 2013, 69, 3–13. [Google Scholar] [CrossRef]
- Harris, I.; Osborn, T.J.; Jones, P.; Lister, D. Version 4 of the CRU TS Monthly High-Resolution Gridded Multivariate Climate Dataset. Sci. Data 2020, 7, 109. [Google Scholar] [CrossRef] [PubMed] [Green Version]
- Beguería, S.; Vicente-Serrano, S.M.; Reig, F.; Latorre, B. Standardized Precipitation Evapotranspiration Index (SPEI) Revisited: Parameter Fitting, Evapotranspiration Models, Tools, Datasets and Drought Monitoring. Int. J. Climatol. 2014, 34, 3001–3023. [Google Scholar] [CrossRef]
- Pompa-García, M.; Sánchez-Salguero, R.; Camarero, J.J. Observed and projected impacts of climate on radial growth of three endangered conifers in northern Mexico indicate high vulnerability of drought-sensitive species from mesic habitats. Dendrochronologia 2017, 45, 145–155. [Google Scholar] [CrossRef]
- Dinno, A.; Dinno, M.A. Package ‘dunn. test’. CRAN Repos 2017, 10, 1–7. [Google Scholar]
- Pohlert, T. PMCMRplus: Calculate Pairwise Multiple Comparisons of Mean Rank Sums Extended 2021. Available online: https://www.quantargo.com/help/r/latest/packages/PMCMRplus/1.9.0 (accessed on 16 December 2021).
- Sader, S.A.; Winne, J.C. RGB-NDVI colour composites for visualizing forest change dynamics. Int. J. Remote Sens. 1992, 13, 3055–3067. [Google Scholar] [CrossRef]
- Allan, R.P.; Hawkins, E.; Bellouin, N.; Collins, B. IPCC, 2021: Summary for Policymakers. In Climate Change 2021: The Physical Science Basis. Contribution of Working Group I to the Sixth Assessment Report of the Intergovernmental Panel on Climate Change; Masson-Delmotte, V., Zhai, P., Pirani, A., Connors, S.L., Péan, C., Berger, S., Caud, N., Chen, Y., Goldfarb, L., Gomis, M.I., et al., Eds.; Cambridge University Press: Cambridge, UK, 2021; pp. 3–32. [Google Scholar]
- González-Cásares, M.; Pompa-García, M.; Camarero, J.J. Differences in Climate–Growth Relationship Indicate Diverse Drought Tolerances among Five Pine Species Coexisting in Northwestern Mexico. Trees 2017, 31, 531–544. [Google Scholar] [CrossRef]
- Pompa-García, M.; González-Cásares, M.; Acosta-Hernández, A.C.; Camarero, J.J.; Rodríguez-Catón, M. Drought Influence over Radial Growth of Mexican Conifers Inhabiting Mesic and Xeric Sites. Forests 2017, 8, 175. [Google Scholar] [CrossRef]
- Tumajer, J.; Scharnweber, T.; Smiljanic, M.; Wilmking, M. Limitation by Vapour Pressure Deficit Shapes Different Intra-Annual Growth Patterns of Diffuse- and Ring-Porous Temperate Broadleaves. New Phytol. 2022, 233, 2429–2441. [Google Scholar] [CrossRef]
- Pompa-García, M.; González-Cásares, M.; Gazol, A.; Camarero, J.J. Run to the Hills: Forest Growth Responsiveness to Drought Increased at Higher Elevation during the Late 20th Century. Sci. Total Environ. 2021, 772, 145286. [Google Scholar] [CrossRef]
- Hughes, M.K.; Kelly, M.P.; Pilcher, J.R.; Lamarche, V.C. Climate from Tree Rings. In Climate from Tree Rings; Cambridge University Press: Cambridge, UK, 1982. [Google Scholar]
- Adams, H.D.; Kolb, T.E. Tree Growth Response to Drought and Temperature in a Mountain Landscape in Northern Arizona, USA. J. Biogeogr. 2005, 32, 1629–1640. [Google Scholar] [CrossRef]
- D’Arrigo, R.; Davi, N.; Jacoby, G.; Wilson, R.; Wiles, G. Dendroclimatic Studies: Tree Growth and Climate Change in Northern Forests; John Wiley & Sons: Hoboken, NJ, USA, 2014; ISBN 1118848713. [Google Scholar]
- Murray-Tortarolo, G.N. Seven Decades of Climate Change across Mexico. Atmósfera 2021, 34, 217–226. [Google Scholar] [CrossRef]
- Huang, J.; Tarif, J.C.; Bergeron, Y.; Denneler, B.; Berninger, F.; Girardin, M.P. Radial Growth Response of Four Dominant Boreal Tree Species to Climate along a Latitudinal Gradient in the Eastern Canadian Boreal Forest. Glob. Change Biol. 2010, 16, 711–731. [Google Scholar] [CrossRef]
- Commission for Environmental Cooperation. Ecological Regions of North America. Toward a Common Perspective; Commission for Environmental Cooperation: Montreal, QC, Canada, 1997. [Google Scholar]
- Urrutia-Jalabert, R.; Barichivich, J.; Rozas, V.; Lara, A.; Rojas, Y.; Bahamondez, C.; Rojas-Badilla, M.; Gipoulou-Zuñiga, T.; Cuq, E. Climate Response and Drought Resilience of Nothofagus Obliqua Secondary Forests across a Latitudinal Gradient in South-Central Chile. For. Ecol. Manag. 2021, 485, 118962. [Google Scholar] [CrossRef]
- Núñez-García, A.; Gómez-Guerrero, A.; Terrazas-Salgado, T.M.; Vargas-Hernández, J.J.; Villanueva-Díaz, J. Analysis of Basal Area Increment of Pinus hartwegii Lindl. at Different Elevations and Aspects on Jocotitlan Mountain, State of Mexico. Rev. Chapingo Ser. Ciencias For. Y Del Ambient 2020, 27, 77–88. [Google Scholar] [CrossRef]
- Coomes, D.A.; Allen, R.B. Effects of Size, Competition and Altitude on Tree Growth. J. Ecol. 2007, 95, 1084–1097. [Google Scholar] [CrossRef]
- Malizia, A.; Blundo, C.; Carilla, J.; Osinaga Acosta, O.; Cuesta, F.; Duque, A.; Aguirre, N.; Aguirre, Z.; Ataroff, M.; Baez, S.; et al. Elevation and Latitude Drives Structure and Tree Species Composition in Andean Forests: Results from a Large-Scale Plot Network. PLoS ONE 2020, 15, e0231553. [Google Scholar] [CrossRef]
- González-Cásares, M.; Camarero, J.J.; Colangelo, M.; Rita, A.; Pompa-García, M. High Responsiveness of Wood Anatomy to Water Availability and Drought near the Equatorial Rear Edge of Douglas-Fir. Can. J. For. Res. 2019, 49, 1114–1123. [Google Scholar] [CrossRef]
- Coulthard, B.L.; Touchan, R.; Anchukaitis, K.J.; Meko, D.M.; Sivrikaya, F. Tree Growth and Vegetation Activity at the Ecosystem-Scale in the Eastern Mediterranean. Environ. Res. Lett. 2017, 12, 084008. [Google Scholar] [CrossRef]
- Llyod, A.H.; Bunn, A.G.; Berner, L. A Latitudinal Gradient in Tree Growth Response to Climate Warming in the Siberian Taiga. Glob. Change Biol. 2011, 17, 1935–1945. [Google Scholar] [CrossRef]
- Beck, P.S.A.; Andreu-Hayles, L.; D’Arrigo, R.; Anchukaitis, K.J.; Tucker, C.J.; Pinzón, J.E.; Goetz, S.J. A Large-Scale Coherent Signal of Canopy Status in Maximum Latewood Density of Tree Rings at Arctic Treeline in North America. Glob. Planet. Change 2013, 100, 109–118. [Google Scholar] [CrossRef]
- Vicente-Serrano, S.M.; Camarero, J.J.; Olano, J.M.; Martín-Hernández, N.; Peña-Gallardo, M.; Tomás-Burguera, M.; Gazol, A.; Azorin-Molina, C.; Bhuyan, U.; El Kenawy, A. Diverse Relationships between Forest Growth and the Normalized Difference Vegetation Index at a Global Scale. Remote Sens. Environ. 2016, 187, 14–29. [Google Scholar] [CrossRef]
- Dash, J.P.; Pearse, G.D.; Watt, M.S. UAV Multispectral Imagery Can Complement Satellite Data for Monitoring Forest Health. Remote Sens. 2018, 10, 1216. [Google Scholar] [CrossRef] [Green Version]
- Che, J.; Jönsson, P.; Tamura, M.; Gu, Z.; Matsushita, B.; Eklundh, L. A simple method for reconstructing a high-quality NDVI time-series data set based on the Savitzky-Golay filter. Remote Sens. Environ. 2004, 91, 332–344. [Google Scholar] [CrossRef]
- Chen, J.M.; Deng, F.; Chen, M. Locally adjusted cubic-spline capping for reconstructing seasonal trajectories of a satellite-derived surface parameter. IEEE Trans. Geosci. Remote Sens. 2006, 44, 2230–2238. [Google Scholar] [CrossRef]
- Chu, D.; Shen, H.; Guan, X.; Chen, J.M.; Li, X.; Li, J.; Zhang, L. Long time-series NDVI reconstruction in cloud-prone regions via spatio-temporal tensor completion. Remote Sens. Environ. 2021, 264, 112632. [Google Scholar] [CrossRef]
- Vivar-Vivar, E.D.; Pompa-García, M.; Martínez-Rivas, J.A.; Mora-Tembre, L.A. UAV-Based Characterization of Tree-Attributes and Multispectral Indices in an Uneven-Aged Mixed Conifer-Broadleaf Forest. Remote Sens. 2022, 14, 2775. [Google Scholar] [CrossRef]
- Fritts, H.C. Tree Rings and Climate, 1st ed.; Academic Press Inc.: London, UK, 1976. [Google Scholar]


Publisher’s Note: MDPI stays neutral with regard to jurisdictional claims in published maps and institutional affiliations. |
© 2022 by the authors. Licensee MDPI, Basel, Switzerland. This article is an open access article distributed under the terms and conditions of the Creative Commons Attribution (CC BY) license (https://creativecommons.org/licenses/by/4.0/).