

Structural Characteristics of Endorheic Rivers in the Tarim Basin

Abstract
:1. Introduction
2. Materials and Methods
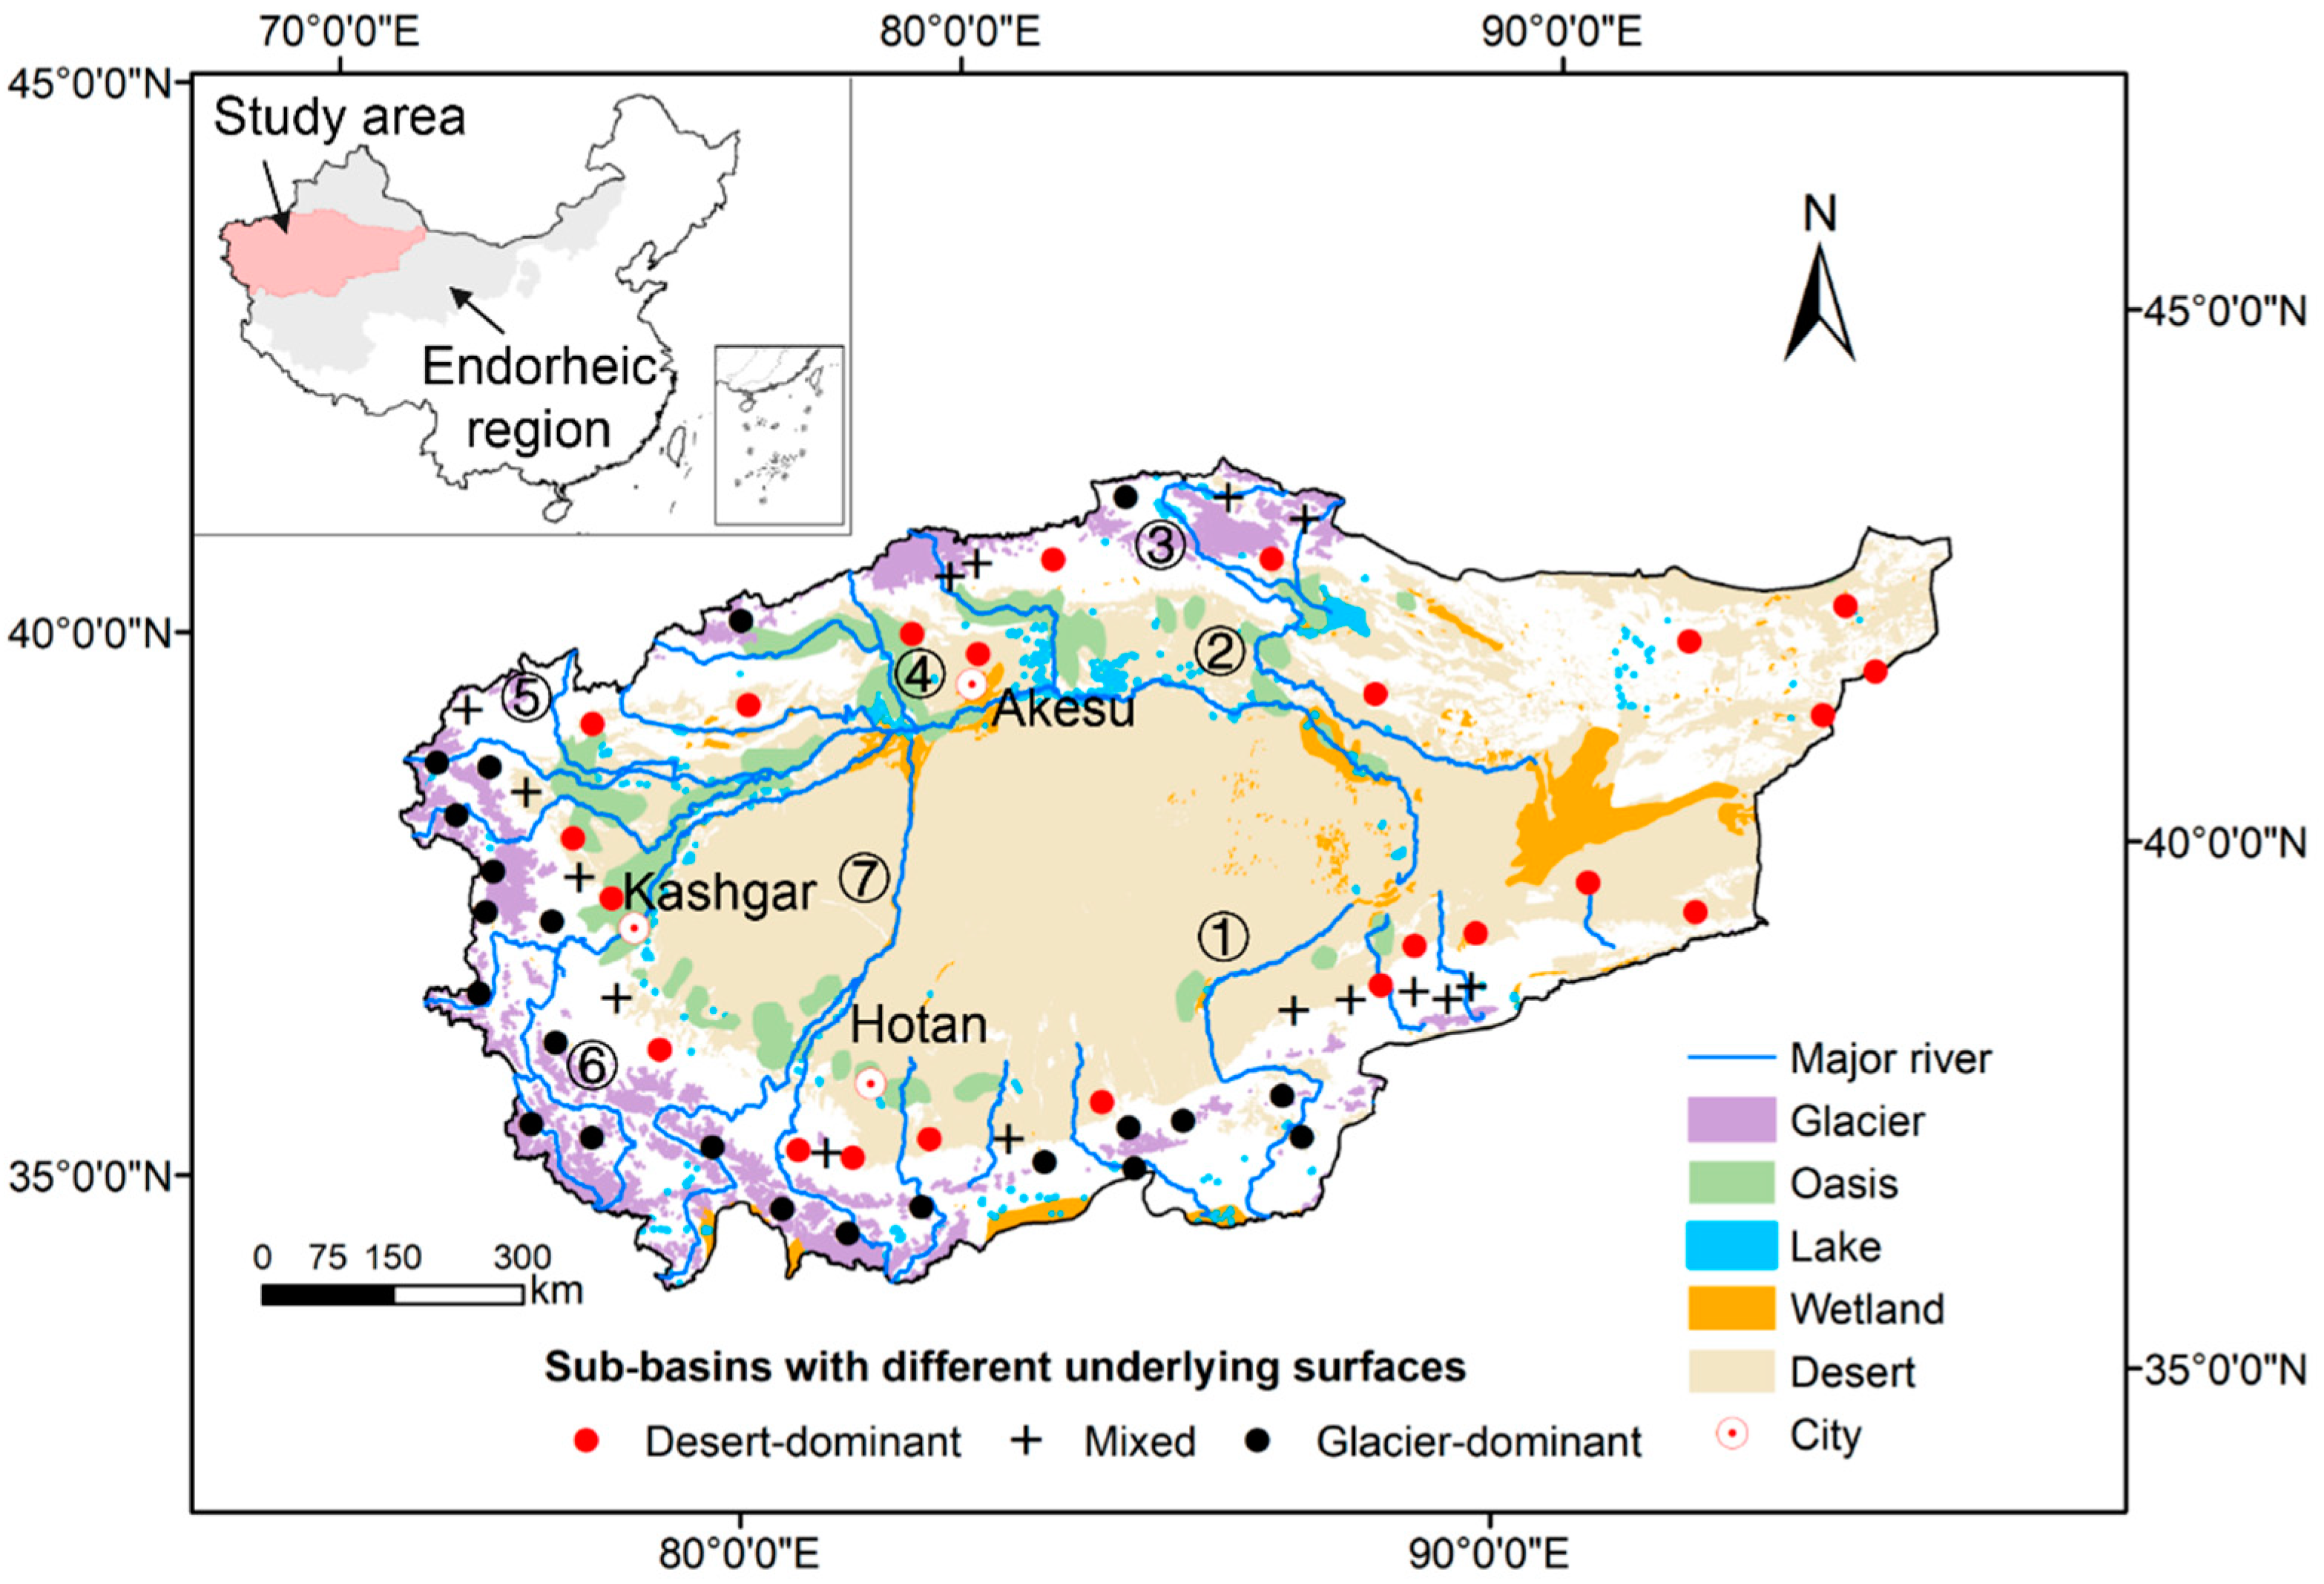
2.1. Study Area
2.2. Data Sources
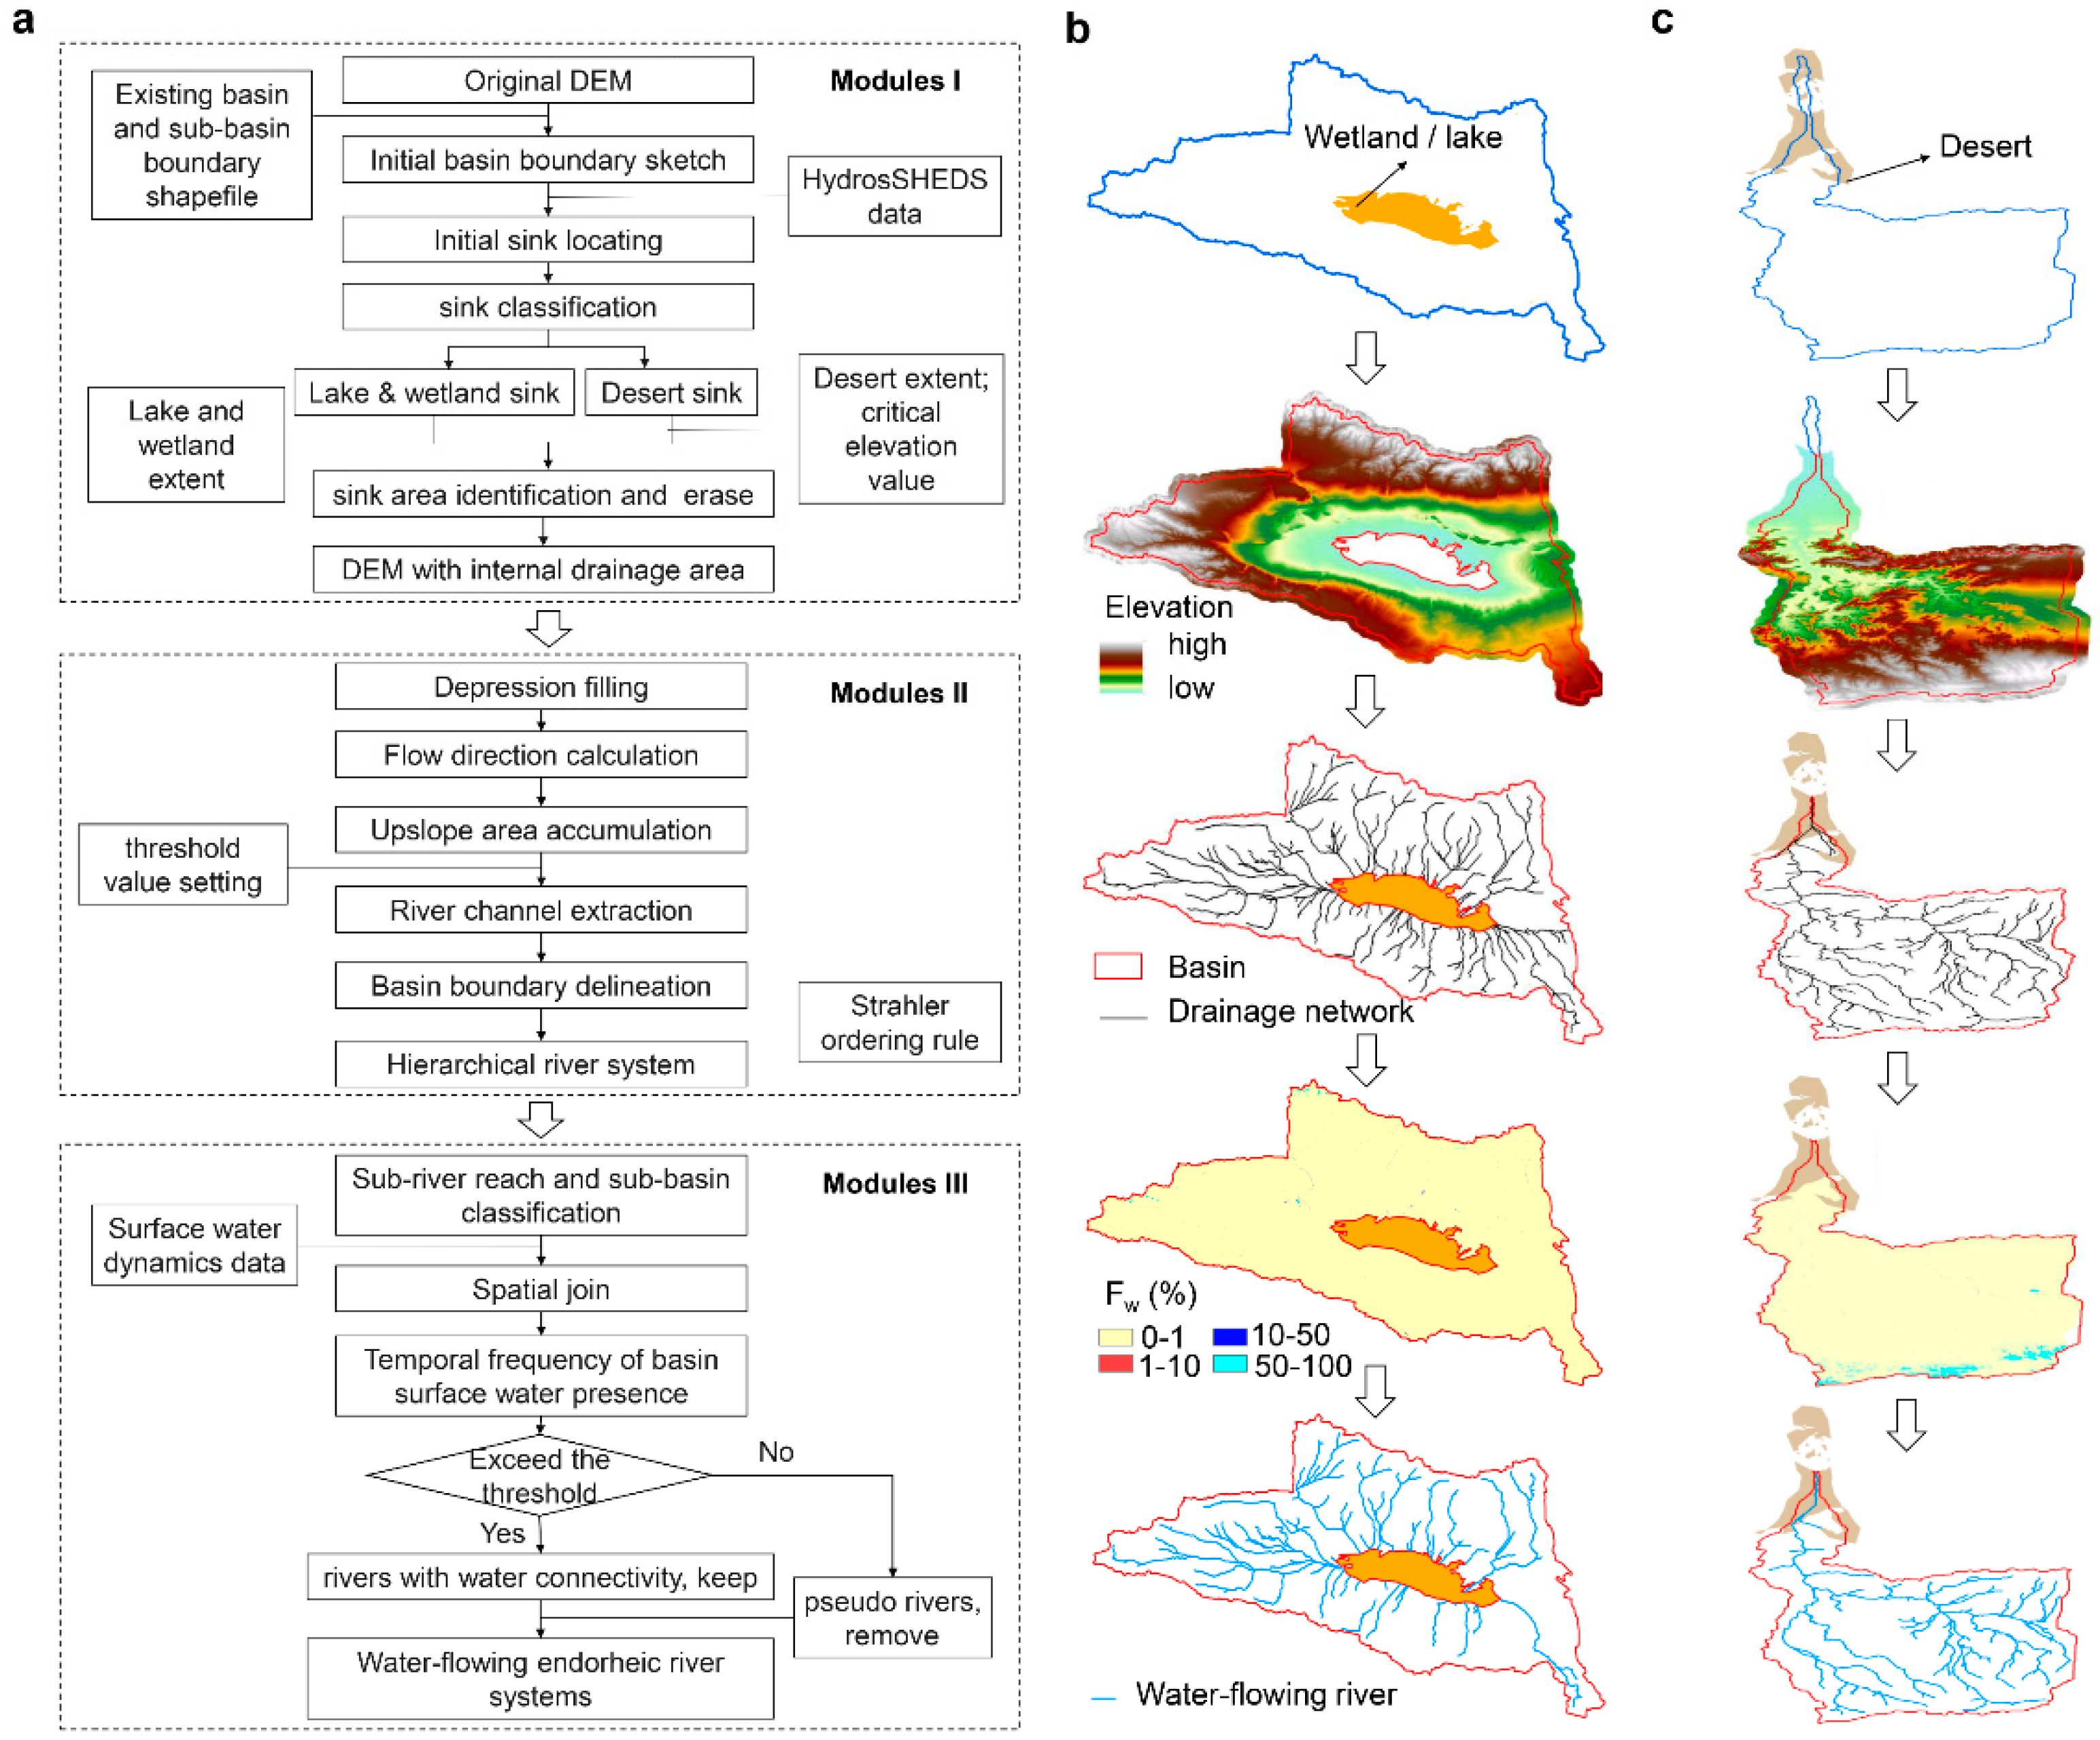
2.3. Identification of Hierachial Endorheic Rivers
2.3.1. Introduction of Internal Drainage Areas
2.3.2. Extraction of River Networks and Delineation of Basin Boundaries
2.3.3. Identification of Flowing Rivers
2.4. Characterization of River Networks
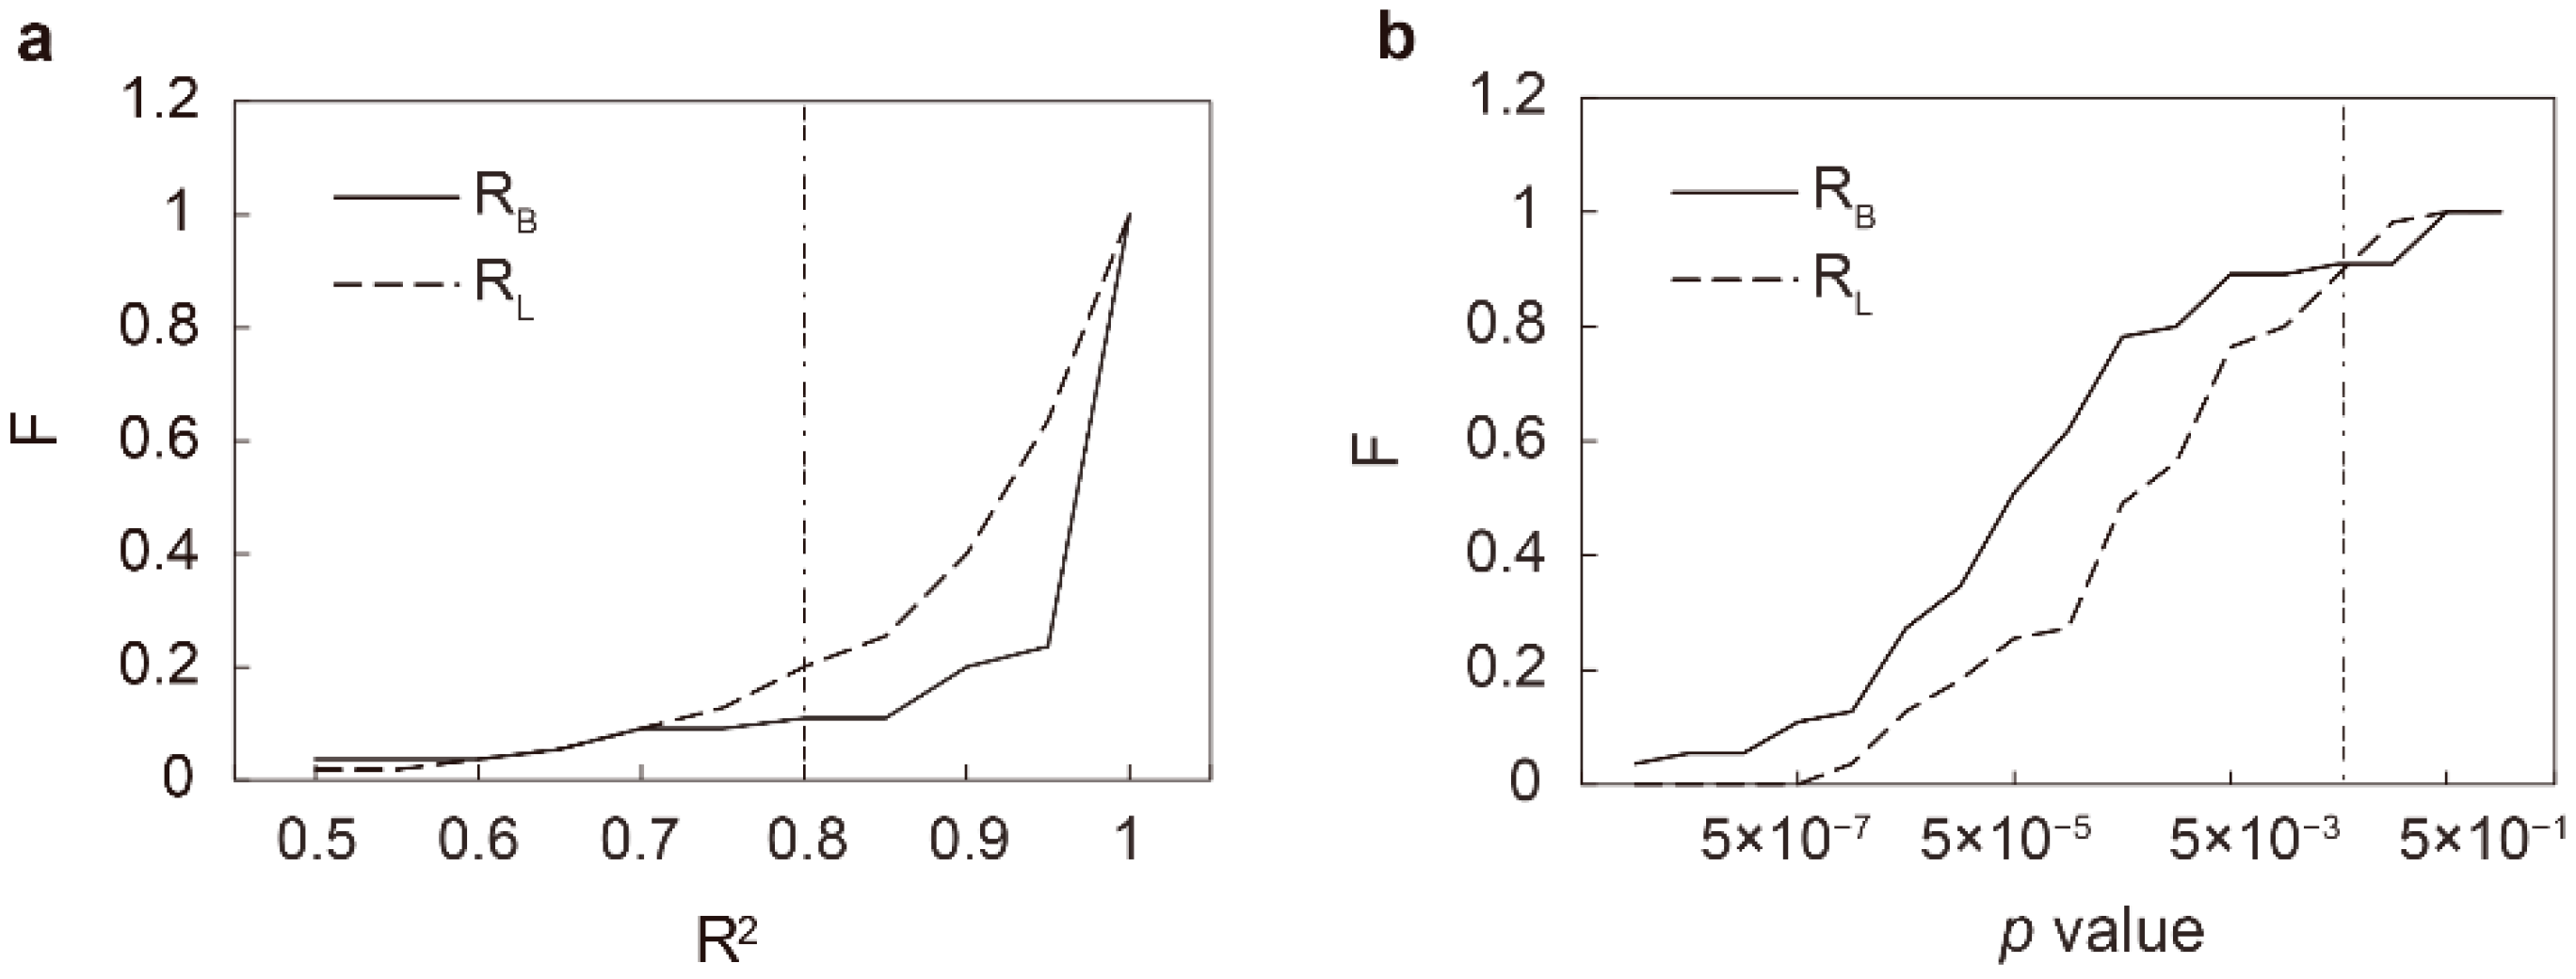
2.4.1. Test of the Horton Self-Similarity and Estimation of Horton Ratios
2.4.2. Calculation of Fractal Dimension
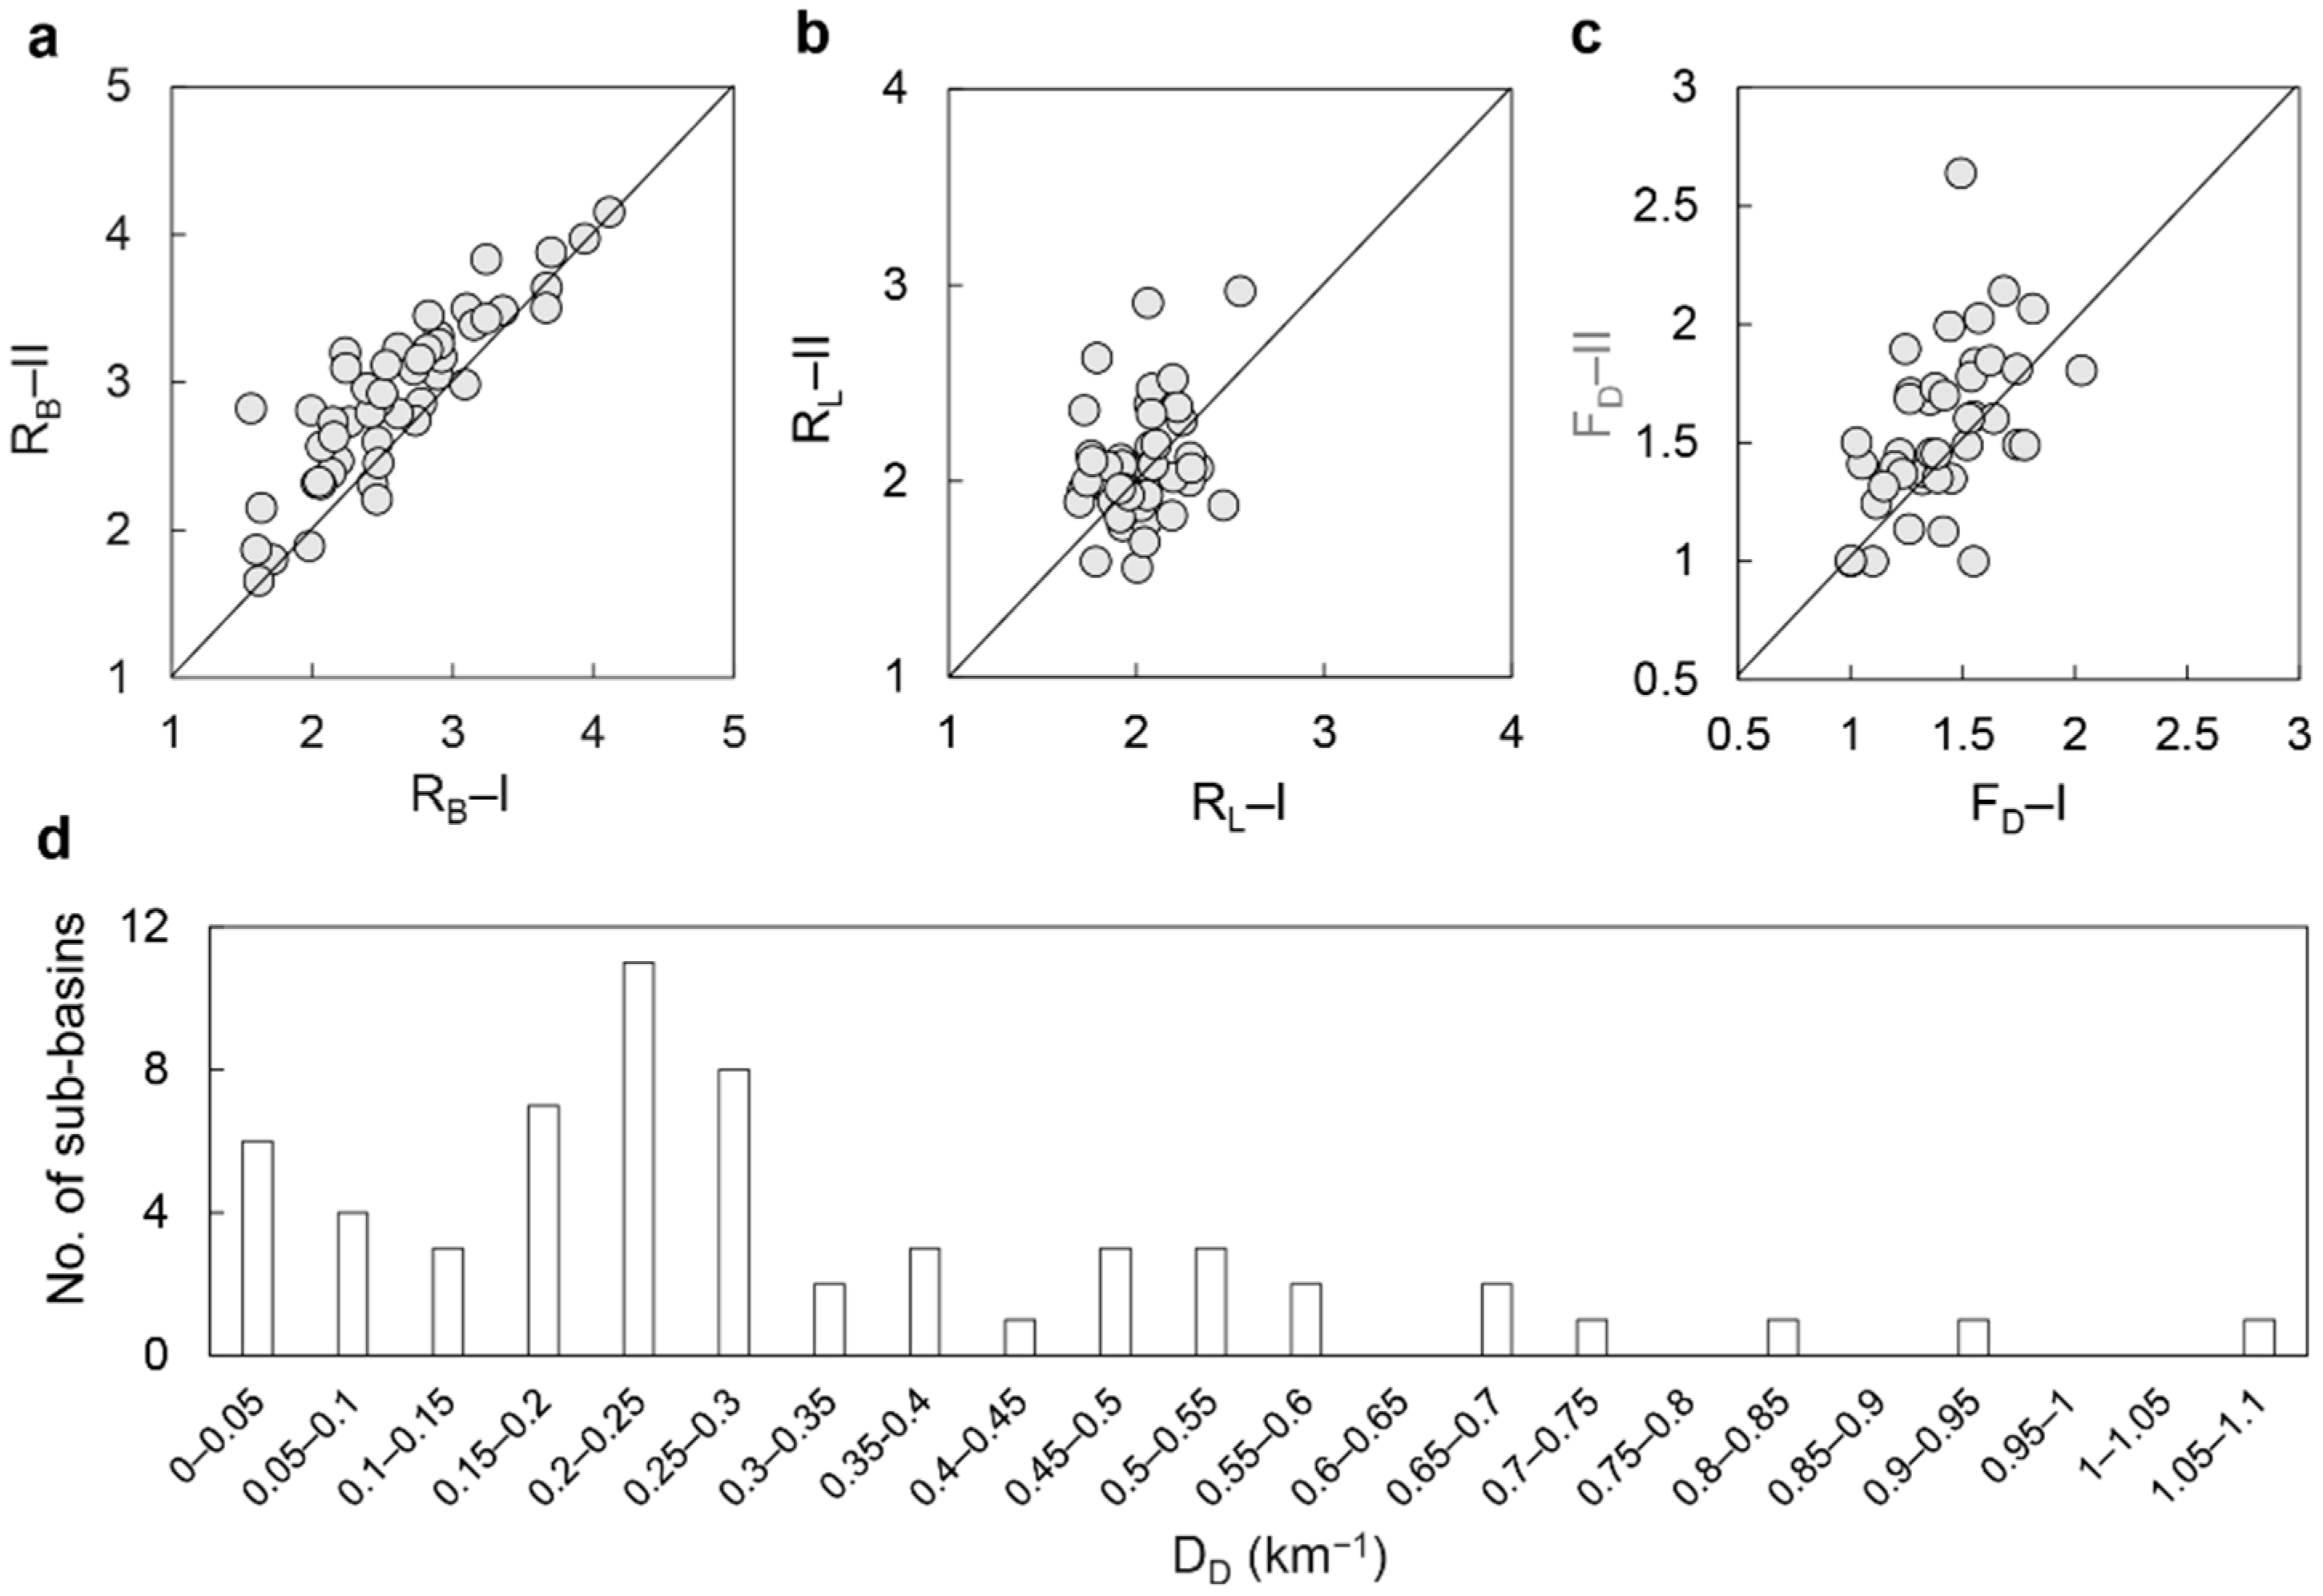
2.4.3. Assessment of Drainage Density
2.5. Quantificvation of Basin Properties
2.6. Statistical Analysis
3. Results
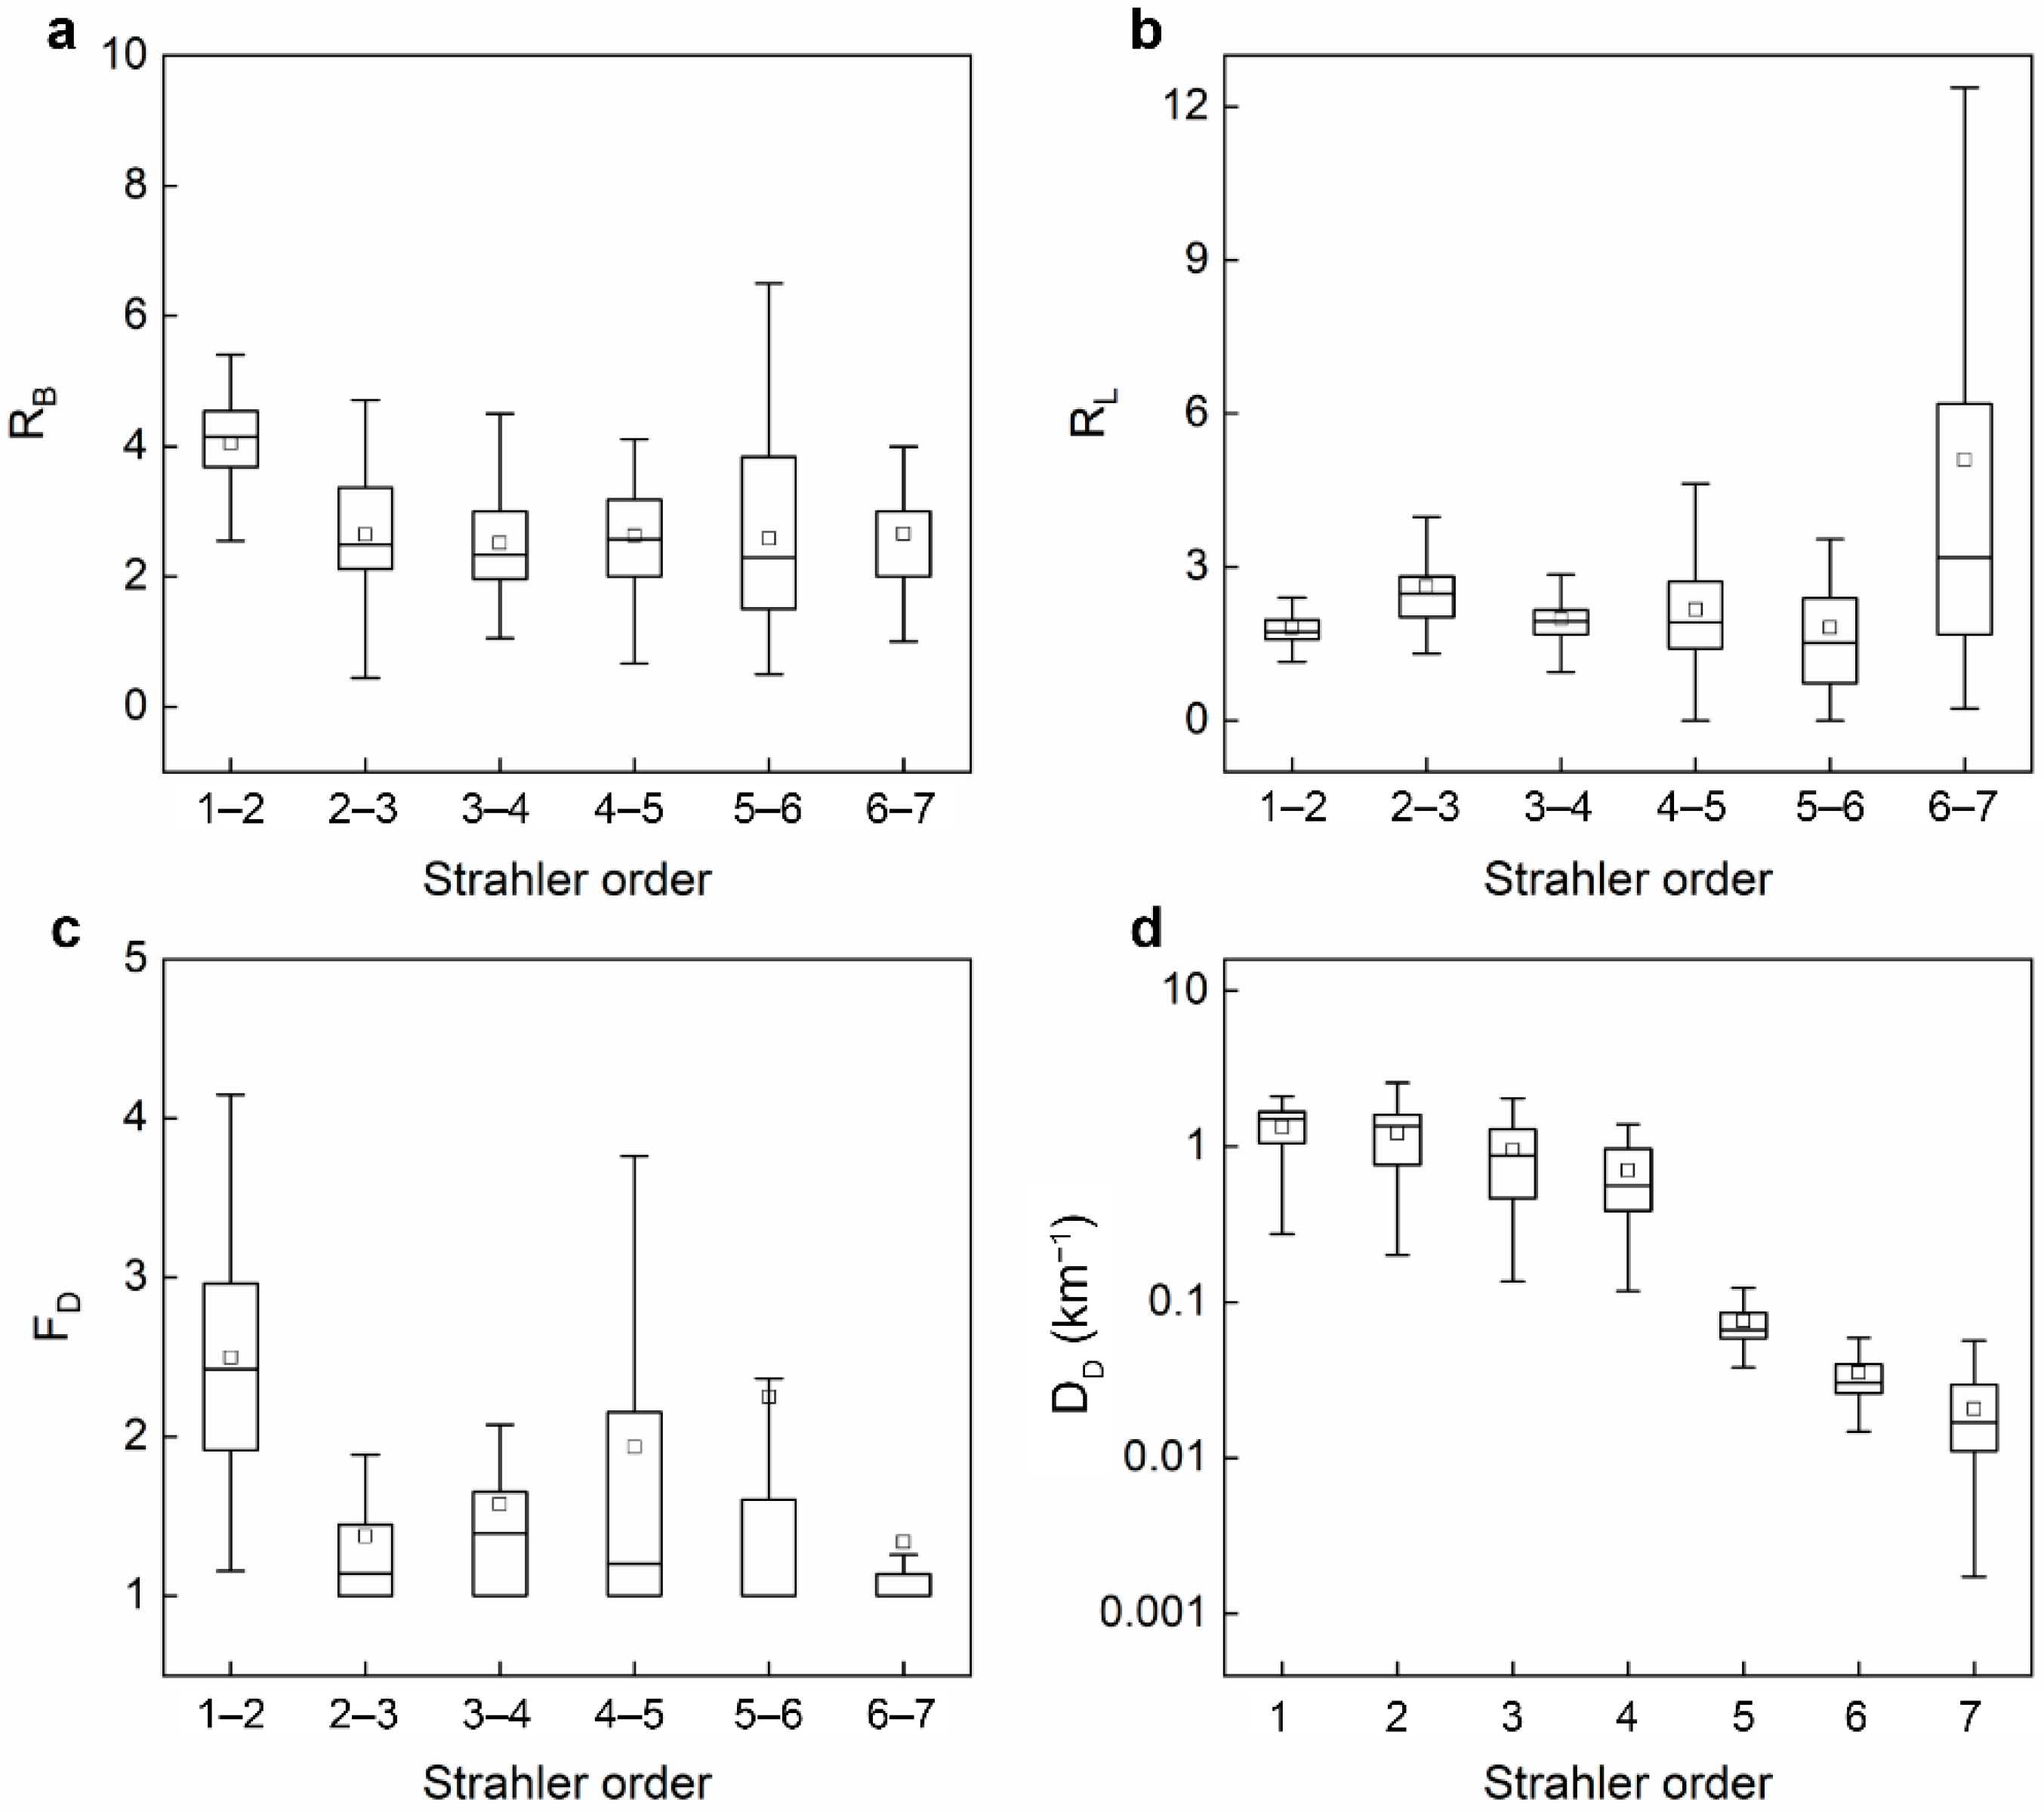
3.1. Self-Similarity of Endorheic Rivers
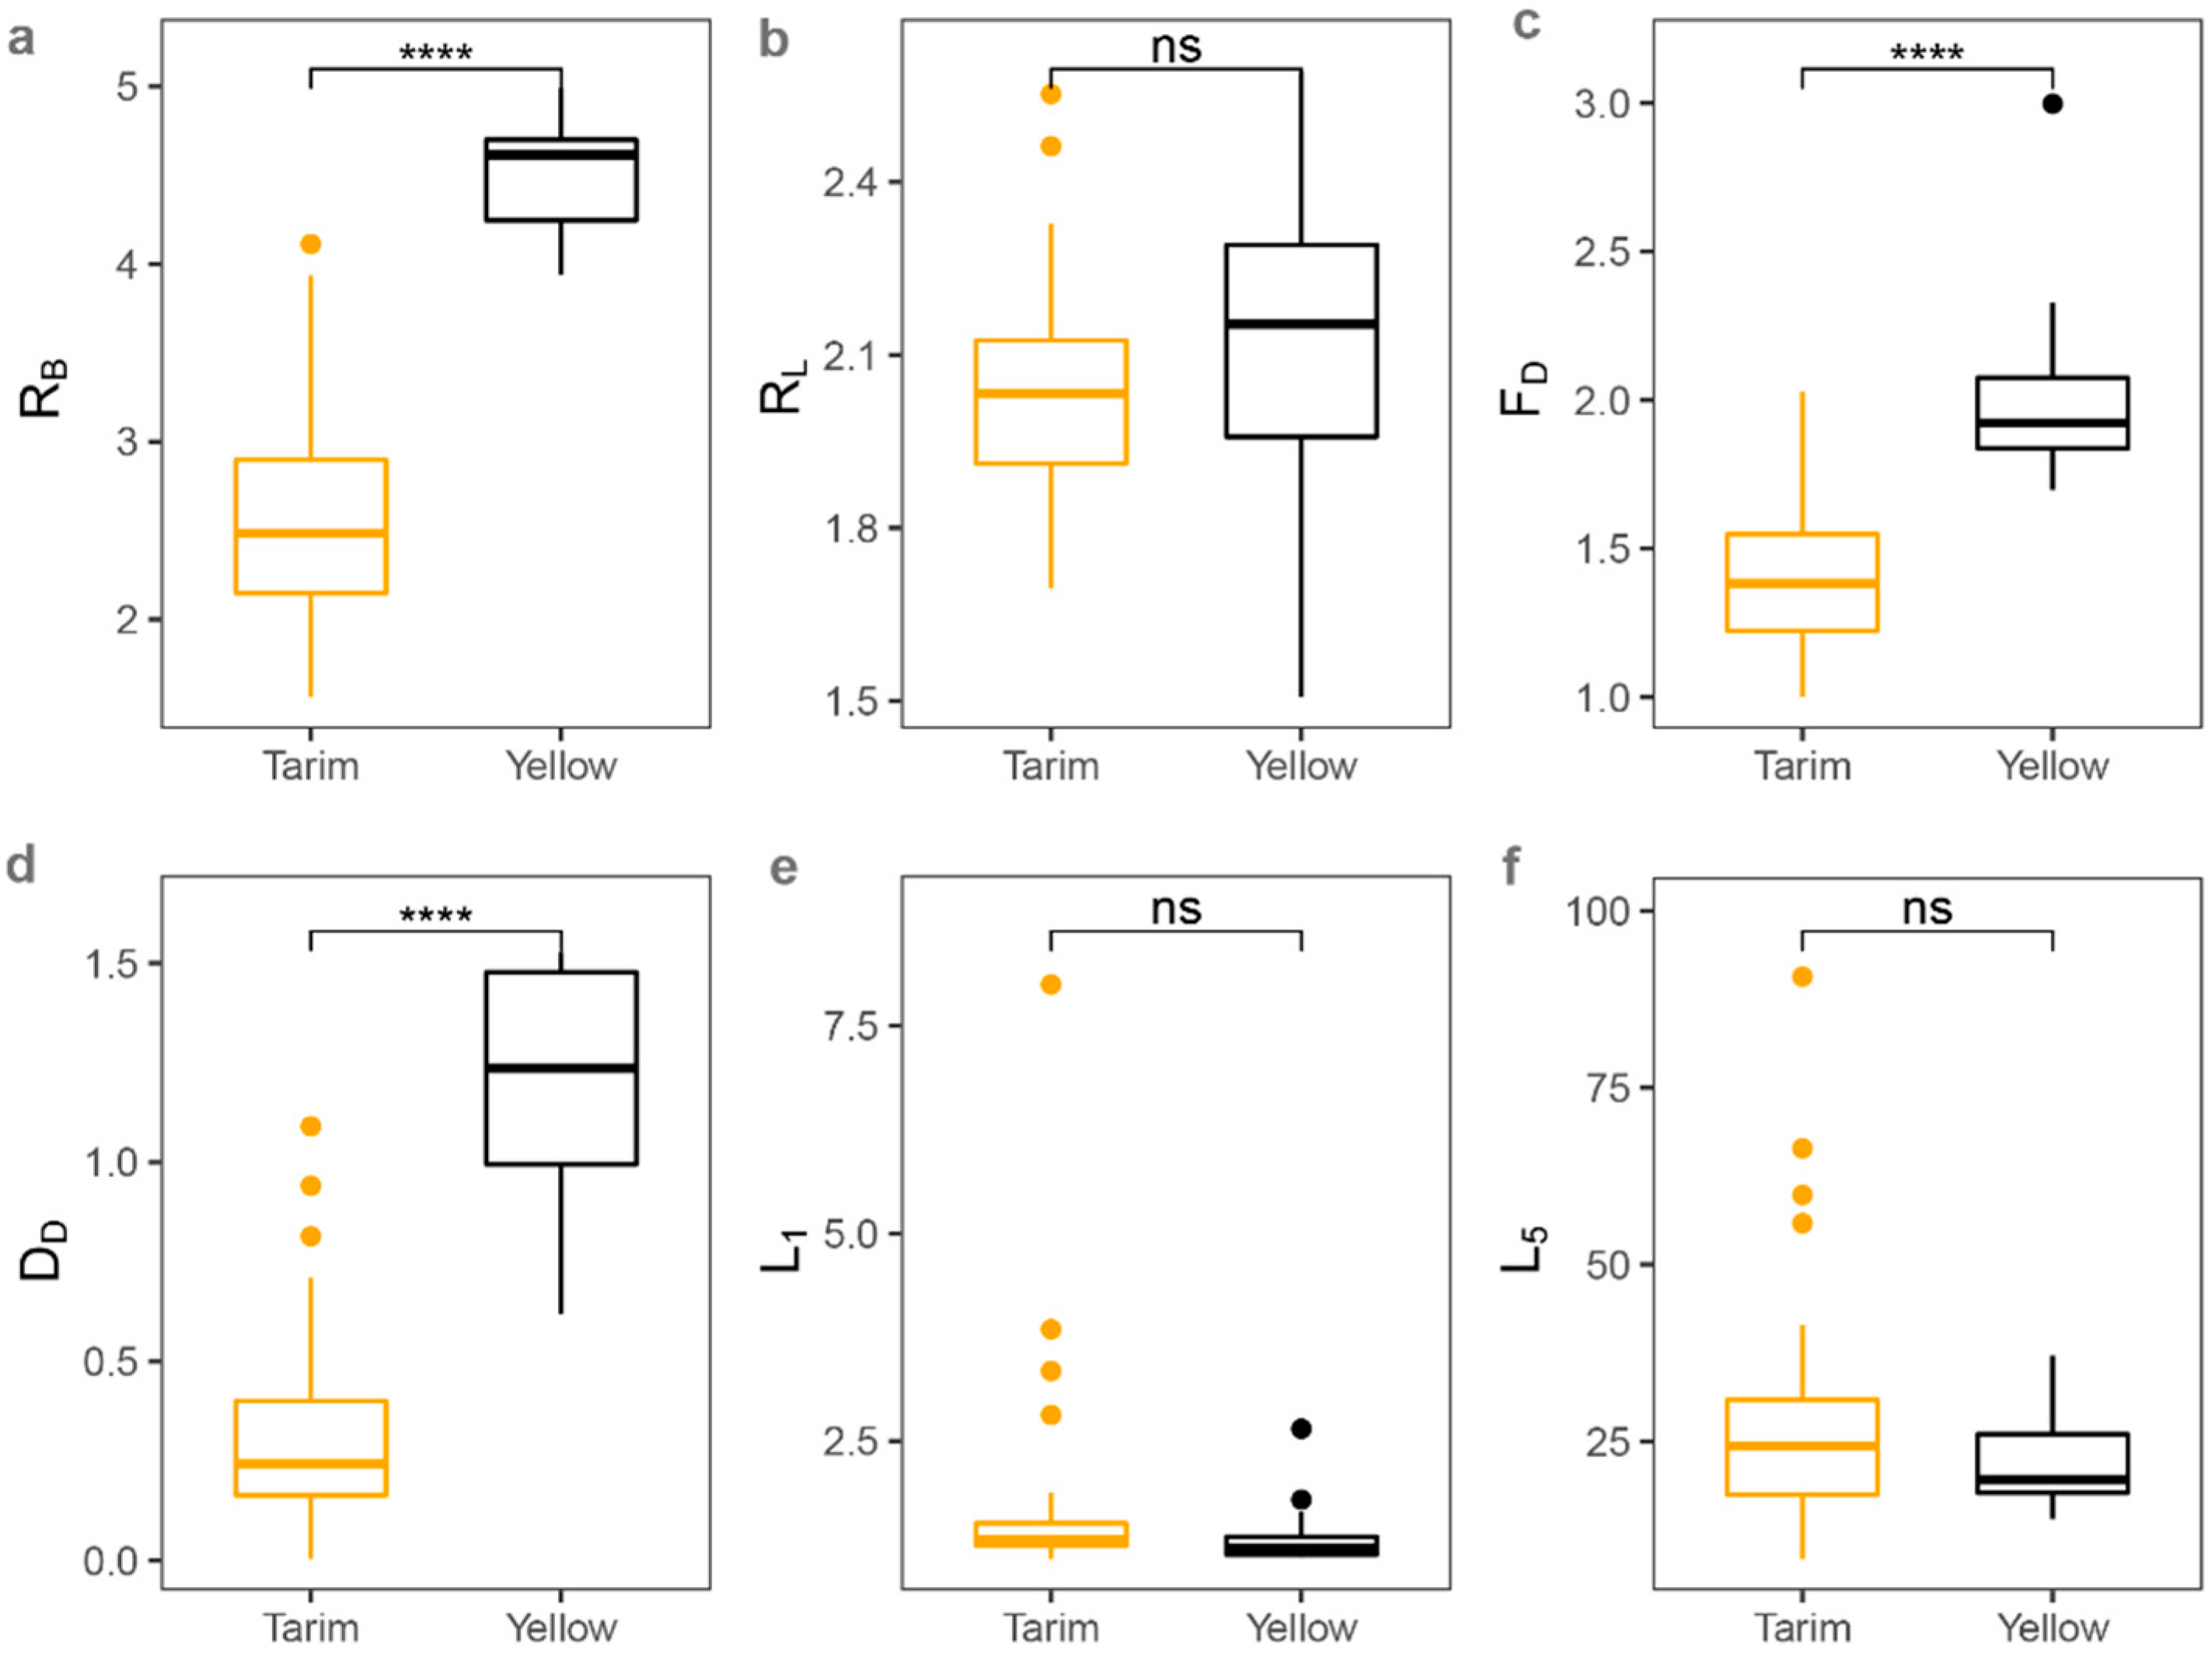
3.2. Structural Characteristics of Endorheic Rivers
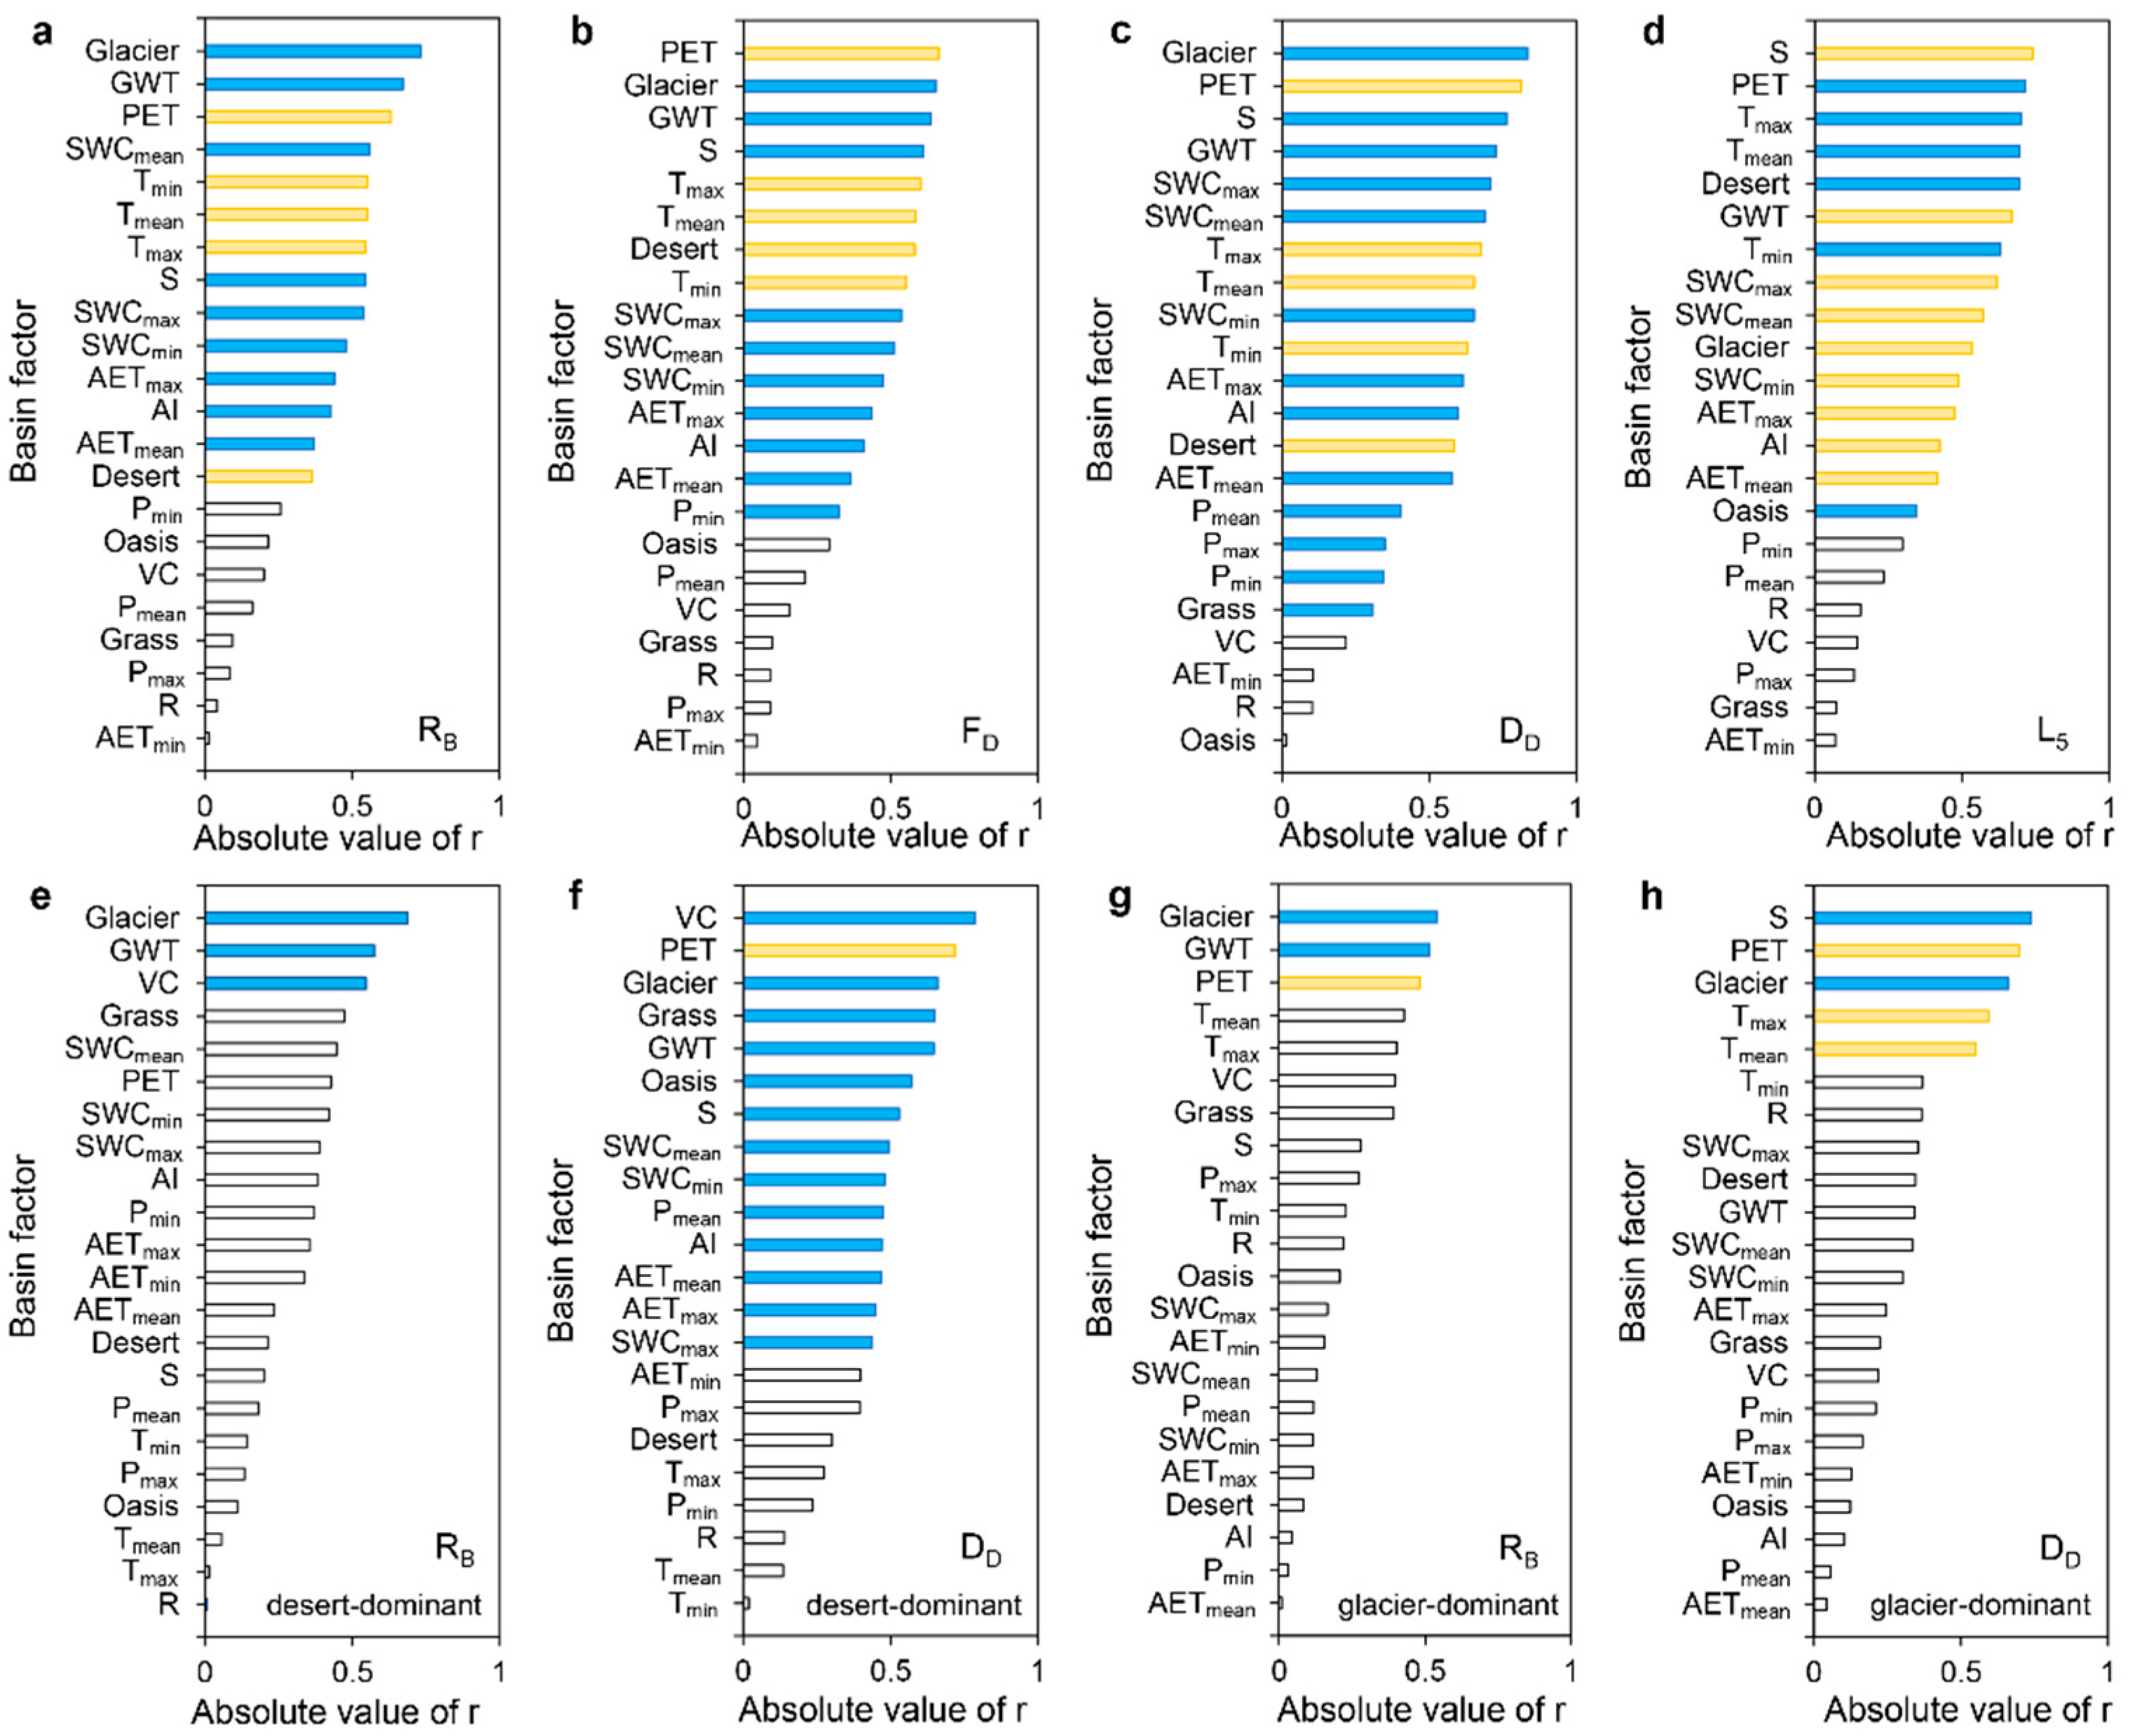
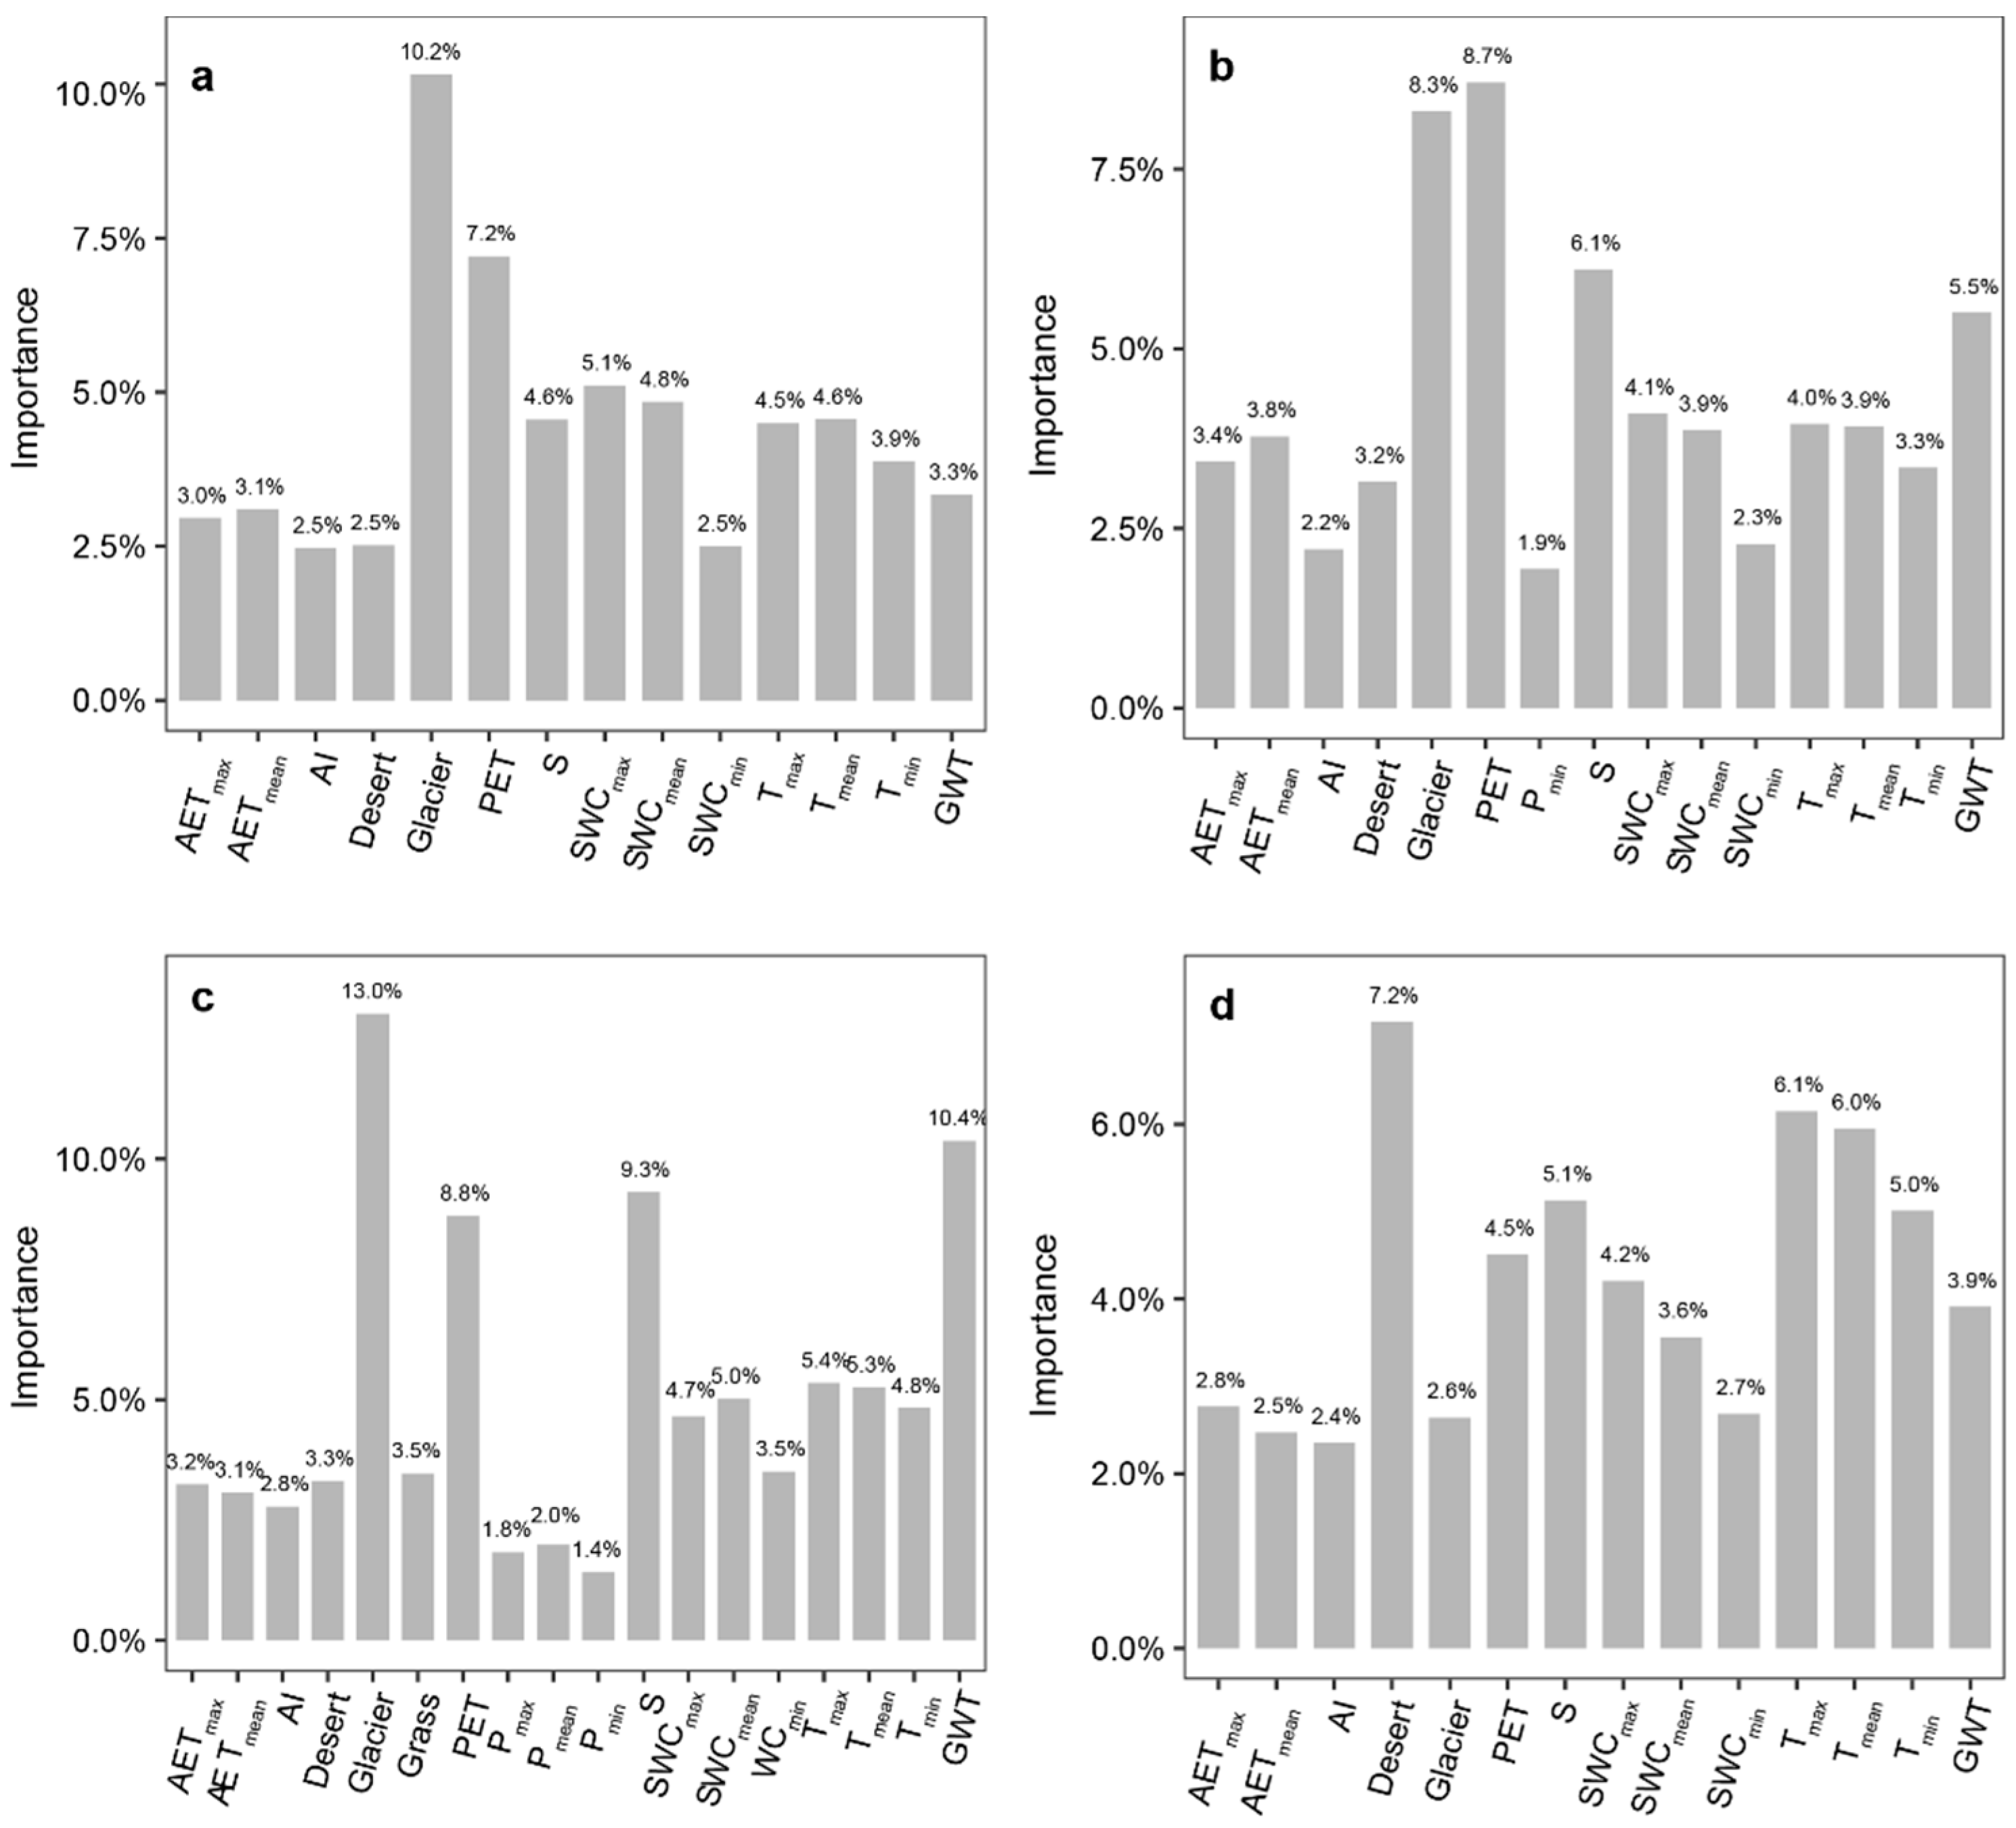
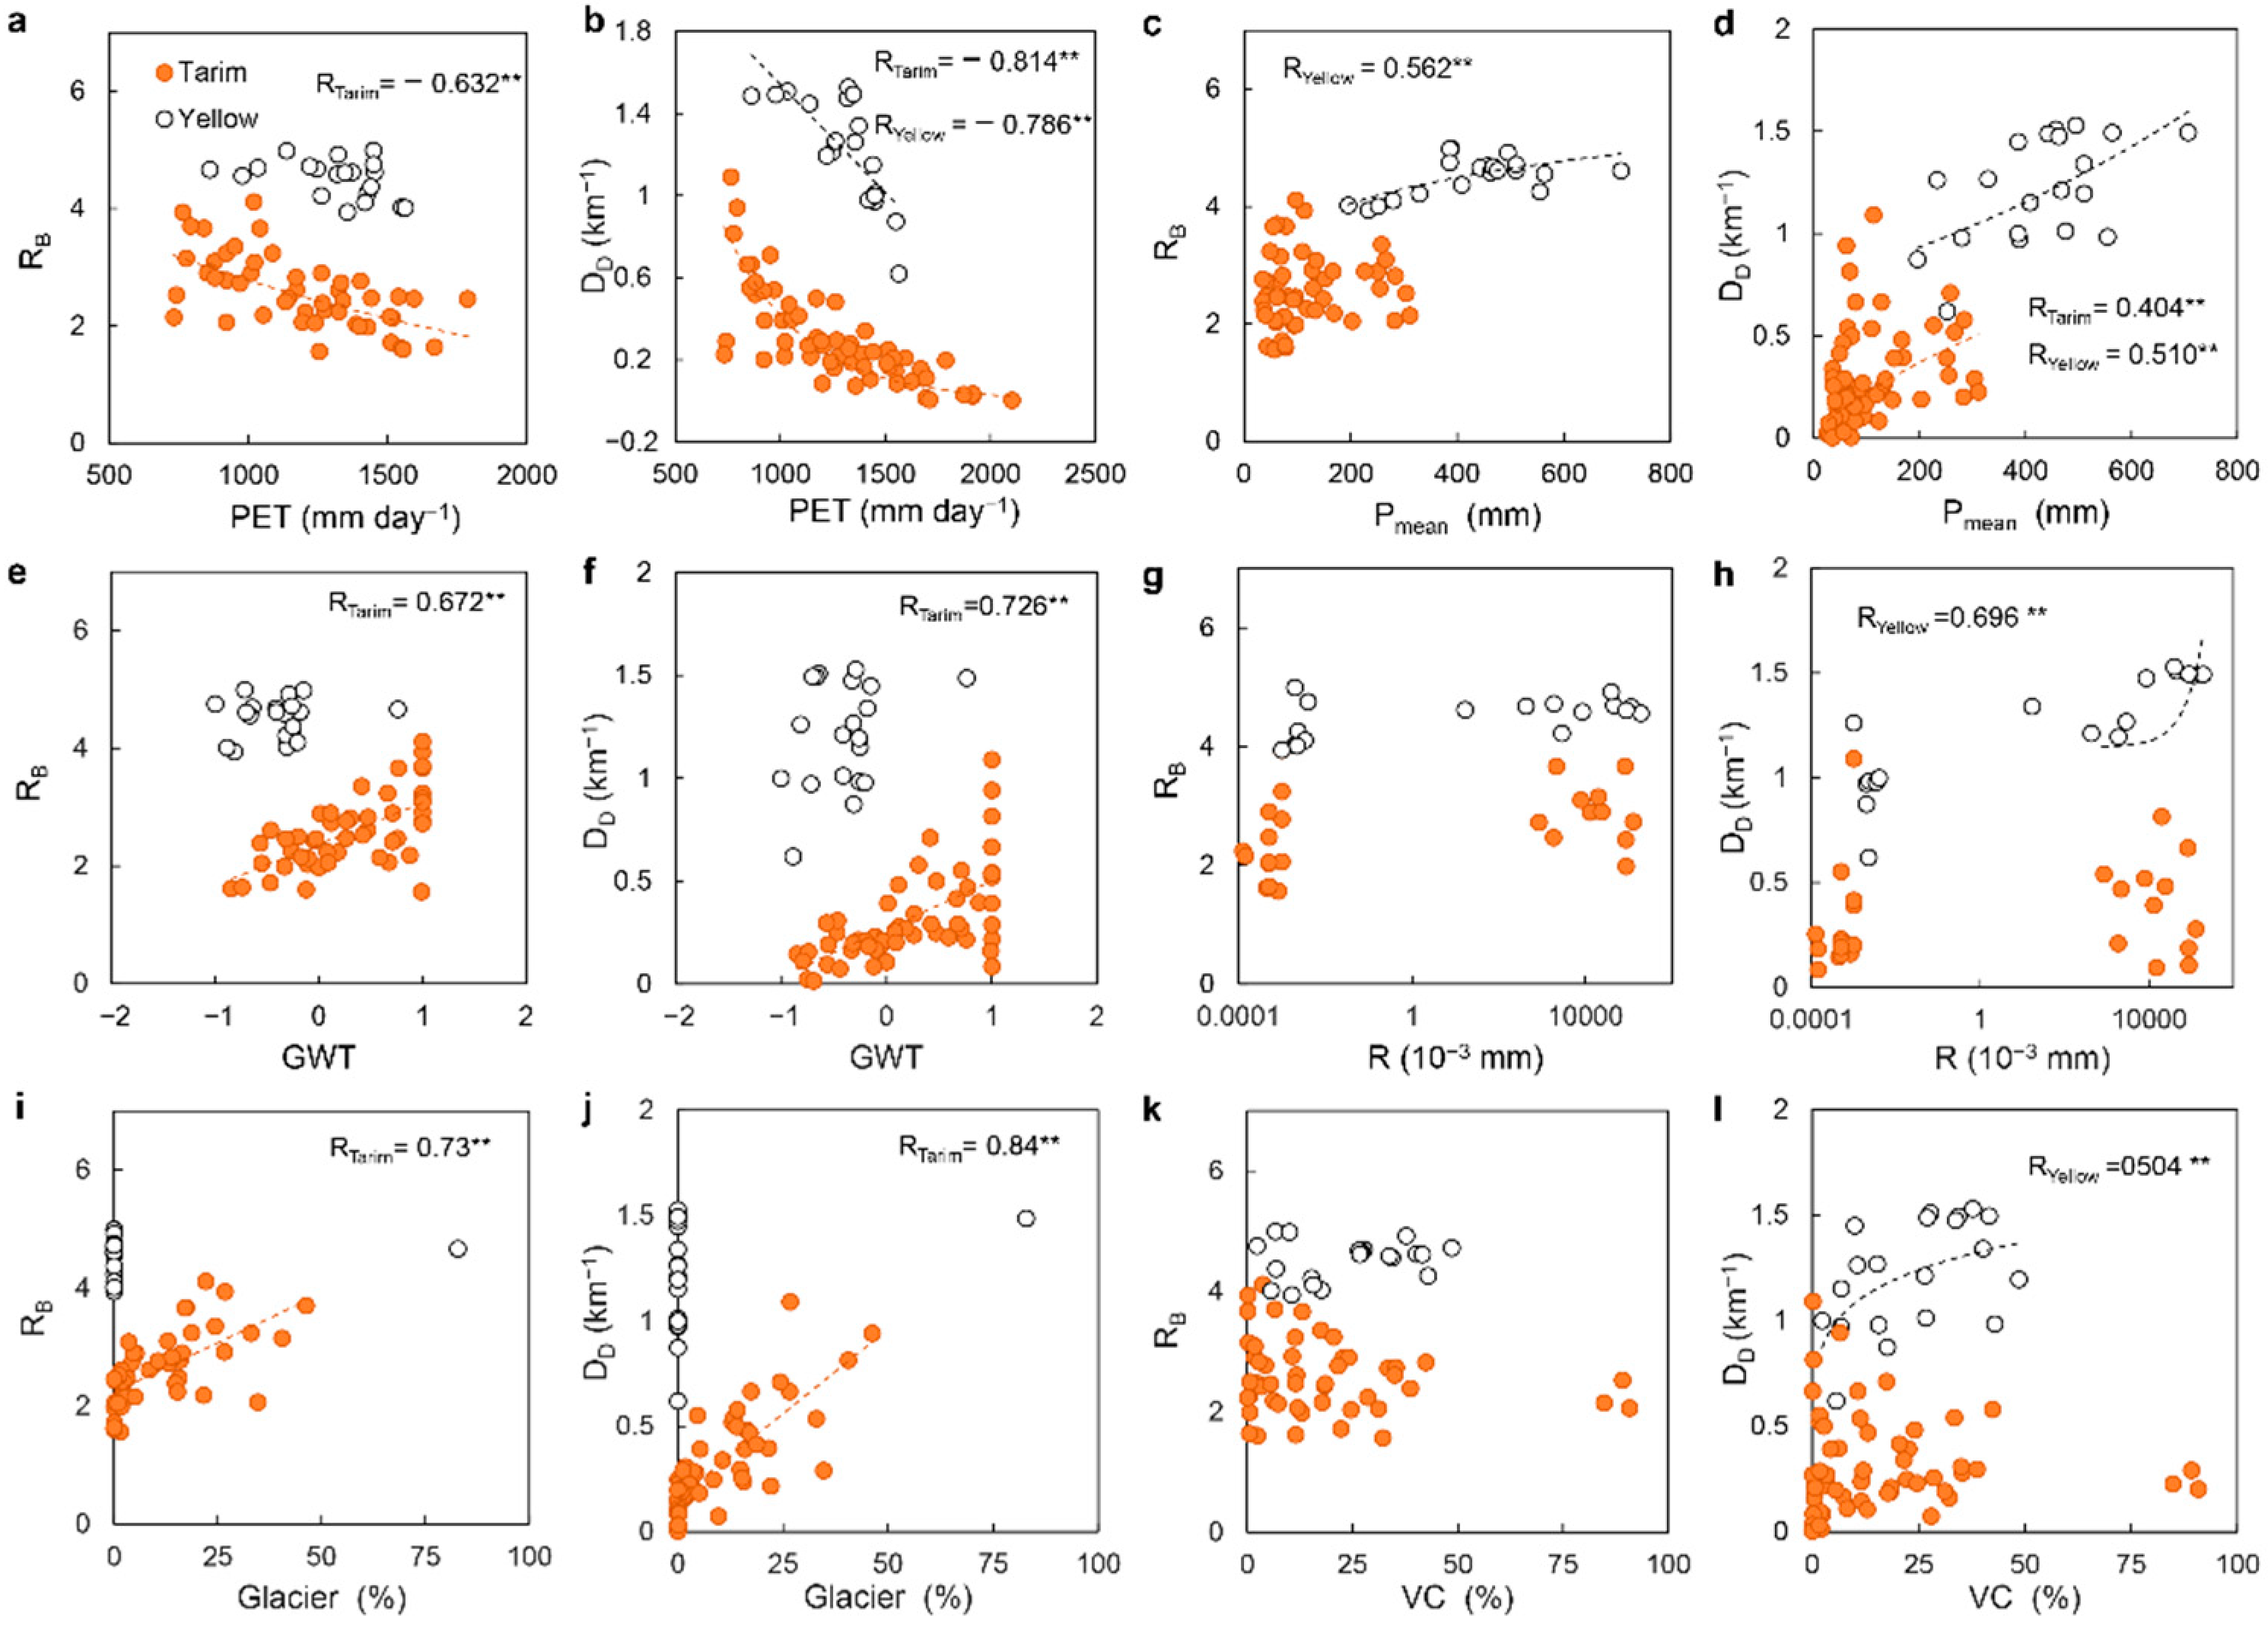
3.3. Major Drivers of Endorheic River Structures
4. Discussion
4.1. Differences in Intrinsic Structurs and Extrinsic Drivers of Endorheic and Exorheic Rivers
4.2. Mangement Implications for Endorheic Rivers
5. Conclusions
Author Contributions
Funding
Data Availability Statement
Conflicts of Interest
Appendix A
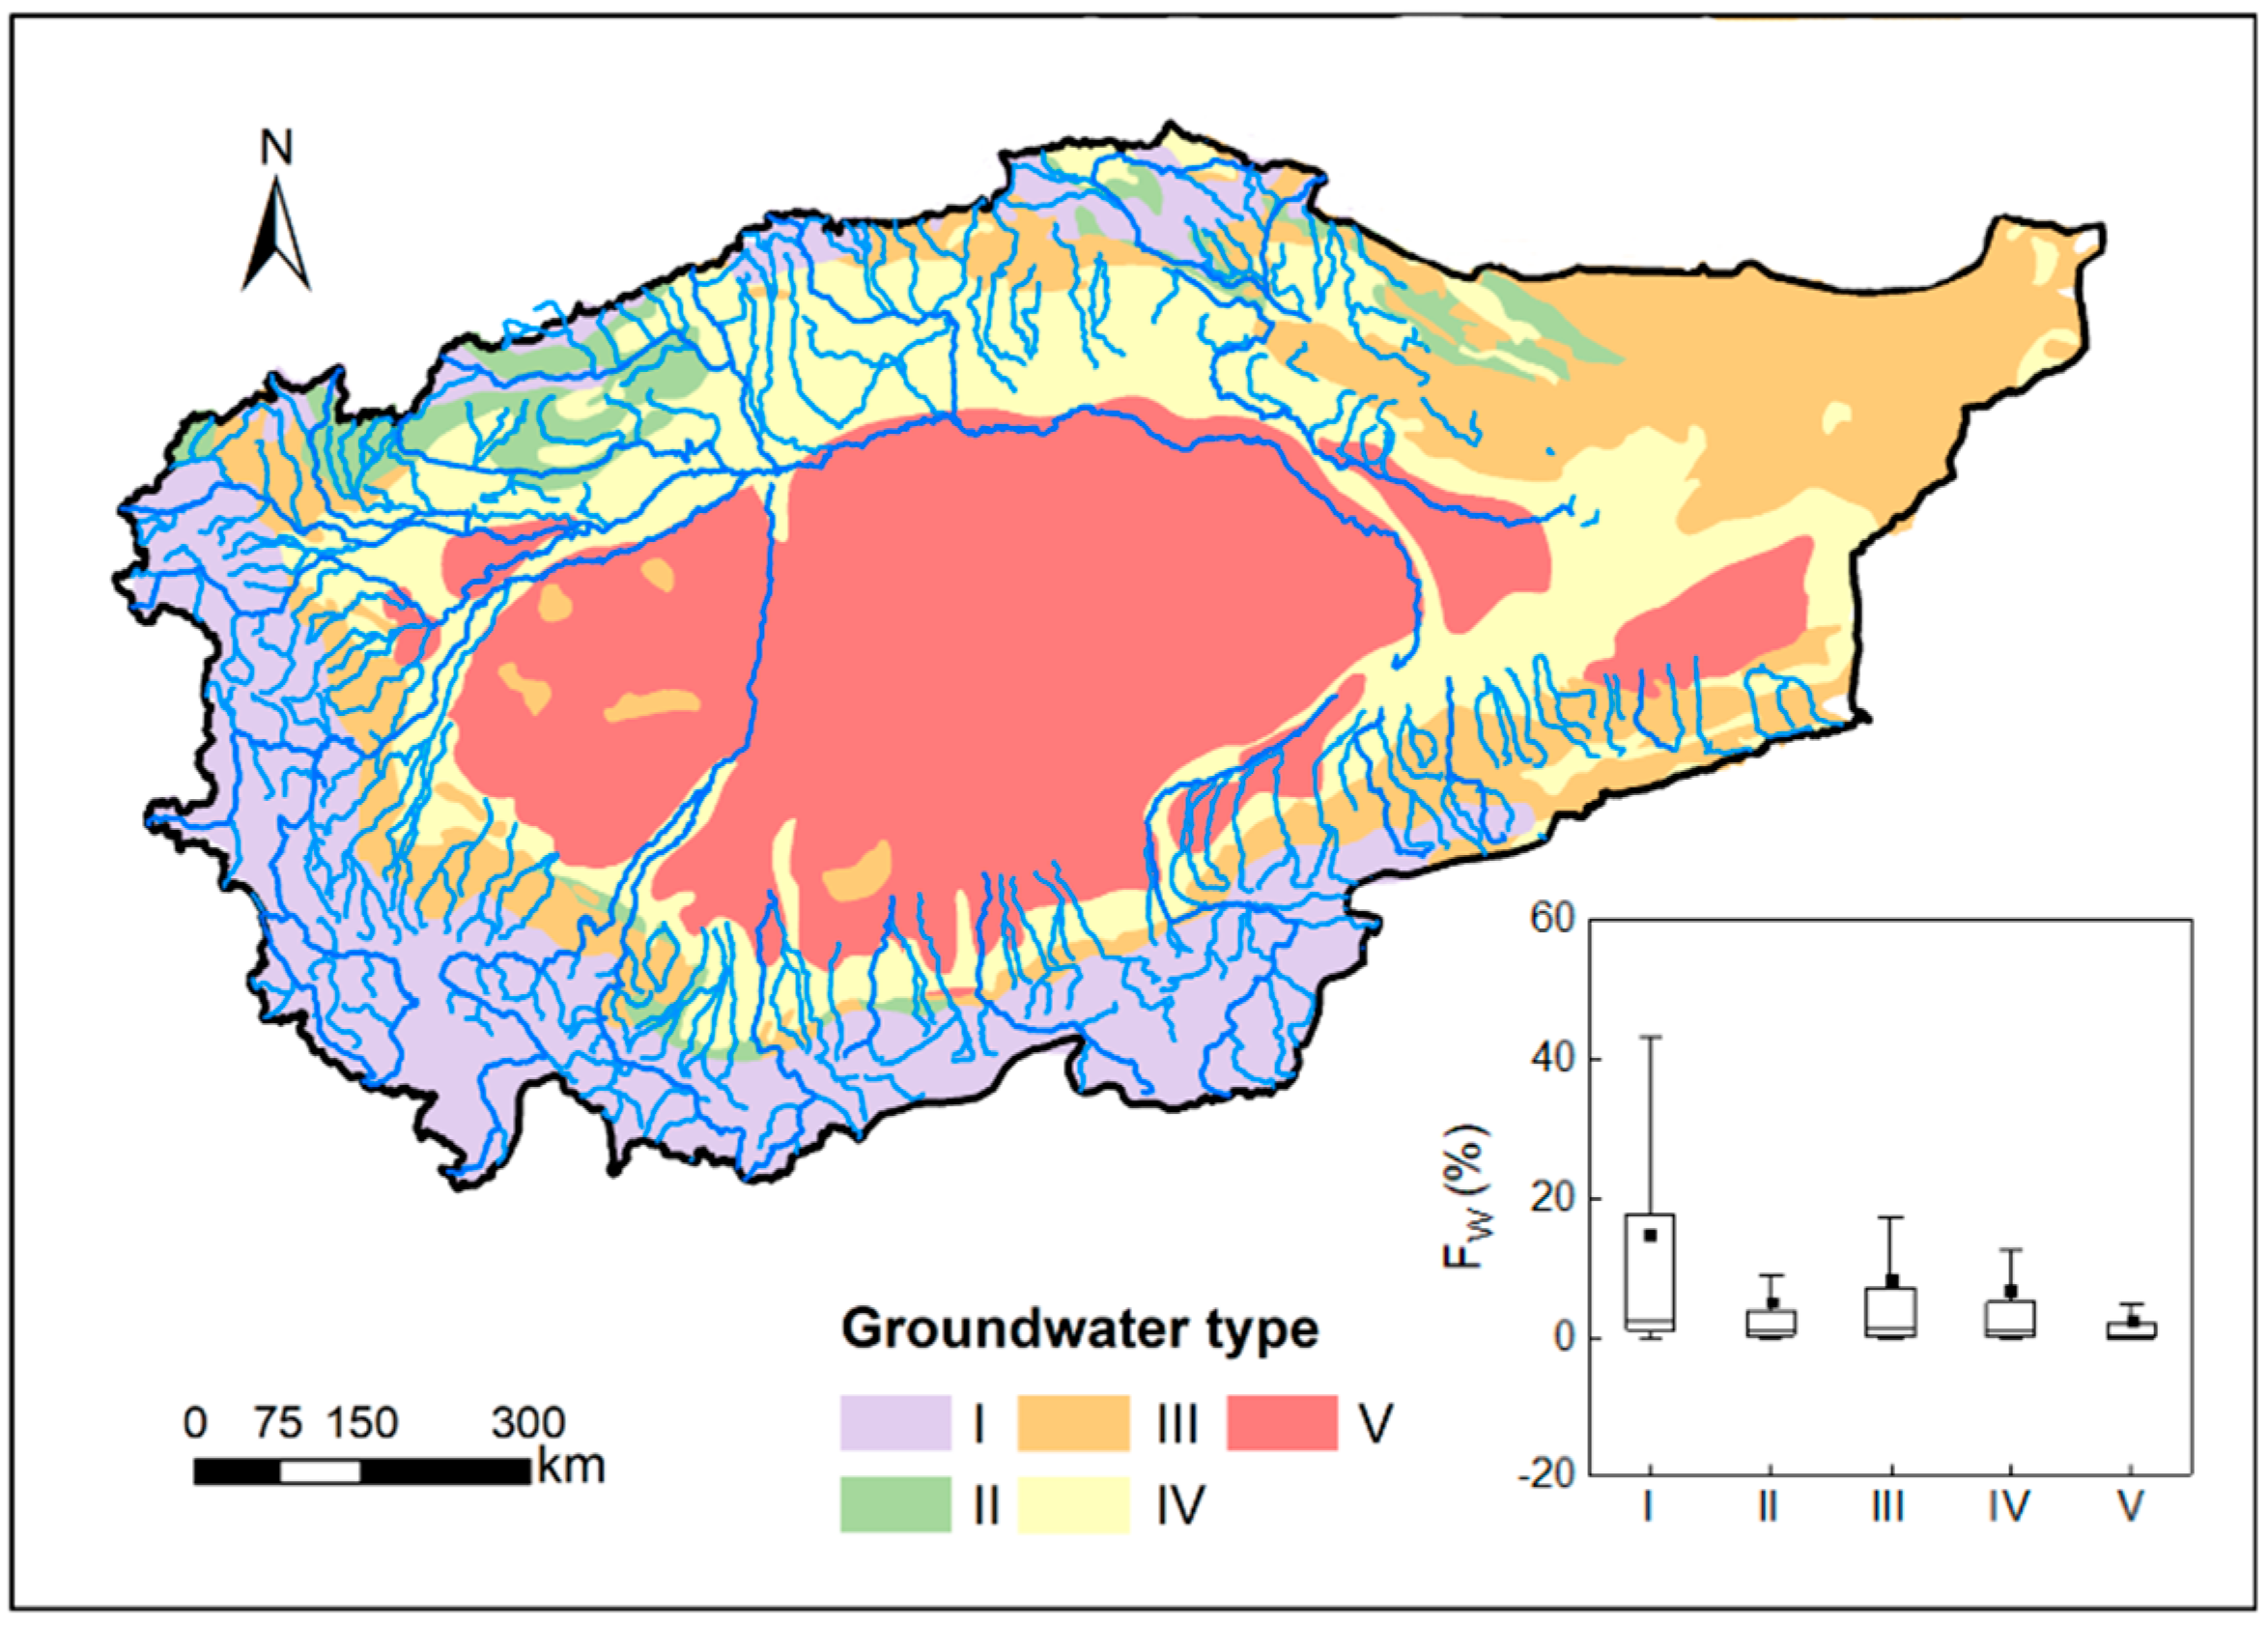
Appendix A.1. Hydrogeological Conditions of the Tarim River Basin

Appendix A.2. Representaitve Sub-Basins in the Yellow River Basin
References
- Li, X.; Cheng, G.; Ge, Y.; Li, H.; Han, F.; Hu, X.; Tian, W.; Tian, Y.; Pan, X.; Nian, Y.; et al. Hydrological Cycle in the Heihe River Basin and Its Implication for Water Resource Management in Endorheic Basins. J. Geophys. Res. Atmos. 2018, 123, 890–914. [Google Scholar] [CrossRef]
- Li, Y.; Zhang, C.; Wang, N.; Han, Q.; Zhang, X.; Liu, Y.; Xu, L.; Ye, W. Substantial Inorganic Carbon Sink in Closed Drainage Basins Globally. Nat. Geosci. 2017, 10, 501–506. [Google Scholar] [CrossRef]
- Maasri, A.; Thorp, J.H.; Gelhaus, J.K.; Tromboni, F.; Chandra, S.; Kenner, S.J. Communities Associated with the Functional Process Zone Scale: A Case Study of Stream Macroinvertebrates in Endorheic Drainages. Sci. Total Environ. 2019, 677, 184–193. [Google Scholar] [CrossRef]
- Li, X.; Zhang, L.; Zheng, Y.; Yang, D.; Wu, F.; Tian, Y.; Han, F.; Gao, B.; Li, H.; Zhang, Y.; et al. Novel Hybrid Coupling of Ecohydrology and Socioeconomy at River Basin Scale: A Watershed System Model for the Heihe River Basin. Environ. Model. Softw. 2021, 141, 105058. [Google Scholar] [CrossRef]
- Pavelsky, T.M. World’s Landlocked Basins Drying. Nat. Geosci. 2018, 11, 892–893. [Google Scholar] [CrossRef]
- Li, Z.; Chen, Y.; Fang, G.; Li, Y. Multivariate Assessment and Attribution of Droughts in Central Asia. Sci. Rep. 2017, 7, 1–12. [Google Scholar] [CrossRef]
- Messager, M.L.; Lehner, B.; Cockburn, C.; Lamouroux, N.; Pella, H.; Snelder, T.; Tockner, K.; Trautmann, T.; Watt, C.; Datry, T. Global Prevalence of Non-Perennial Rivers and Streams. Nature 2021, 594, 391–397. [Google Scholar] [CrossRef]
- Yang, P.; Xia, J.; Zhan, C.; Qiao, Y.; Wang, Y. Monitoring the Spatio-Temporal Changes of Terrestrial Water Storage Using GRACE Data in the Tarim River Basin Between 2002 and 2015. Sci. Total Environ. 2017, 595, 218–228. [Google Scholar] [CrossRef]
- Wang, J.; Song, C.; Reager, J.T.; Yao, F.; Famiglietti, J.S.; Sheng, Y.; Macdonald, G.M.; Brun, F.; Schmied, H.M.; Marston, R.A.; et al. Recent Global Decline in Endorheic Basin Water Storages. Nat. Geosci. 2018, 11, 926–932. [Google Scholar] [CrossRef]
- Wang, W.; Chen, Y.; Wang, W. Groundwater Recharge in the Oasis-Desert Areas of Northern Tarim Basin, Northwest China. Hydrol. Res. 2020, 51, 1506–1520. [Google Scholar] [CrossRef]
- Lai, J.; Li, Y.; Chen, J.; Niu, G.-Y.; Lin, P.; Li, Q.; Wang, L.; Han, J.; Luo, Z.; Sun, Y. Massive Crop Expansion Threatens Agriculture and Water Sustainability in Northwestern China. Environ. Res. Lett. 2022, 17, 034003. [Google Scholar] [CrossRef]
- Rad, A.M.; Kreitler, J.; Abatzoglou, J.T.; Fallon, K.; Roche, K.R.; Sadegh, M. Anthropogenic Stressors Compound Climate Impacts on Inland Lake Dynamics: The Case of Hamun Lakes. Sci. Total Environ. 2022, 829, 154419. [Google Scholar] [CrossRef]
- Dorsaz, J.-M.; Gironás, J.; Escauriaza, C.; Rinaldo, A. The Geomorphometry of Endorheic Drainage Basins: Implications for Interpreting and Modelling Their Evolution. Earth Surf. Process. Landforms 2013, 38, 1881–1896. [Google Scholar] [CrossRef]
- Yapiyev, V.; Sagintayev, Z.; Inglezakis, V.J.; Samarkhanov, K.; Verhoef, A. Essentials of Endorheic Basins and Lakes: A Review in the Context of Current and Future Water Resource Management and Mitigation Activities in Central Asia. Water 2017, 9, 798. [Google Scholar] [CrossRef]
- Benstead, J.P.; Leigh, D.S. An Expanded Role for River Networks. Nat. Geosci. 2012, 5, 678–679. [Google Scholar] [CrossRef]
- Sauquet, E.; Shanafield, M.; Hammond, J.C.; Sefton, C.; Leigh, C.; Datry, T. Classification and Trends in Intermittent River Flow Regimes in Australia, Northwestern Europe and USA: A Global Perspective. J. Hydrol. 2021, 597, 126170. [Google Scholar] [CrossRef]
- Erdenee, B.; Maasri, A.; Gelhaus, J.K.; Hayford, B.L.; Thorp, J.H.; Kotlinski, N.E. Comparison of Streamflow Patterns in Drainages of Two Major Terminal Basins: The United States Great Basin and Mongolia’s Central Asian Internal Drainage. Inland Waters 2021, 11, 368–380. [Google Scholar] [CrossRef]
- Yan, D.; Li, M.; Bi, W.; Weng, B.; Qin, T.; Wang, J.; Do, P. A Data Set of Inland Lake Catchment Boundaries for the Qiangtang Plateau. Sci. Data 2019, 6, 62. [Google Scholar] [CrossRef]
- Liu, K.; Song, C.; Ke, L.; Jiang, L.; Ma, R. Automatic Watershed Delineation in the Tibetan Endorheic Basin: A Lake-Oriented Approach Based on Digital Elevation Models. Geomorphology 2020, 358, 107127. [Google Scholar] [CrossRef]
- Wang, Y.; Ni, J.; Yue, Y.; Li, J.; Borthwick, A.G.L.; Cai, X.; Xue, A.; Li, L.; Wang, G. Solving the Mystery of Vanishing Rivers in China. Natl. Sci. Rev. 2019, 6, 1239–1246. [Google Scholar] [CrossRef] [Green Version]
- Sun, F.; Wang, Y.; Chen, Y.; Li, Y.; Zhang, Q.; Qin, J.; Kayumba, P. Historic and Simulated Desert-Oasis Ecotone Changes in the Arid Tarim River Basin, China. Remote Sens. 2021, 13, 647. [Google Scholar] [CrossRef]
- Wang, H.; Wen, X.; Wang, Y.; Cai, L.; Peng, D.; Liu, Y. China’s Land Cover Fraction Change during 2001–2015 Based on Remote Sensed Data Fusion between MCD12 and CCI-LC. Remote Sens. 2021, 13, 341. [Google Scholar] [CrossRef]
- Wang, N.; Liu, W.; Wang, H.; Sun, F.; Duan, W.; Li, Z.; Li, Z.; Chen, Y. Improving Streamflow and Flood Simulations in Three Headwater Catchments of the Tarim River Based on a Coupled Glacier-Hydrological Model. J. Hydrol. 2021, 603, 127048. [Google Scholar] [CrossRef]
- Wang, X.; Luo, Y.; Sun, L.; Shafeeque, M. Different Climate Factors Contributing for Runoff Increases in The High Glacierized Tributaries of Tarim River Basin, China. J. Hydrol. Reg. Stud. 2021, 36, 100845. [Google Scholar] [CrossRef]
- Costigan, K.H.; Kennard, M.J.; Leigh, C.; Sauquet, E.; Datry, T.; Boulton, A.J. Flow Regimes in Intermittent Rivers and Ephemeral Streams. In Intermittent Rivers and Ephemeral Streams; Academic Press: Cambridge, MA, USA, 2017; pp. 51–78. [Google Scholar]
- Chen, X.; Wang, Y.; Ni, J. Structural Characteristics of River Networks and Their Relations to Basin Factors in the Yangtze and Yellow River basins. Sci. China Technol. Sci. 2019, 62, 1885–1895. [Google Scholar] [CrossRef]
- Perron, J.T.; Richardson, P.; Ferrier, K.; Lapotre, M. The Root of Branching River Networks. Nature 2012, 492, 100–103. [Google Scholar] [CrossRef]
- Ranjbar, S.; Hooshyar, M.; Singh, A.; Wang, D. Quantifying Climatic Controls on River Network Branching Structure Across Scales. Water Resour. Res. 2018, 54, 7347–7360. [Google Scholar] [CrossRef]
- Ni, J.; Wang, H.; Ma, T.; Huang, R.; Ciais, P.; Li, Z.; Yue, Y.; Chen, J.; Li, B.; Wang, Y.; et al. Three Gorges Dam: Friend or Foe of Riverine Greenhouse Gases? Natl. Sci. Rev. 2022, 9, nwac013. [Google Scholar] [CrossRef]
- Wang, Y.; Chen, X.; Borthwick, A.G.L.; Li, T.; Liu, H.; Yang, S.; Zheng, C.; Xu, J.; Ni, J. Sustainability of Global Golden Inland Waterways. Nat. Commun. 2020, 11, 1553. [Google Scholar] [CrossRef]
- Liu, K.; Ke, L.; Wang, J.; Jiang, L.; Richards, K.S.; Sheng, Y.; Zhu, Y.; Fan, C.; Zhan, P.; Luo, S.; et al. Ongoing Drainage Reorganization Driven by Rapid Lake Growths on the Tibetan Plateau. Geophys. Res. Lett. 2021, 48, e2021GL095795. [Google Scholar] [CrossRef]
- Lu, S.; Jin, J.; Zhou, J.; Li, X.; Ju, J.; Li, M.; Chen, F.; Zhu, L.; Zhao, H.; Yan, Q.; et al. Drainage Basin Reorganization and Endorheic-Exorheic Transition Triggered by Climate Change and Human Intervention. Glob. Planet. Chang. 2021, 201, 103494. [Google Scholar] [CrossRef]
- Xu, J.; Ling, H.; Zhang, G.; Yan, J.; Deng, M.; Wang, G.; Xu, S. Variations in the Dissolved Carbon Concentrations of the Shallow Groundwater in a Desert Inland River Basin. J. Hydrol. 2021, 602, 126774. [Google Scholar] [CrossRef]
- Xing, Z.; Huang, H.; Li, Y.; Liu, S.; Wang, D.; Yuan, Y.; Zhao, Z.; Bu, L. Management of Sustainable Ecological Water Levels of Endorheic Salt Lakes in the Inner Mongolian Plateau of China Based on Eco-Hydrological Processes. Hydrol. Process. 2021, 35, e14192. [Google Scholar] [CrossRef]
- Shen, Q.; Ma, Y. Did Water Diversion Projects Lead to Sustainable Ecological Restoration in Arid Endorheic Basins? Lessons From Long-Term Changes of Multiple Ecosystem Indicators in the lower Heihe River Basin. Sci. Total Environ. 2019, 701, 134785. [Google Scholar] [CrossRef] [PubMed]
- Editorial Committee of Encyclopedia of Rivers and Lakes in China. Encyclopedia of Rivers and Lakes in China; China Waterpower Press: Beijing, China, 2014. [Google Scholar]
- Pekel, J.-F.; Cottam, A.; Gorelick, N.; Belward, A.S. High-Resolution Mapping of Global Surface Water and Its Long-Term Changes. Nature 2016, 540, 418–422. [Google Scholar] [CrossRef]
- Vaze, J.; Teng, J.; Spencer, G. Impact of DEM Accuracy and Resolution on Topographic Indices. Environ. Model. Softw. 2010, 25, 1086–1098. [Google Scholar] [CrossRef]
- Hou, J.; Li, X.; Pan, Z.; Wang, J.; Wang, R. Effect of Digital Elevation Model Spatial Resolution on Depression Storage. Hydrol. Process. 2021, 35, e14381. [Google Scholar] [CrossRef]
- Bernard, T.G.; Davy, P.; Lague, D. Hydro-Geomorphic Metrics for High Resolution Fluvial Landscape Analysis. J. Geophys. Res. Earth Surf. 2022, 127, e2021JF006535. [Google Scholar] [CrossRef]
- Costabile, P.; Costanzo, C.; Gandolfi, C.; Gangi, F.; Masseroni, D. Effects of DEM Depression Filling on River Drainage Patterns and Surface Runoff Generated by 2D Rain-on-Grid Scenarios. Water 2022, 14, 997. [Google Scholar] [CrossRef]
- Costabile, P.; Costanzo, C. A 2D-SWEs Framework for Efficient Catchment-Scale Simulations: Hydrodynamic Scaling Properties of River Networks and Implications for Non-Uniform Grids Generation. J. Hydrol. 2021, 599, 126306. [Google Scholar] [CrossRef]
- Bai, R.; Li, T.; Huang, Y.; Li, J.; Wang, G. An Efficient and Comprehensive Method for Drainage Network Extraction from DEM With Billions of Pixels Using a Size-Balanced Binary Search Tree. Geomorphology 2015, 238, 56–67. [Google Scholar] [CrossRef]
- Strahler, A.N. Hypsometric (Area-Altitude) Analysis of Erosional Topography. Geol. Soc. Am. 1952, 63, 1117–1142. [Google Scholar] [CrossRef]
- Strahler, A.N. Quantitative Analysis of Watershed Geomorphology. Eos Trans. Am. Geophys. Union 1957, 38, 913–920. [Google Scholar] [CrossRef]
- Horton, R.E. Erosional Development of Streams and Their Drainage Basins: Hydro-Physical Approach to Quantitative Morphology. Geol. Soc. Am. Bull. 1945, 56, 275–370. [Google Scholar] [CrossRef]
- Zanardo, S.; Zaliapin, I.; Foufoula-Georgiou, E. Are American Rivers Tokunaga Self-Similar? New Results on Fluvial Network Topology and Its Climatic Dependence. J. Geophys. Res. Earth Surf. 2013, 118, 166–183. [Google Scholar] [CrossRef]
- Martinez, F.; Manriquez, H.; Ojeda, A.; Olea, G. Organization Patterns of Complex River Networks in Chile: A Fractal Morphology. Mathematics 2022, 10, 1806. [Google Scholar] [CrossRef]
- He, L.H.; Zhao, H. The Fractal Dimension of River Networks and Its Interpretation. Sci. Geogr. Sin. 1996, 16, 124–128. [Google Scholar]
- Collins, D.; Bras, R.L. Climatic and Ecological Controls of Equilibrium Drainage Density, Relief, and Channel Concavity in Dry Lands. Water Resour. Res. 2010, 46, W04508. [Google Scholar] [CrossRef]
- Rui, X.F. Principles of Hydrology; China Water & Power Press: Beijing, China, 2004. [Google Scholar]
- Wang, Y.C.; Gao, X.W.; Li, T.J.; Yue, Y.; Fang, H.Q.; Ni, J.R. Geocode-based Aquatic Habitats in Hierarchical System of the Yellow River Basin. J. Environ. Informatics 2018, 32, 69–81. [Google Scholar] [CrossRef]
- Kusák, M. Application of Fractal and Multifractal Analysis on Blue Nile Drainage Patterns in the Morphostructural Analysis of the Ethiopian Highlands, Ethiopia. Prog. Phys. Geogr. Earth Environ. 2022, 46, 357–370. [Google Scholar] [CrossRef]


| Category | Attribute | Abbreviation | Unit |
|---|---|---|---|
| Climate and Meteorology | Annual mean precipitation | Pmean | mm·a−1 |
| Monthly minimum precipitation | Pmin | mm·a−1 | |
| Monthly maximum precipitation | Pmax | mm·a−1 | |
| Potential evapotranspiration | PET | mm·day−1 | |
| Annual mean actual evapotranspiration | Tmean | °C | |
| Monthly minimum temperature | Tmin | °C | |
| Monthly maximum temperature | Tmax | °C | |
| Aridity index | AI | - | |
| Annual mean actual evapotranspiration | AETmean | mm·day−1 | |
| Monthly minimum actual evapotranspiration | AETmin | mm·day−1 | |
| Monthly maximum actual evapotranspiration | AETmax | mm·day−1 | |
| Hydrology and hydrogeology | Land surface runoff | R | mm |
| Annual mean soil water content | SWCmean | mm·a−1 | |
| Monthly minimum soil water content | SWCmin | mm·a−1 | |
| Monthly maximum soil water content | SWCmax | mm·a−1 | |
| Groundwater type | GWT | - | |
| Geomorphology | Mean basin slope | S | ° |
| Area proportion of glacier | Glacier | % | |
| Area proportion of oasis | Oasis | % | |
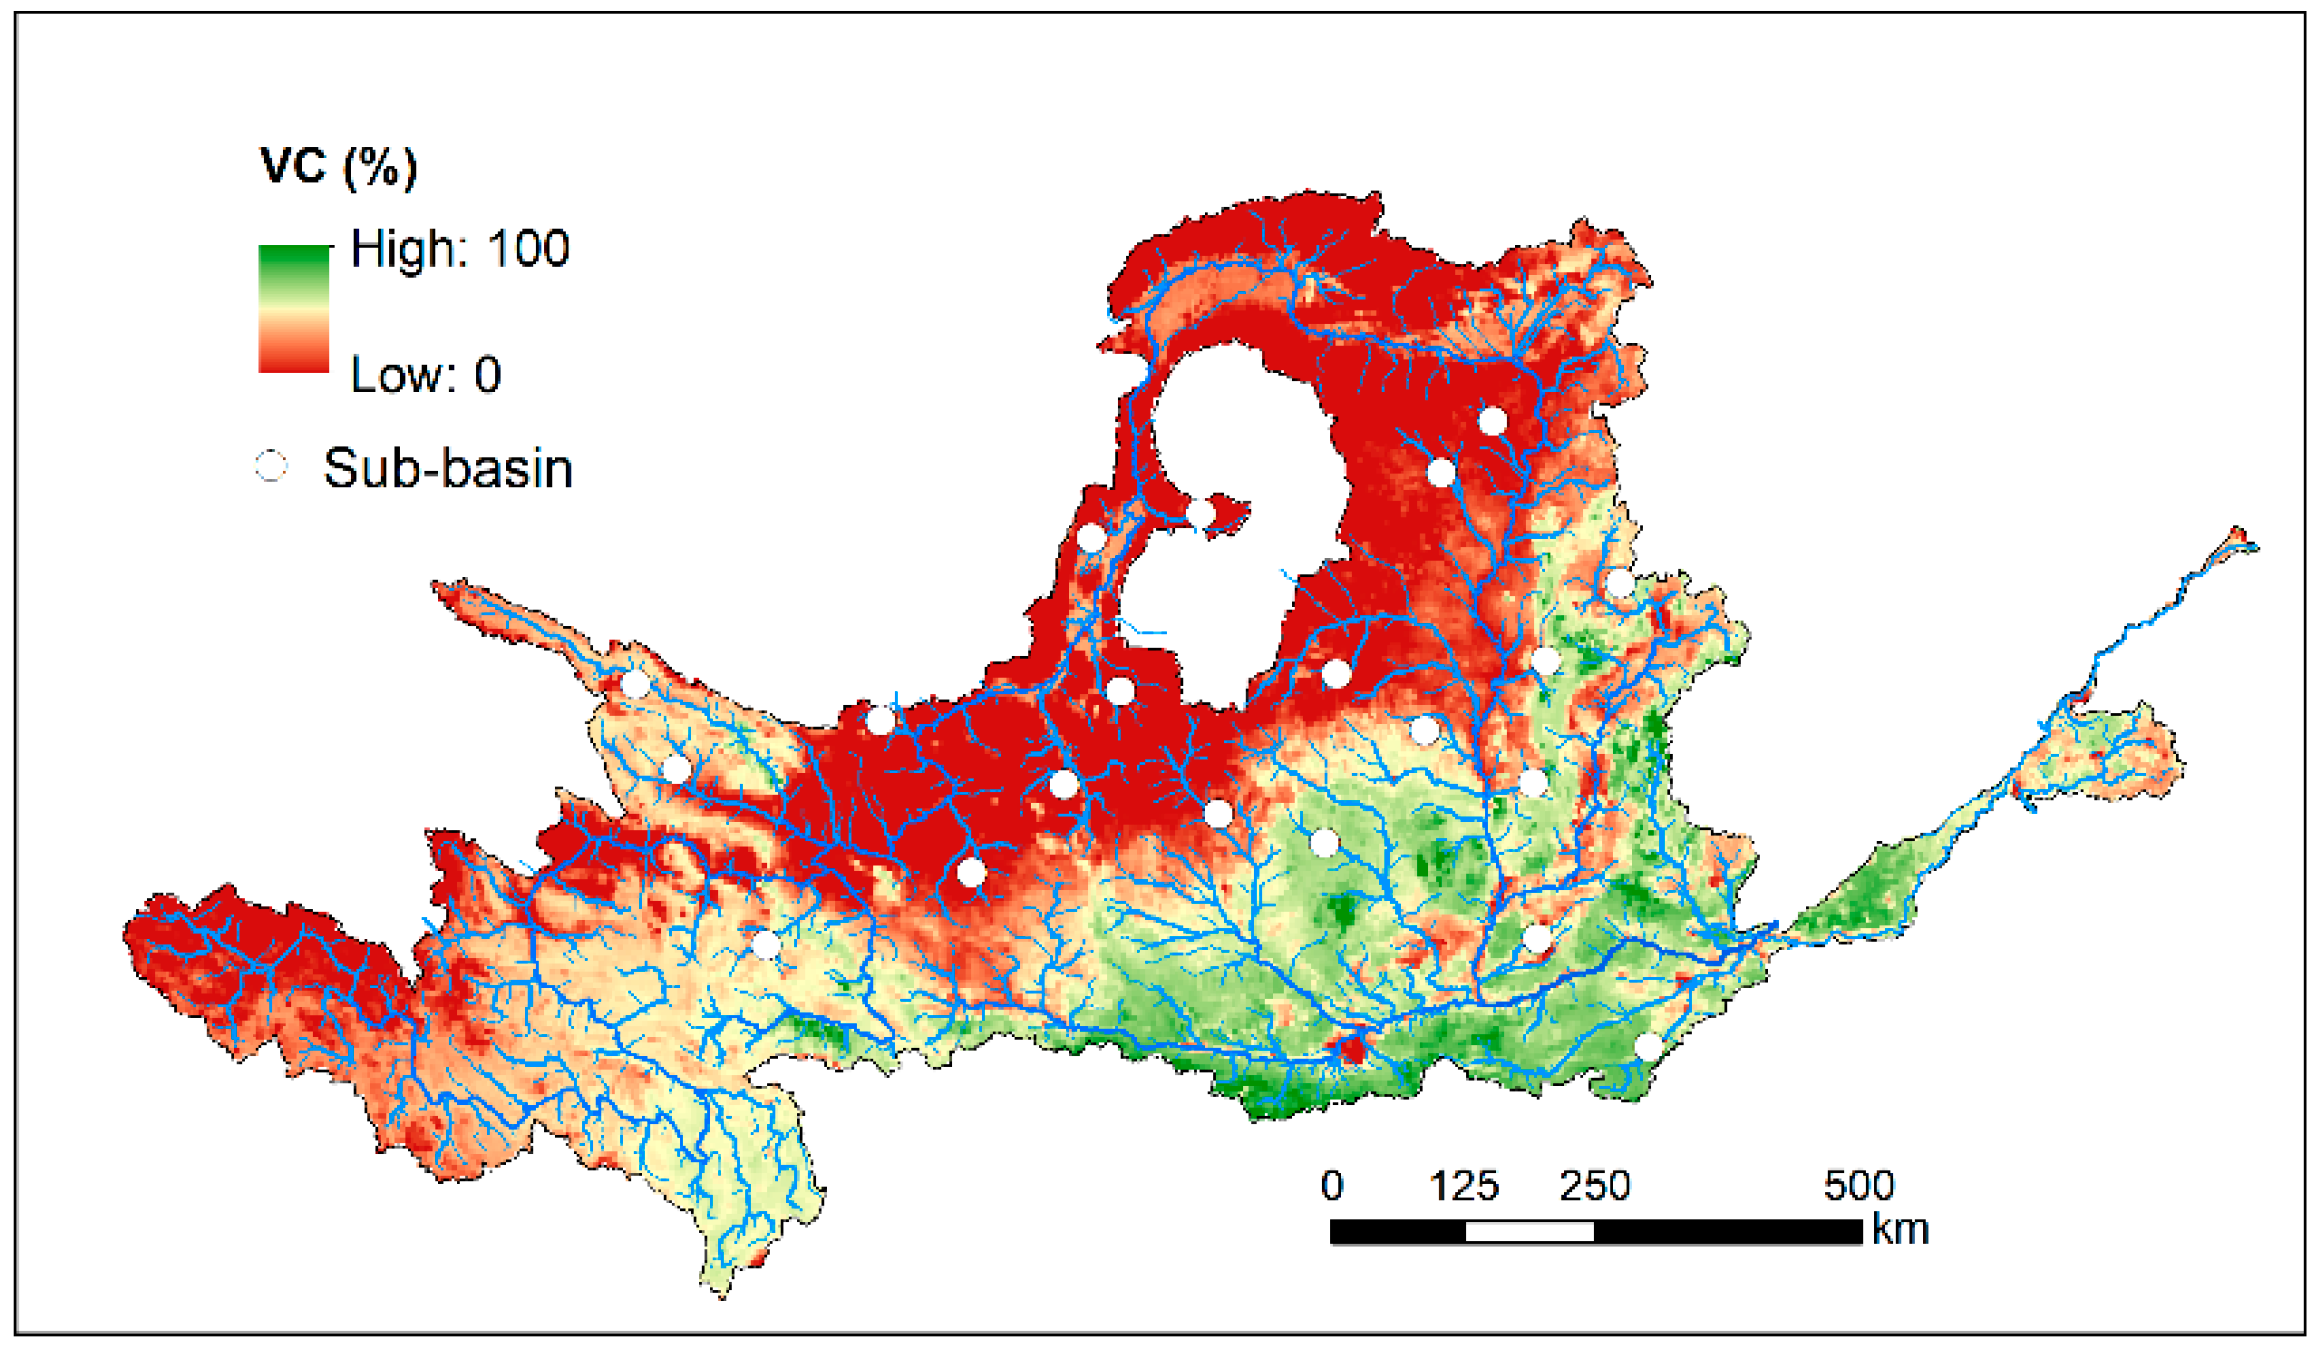
| Area proportion of vegetation | VC | % | |
| Area proportion of desert | Desert | % |
| River Basin | Structural Parameter | Median Value |
|---|---|---|
| Tarim | RB | 2.48 |
| RL | 2.03 | |
| FD | 1.38 | |
| DD | 0.24 km−1 | |
| L1 | 1.31 km | |
| L5 | 24.35 km | |
| Yellow | RB | 4.61 |
| RL | 2.15 | |
| FD | 1.92 | |
| DD | 1.24 km−1 | |
| L1 | 1.21 km | |
| L5 | 19.58 km |
Publisher’s Note: MDPI stays neutral with regard to jurisdictional claims in published maps and institutional affiliations. |
© 2022 by the authors. Licensee MDPI, Basel, Switzerland. This article is an open access article distributed under the terms and conditions of the Creative Commons Attribution (CC BY) license (https://creativecommons.org/licenses/by/4.0/).
Share and Cite
Wang, Y.; Liu, D.; Liang, E.; Ni, J. Structural Characteristics of Endorheic Rivers in the Tarim Basin. Remote Sens. 2022, 14, 4502. https://doi.org/10.3390/rs14184502
Wang Y, Liu D, Liang E, Ni J. Structural Characteristics of Endorheic Rivers in the Tarim Basin. Remote Sensing. 2022; 14(18):4502. https://doi.org/10.3390/rs14184502
Chicago/Turabian StyleWang, Yichu, Danlu Liu, Enhang Liang, and Jinren Ni. 2022. "Structural Characteristics of Endorheic Rivers in the Tarim Basin" Remote Sensing 14, no. 18: 4502. https://doi.org/10.3390/rs14184502
APA StyleWang, Y., Liu, D., Liang, E., & Ni, J. (2022). Structural Characteristics of Endorheic Rivers in the Tarim Basin. Remote Sensing, 14(18), 4502. https://doi.org/10.3390/rs14184502