Abstract
Nondestructive and noninvasive visualization and quantification of soil wetted bodies (SWBs) is of great significance to the development of water-saving agriculture. Unfortunately, measuring the parameters of SWBs is difficult due to the invisibility of SWBs buried underneath the ground and the non-variability of the soil moisture under partial irrigation conditions. Therefore, we performed a laboratory experiment to investigate what SWB attributes can be detected by a GPR. In the laboratory, three typical partial irrigation experiments were conducted to collect the GPR data of SWBs of different sizes, shapes, and burial depths. Additionally, numerical simulation scenarios were designed according to the laboratory experiment. Then, the simulated and measured GPR data were processed by the FK migration method. Based on the simulation, a calibration model for the width of SWBs was constructed. We found that SWB attributes, such as type and location can be obtained from raw radargrams owing to the obvious reflection of the top and bottom interfaces. The results showed that estimating the depth and thickness of SWBs from FK migration radargrams is more reliable than from raw radargrams. Moreover, estimation of the width of SWBs relies on the FK migration radargrams. Our findings indicate that the size and depth of SWBs dominate the width detection accuracy, and the estimated width gained via the width calibration model is improved. Our results highlight the potential for using GPR data to detect SWBs, as well as the potential of using numerical simulation, FK migration, and calibration modeling in combination to extract the size information of SWBs from GPR radargrams.
1. Introduction
Water scarcity in many regions of the world, combined with a large amount of water used in agriculture, is promoting the adoption of more efficient irrigation practices. Partial irrigation techniques, such as subsurface drip irrigation (SDI) and drip irrigation are often preferred over traditional surface irrigation because they can conserve water, increase crop production, and improve crop quality [1,2]. Therefore, partial irrigation techniques are popular in water-saving agricultural applications.
SWBs are moist zones of soil under partial irrigation conditions. In situ determination of the parameters of SWBs, such as location, size, and shape are the basis of establishing reasonable irrigation systems and realizing precise irrigation [3]. There are several traditional techniques for obtaining the parameters of SWBs [4,5]. Among them, the most reliable method is excavating a soil pit to measure. However, this method is time-consuming, costly, and invasive. Additionally, because SWBs are spatially variable, this measurement technique is of limited value when used over large areas [6]. By comparison, the second method is based on numerical, empirical, or physical hydraulic models, such as the Schwartzmass, Zur, and Richards’ equation, to obtain the width and depth of the wetted soil zone. Although these models provide a quick and easy tool, due to the great variation in the hydraulic properties of the soil, their predictions are not reliable [7]. Another method is to use a transparent device to observe the soil water distribution formed by the emitters placed on the corner of the device in laboratory experiments [8]; the SWB boundary can be visualized according to the trace of water flow. Unfortunately, due to the water flow’s preferential flowing along the walls of the box, it is not consistent with SWBs formed in the natural state. Thus, the current estimation methods of the parameters of SWBs remain inadequate and limited. Alternative techniques that allow SWBs to be detected in situ and nondestructively are, therefore, in high demand.
The use of a GPR is an electromagnetic technique to detect changes in physical properties (particularly the relative dielectric permittivity) within the shallow subsurface [9]. In particular, GPRs have proven to be a useful method for monitoring near-surface water distribution and dynamics, because GPR data are highly sensitive to variations in the dielectric permittivity, which is strongly dependent on water content and changes in relative magnetic permeability—which are negligible in most cases [10,11]. As a result, GPRs for characterizing soil water dynamics have attracted attention from some experts and scholars. Huisman pointed out that GPRs can provide reliable estimates of the subsurface water content that are comparable with TDR measurements [12]. Samara stated that the GPR technique is an accurate, precise, and alternative method to measure agricultural field soil water content [13]. Bano et al. [14] reported that the water table can be identified from GPR profiles. At present, there is little research aimed at feasible or accurate estimation of SWBs of partial irrigation by the GPR technique. The water content inside SWBs is much higher than that of the surrounding soil, which results in strong reflections on radargrams. In other words, SWBs can provide distinct dielectric permittivity contrast that can be detected with a GPR. Therefore, the presence of SWBs can theoretically be detected by a GPR. However, the shape of a SWB formed in natural soil is irregular; thus, could the SWB be identified successfully by a GPR? Moreover, if the SWB can be identified, what indicative information about it can be obtained by a GPR? Furthermore, SWBs formed by different types of partial irrigation techniques (such as drip irrigation, subsurface bubbler irrigation, and moistube irrigation) are usually different in shape or burial depth; as such, are their GPR detection results the same? In order to answer these questions, we carried out GPR detection experiments of three SWB types, i.e., formed under drip irrigation, subsurface bubbler irrigation, and moistube irrigation. The primary objectives of this research were (1) to determine particular features that occur in GPR radargrams and develop interpretation techniques for different SWB types; (2) to figure out which SWB features can be detected by a GPR; (3) to compare the GPR detection effect and accuracy of the three SWB types. We intend for this research to provide a new technique for detecting SWBs produced by various water-saving irrigation systems.
2. Materials and Methods
2.1. GPR Measurement System
A typical GPR system is based on the impulse radar technique and consists of a radar unit with transmitting and receiving antennas. Many GPR scan schemes have been developed, such as surface GPRs, off-ground GPRs, and cross-borehole GPRs. Surface GPRs, which we used in this research, are the most suitable for nondestructive scanning in situ because they do not require the drilling of boreholes (unlike cross-borehole GPRs) and are less sensitive to surface conditions compared to off-ground GPRs [15]. Radar waves are transmitted, received, and recorded as the antenna moves along the soil surface. When the pulse hits the SWB, part of its energy is reflected back to the receiving antenna, due to differences in the dielectric permittivity between the SWB and the adjacent soil (Figure 1). Higher-frequency antennas have played a key role in increasing the applicability of GPRs for subsurface body detection. These advances allow for the use of higher-frequency antennas for small-scale (cm-m) studies, where higher precision is necessary. Antennas of 900 MHz and 1.5 GHz are the most commonly used antennas for higher-precision detection. In the B-scan measurement scheme, we employed the LTD-2100 GPR system with shielded antennas centered on 1.5 GHz in the common fixed offset mode (i.e., the distance between the transmitting and receiving antennas is fixed). We used the same radar data processing software, IDS V6.0, to process the data, including zero offset, gain, and filter processing.

Figure 1.
GPR detection principal mechanism of a SWB and the radargram. TX, transmitting antenna; RX, receiving antenna; Arrows, reflection of the SWB.
2.2. Partial Irrigation Experiment
Three typical partial irrigation techniques, namely, drip irrigation, subsurface bubbler irrigation, and moistube irrigation, were employed in a 1.1 × 0.6 × 0.45 m (length × width × depth) solid wooden box with less influence on radar signal (Figure 2). There were four legs attached to the corners on the bottom of the box, which made the box stand 0.1 m above the ground. Therefore, two strong reflecting interfaces were formed between the ground and the bottom of the box, which were used for feature discrimination in the GPR radargram.
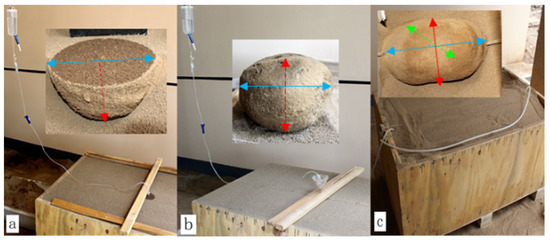
Figure 2.
Real measurement configuration and excavation pictures of a SWB. (a) For a surface drip irrigation SWB (hemisphere); (b) for a subsurface bubbler irrigation SWB (sphere); (c) for a moistube irrigation SWB (circular cylinder). The length of the blue arrow represents the length of the SWB, while the red one represents the thickness of SWB. The green arrow represents the width of the moistube irrigation SWB, which goes through the intersection of the red and blue lines and is perpendicular to them.
Considering the size of the box, the irrigation water volumes of the three irrigation techniques in the experiment were all 200, 400, and 600 mL. In particular, the 300 mL irrigation volume was assigned to the drip irrigation to measure the wave speed. The scatter of the subsurface bubbler irrigation and moistube irrigation were located 10 and 20 cm below the soil surface.
The experimental soil was obtained from the top 20 cm of the farmland without contamination and was dried naturally. Laboratory analysis of the experimental soil indicated an average bulk density of 1.32 g/m3, and the initial moisture volumetric content was 2%. According to the United States Department of Agriculture (USDA) soil classification, the granulometric analysis showed that 3% of the grains had a diameter inferior to 0.002 mm and 53% superior to 0.05 mm. These values are typical for silt loam. The box was filled with the experimental soil and smoothed.
We used a PVC infusion device for water supply, and the venipuncture, as part of the infusion device, was removed to expose the end of the catheter drip. In the drip irrigation experiment, the catheter drip, used as the emitter, was placed at a height of 0.2 cm from the center of the soil surface in the experiment box. The water flow rate was 4 mL/min. A picture of the experiment is presented in Figure 2a. In the subsurface bubbler irrigation experiment, we made our own irrigation tube, assembled by a PE tube with a length of 20 cm connected to a glass conical triangular funnel. To prevent clogging, the extremity of the irrigation tube was wrapped with gauze. The tube was inserted into the soil and then the catheter drip was placed into the funnel. In order to make the water flow slowly into the soil, the water flow rate was 5 mL/min. A picture of the experiment is presented in Figure 2b. A rubber hose with a diameter of 6 mm was used to deliver water for the moistube irrigation. There were some small holes in the middle section of the hose with a length of 15 cm, and the water flowed out of the holes. The water flow speed was 100 mL/min. A picture of the experiment is presented in Figure 2c. In this way, different types of SWBs were obtained.
When the irrigation was completed, settled for 2 h, and the water in the soil was no longer able to spread, GPR data collection started. For smooth movement of the radar, a plastic foam board with a thickness of 2 mm was placed on the soil surface during the scan. The scan parameters of the GPR were set as follows: The time window was set to 14 ns; the trace distance was set to 0.183 cm; the mode was set to automatic gain. The GPR scan lines were designed according to the SWBs’ geometry. For the moistube irrigation SWB, there were two scan lines, one (longer scan line) directly above and along the irrigation tube to obtain the length of the SWB, the other (shorter scan line) perpendicular to the longer scan line passing through the middle of the SWB. The scan lines of the other two SWBs were along the long side of the box and just above the emitter.
After the GPR scan work, we manually stripped the dry soil around the SWBs carefully until the whole body was revealed. The distance from the top of the SWBs to the upper surface of the box was taken as the burial depth of the SWBs in the soil (SWB depth). Then, we measured the length, width, and thickness of the SWBs.
Three soil samples were extracted using a ring knife equidistantly from top to bottom in each SWB. The moisture content of the samples was measured by the oven drying method (1058 °C for 24 h). Finally, the soil volumetric moisture content of the soil samples was calculated using the bulk density and moisture content.
2.3. GPR Estimation of the SWBs
In order to ensure the integrity of the excavated SWBs and the accuracy of the measurements, we mainly measured the thickness, length, and width of the SWBs (Figure 2).
The scatters within the B-scan GPR image region showed up as hyperbolic curves because of the different travel times of the electromagnetic (EM) wave while the antenna was moving along the scanning direction. Such information is sufficient if only to sense SWBs. However, it is possible to obtain the outline of the SWB profiles from this information. Therefore, the hyperbola and dispersion in the space-time GPR radargram ought to be converted to a focused one in order to demonstrate the SWB’s factual location and size, together with its scattering amplitude. Migration methods have been widely used for the focusing of GPR data to increase the spatial resolution of GPR images [16,17,18,19]. FK migration, also known as frequency–wavenumber migration, utilizes the ESM idea and the scalar wave equation [20,21,22,23,24]. The FK migration algorithm can realize the migration of the offset by transforming the wave equation from the time–space domain to the frequency–wavenumber domain, with good computing stability and high homing accuracy [25,26,27,28]. In order to eliminate the hyperbolic type of diffraction, simulated and measured B-scan GPR data were used for GPR imaging (named the FK radargram) via the FK migration method. This process was applied using the software Reflex v7.5. Based on the FK radargram, we obtained the SWB outline by prolonging the top and bottom interfaces until they met. Then, the size of the outline was taken as the SWB size.
When the experimental box was filled with dry soil, the GPR moved across the soil surface to capture a radargram. The two-way pulse travel time t between the two reflections (the air–soil interface and the bottom of the wooden box) was obtained, and the EM velocity of the dry soil was estimated by t and the dry soil thickness D using Equation (1).
vd = 2D/t,
The SWB depth was estimated by the two-way EM travel time td from the air–soil interface to the top of the SWBs and vd.
Dd = 0.5tdvd
The dielectric constant was approximately uniform inside the SWBs due to the similar average volumetric moisture content for each SWB. As a result, we used the EM velocity within the SWB with a 300 mL irrigation volume to represent all SWBs. The same as the SWB depth, the SWB thickness was estimated by the EM velocity and travel time inside the SWBs.
2.4. GPR Numerical Simulation of the SWBs
2.4.1. Simulation Experimental Scenarios Design
As in Figure 2, SWBs generally present a shape similar to a hemisphere when using surface drip irrigation, to an ellipsoid when using a subsurface bubbler and moistube irrigation. In order to clarify the GPR signal characteristics of SWBs of different sizes and burial depths, we designed three simulation scenarios of SWBs of different sizes and depths.
- (1)
- Different sizes models
Simulation scenario 1: We designed a model for simulating surface drip irrigation SWBs of different sizes. There were three SWBs shaped like a hemisphere, with a radius of 10, 15, or 20 cm (Figure 3).

Figure 3.
Schematic diagram of a drip irrigation SWB model. Unit: Meters.
Simulation scenario 2: We designed a model for simulating subsurface SWBs of different sizes. This model included three spheres with a radius of 5, 7.5, or 10 cm; all were buried at a depth of 10 cm beneath the surface (Figure 4).

Figure 4.
Schematic diagram of a subsurface SWB model. Unit: Meters.
- (2)
- Different burial depths model
Simulation scenario 3: We designed a model for simulating subsurface SWBs of different burial depths. There were four spheres with the same radius of 10 cm and a burial depth of 5, 10, 15, or 20 cm (Figure 5).

Figure 5.
Schematic diagram of a SWB model with different burial depths. Unit: Meters.
2.4.2. GprMax Setting
The simulator GprMax V2.0 was employed to obtain a GPR simulation radargram. Based on the finite difference time domain (FDTD) theory, GprMax provides a numerical solution for Maxwell’s equations in the time domain and simulates GPR wave propagation and signal properties.
GprMax can be used in two-dimensional (2D) or three-dimensional (3D) forms, depending on the nature of the problem and computing resources. Specifically, GprMax 2D is mainly used for simulating the response features of interesting reflectors on simulated radargrams. Consequently, GprMax 2D was selected as the simulator module in this study. The input parameters of GprMax included the spatial geometries of simulation scenarios (as illustrated in Figure 3), those associated with the GPR system settings, and the EM properties of the involved media.
According to referential studies [29], Ricker pulses centered on 1.5 GHz, which exhibit similar waveforms to field GPR waves, were selected to be the source wavelet. Separations between the transmitter and receiver were set to 2.5 cm, according to the design of the antennas. The advancing step distance of the antennas was set to 1.0 cm, and the thickness of the air layer between the antennas and the soil surface was arbitrarily set to 5 cm. The mesh was set to 2.5 × 2.5 mm in a domain of 3 × 0.6 m. The computation time step was 15 ns. The other parameter settings and simulation procedures for GprMax can be found in the work of Giannopoulos [30].
According to the above model parameters and configuration, using the program compiled by MATLAB and GprMax2D, a simulation experiment of the radar waves of SWBs produced by three kinds of partial irrigation systems was performed.
3. Results
3.1. Numerical Simulation Results and Analysis of the SWBs
3.1.1. The Reflection Characteristics
The single waveforms (green solid lines in Figure 6, Figure 7 and Figure 8) show that the total reflections of the SWBs on the GPR simulation radargram are very clear due to the lower signal loss. Additionally, all of the SWBs’ boundaries can be more easily recognized due to the strong EM wave reflections caused by the significant dielectric constant contrast between the external and internal zones of the SWBs. On the radargrams, the yellow lines display the position of the interface between the soil and air. In this case, the SWBs’ reflections are well represented by two reflection curves, which are highlighted by green dotted lines, indicating the top and bottom reflection curves of the SWBs. On the raw radargram, the top reflection of the SWB under drip irrigation has the form of a shape with a level line and curved ends, while the bottom reflection has the form of hyperbolas (Figure 6a). Moreover, the distance from the level line to the vertex of the hyperbolas corresponds to the SWB thickness. The top and bottom reflections of the SWB under subsurface irrigation are double-reflection hyperbolas (Figure 7a), and the distance of the double hyperbola vertexes corresponds to the SWB thickness.
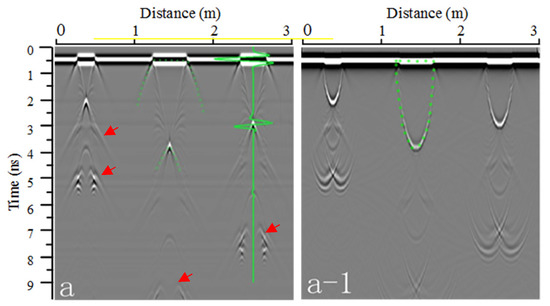
Figure 6.
Simulated radargrams of surface SWBs of different sizes: (a) The raw radargram; (a-1) the FK migration radargram.
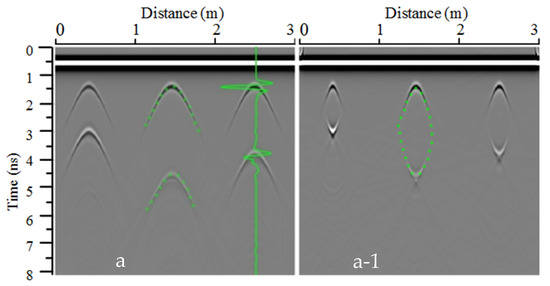
Figure 7.
Simulated radargrams of subsurface SWBs of different sizes: (a) The raw radargram; (a-1) the FK migration radargram.
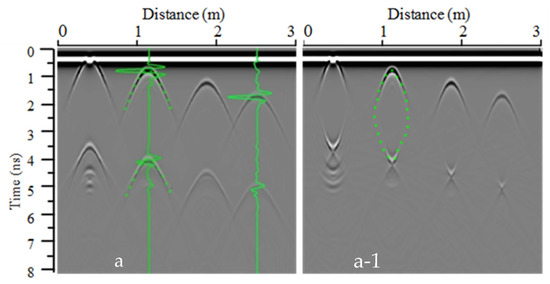
Figure 8.
Simulated radargrams of subsurface SWBs of different depths: (a) The raw radargram; (a-1) the FK migration radargram.
Meanwhile, in Figure 6, we can observe several multiple reflections (red arrows) under the wetted bodies, which present the same shape as the top and bottom reflections of the SWBs. Among the comparison of these SWBs of different thicknesses, the thicker the SWBs, the weaker the multiple reflections. It is thought that the thickness of SWBs can affect the multiple reflections. This phenomenon is probably caused by the reflections reciprocated between the edges of the SWBs when the EM wave propagates in them. During the propagation, the electromagnetic wave energy is attenuated, and the thicker the soil wetted body, the longer the path of the electromagnetic wave and, correspondingly, the more the electromagnetic wave energy is attenuated.
Although the raw radargram can reflect the position and boundary of a SWB in the soil, this kind of GPR radargram cannot visually display its real shape, which is difficult for the amateur interpreter. Aiming at obtaining the true shape of the SWBs from the GPR image, the FK migration method was applied in the radargram. The migrated radargram is displayed in Figure 6, Figure 7 and Figure 8 (labeled by a-1) and the SWB’s boundary is outlined by dashed lines, as represented, where we can see that the boundary of the SWB is very clear and similar to the real shape: The drip irrigation SWB presents a semicircle (highlighted by a green dashed line); the subsurface SWB presents a shape similar to an ellipse because the hyperbolas and radar wave energy converge and return to the ends of the top and bottom interfaces (highlighted by a red dashed line).
3.1.2. GPR Detection Accuracy of SWB Size
The thickness and burial depth were estimated based on Figure 6, Figure 7 and Figure 8, and the results were the same as the simulation settings value, indicating that the shape of the SWB does not influence the simulation detection accuracy of its thickness or depth. However, the width detection accuracy of the subsurface SWB was much lower, with a relative error of 84.45–129.47% (Table 1 and Table 2 and Figure 9). This phenomenon was probably caused by the EM wave diffraction effect, although FK migration can focus the EM wave to a certain degree [31].

Table 1.
The width relative error of SWBs at different depths (simulation scenario 2).

Table 2.
The width relative error of SWBs of the same size (simulation scenario 3).
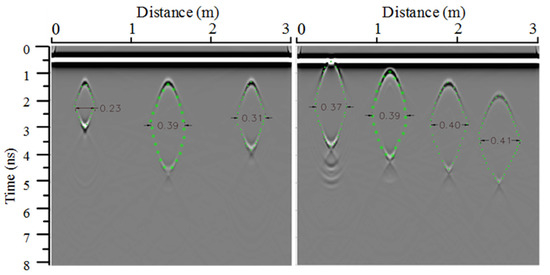
Table 1 and Table 2 show that the relative errors were all positive, indicating that the width detected by GPR was longer than the real value. Furthermore, the relative error of the width was bigger when the SWB was located deeper in the soil. Moreover, the width errors of the SWBs of different sizes at the same position were also different––the larger the width, the lower the error tended to be. This indicates that the size and depth of a SWB dominate the width detection accuracy of the GPR. Based on these laws, we warped the width detected by the GPR to obtain a more accurate width of the SWBs.
3.1.3. Calibration Model for the SWB Width
According to Table 1, a relationship model between the burial depth and width error was established to correct the influence of depth on the width of the SWBs detected by the GPR. The model is outlined in Equation (3).
where a1 is the relative width error and de is the SWB depth detected by the GPR.
At the same depth, the influence of the SWB size on the width error was estimated by Equation (4).
where is the calibrate coefficient of the width error of the SWB at the same depth; W is the warped width of the SWB; a and b are the coefficients, determined by combining the data rules in Table 1 and Table 2 through multiple adjustments, as shown in Equation (5):
Then, the width relative error a2 of different sizes and depths can be calculated by Equations (6) and (7):
where is the width detected by the GPR.
Combining Equations (3)–(7), the process of deriving the warped width is as follows:
Using Equation (10), the width detected by the GPR of each of the simulated SWBs was warped, and the results are listed in Table 3, with the mean width relative error of the SWBs being –0.9%.

Table 3.
The relative error of the warped width.
3.2. Real Measurements Experiment of the SWBs
3.2.1. The Reflection Characteristics
Figure 10 shows SWB excavation photos corresponding to the GPR’s middle scan trace (Figure 11a–c), where the shape of the SWB formed under drip irrigation is similar to a regular hemisphere. The shape of the SWB of the subsurface bubbler was an irregular sphere, with the top part being flat and the bottom part being slightly bulged. Meanwhile, the shape of the SWB formed under moistube irrigation was an irregular circular cylinder around the wet belt. Comparing the GPR radargrams obtained before and after irrigation (Figure 11) with the corresponding SWB in Figure 10, the existence and characteristics of different SWBs can be discriminated.

Figure 10.
Excavation photos of SWBs corresponding to the GPR’s middle scan line: (Left) For a drip irrigation SWB; (middle) for a subsurface bubble irrigation SWB; (right) for a moistube irrigation SWB.
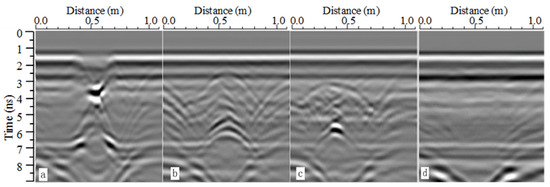
Figure 11.
GPR raw radargrams before and after irrigation: (a) For a drip irrigation SWB; (b) for a subsurface bubble irrigation SWB; (c) for a moistube irrigation SWB; (d) before irrigation (no SWB).
Figure 12, Figure 13, Figure 14 and Figure 15 show GPR radargrams of SWBs of different types of irrigation, where there is a continuous, hierarchical line in the upper part of each radargram, which is the reflection of the GPR ground direct wave. By comparison with the numerical simulation results, we found that the SWB reflections are still strong but cluttered due to the superposition with the reflection wave of the box walls. Although causing certain disturbances to SWB identification, the top and bottom surface reflections represented by the red arrows can still be clearly seen. The top reflection of the SWB with drip irrigation (Figure 12) formed a shape with a level line and curved ends, while the bottom reflection formed hyperbolas with bright bubbles (red circle). Additionally, the distance from the level line to the vertex of the hyperbolas corresponds to the SWB thickness. The top and bottom reflections of the SWB with subsurface bubbler irrigation (Figure 13) took the form of double-reflection hyperbolas, and the distance of the double hyperbola vertexes corresponds to the SWB thickness. The top and bottom reflections of the SWB with moistube irrigation (Figure 14 and Figure 15) formed double hyperbolas, with a straight line in the middle, and the distance of the line parts corresponds to the SWB thickness. As presented, the GPR radargram of the SWB buried at 20 and 10 cm shows that the deeper the SWB is buried, the harder it is to identify. This may be related to the attenuation of electromagnetic wave energy caused by the increase in burial depth.
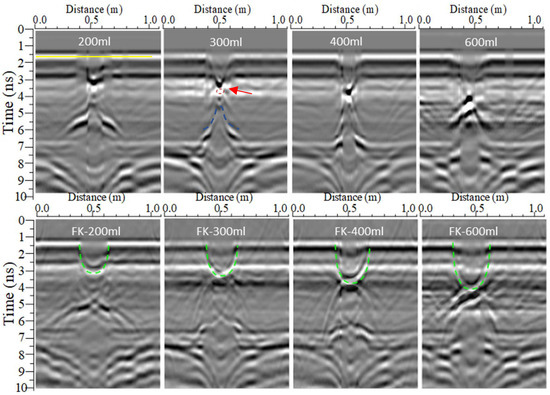
Figure 12.
Radargrams of a drip irrigation SWB. The first line is the raw GPR radargram of the SWB with different irrigation volumes, named the irrigation volume. The second line is the FK radargram of the SWB, with a rough outline of said SWB (green dotted line), named “FK-irrigation volume”.
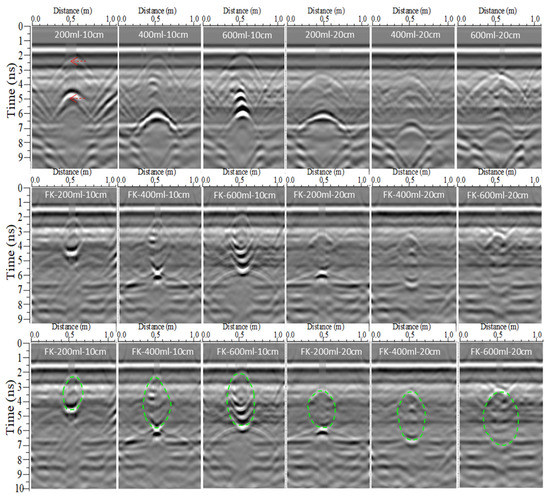
Figure 13.
Radargrams of a subsurface bubbler irrigation SWB. The first line is the raw GPR radargram of the SWB with different irrigation volumes and depths, named “irrigation volume–depth”. The second line is the FK migration results of the first line, named “FK-irrigation volume–depth”. The third line is the FK radargram of the SWB, with a rough outline of said SWB (green dotted line).
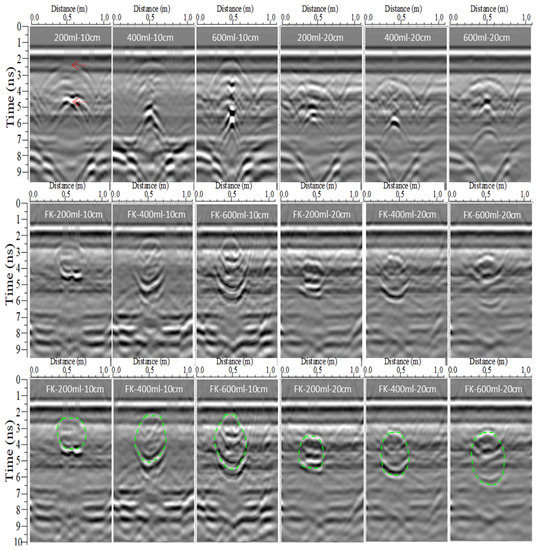
Figure 14.
Longer scan line radargrams of the moistube irrigation SWB.
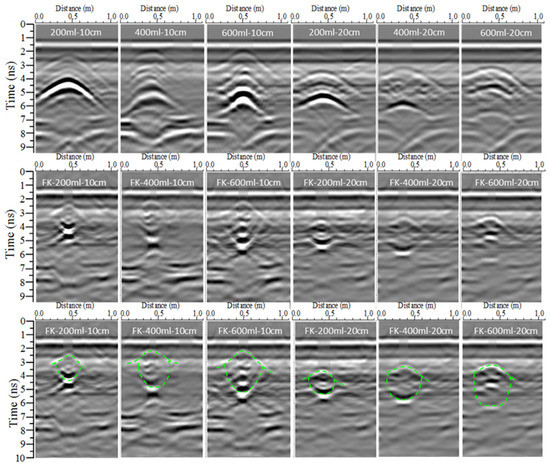
Figure 15.
Shorter scan line radargrams of the moistube irrigation SWB. Note: The first line is the raw GPR radargram of a SWB with different irrigation volumes and depths, named “irrigation volume–depth”. The second line is the FK migration results of the first line, named “FK-irrigation volume–depth”. The third line is the FK radargram of a SWB, with a rough outline of said SWB (green dotted line).
The SWB reflections are more complicated than the simulated data due to the irregular shape of the SWBs. Indeed, there is much clutter because of the uneven reflections in the real SWBs, which indicates that the dielectric properties of the SWBs are inconsistent, further implying that the soil moisture content varied within the SWBs. This can be proven by the measured moisture content results. The moisture content was not exactly the same in the upper, middle, and lower positions in the wetted body, which can be seen in Table 4. Thus, the top interface of the SWBs generated strong reflections, which reached the GPR receiver directly with little clutter due to the homogeneous dry soil. Meanwhile, when the EM waves propagated through the wetted body, they were scattered and superimposed. As a result, the reflection signals were different in direction and intensity, which looked messy and disordered in the GPR radargram.

Table 4.
The moisture content of the three kinds of SWBs.
After the FK migration, the reflection hyperbolas and radar wave energy of the SWBs converged and moved back to the apex of the top and bottom interfaces, and most of the clutter was removed, which further improved the GPR radargram resolution. As a result, the shapes, locations, and boundaries of SWBs can be clearly distinguished. In the FK radargram (green dotted line in Figure 12, Figure 13, Figure 14 and Figure 15), the SWB with drip irrigation presented an irregular semicircle, the SWB with subsurface bubble irrigation showed an irregular circle, and the SWB with moistube irrigation demonstrated an irregular ellipse. All of them were similar to the shape shown in the excavation photos of the SWBs in Figure 10.
It is worth mentioning the differences in the radargram characteristics of the moistube irrigation SWB in the longer and shorter scan lines (Figure 14 and Figure 15). In the raw GPR radargram of the longer scan line, the hyperbola of the SWB top was gentler than that of the bottom. However, in the shorter scan line, the shape of the two hyperbolas was similar. Furthermore, in the FK radargram of the longer scan line, the graphics of the top and bottom of the SWB reflection were symmetrical (the green dotted line in Figure 14), but their ends extended horizontally on the radargram of the shorter scan line (as per the green dotted line in Figure 15). This phenomenon is probably related to the SWB’s shape and the reflection angle of the radar wave from the SWB’s interface.
Radargrams of different irrigation volumes can display the changing trend of the SWB size. The radargrams of the three types of SWBs under the same burial depth show that the reflection hyperbolas from the top and bottom of the SWBs moved upward and downward, respectively, as the irrigation volume increased. However, the bottom one moved more than the top one. This phenomenon may be dominated by the potential energy of soil water.
In addition, unlike the numerical simulation results, multiple reflections under the SWB were not clearly visible; the reason may be that the clutter affected the multiple reflections and made them less obvious.
3.2.2. GPR Detection Accuracy of the SWB Size and Position
According to Equation (1), the wave velocity of the dry soil was 12.8 cm/ns. The EM velocity of the SWBs on the raw and FK migration radargrams, calculated by the SWB with a 300 mL irrigation volume, was 8.54 and 10.01 cm/ns, respectively. Moreover, the relative errors of the GPR detection are listed in Table 5, Table 6 and Table 7. The SWB depth estimation results from the migration radargram are very close to the measured values, with an average relative error of 2.4% and 3.1% for the bubbler and moistube irrigation SWBs, respectively, indicating that the reflection event originated from the surface of the SWBs.

Table 5.
GPR detection error for the thickness of the drip irrigation SWB.

Table 6.
GPR detection error for the depth, thickness, and width of the bubbler irrigation SWB.

Table 7.
GPR detection error of the moistube irrigation SWB at the longer scan line.
The GPR estimates of the depth and thickness of the three SWB types deviated from the measured values, which were different from the simulated results. In general, the thickness accuracy of the surface drip irrigation SWB was high, whether calculated from the raw radargram or the FK migration. For the subsurface bubbler and moistube irrigations, the thickness accuracy of the FK migration was higher than that of the raw radargram, which was not affected by the burial depth or the shape of the SWBs. The estimation accuracy of the SWB depth was also similar to that of the thickness, indicating that it is stable and reliable to use FK migration to estimate the depth and thickness of SWBs.
Table 6 and Table 7 show that, before calibration, the width detection accuracy of the SWBs in real soil was also low, with a relative error of 57.9%–127.8% (named Error in Table 6 and Table 7). Additionally, the errors of the width all remained positive, indicating that the width from the FK migration was longer than the measured value. Furthermore, the width estimated values of the moistube irrigation SWB at the longer scan line were less accurate than those at the shorter scan line, indicating that the SWB size and GPR scan direction are important factors affecting the width detection accuracy. In other words, the larger the SWB, the higher the width accuracy.
The GPR-estimated width was gained via the width calibration model (Equation (10)), and the accuracy was calculated as shown in Table 6, Table 7 and Table 8 (named Error-w). The accuracy was enhanced after calibration, and the absolute relative width error was reduced to 2.1%–26.0% (cm·m−1), indicating that the SWB size detection model is necessary and feasible. Further analysis found that the width accuracy of the bubbler irrigation SWB improved more than that of the moistube irrigation.

Table 8.
GPR detection error of the moistube irrigation SWB at the shorter scan line.
4. Discussion
In this paper, a GPR was used to obtain the indicative information of SWBs formed by different partial irrigation types. Among this information, it was difficult to obtain data about the width of the moistube and bubbler irrigation SWBs. One of the obstacles came from the homing accuracy of the SWB reflection. From the excavation results, the shape of the SWBs was irregular, especially that produced by bubble or moistube irrigation. This irregular shape increased the EM diffraction. Moreover, the radargrams illustrated that the dielectric properties inside the SWBs were inconsistent, which implies that the soil moisture content varied in the SWBs, and this phenomenon was demonstrated by the measured results of the soil moisture content. However, the FK migration algorithm assumed that the EM propagation velocity inside the medium was constant, and the FK migration algorithm can work well for constant-water media [32,33]. This indicates that the FK migration algorithm is not perfect for resolving SWB EM diffraction. Although the FK migration algorithm helped to obtain a focused radar image, it failed to reveal the true shape of the SWBs.
The second obstacle was the remaining error. As the width calibration results showed, even after correction, errors still remained, which may be related to the shape of the SWBs. As Figure 13, Figure 14 and Figure 15 show, only the reflections near the top and bottom of the SWBs were strong in the raw and FK transformation radargrams. However, the intensity was weaker in the reflection wings and the upper and lower reflections did not intersect, indicating that the GPR mainly received the reflection signals from the top and bottom parts of the SWBs. Signals from other locations, especially the distal end of SWBs, may fail to return to the receiving antenna. This can be explained by Figure 16; in the top or bottom of the SWB (such as position A), the propagation directions of the SWB and the radar wave were perpendicular to one another, and the radar wave reflection coefficient was the largest, similar to other locations near the top and bottom (indicated by the dotted line along the top of the SWB). On the contrary, on both sides (such as position B), the two were parallel, so no reflected wave returned; we can name this phenomenon “missing edges”. Similarly, due to the little azimuth angle θ of the EM wave and the SWB, this phenomenon also occurred near the edge of the SWB (such as position C). The deeper the SWB is located, the more EM attenuation there is and the less signal the GPR receiving antenna receives from the SWB. This brings more obstacles and difficulties for a GPR when detecting the width of a SWB. Nevertheless, comparing the FK migration radargram to the actual shape of the SWBs we found that they were identical near the top and bottom, labeled by the dotted line along the top of the SWBs in Figure 16. This highlights the possibility and basis for a calibration model of the SWB width.
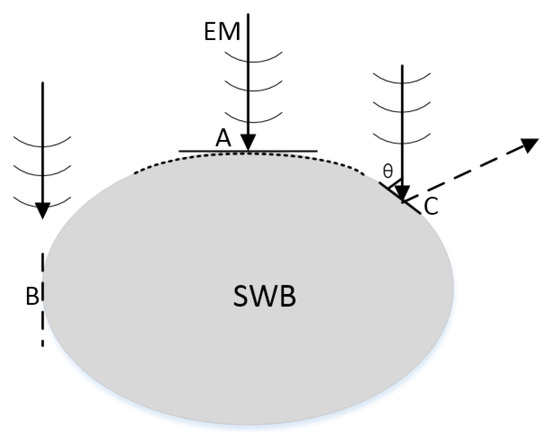
Figure 16.
A sketch of the phenomenon “missing edges”.
In addition, there were errors in the SWB depth and thickness on the measured GPR radargrams that were not in the simulated data. The possible reasons for this are as follows: One, is the influence on the GPR electromagnetic waves brought about by the detection environment and the GPR instrument noise. Second, is the dissimilarity inside different SWBs. Due to the difference in the distribution of the moisture content inside the SWBs formed by irrigation, the EM wave velocity inside different SWBs was not the same. However, we used the same wave velocity for each SWB as that of the 300 mL irrigation volume, considering its simplicity in application. The estimation accuracy was enough from a practical point of view because the actual diameter of the SWBs was several tens of centimeters. To obtain the accurate depth and thickness, the velocity should be estimated more accurately, which is left as future work.
Indeed, the results are promising in natural soil, which is reasonable and can provide effective information for precision partial irrigation management, such as the results helping farmers determine whether the dripper or equipment is faulty or has stopped working. The results are also meaningful for studying the water diffusion law of partial irrigation in situ. For example, based on the results, the diffusion trace and dynamics of soil water can be judged.
5. Conclusions
This research reported and discussed the potential of GPRs for the nondestructive detection of SWB characteristics, herein conducted in a laboratory considering SWBs of different sizes, shapes, and burial depths. From the GPR radargrams, we noticed that the graphic features of the different types of SWBs were distinct in the strong reflections from the SWBs. Moreover, they can be used to diagnose the type, position, and depth of SWBs produced by real irrigation systems. We also found that FK migration processing can result in a GPR profile close to the actual shape of SWBs by effectively collecting and processing the diffraction waves of SWBs, which makes it possible to measure the width of SWBs in GPR radargrams but fails to reveal the true shape of SWBs. In addition, we proved that simulation could provide basic results for the detection of the characteristics of actual SWBs by GPRs. Thus, we proposed a calibration model for the SWB width and found good agreement with the observed values, indicating that the indicative information, including the type, thickness, depth, and position, of SWBs can be accurately obtained by methodology combining numerical simulation, FK migration processing, and calibration models in real soil, at least in a small-scale, controlled environment. For the first time, we discovered that the phenomenon of “missing edges” is the main reason for the width error of moistube and bubbler irrigation SWBs.
In the laboratory experiment, the soil was uniform and the SWBs were surrounded by dry soil. As a result, the surfaces of the SWBs formed a clear wet–dry interface, which made the reflections strong and clear. However, in irrigation management applications, irrigation is carried out before the soil reaches the dry state to avoid affecting crop growth in the field. In this situation, the difference in the soil moisture content inside and outside the SWBs will be less than those under laboratory conditions, which would make the reflections from said SWBs weaker. In addition, the soil in farmland usually contains some scattered crop stalks and roots; therefore, the SWB shape formed in farmland will be more irregular. Accordingly, the parameters of the calibration model for the SWB width probably need to be validated and adjusted in practice; this will be carried out in future studies.
Author Contributions
Conceptualization, R.W.; methodology, R.W.; software, T.Y.; validation, R.W.; formal analysis, T.Y.; investigation, T.Y.; resources, T.Y.; data curation, T.Y.; writing—original draft preparation, R.W. and B.Q.; writing—review and editing, R.W. and E.Z.; visualization, R.W.; supervision, R.W.; project administration, R.W.; funding acquisition, R.W. All authors have read and agreed to the published version of the manuscript.
Funding
This research was funded by the Funds of the Natural Science Foundation of Shandong Province (ZR2020MD003), Shandong “Double Tops” Program (SYL2017XTTD02), Shandong Key R & D Program (2017CXGC0306) and the Cultivate Plan Funds for Young Teacher and the Science and Technology Innovation Foundation for Youth of Shandong Agricultural University (23694).
Data Availability Statement
Not applicable.
Conflicts of Interest
The authors declare no conflict of interest.
References
- Miháliková, M.; Dengiz, O. Towards more effective irrigation water usage by employing land suitability assessment for various irrigation techniques. Irrig. Drain. 2019, 68, 617–628. [Google Scholar] [CrossRef]
- Al-Othman, A.A.; Mattar, M.A.; Alsamhan, M.A. Effect of mulching and subsurface drip irrigation on soil water status under arid environment. Span. J. Agric. Res. 2020, 18, e1201. [Google Scholar] [CrossRef]
- Al-Ogaidi, A.A.M.; Wayayok, A.; Rowshon, M.K.; Abdullah, A.F. Wetting patterns estimation under drip irrigation systems using an enhanced empirical model. Agric. Water Manag. 2016, 176, 203–213. [Google Scholar] [CrossRef]
- Subbaiah, R. A review of models for predicting soil water dynamics during trickle irrigation. Irrig. Sci. 2013, 31, 225–258. [Google Scholar] [CrossRef]
- Changade, N.; Chavan, M.; Jadhav, S.; Bhagyawant, R. Determination of emission uniformity of emitter in gravity fed drip irrigation system. Int. Agric. Eng. J. 2020, 2, 88–91. [Google Scholar]
- Gao, P.; Wang, R.Y.; Zhao, G.X.; Li, Y.H. The application of GPR to the detection of soil wetted bodies formed by drip irrigation. PLoS ONE 2020, 15, e0235489. [Google Scholar] [CrossRef]
- Keller, J.; Bliesner, R.D.; Keller, J.; Bliesner, R.D. Sprinkle and Tickle Irrigation; FAO: Rome, Italy, 1990; Available online: https://www.scienceopen.com/document?vid=296d0ca8-c233-4ab1-8a07-11fd66e9c562 (accessed on 13 July 2022).
- Zhang, J.; Lei, T.; Zhang, G.; Cai, C.; Yang, X. A New Experimental Method for Observing Initial Soil Infiltration under Ring Infiltrometer. Nongye Jixie Xuebao/Trans. Chin. Soc. Agric. Mach. 2014, 45, 140–146. [Google Scholar]
- Doolittle, J.; Dobos, R.; Waltman, S.; Benham, E.; Peaslee, S. Ground-Penetrating Radar Soil Suitability Maps. In Proceedings of the Symposium on the Application of Geophysics to Engineering and Environmental Problems, Fort Worth, TX, USA, 29 March–2 April 2009. [Google Scholar] [CrossRef]
- Mahmoudzadeh, M.R.; Francés, A.P.; Lubczynski, M.; Lambot, S. Using ground penetrating radar to investigate the water table depth in weathered granites—Sardon case study, Spain. J. Appl. Geophys. 2012, 79, 17–26. [Google Scholar] [CrossRef]
- Saintenoy, A.; Schneider, S.; Tucholka, P. Evaluating Ground Penetrating Radar Use for Water Infiltration Monitoring. Vadose Zone J. 2008, 7, 208–214. [Google Scholar] [CrossRef]
- Huisman, J.A.; Hubbard, S.S.; Redman, J.D.; Annan, A.P. Measuring Soil Water Content with Ground Penetrating Radar. Vadose Zone J. 2003, 2, 476–491. [Google Scholar] [CrossRef]
- Samara, R. Assessing the applicability of Ground Penetrating Radar (GPR) techniques for estimating soil water content and irrigation requirements in the Eastern Province of Saudi Arabia: A project methodology. Int. J. Adv. Res. Eng. Technol. 2013, 4, 114–123. [Google Scholar]
- Bano, M.; Loeffler, O. Modeling GPR Reflections from a Water Table. Why High GPR Frequencies don’t Image the Water Table? In Proceedings of the Agu Fall Meeting, Vienna, Austria, 12–15 June 2006. [Google Scholar]
- Saito, H.; Kuroda, S.; Iwasaki, T.; Sala, J.; Fujimaki, H. Estimating infiltration front depth using time-lapse multioffset gathers obtained from ground-penetrating-radar antenna array. Geophysics 2021, 86, WB51–WB59. [Google Scholar] [CrossRef]
- Haridim, M.; Zemach, R. Stochastic Processes Approach in GPR Applications. IEEE Trans. Geosci. Remote Sens. 2022, 60, 1–10. [Google Scholar] [CrossRef]
- Ponti, F.; Barbuto, F.; Di Gregorio, P.P.; Frezza, F.; Mangini, F.; Parisi, R.; Simeoni, P.; Troiano, M. GPR radargrams analysis through machine learning approach. J. Electromagn. Waves Appl. 2021, 35, 1678–1686. [Google Scholar] [CrossRef]
- Shen, R.Q.; Zhao, Y.H.; Hu, S.F.; Li, B.; Bi, W.D. Reverse-Time Migration Imaging of Ground-Penetrating Radar in NDT of Reinforced Concrete Structures. Remote Sens. 2021, 13, 2020. [Google Scholar] [CrossRef]
- Hajipour, S.; Namin, F.A.; Shirazi, R.S. A novel method for GPR imaging based on neural networks and dictionary learning. Waves Random Complex Media 2021. [Google Scholar] [CrossRef]
- Gazdag, J. Wave equation migration with the phase-shift method. Geophysics 2012, 43, 1342–1351. [Google Scholar] [CrossRef]
- Stolt, R. Migration by fourier transform techniques. Geophysics 1978, 43, 23–28. [Google Scholar] [CrossRef]
- Qu, L.L.; Yang, T.H. Investigation of Air/Ground Reflection and Antenna Beamwidth for Compressive Sensing SFCW GPR Migration Imaging. IEEE Trans. Geosci. Remote Sens. 2012, 50, 3143–3149. [Google Scholar] [CrossRef]
- Paglieroni, D.W.; Beer, R.N. Spatially Adaptive Migration Tomography for Multistatic GPR Imaging. U.S. Patent 8,508,403B2, 13 August 2013. [Google Scholar]
- Tarnec, L.L.; Muth, S.; Montagnon, E.; Poree, J.; Garcia, D. Fourier f-k Migration for Plane Wave Ultrasound Imaging: Theoretical Framework. In Proceedings of the 2012 IEEE International Ultrasonics Symposium, Dresden, Germany, 7–10 October 2012; pp. 2141–2144. [Google Scholar]
- Beasley, C.J.; Lynn, W.; Larner, K.; Nguyen, H. Cascaded f-k migration: Removing the restrictions on depth-varying velocity. Geophysics 2012, 53, 881–893. [Google Scholar] [CrossRef]
- Jin, Y.; Duan, Y.L. 2D Wavelet Decomposition and F-K Migration for Identifying Fractured Rock Areas Using Ground Penetrating Radar. Remote Sens. 2021, 13, 2280. [Google Scholar] [CrossRef]
- Gilmore, C.; Jeffrey, I.; Lovetri, J. Derivation and comparison of SAR and frequency-wavenumber migration within a common inverse scalar wave problem formulation. IEEE Trans. Geosci. Remote Sens. 2006, 44, 1454–1461. [Google Scholar] [CrossRef]
- Özdemir, C.; Demirci, S.; Yiğit, E.; Yilmaz, B. A Review on Migration Methods in B-Scan Ground Penetrating Radar Imaging. Math. Probl. Eng. 2014, 2014, 280738. [Google Scholar] [CrossRef]
- Guo, L.; Lin, H.; Fan, B.H.; Cui, X.H.; Chen, J. Forward simulation of root’s ground penetrating radar signal: Simulator development and validation. Plant Soil 2013, 372, 487–505. [Google Scholar] [CrossRef]
- Giannopoulos, A. Modelling ground penetrating radar by GprMax. Constr. Build. Mater. 2005, 19, 755–762. [Google Scholar] [CrossRef]
- Yamaguchi, T.; Mizutani, T.; Nagayama, T. Mapping Subsurface Utility Pipes by 3-D Convolutional Neural Network and Kirchhoff Migration Using GPR Images. IEEE Trans. Geosci. Remote Sens. 2021, 59, 6525–6536. [Google Scholar] [CrossRef]
- Smitha, N.; Bharadwaj, D.U.; Abilash, S.; Sridhara, S.N.; Singh, V. Kirchhoff and f-k migration to focus ground penetrating radar images. Int. J. Geo-Eng. 2016, 7, 4. [Google Scholar] [CrossRef]
- Liu, X.; Serhir, M.; Kameni, A.; Lambert, M.; Pichon, L. Ground penetrating radar data imaging via Kirchhoff migration method. In Proceedings of the 2017 International Applied Computational Electromagnetics Society Symposium—Italy (ACES), Firenze, Italy, 26–30 March 2017; pp. 1–2. [Google Scholar] [CrossRef] [Green Version]
Publisher’s Note: MDPI stays neutral with regard to jurisdictional claims in published maps and institutional affiliations. |
© 2022 by the authors. Licensee MDPI, Basel, Switzerland. This article is an open access article distributed under the terms and conditions of the Creative Commons Attribution (CC BY) license (https://creativecommons.org/licenses/by/4.0/).