Abstract
The growth of air transport demand expected over the next decades, along with the increasing frequency and intensity of extreme weather events, such as heavy rainfalls and severe storms due to climate change, will pose a tough challenge for air traffic management systems, with implications for flight safety, delays and passengers. In this context, the Satellite-borne and IN-situ Observations to Predict The Initiation of Convection for ATM (SINOPTICA) project has a dual aim, first to investigate if very short-range high-resolution weather forecast, including data assimilation, can improve the predictive capability of these events, and then to understand if such forecasts can be suitable for air traffic management purposes. The intense squall line that affected Malpensa, the major airport by passenger traffic in northern Italy, on 11 May 2019 is selected as a benchmark. Several numerical experiments are performed with a Weather Research and Forecasting (WRF) model using two assimilation techniques, 3D-Var in WRF Data Assimilation (WRFDA) system and a nudging scheme for lightning, in order to improve the forecast accuracy and to evaluate the impact of assimilated different datasets. To evaluate the numerical simulations performance, three different verification approaches, object-based, fuzzy and qualitative, are used. The results suggest that the assimilation of lightning data plays a key role in triggering the convective cells, improving both location and timing. Moreover, the numerical weather prediction (NWP)-based nowcasting system is able to produce reliable forecasts at high spatial and temporal resolution. The timing was found to be suitable for helping Air Traffic Management (ATM) operators to compute alternative landing trajectories.
1. Introduction
Over the past 20 years, air traffic has increased significantly due to the creation of new hub airports, the expansion of new low-cost carriers and the growing tourism demand [1]. Numerous studies have demonstrated that severe weather conditions (such as windstorms, lightning, thunderstorms, updrafts/downdrafts, turbulence and fog) impact aviation operations [2,3]. Although the main factors in causing aviation accidents are human errors, weather conditions have a relevant contribution [4]. In particular, a report by the National Transportation Safety Board [5] mentions convective activity as one of the main adverse aviation weather conditions that can cause or contribute to aircraft accidents. In particular, mountain waves and thunderstorms can generate conditions that may lead to fatal accidents [6,7,8]. In this context, the variation of the wind speed in the flights direction and the wind vertical shear associated with convective phenomena are crucial in producing lift, hence a serious safety concern. During the takeoff or landing phases, when the aircraft is in a region with low headwind, the loss of lift caused by a strong downburst or by crosswinds [7,9] induced by intense rainfall can be a serious problem, with a significant loss of altitude until the crash. Moreover, the presence of the aforementioned severe weather conditions at the departure or arrival airport or along the flight route can lead to delays, cancellations and diversions with significant costs for flight companies and inconvenience for passengers. The impact of major storms on flight paths is responsible for about 7% of total en-route delays, with an estimated loss of about EUR 2 billion for 2019 alone. In the same year, more than 1 million extra kilometers were flown to avoid intense convective cells, resulting in over 6000 tons of extra fuel consumption and the emission of over 2000 tons of carbon dioxide [10]. Moreover, overwhelming scientific evidence has proved that due to global climate change, the intensity and frequency of extreme weather events are expected to increase in the future [11,12], with impacts that can be costly and destructive for aviation. The average en-route delay of a flight affected by a storm is expected to increase by about 3–5 min by 2050 as well as a 0.5% increase in the horizontal flight inefficiency compared with the past few years [10].
Over the past years, the use of Numerical Weather Prediction (NWP) models, followed by an increasing availability of computational power, has made possible the forecast and nowcasting improvement accuracy in order to support pilots and air traffic controllers in the management of hazardous weather conditions. However, conventional NWP has well-known difficulties in capturing the physical processes at small spatial and temporal scales which still have a significant impact on aviation. The model’s capability to correctly simulate the atmospheric processes and their dynamics depends on the spatial and temporal resolutions as well as the physical parameterizations adopted but also on the accuracy of the initial conditions [13]. In this context, the data assimilation techniques, used to ingest observed data into the model in order to provide the best possible estimate of the atmospheric state at the initial time, can improve the nowcasting of the convective cells.
One of the common problems of NWP-based nowcasting is the spinup time in rainfall prediction [14], because the model needs a couple of hours to balance the inconsistencies between the initial and boundary conditions before reproducing the small-scale dynamic properly. To reduce these issues, a warm start with three-dimensional variational data assimilation (3D-Var) in cycling mode is usually adopted to assimilate high temporal and spatial resolution observations, reducing the uncertainties in the initial conditions [15]. Several studies have shown that the cycling 3D-Var, 4D-Var and Local Ensemble Transform Kalman Filter (LETKF) improve the precipitation forecast skills [16,17,18,19,20,21,22,23], but despite the development of new parametrization schemes and the increased availability of computational resources over the last years, the prediction of the exact position and timing of convective events is still a challenge in NWP [24,25,26]. In Europe, the most common nowcasting systems, used to detect and forecast hazardous weather in support of Air Traffic Management (ATM) activities, are the Integrated Nowcasting through Comprehensive Analysis (INCA) [27,28] and AROME-NWC [29]. The first system, INCA, covers central Europe with 1 km spatial resolution and uses the NWP forecast provided by the ALADIN or COSMO models, depending on the region. The surface weather stations, radar data and satellite products, namely cloud type, are combined with NWP fields using different techniques. For the precipitation nowcasting, a classical advection method with motion vectors derived from the cross correlation is used, while the nowcasting of temperature, humidity and wind is Eulerian and based on modified trends of the NWP model. The other one, AROME-NWC, assimilates the weather stations observations, satellite radiances, aircraft-based observations and radar data with a 3D-Var method that combines the observations with the first guess from the mesoscale model AROME. However, the potential of assimilating lightning data is still unexplored from the ATM perspective. In this regards, within the Satellite-borne and IN-situ Observations to Predict The Initiation of Convection for ATM (SINOPTICA) research project, funded by the Horizon 2020 SESAR Programme, several partners have combined their skills to implement hypotheses and case studies of meteorological forecasts related to airplane flights. The project aims to improve the short-term forecast of severe convective events through the assimilation of non-conventional observations into a numerical weather prediction model to the benefit of ATM operations, with special focus on the tactical phases of arrivals. In particular, the impact of assimilating weather radar reflectivity, Global Navigation Satellite System (GNSS)-derived data, lightning and in situ weather stations has been assessed.
In this context, a squall line passage over Malpensa airport (45.6301°N, 8.7255°E, Po Valley- northwestern Italy) is chosen as a case study. Milano Malpensa airport, located in the Po Valley, is within the top 20 largest European airports in terms of passengers (20th in the list in 2019) and in terms of freight movement (14th in the list in 2019). The Po Valley is characterized by an almost flat terrain surrounded by the Alps in the northern and western sectors and Apennines in the south. The short distance from the Mediterranean Sea to the South, which advects moist and warm air, makes this area particularly complex and prone to severe and organized convection [30,31,32,33]. Thunderstorms are, in most cases, associated with frontal passage (generally cold, [30]) across the Valley and, due to the water vapor and heat accumulation at low levels, are often associated with violent phenomena, such as hail, strong winds, squall lines, supercells and even tornadoes, especially in the summer period [34]. Furthermore, due to a globally rising temperature and an increased water vapor content in the lowest level of the atmosphere, the frequency of severe weather and thunderstorms events, including lightning, hail and severe wind, are expected to increase throughout Europe under projected anthropogenic climate conditions in the next decades [35,36]. A regional climate model ensemble study [37] also simulates an increased frequency of strong instability conditions, strong deep-layer shear and model precipitation by up to 100% across Central and Eastern Europe compared with the historical period (1971–2000) under the RCP8.5 and by 30–50% under the RCP4.5 scenario. This makes Malpensa airport an excellent hotspot for this study. Then, several numerical simulations were performed using Weather Research and Forecasting (WRF) model to assess the possible benefits of the 3D-Var and nudging assimilation technique in an NWP-based system for nowcasting convective cells that can impact aviation operations. Moreover, the lightning data assimilation capability in combination with different types of observations is explored to provide more reliable forecasts able to assist air traffic controllers in implementing appropriate flight trajectories to avoid severe weather phenomena. To this purpose, three different verification approaches, object-based, fuzzy and qualitative, are used to evaluate the numerical simulations performance. The key novelties of this work lie in exploring the potential of lightning data assimilation with the WRF model from an ATM perspective for the first time in Europe, in pointing out the positive impact of lightning using three different methods for convective and stratiform precipitation and in highlighting that the assimilation of different data types is able to provide a reliable forecast in terms of spatial and temporal accuracy that fulfills the ATM requirements.
This paper is structured as follows. Section 2 provides a description of the assimilated datasets used for this study. A squall line overview, chosen as a case study, is provided in Section 3. The WRF model configuration, and a brief data assimilation method description, are presented in Section 4. The numerical simulations are described in Section 5. The results obtained from the different assessments are discussed in Section 6. Summary and future developments are given in Section 7.
2. Datasets
In the framework of the SINOPTICA project, the weather radar reflectivity, acquired by the Italian radar network, is considered. The Italian radar mosaic [38] is composed of 23 ground-based weather radars (20 C-band and 3 X-band) operated by various actors, namely the Italian Civil Protection Department (DPC), Regions and ENAV. A quality control procedure [39] is applied to the radar observations to identify and compensate for the main sources of error (non-weather returns, rain path attenuation, partial beam blocking and radio local area network interference) before generating a series of products including the reflectivity Constant Altitude Plan Position Indicator (CAPPI) every 10 min at 1 km spatial resolution. CAPPI reflectivity, a two-dimensional areal representation extracted from 3D radar volume scan data, at 2000, 3000 and 5000 m a.s.l., is assimilated into WRF model. Furthermore, a thinning procedure is applied to the reflectivity to ensure uncorrelated observation errors [40,41], and to reduce the computational complexity.
The lightning data, used for the numerical simulations, are provided by the Lightning Network LAMPINET of the Italian Air Force Meteorological Service (IAFMS), which has been operational since 2004. This network consists of 15 sensors set up between 2004 and 2005 and distributed over the whole Italian territory, including the islands [42]. It is based both on the MDF (Magnetic Direction Finding) and TOA (Time Of Arrival) techniques [43]. Network performances reach a detection efficiency of 90% for a peak current higher than 50 kA. The location accuracy is about 500 m over the whole Italian territory. The kind of sensor is IMPACT-ESP (IMProved Accuracy through Combined Technology Enhanced Sensitivity and Performance Sensor). These sensors detect radio frequency energy from CG and IC discharges in a bandwidth from 1 kHz to 350 kHz; the azimuth angle of the discharge location, time of signal arrival, peak signal strength and discharge width are also measured. The data from LAMPINET are pre-processed before being used in data assimilation. In particular, the assimilation procedure requires the computation of lightning density over the WRF grid (2.5 km horizontal resolution over Italy). For this purpose, lightning is remapped into the WRF by considering all the flashes in a time interval, associating each lightning strike to a specific grid point of the model. This grid point is the one closest to the flash. All flashes outside the model domain are discarded.
The Italian Civil Protection Department (DPC) collects data from over 5000 in situ weather stations (hereafter, DPC weather stations) managed by the regional environmental agencies. Several sensors are mounted on them, capable of transmitting the collected data to the regional collection and processing centers. Now, the DPC weather stations network includes about 2000 rain gauges, 1000 hydrometers and 4000 other sensors such as temperature sensors, anemometers and snow gauges. A quality check has not been implemented yet at the operational level, however, a quality assessment procedure is provided by Arpa Piemonte (personal communication) for the temperature data assimilated into the WRF model.
The GNSS-derived parameter that is of interest for assimilation into the WRF model is the so-called Zenith Total Delay (ZTD), that is a value combining all the signal delays along each satellite-receiver line-of-sight (LoS) into a single parameter expressing the total delay in the vertical direction over the GNSS antenna. The ZTD was estimated by a joint least-squares adjustment of undifferenced phase observations (the so-called “PPP batch” approach [44]), as implemented by GReD in the BREVA software [45]. The processing settings included the use of the Vienna Mapping Function (VMF) to map slant delays to the zenith and VMF grids to compute the a priori values for the tropospheric delay. One tropospheric delay parameter was estimated per epoch (i.e., one every 30 s), with a constraint set to 1.5 cm/h. The resulting ZTD time series were validated by comparison with radiosondes, using the 8 available radiosonde launch sites in Italy, and considering the GNSS station nearest to the radiosonde launch site. This comparison resulted in ZTD differences with RMSE values lower than 2 cm (which agrees with what is expected based on the scientific literature) [46,47,48,49]. The high variability of water vapor both in space and time requires highly dense and homogeneously distributed networks, with inter-distances between the stations shorter than 10 km. With this aim, under the SINOPTICA project, a low-cost GNSS station was purchased and deployed by GReD in the northern part of the Malpensa airport, near the city of Varese, to compensate for the lack of stations north of the airport.
3. Overview of the Convective Event
3.1. Sinoptic and Mesoscale Description
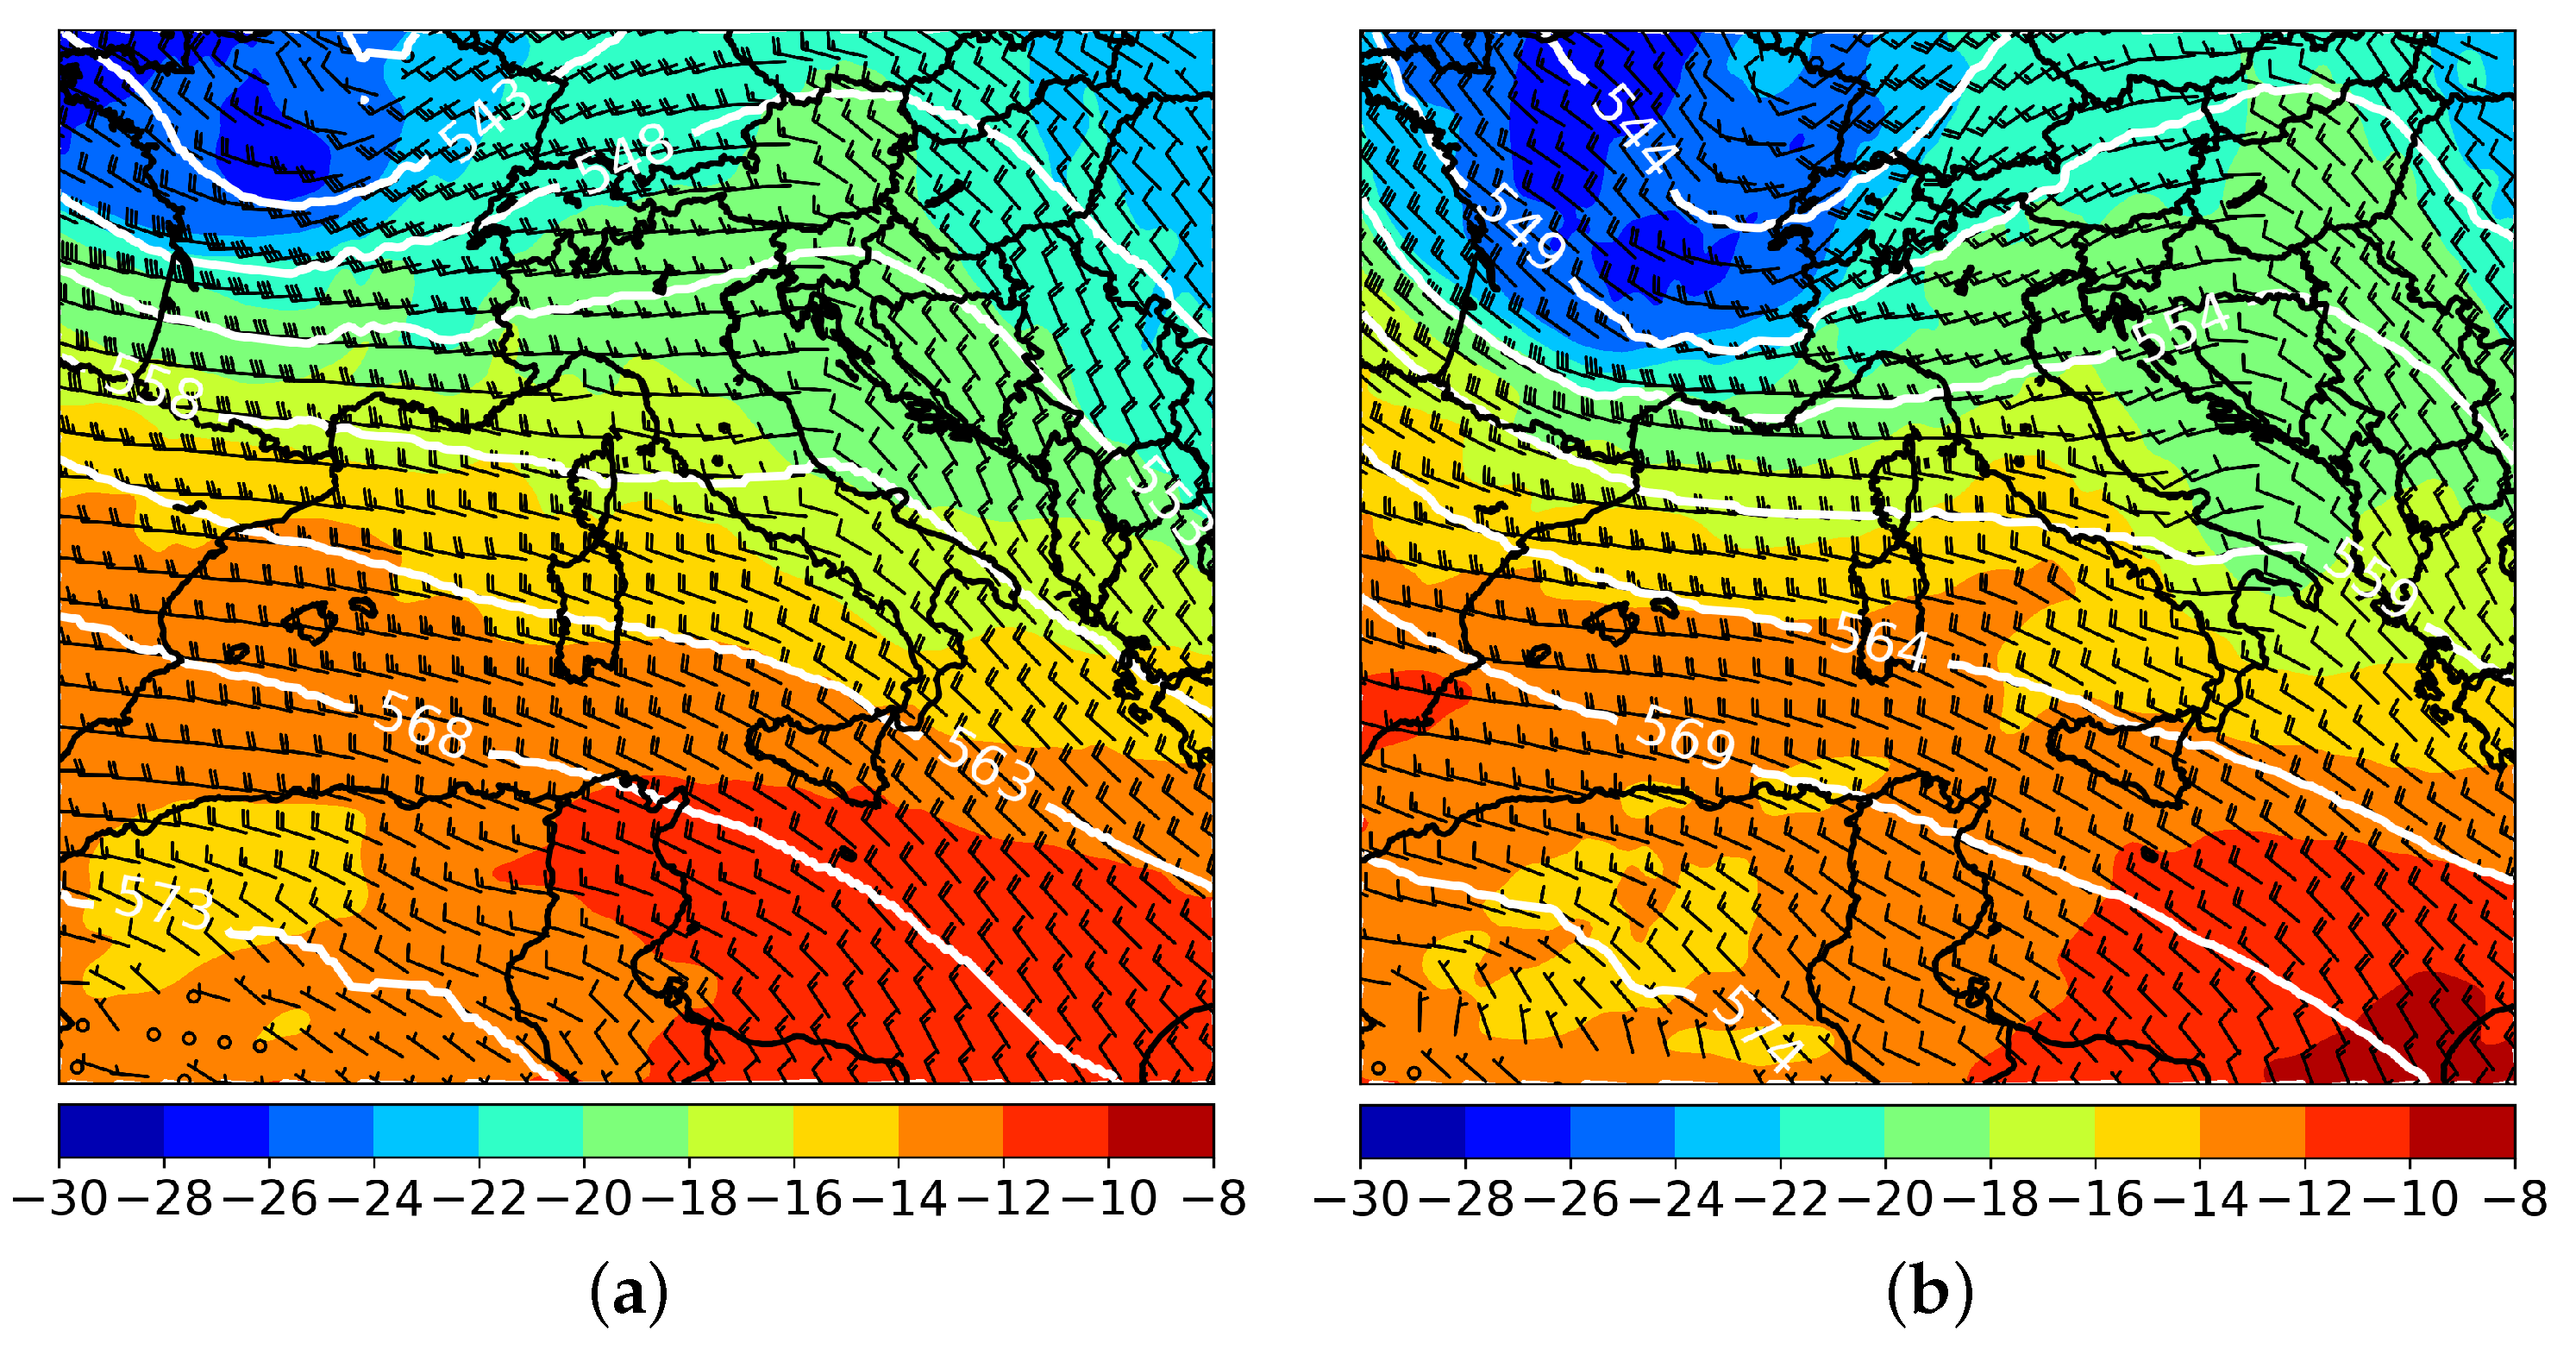
On 11 May 2019, a squall line hit the Milano Malpensa airport (45.6301°N, 8.7255°E), one of the busiest airports in Europe with over 29 million passengers in 2019. At 06:00 UTC, the synoptic scenario at 500 hPa was characterized by a stretched trough, extended from northern Europe to the Mediterranean basin, which was approaching northern Italy, whereas a weak anticyclonic ridge still affected central and southern Italy with stable condition and clear sky (Figure 1a). After six hours, a cold air mass (Figure 1b) was advected over the north-western Italian Alps and, at the same time, an intense south-westerly flow increased the air column vorticity over the plain.
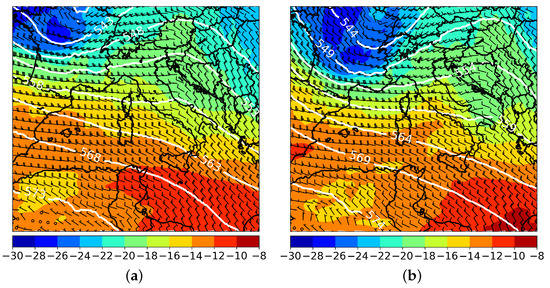
Figure 1.
European Centre for Medium-Range Weather Forecasts (ECMWF high-resolution analysis (HRES): 500 hPa geopotential height (dm, contours), temperature (°C) and wind (barbs) at 06:00 UTC (a) and 12:00 UTC (b) on 11 May.
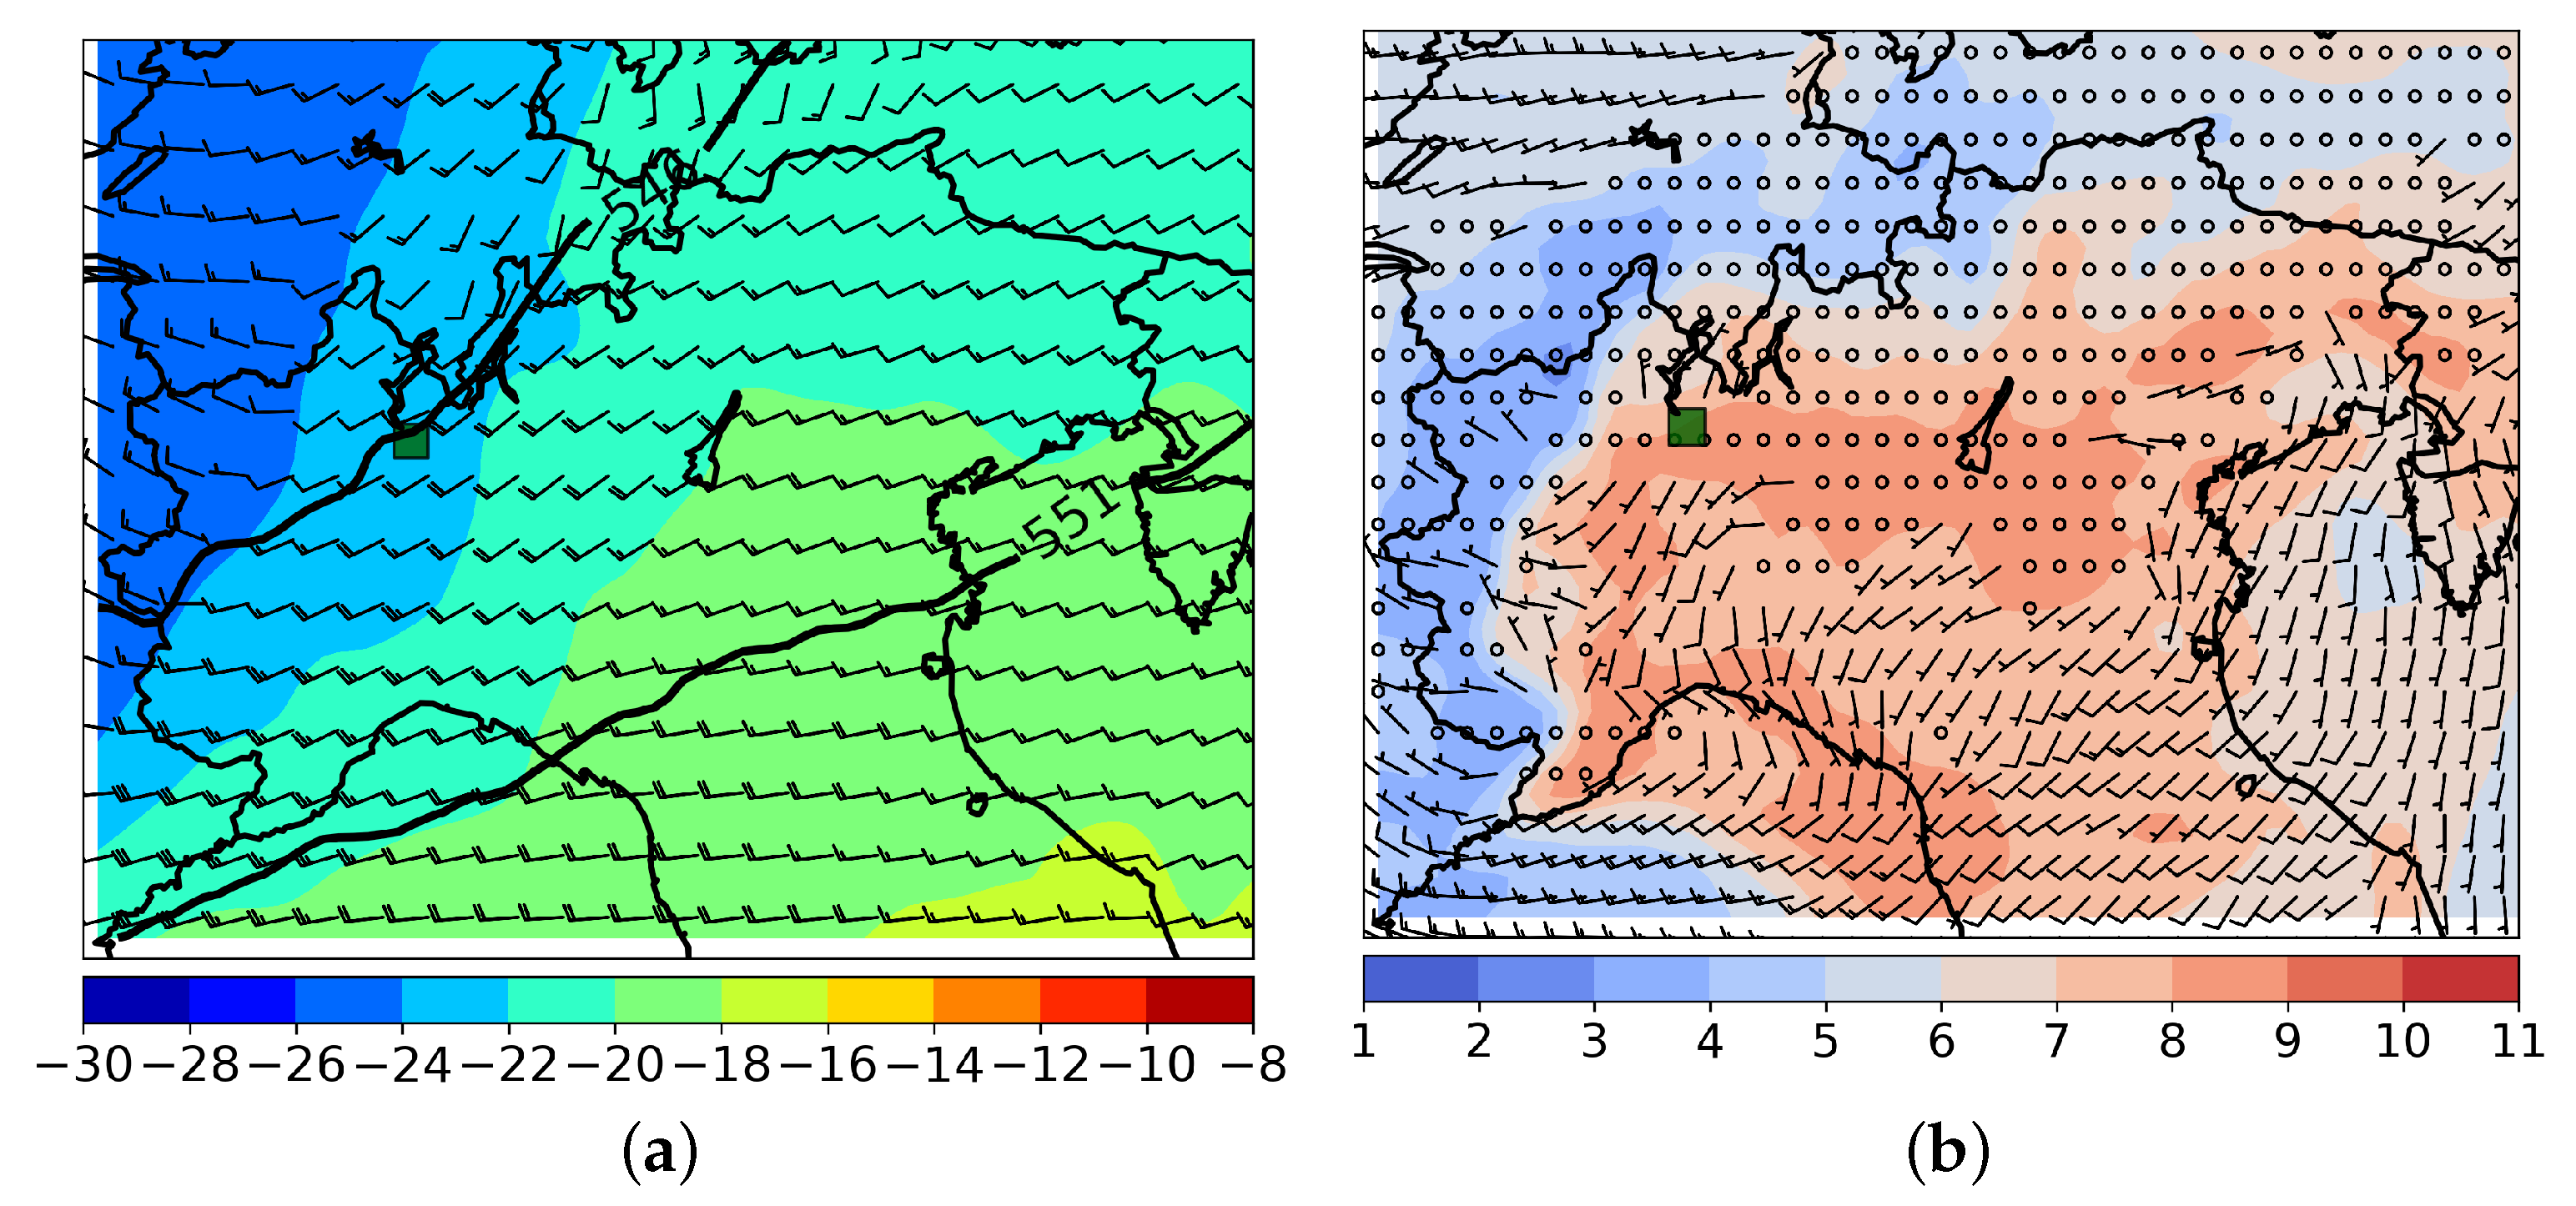
Later, the cold air mass at 500 hPa reached the Po Valley with values around −26 °C and, consequently, the winds veered to the northwest (Figure 2a). On the other hand, the strong south-westerly flow at low levels moved a large amount of water vapor from the Ligurian Sea to the inland, increasing the convective instability (Figure 2b). These meteorological factors produced favorable conditions for the convective cells triggering over northern Italy. In this context, a squall line hit the Malpensa airport between 14:00 UTC and 16:00 UTC, producing intense precipitation and heavy hail formation. The large quantity of hail over the runaways caused an airport closure for 40 min and some flight delays. In addition, nine planes were diverted to other airports. The heavy precipitation also produced several floods in the Milan city, where some underpasses and metro stations were closed. In addition, the strong downburst winds caused the falling of some trees and billboards that required firefighters’ intervention. The event caused several economic damages and a seriously injured person in the Lombardy region.
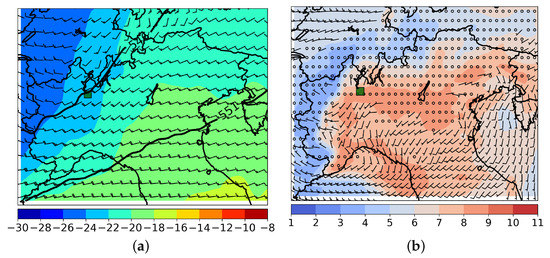
Figure 2.
ECMWF-HRES forecast starting 11 May 12:00 UTC, at 15:00 UTC (analysis is not available): temperature (°C), wind (barbs) and geopotential height (dm, contours) at 500 hPa over northern Italy (a). Specific humidity (g kg−1) and wind (barbs) at 950 hPa (b). The green square indicates the location of Malpensa airport.
3.2. Radar Observations
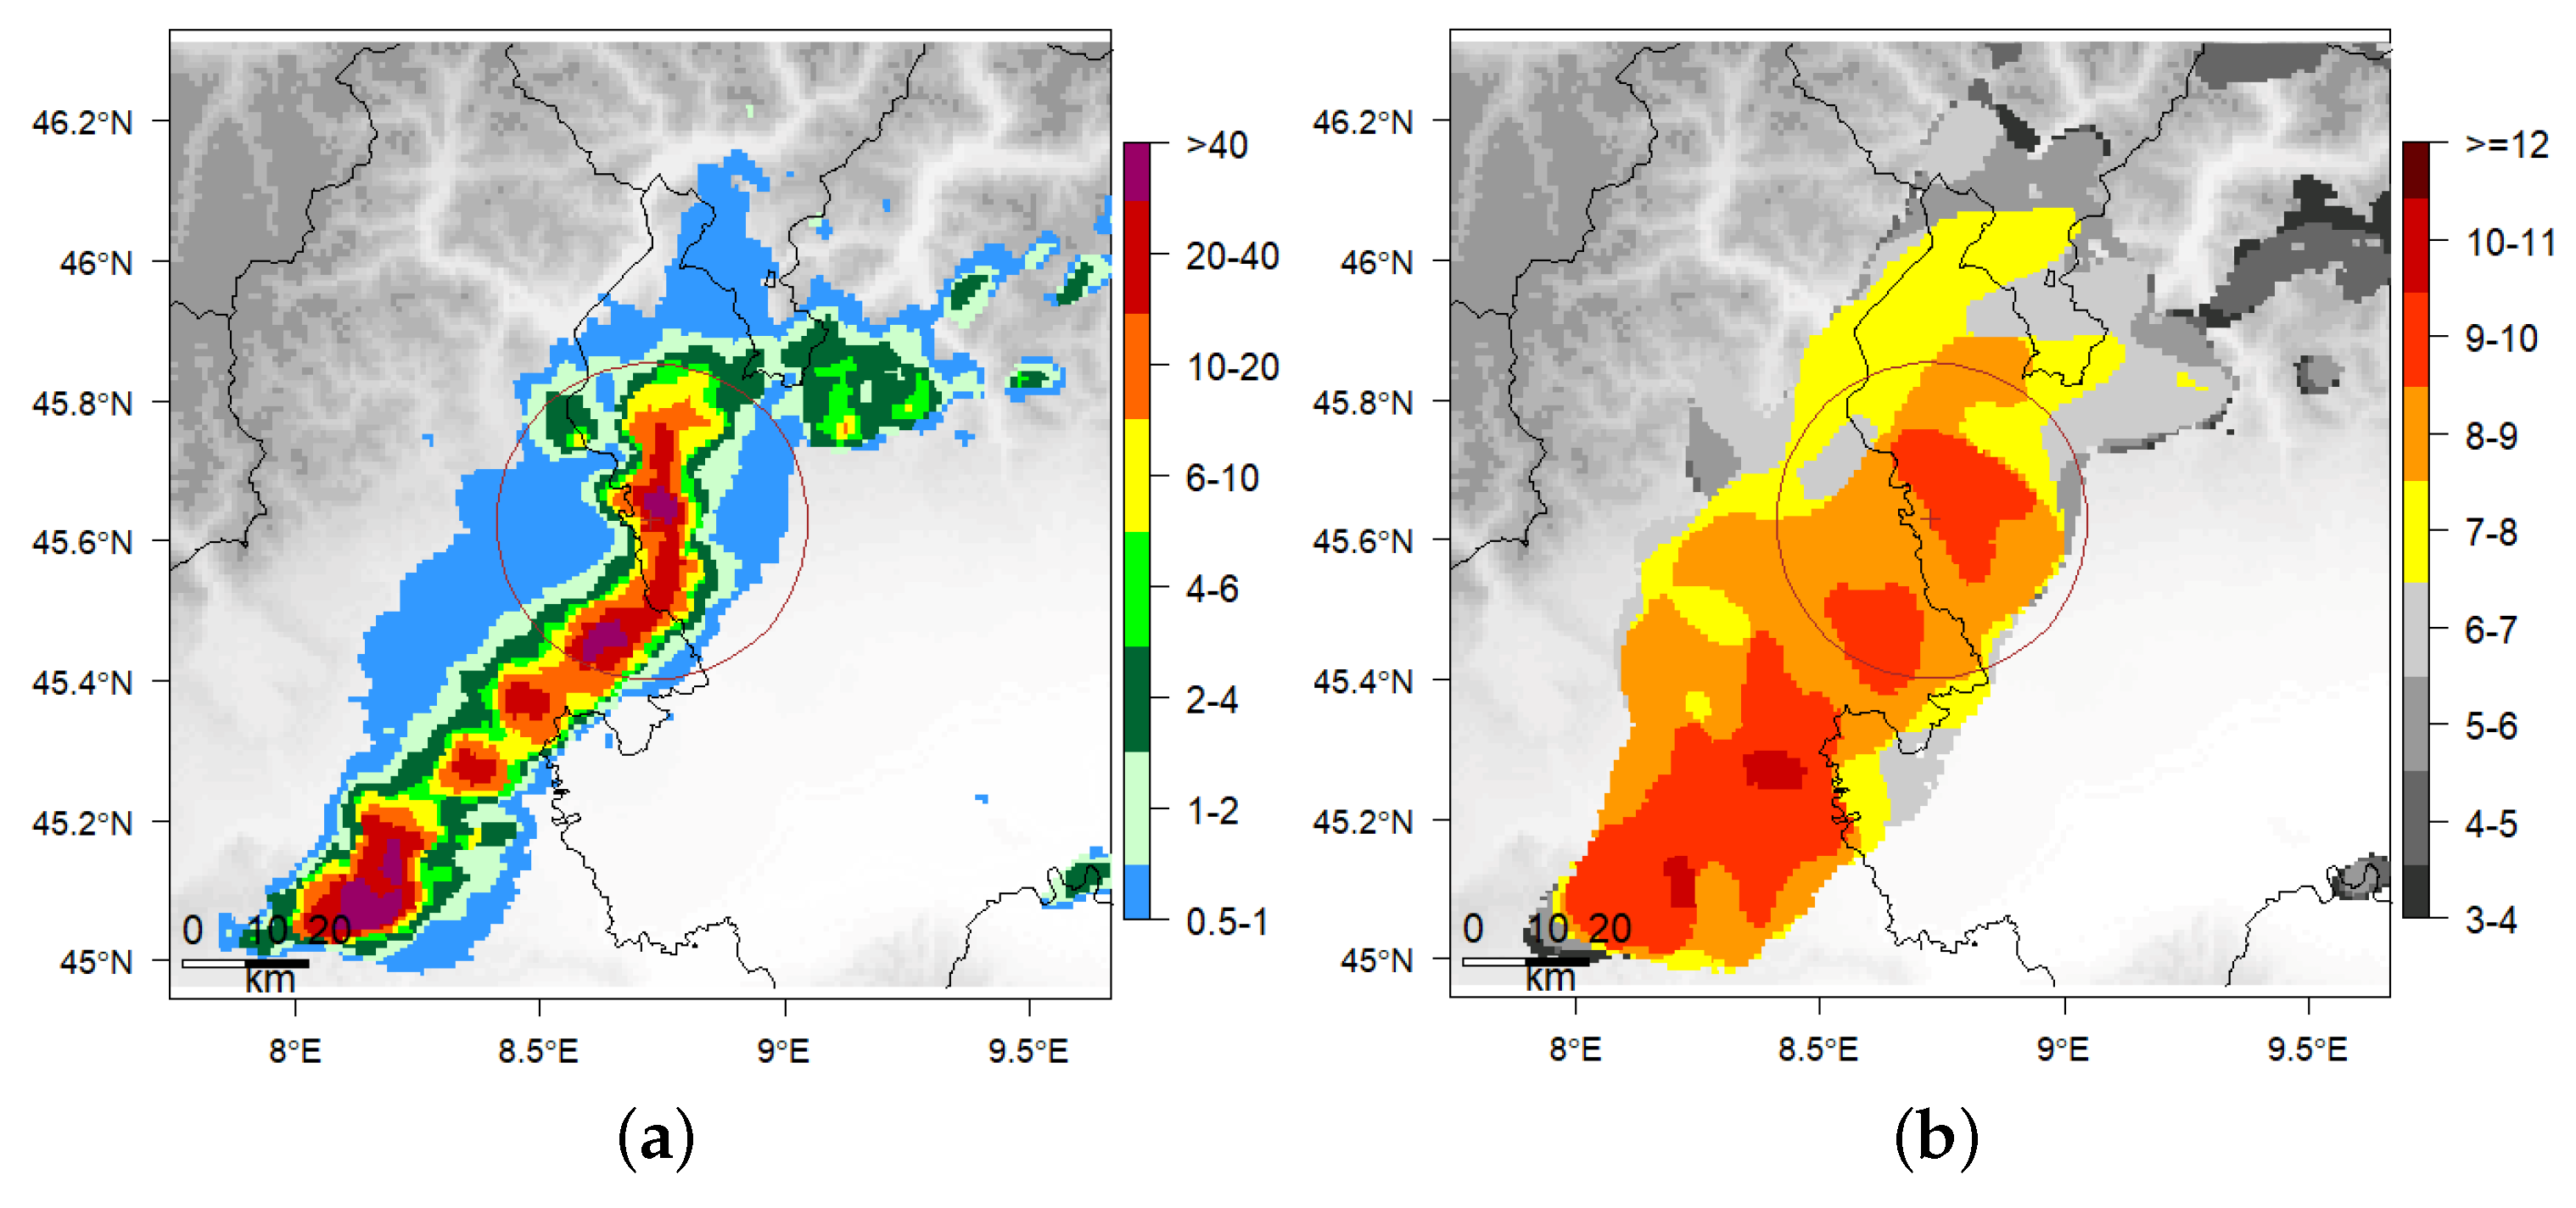
The Vertically Integrated Liquid (VIL, [50]) water content product, provided by the Italian radar network, was used to provide a more detailed description at the local scale of the event. The variable gives an estimation of the water content of the cloud considering the exponential drop-size distribution proposed by [51]. The VIL data showed the first signature of the convective system around 12:00 UTC over the north-western Alps, close to the Italy–France border. Then, a squall line rapidly developed, growing both in intensity and size (along its north–east axis) during its southeastward movement. The convective system reached maximum intensity between 14:00 UTC and 16:00 UTC with VIL values greater than 40 kg m−2 and a length of about 100 km. It was precisely at this stage that the storm hit the Milano Malpensa Airport (Figure 3a), producing large accumulation of small hail. Later, the convective system split in two parts: the first one moved to the south, dissipating its energy, the other strengthened and moved northeastward, showing significant VIL values until 19:00 UTC.
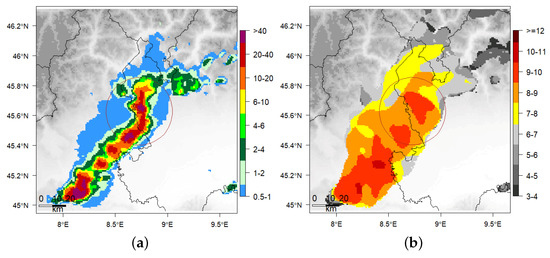
Figure 3.
VIL (kg m−2, (a)) and ETM (km, (b)) radar products at 14:50 UTC when the squall line has affected the Malpensa airport, producing a large amount of hail on runways that caused the closure. The red circle is centered on the Malpensa airport and has a radius of 50 km.
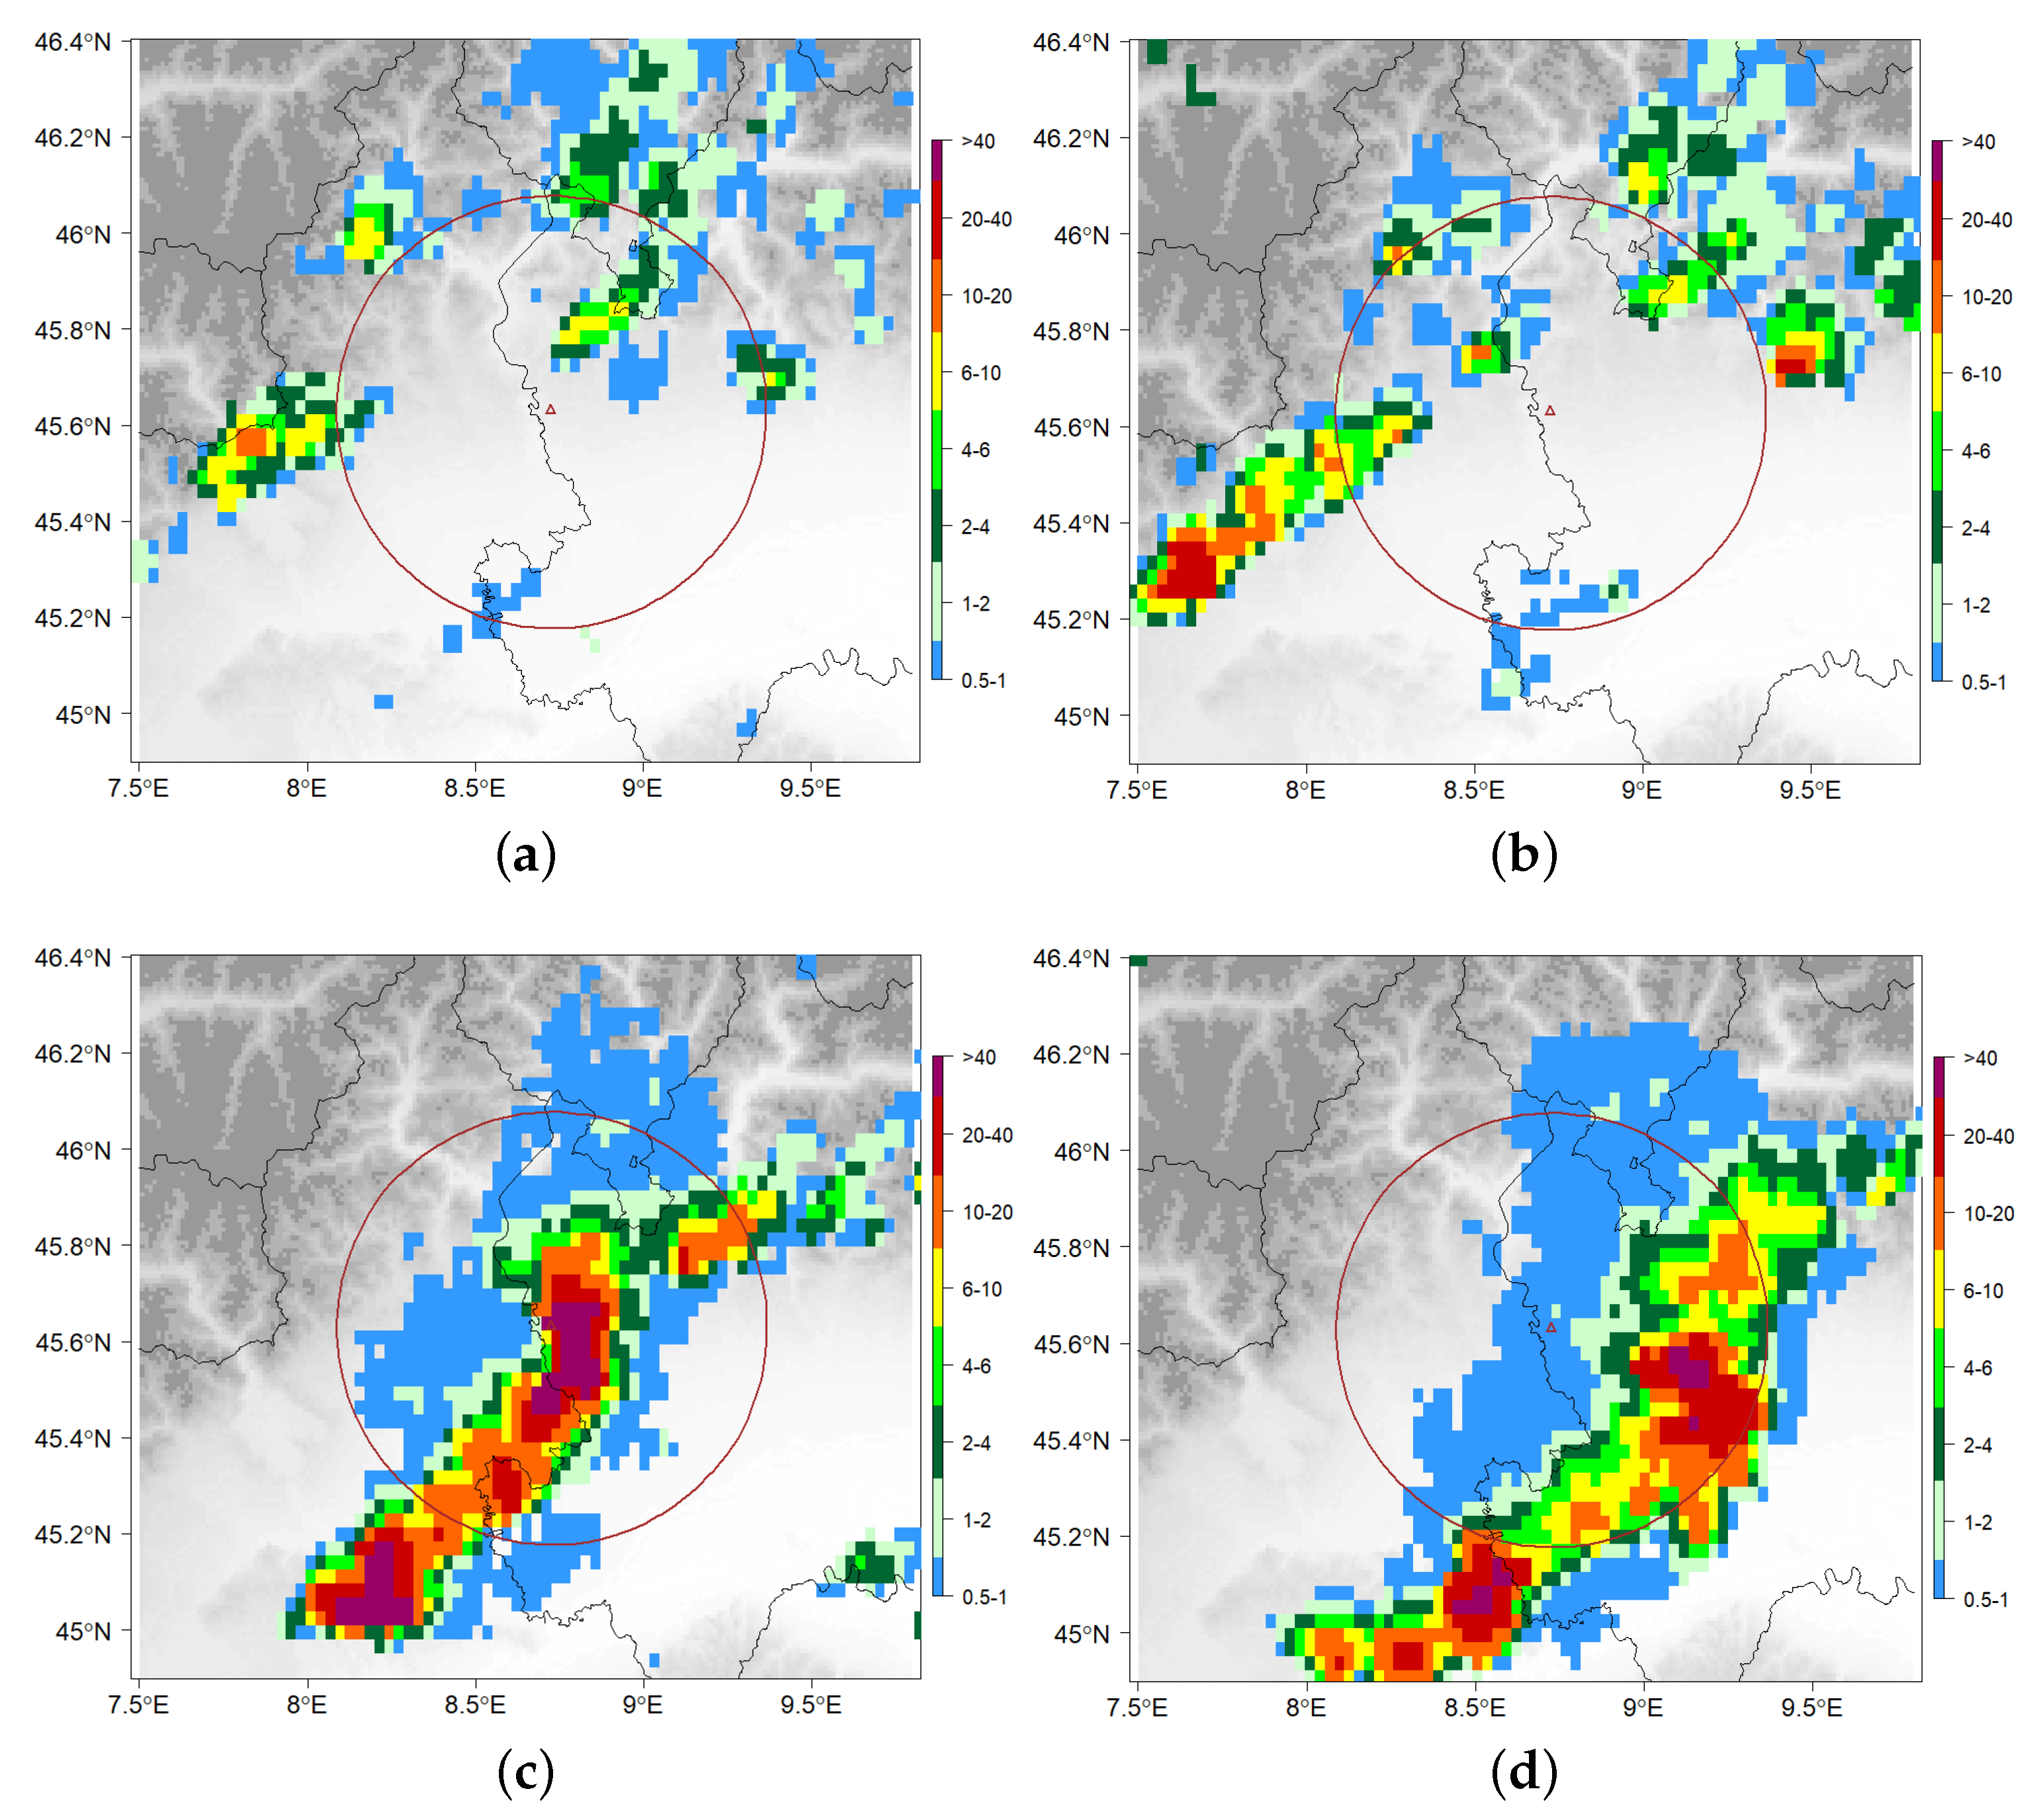
To further investigate the squall line characteristics, the VIL was compared with the storm clouds maximum height, so the Echo-Top Maximum (ETM) height of the 20 dBZ. Figure 3b shows that the cloud top was mostly around 9 km, with a maximum up to 10 km. Considering that the storm developed downwind of the Alps, mainly triggered by the convergence created by the low mesoscale, the orographic forcing did not play a relevant role, a factor that joined with a weak water vapor advection. These factors may explain a cloud top that was not so pronounced and high, but not extreme, VIL values. When analyzing in more detail the storm system evolution in the region surrounding the Malpensa airport, it becomes clear how challenging it was to predict this severe event. The storm developed in fewer than two hours not so far away from the area of interest (Figure 4a), and the cell size also increased rapidly only 1 h before the airport closure (Figure 4b). Indeed, the maximum VIL value exceeded 40 mm in a circular area (<5 km diameter) over the airport, between 14:50 UTC and 15:05 UTC (Figure 4c). This value is consistent with hail precipitation in spring season. Later, the VIL values slightly started to decrease (Figure 4d).
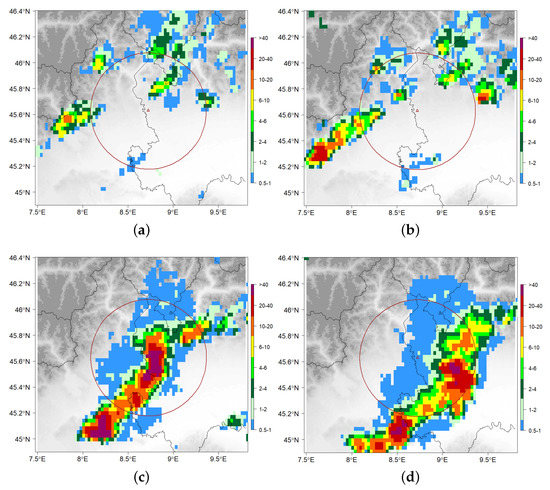
Figure 4.
Sequence of images from the Italian radar network showing the evolution of the squall line that occurred on 11 May 2019. VIL (kg m−2) product obtained at 12:50 UTC (a), 13:20 UTC (b), 14:50 UTC (c) and 15:35 UTC (d) is shown. The red circle is centered on the Malpensa airport and has a radius of 50 km.
4. WRF Model and Data Assimilation
The WRF model v3.8.1 [52] was used to simulate the convective event, whereas the data assimilation was performed by using the WRF Data Assimilation (WRFDA) system [53] in version 3.9.1.
4.1. WRF Domain Setup
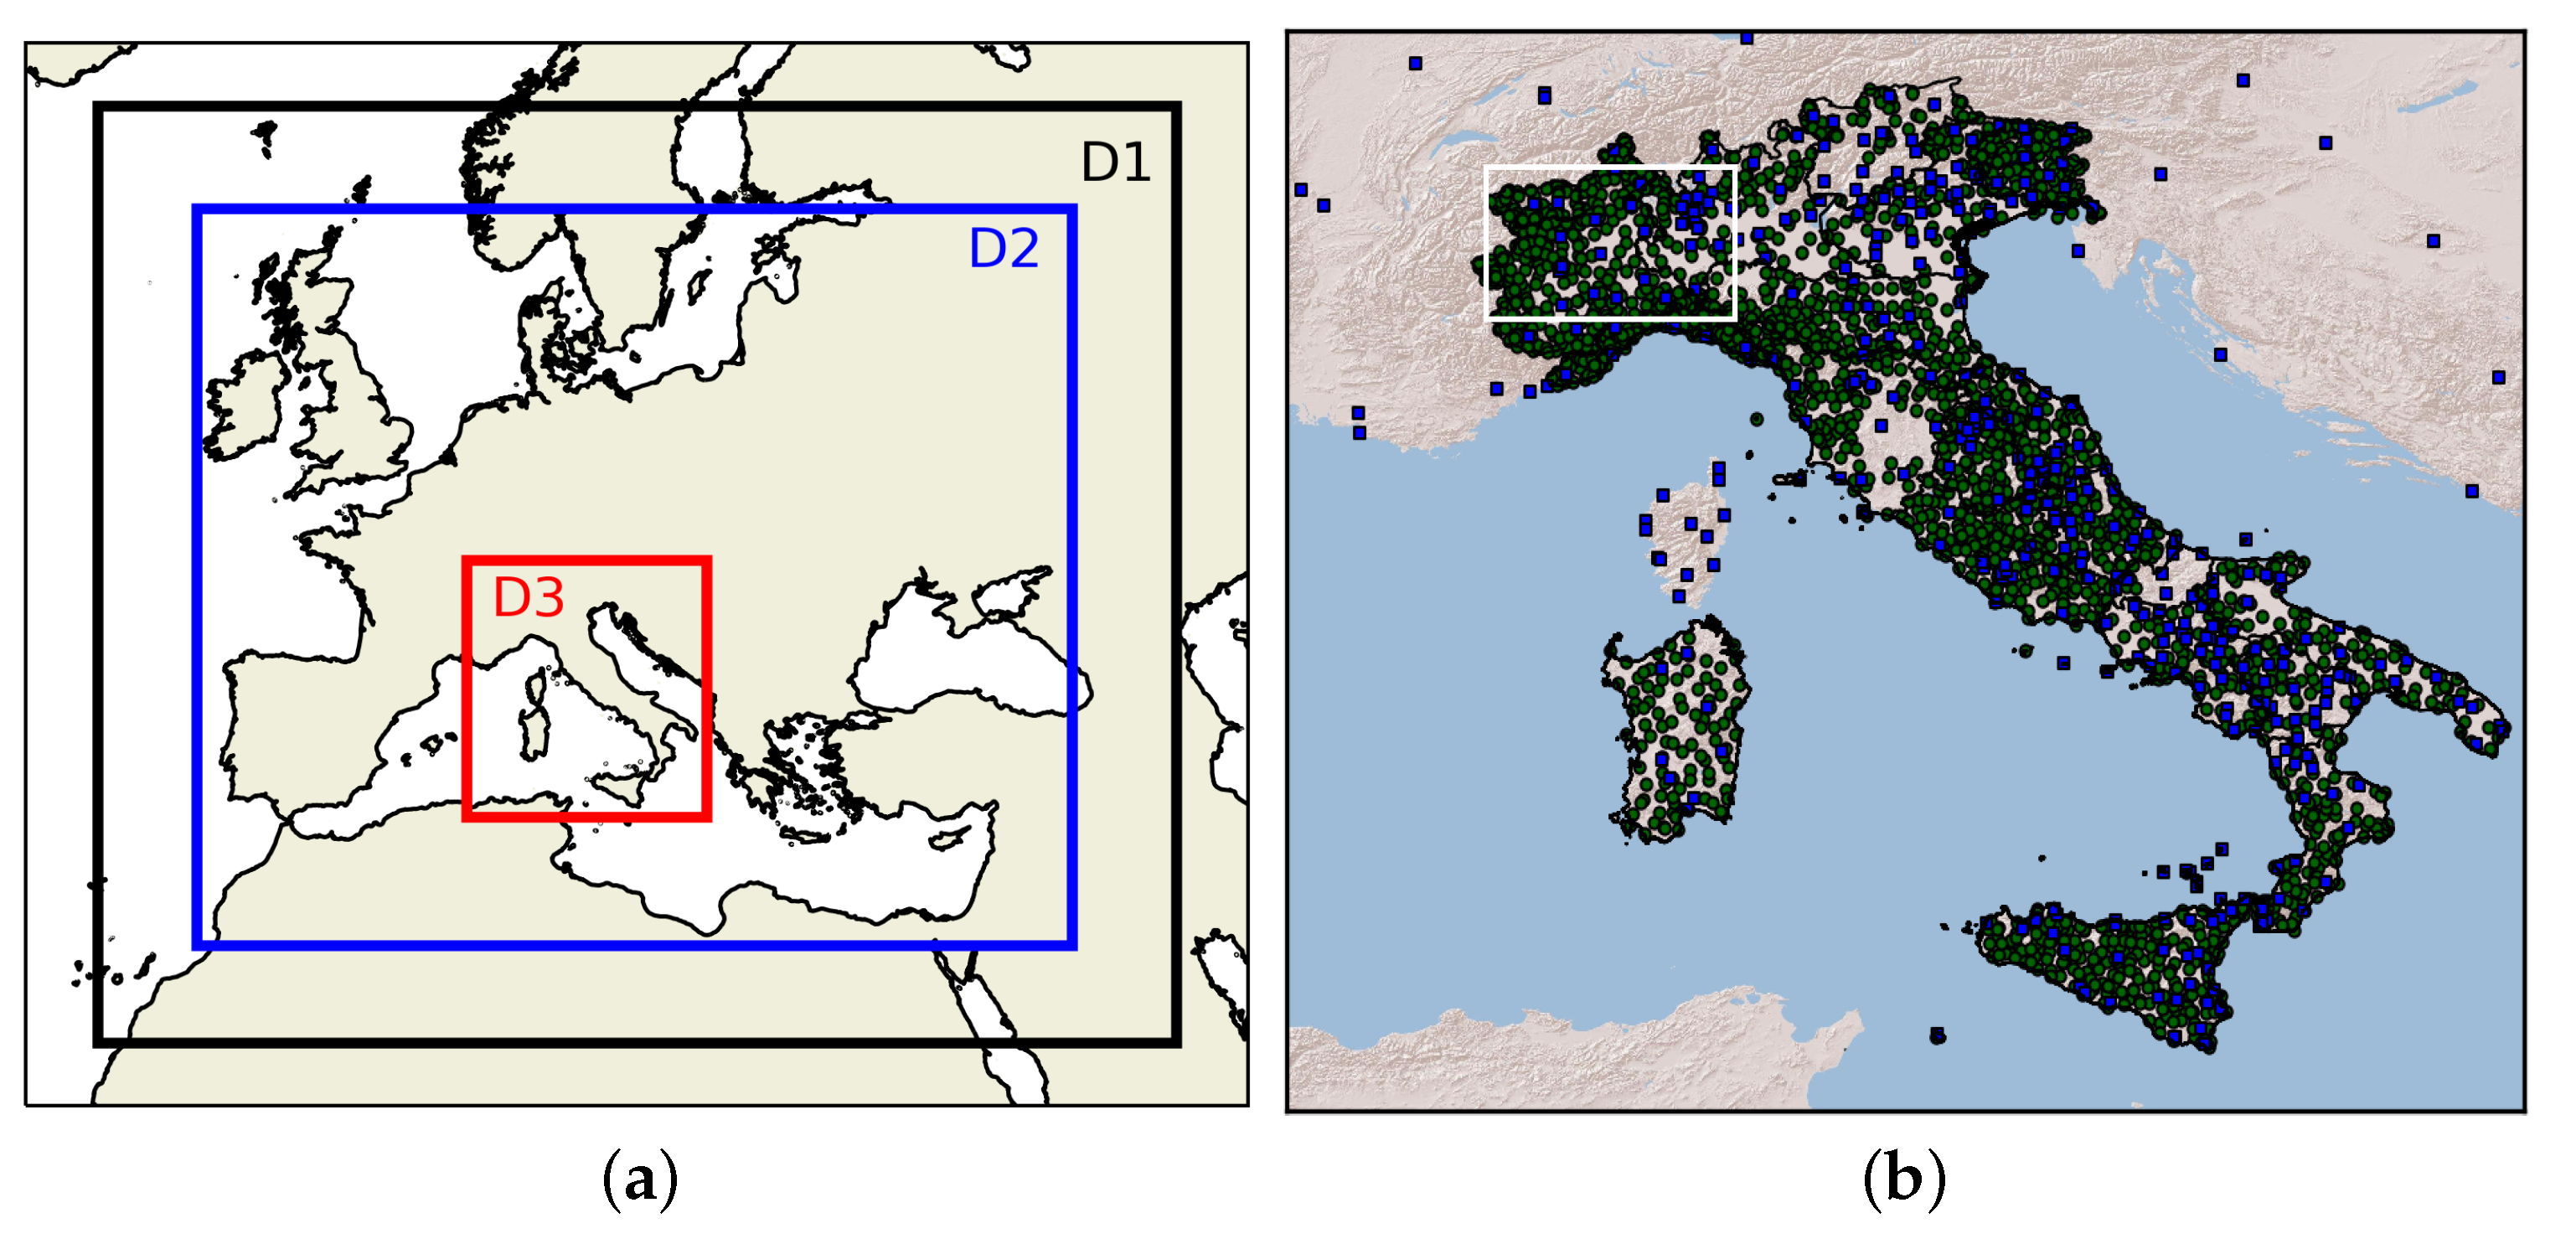
A two-way nesting configuration with three nested domains (Figure 5a) was adopted for this study: the mother domain with a grid spacing of 22.5 km (216 × 191 grid points) covers Europe and part of northern Africa; the second domain is centered over the Mediterranean basin with a horizontal resolution of 7.5 km and 523 × 448 grid points. Both domains have large dimension to capture the evolution and the interaction of the large-scale pressure systems with the Mediterranean basin as well as the retrogressive wave from Russia. Finally, the inner domain covers Italy with a spatial resolution of 2.5 km (430 × 469 grid points). In the vertical, 50 terrains following sigma levels are adopted, and the model top is set to 50 hPa. The physical parametrizations set for this study were already successfully tested in several convective events with similar peculiarities and adopted for the WRF-CIMA operational chain [17,54,55,56,57] that supports the DPC activities. For the long-wave and shortwave radiation process, the Rapid Radiative Transfer Model for Global Climate Models [58] is applied, while a WRF single-moment six-class scheme [59] with six different types of hydrometeors is adopted for the microphysics. The Yonsei University (YSU) scheme [60] is chosen to parametrize the vertical turbulent fluxes within the Planetary Boundary Layer (PBL). Finally, the New Simplified Arakawa–Schubert scheme [61] is applied for the convection, although no cumulus parametrization is used for the inner domain (2.5 km) where it is explicitly resolved. The initial and lateral boundary conditions are provided by the National Centers for Environmental Prediction Global Forecast System (NCEP-GFS) every 3 h with a horizontal grid spacing of 0.25° × 0.25°.
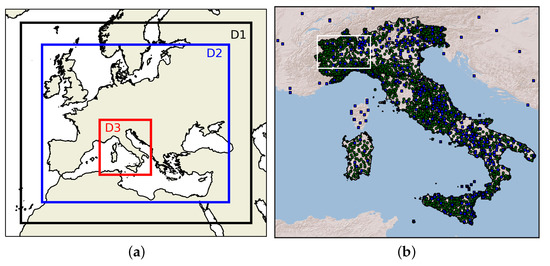
Figure 5.
WRF domains (a) adopted for the numerical simulations: D1 (black), D2 (blue) and D3 (red) with a horizontal resolution of 22.5 km, 7.5 km and 2.5 km, respectively. Spatial distribution of ZTD observations (blue squares) and temperature data from weather stations (green points) assimilated in the WRF model (b). The white rectangle indicates the study area (NW) where the validations are performed.
4.2. 3D-Var Technique
The 3D-Var assimilation technique is used to generate more reliable initial conditions. The technique aims to reduce the gap between background forecast and the observations through the minimization of a cost function J, defined by Equation (1):
Matrices B and R are the background and observation error covariance matrices, respectively; x is the model state vector, represents the observations vector, is the background state and finally H is the nonlinear observation operator. The B matrix plays a key role in adjusting the spatial impact of the observations in the assimilation process. In this regard, The National Meteorological Center (NMC) method [62] was adopted for the B matrix calculation. The method takes a series of forecasts valid at the same time but initialized with a lag of 12 h. Thus, for this work, B is computed considering a period of 1 month, more specifically the entire month of May 2019. For the assimilation of the weather radar reflectivity, a modified direct operator is adopted [17], while the GNSS zenith total delay (ZTD) observations and temperature data coming from surface weather stations are assimilated using the default operator in the WRFDA package [53].
4.3. Nudging Technique
Lightning data are assimilated into WRF following the nudging scheme proposed by [63]. The idea behind this method is to increase the model instability by the addition of water vapor where and when flashes are observed. Flashes from LAMPINET are first remapped onto the WRF innermost domain (2.5 km horizontal resolution). This is performed by associating a flash to the closed grid point, while flashes outside the domain are discarded. For the atmospheric columns above grid-points with flashes, the following water vapor mixing ratio, , is computed:
where A = 0.95, B = 0.07, C = 0.25, D= 0.25 and , is the graupel mixing ratio, and is the saturation mixing ratio at the model temperature. The number X is the total number of flashes occurring at the grid point in the last 15 min. Values between 5 and 30 min were used in the bibliography showing good results. The water vapor of (2) is substituted to that simulated by WRF between the lifting condensation level (LCL) and the −20 °C isotherm if the modeled mixing ratio is below that given by (2). As a consequence, the method can only add water vapor to the simulation. The values of the constants of (2) are the results of optimizing the impact of lightning data assimilation over Italy and the Mediterranean [64,65].
5. Numerical Simulations
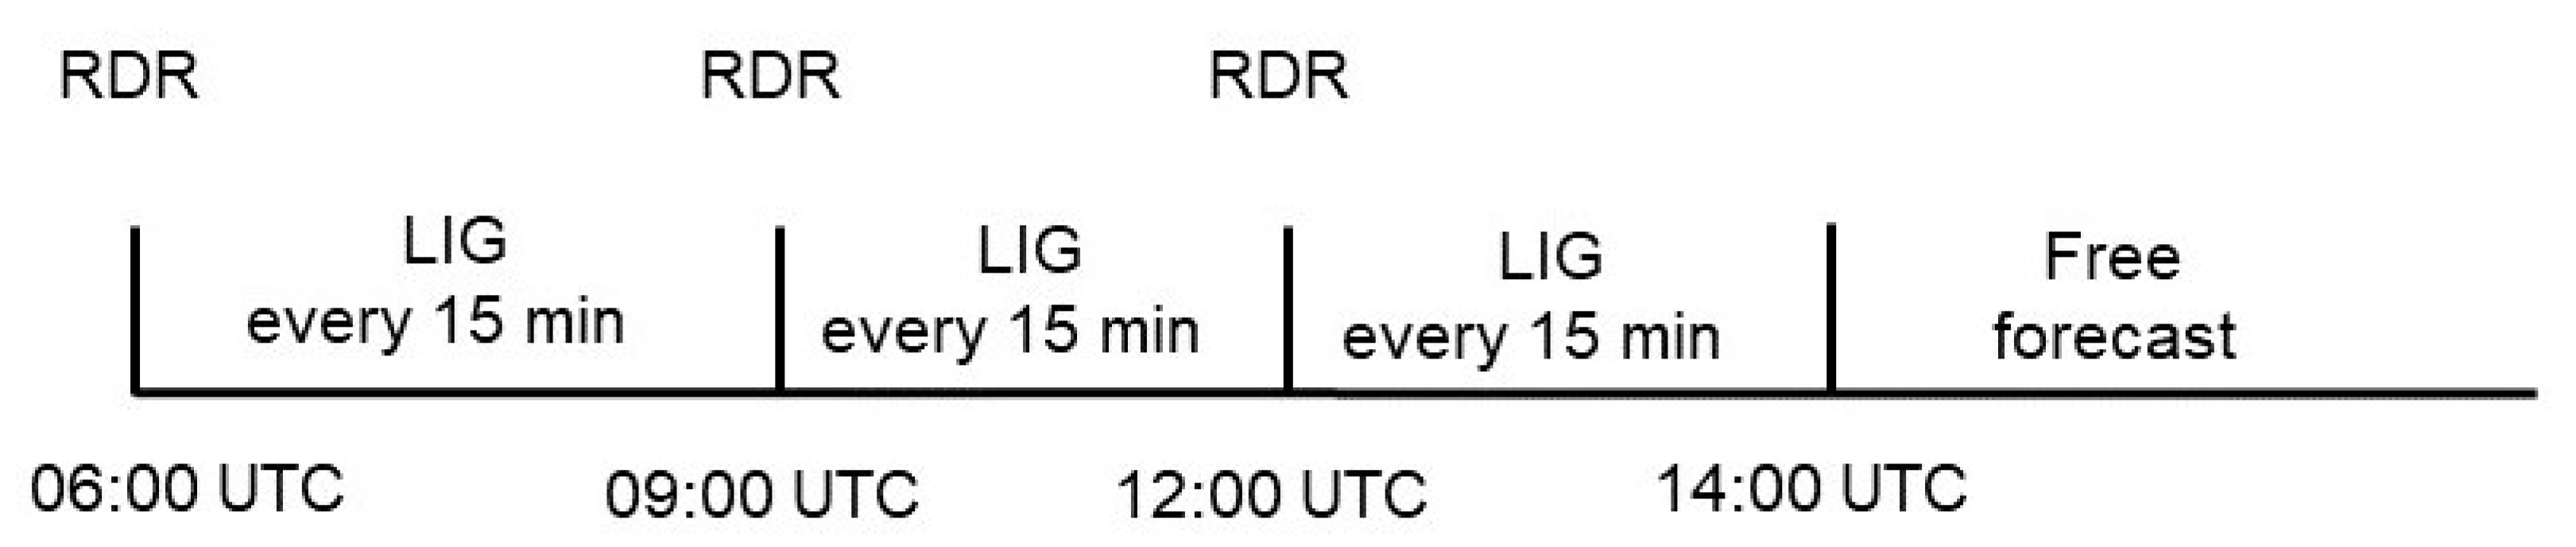
To assess the data assimilation benefits for nowcasting convective events, five numerical experiments are carried out. There is ample evidence in the literature [14,17,66,67,68,69,70,71] that the radar reflectivity cycling assimilation in the WRF model with 3D-Var improves the forecast, so we have considered the experiment with radar data only as control run (CTL). For this experiment, the radar CAPPI were assimilated every 3 h from 06:00 UTC to 12:00 UTC. In the RDR-LIG simulation, instead, the lightning data, coming from LAMPINET network, were assimilated during a 3 h forecast between 06:00 UTC and 09:00 UTC through a nudging technique (using 15 min of accumulated lightning), then the reflectivity data are assimilated at 09:00 UTC with the 3D-Var technique. Later, a 3 h forecast is produced again driven by the lighting nudging between 09:00 and 12:00 UTC, then the 3D-Var is applied again using the reflectivity data at 12:00 UTC and, finally, 2 h of lightning nudging is conducted between 12:00 UTC to 14:00 UTC (Figure 6). In the last two experiments, RDR-ZTD-LIG and RDR-TMP-LIG, the same strategy was adopted, but the ZTD observations and weather station data (temperature only) were added, respectively. Finally, a simulation (ALL) with all available data, namely ZTD, lightning, radar reflectivity and temperature, is carried out.

Figure 6.
Data assimilation strategy for the RDR-LIG simulation.
In more detail, the temperature observations coming from around 2050 weather stations and about 420 ZTD measurements (Figure 5b) are assimilated in each assimilation cycle. All experiments allow to provide a forecast of the hazardous convective event at high spatial (2.5 km) and temporal resolution (5 min) up to 1h in advance, giving the ATM operators sufficient time to manage the air traffic and compute updating landing trajectories. The observations are only assimilated over the inner domain, with a spatial resolution of 2.5 km. A brief description of the numerical simulations is reported in Table 1.

Table 1.
List of numerical experiments.
6. Results and Validation
In order to assess the nowcasting system capability to provide an accurate forecast to support ATM activities and to evaluate the impact of assimilating different datasets, the performance of the numerical experiments are evaluated at high temporal resolution in terms of VIL [50], a precursor of convective activity. The assessment is carried out using two different approaches: object-based and fuzzy, respectively. Finally, a qualitative comparison of water vapor and rainwater mixing ratio fields is also performed in order to further assess the impact of different types of observations. The validation is performed in northwestern Italy (Figure 5b, NW), a restricted area of the inner domain including Malpensa airport, where the intensifying stage of the squall line occurred.
6.1. Object-Based Evaluation
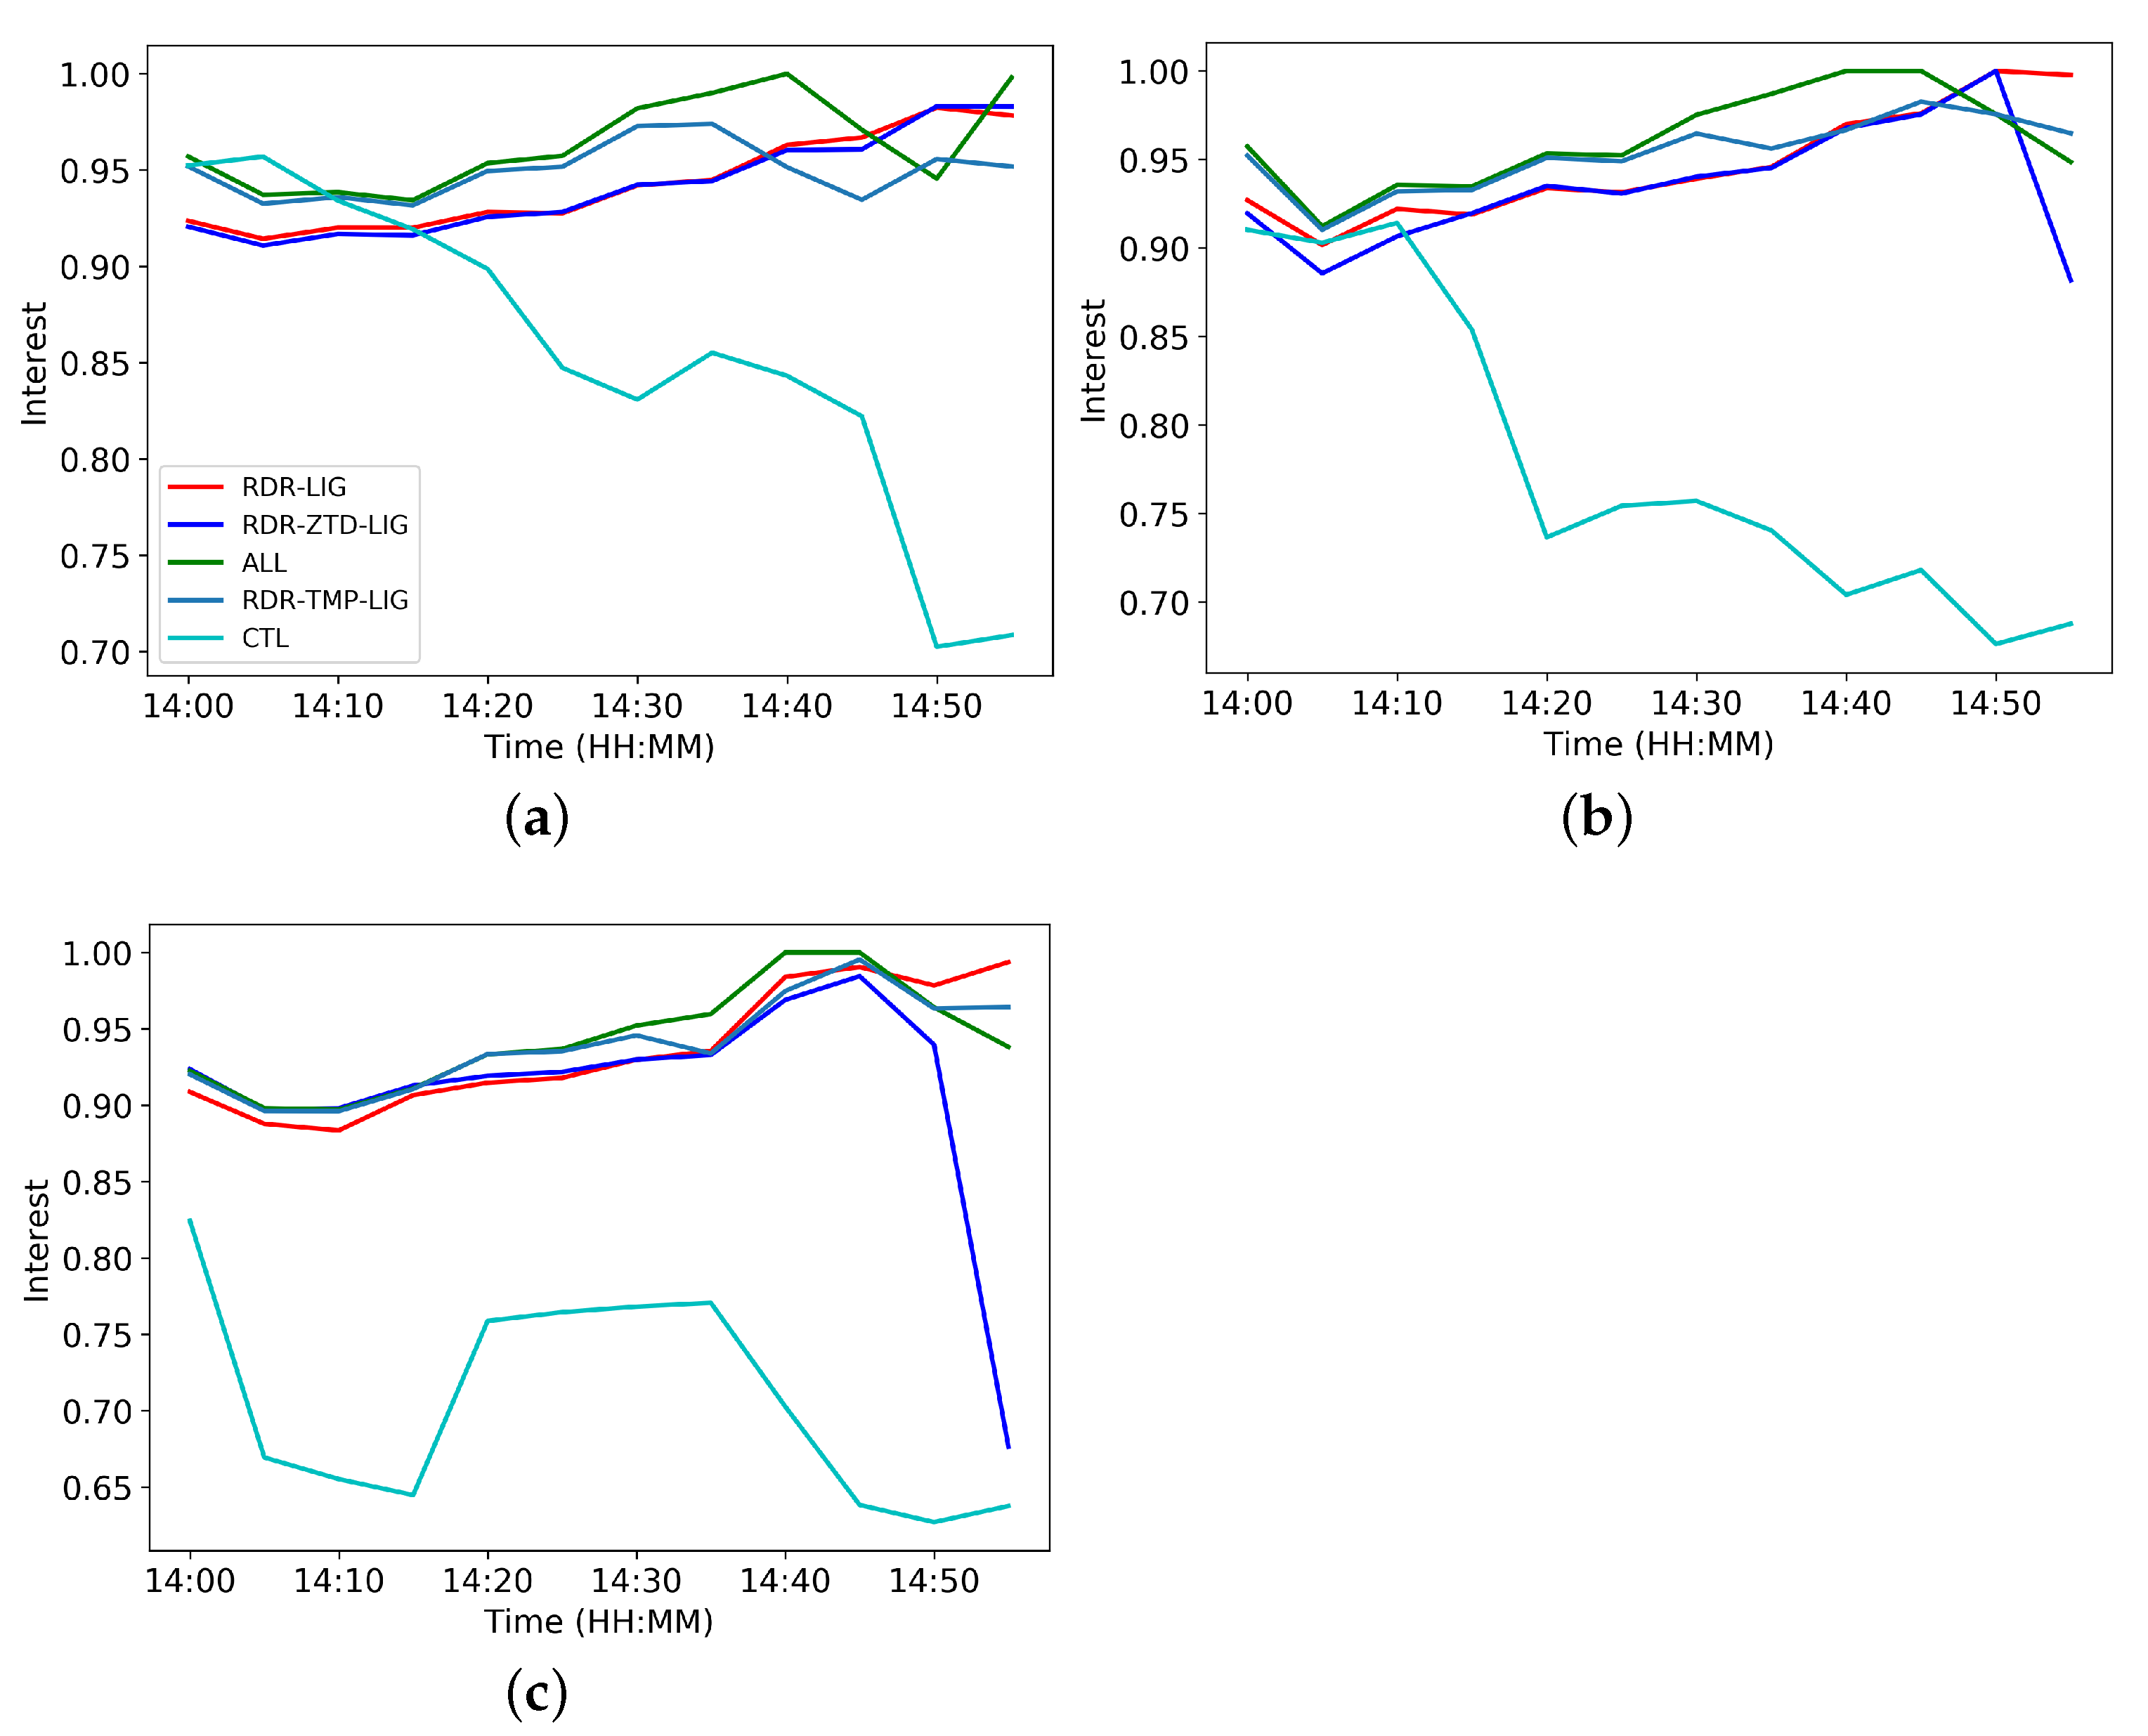
To avoid the spatial limitations of using a point-by-point approach [72], the validation of the numerical experiments is performed with the Method for the Object-Based Evaluation (MODE, [73]) tool by comparing the observed and predicted VIL fields. The MODE identifies the spatial structures (objects) and computes for each of them the following attributes: centroid distance, angle difference, symmetric difference and percentile intensity. These attributes are used as input to a fuzzy logic engine that performs the matching and merging steps and summarizes in a single value called the total interest [74]. The score ranges from 0 to 1, with 1 being the best score. For this work, the VIL objects are evaluated in terms of total interest value every 5 min starting from 14:00 UTC to 14:55 UTC (closure of the airport). In this regard, three threshold values were selected: 3 kg m−2, 5 kg m−2 and 7 kg m−2, respectively. The first two thresholds are used to asses the model’s ability to reproduce the stratiform precipitation area, while a threshold of 7 kg m−2 is used for the convective ones [75], which are mostly interesting for aviation. The evolution of the interest index for 3 kg m−2 threshold calculated in NW area is reported in Figure 7. The results clearly demonstrate the benefit of assimilating lightning data; in fact, all experiments show higher interest values compared with CTL, the simulation with radar data only (Figure 7a, cyan line). The two simulations, RDR-LIG and RDR-ZTD-LIG, instead, show a similar behavior, suggesting that the ZTD in combination with radar observations only produce a slight impact. On the other hand, RDR-TMP-LIG performs better than the simulation with ZTD, pointing out the benefits of in situ weather stations in convective cell forecasts. Finally, the ALL experiment shows the best forecast with the highest interest value, confirming the added value of lightning data and demonstrating that the ZTD observations if used with additional data can further improve the forecast. The interest is also calculated for 5 kg m−2 (Figure 7b). According to the previous results, all experiments with lighting data perform better than CTL, whereas RDR-ZTD-LIG does not differ greatly from RDR-LIG. Moreover, the high interest values for the ALL simulation confirm the benefits of assimilating ZTD and temperatures, especially in the interval 14:30–14:55 UTC, when the squall line starts to intensify. To evaluate the capability of cycling assimilations to nowcast the convective precipitation area, the interest is also calculated for 7 kg m−2 threshold (Figure 7c). The beneficial impact of assimilating lightning is clear, and a significant gap in terms of interest between CTL and the other simulations is found (Figure 7c). The use of ZTD in addition to lightning further increases the interest compared with RDR-LIG but in the first 15 min only. Later, the impact is reduced and the simulation converges to RDR-LIG. However, the assimilation of ZTD observations along with lightning data shows a clear improvement compared with CTL in the whole simulation interval. Similar to the results for the previous two thresholds, the RDR-TMP-LIG performs better than the RDR-ZTD-LIG, suggesting that the weather stations’ data produce a larger impact compared with ZTD for this event. However, the simulation with all observations (ALL) gives the best performance in predicting convective precipitation, pointing out the importance of combining multiple observations at the surface as well as different height levels to improve the forecast. In conclusion, the use of the interest allows us to identify the key role of lightning in the prediction of stratiform and convective precipitation area by showing a clear signal in the results. In addition, the simulations with lightning data are able to predict the squall line evolution 1 h in advance with good accuracy and a temporal resolution of 5 min, providing a valuable forecast for ATM operators.
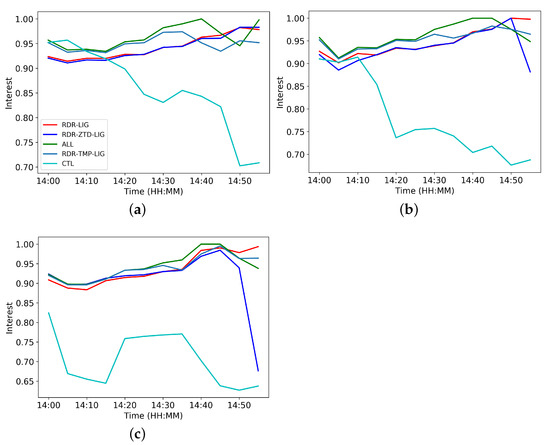
Figure 7.
Evolution of the interest from 14:00 UTC to 14:55 UTC (closure of the airport) for the threshold values 3 kg m−2 (a), 5 kg m−2 (b) and 7 kg m−2 (c), respectively. The CTL simulation is represented by the cyan line, while RDR-LIG, RDR-ZTD-LIG, RDR-TMP-LIG and ALL simulations are colored red, blue, pink and green, respectively.
6.2. Fuzzy-Logic Evaluation
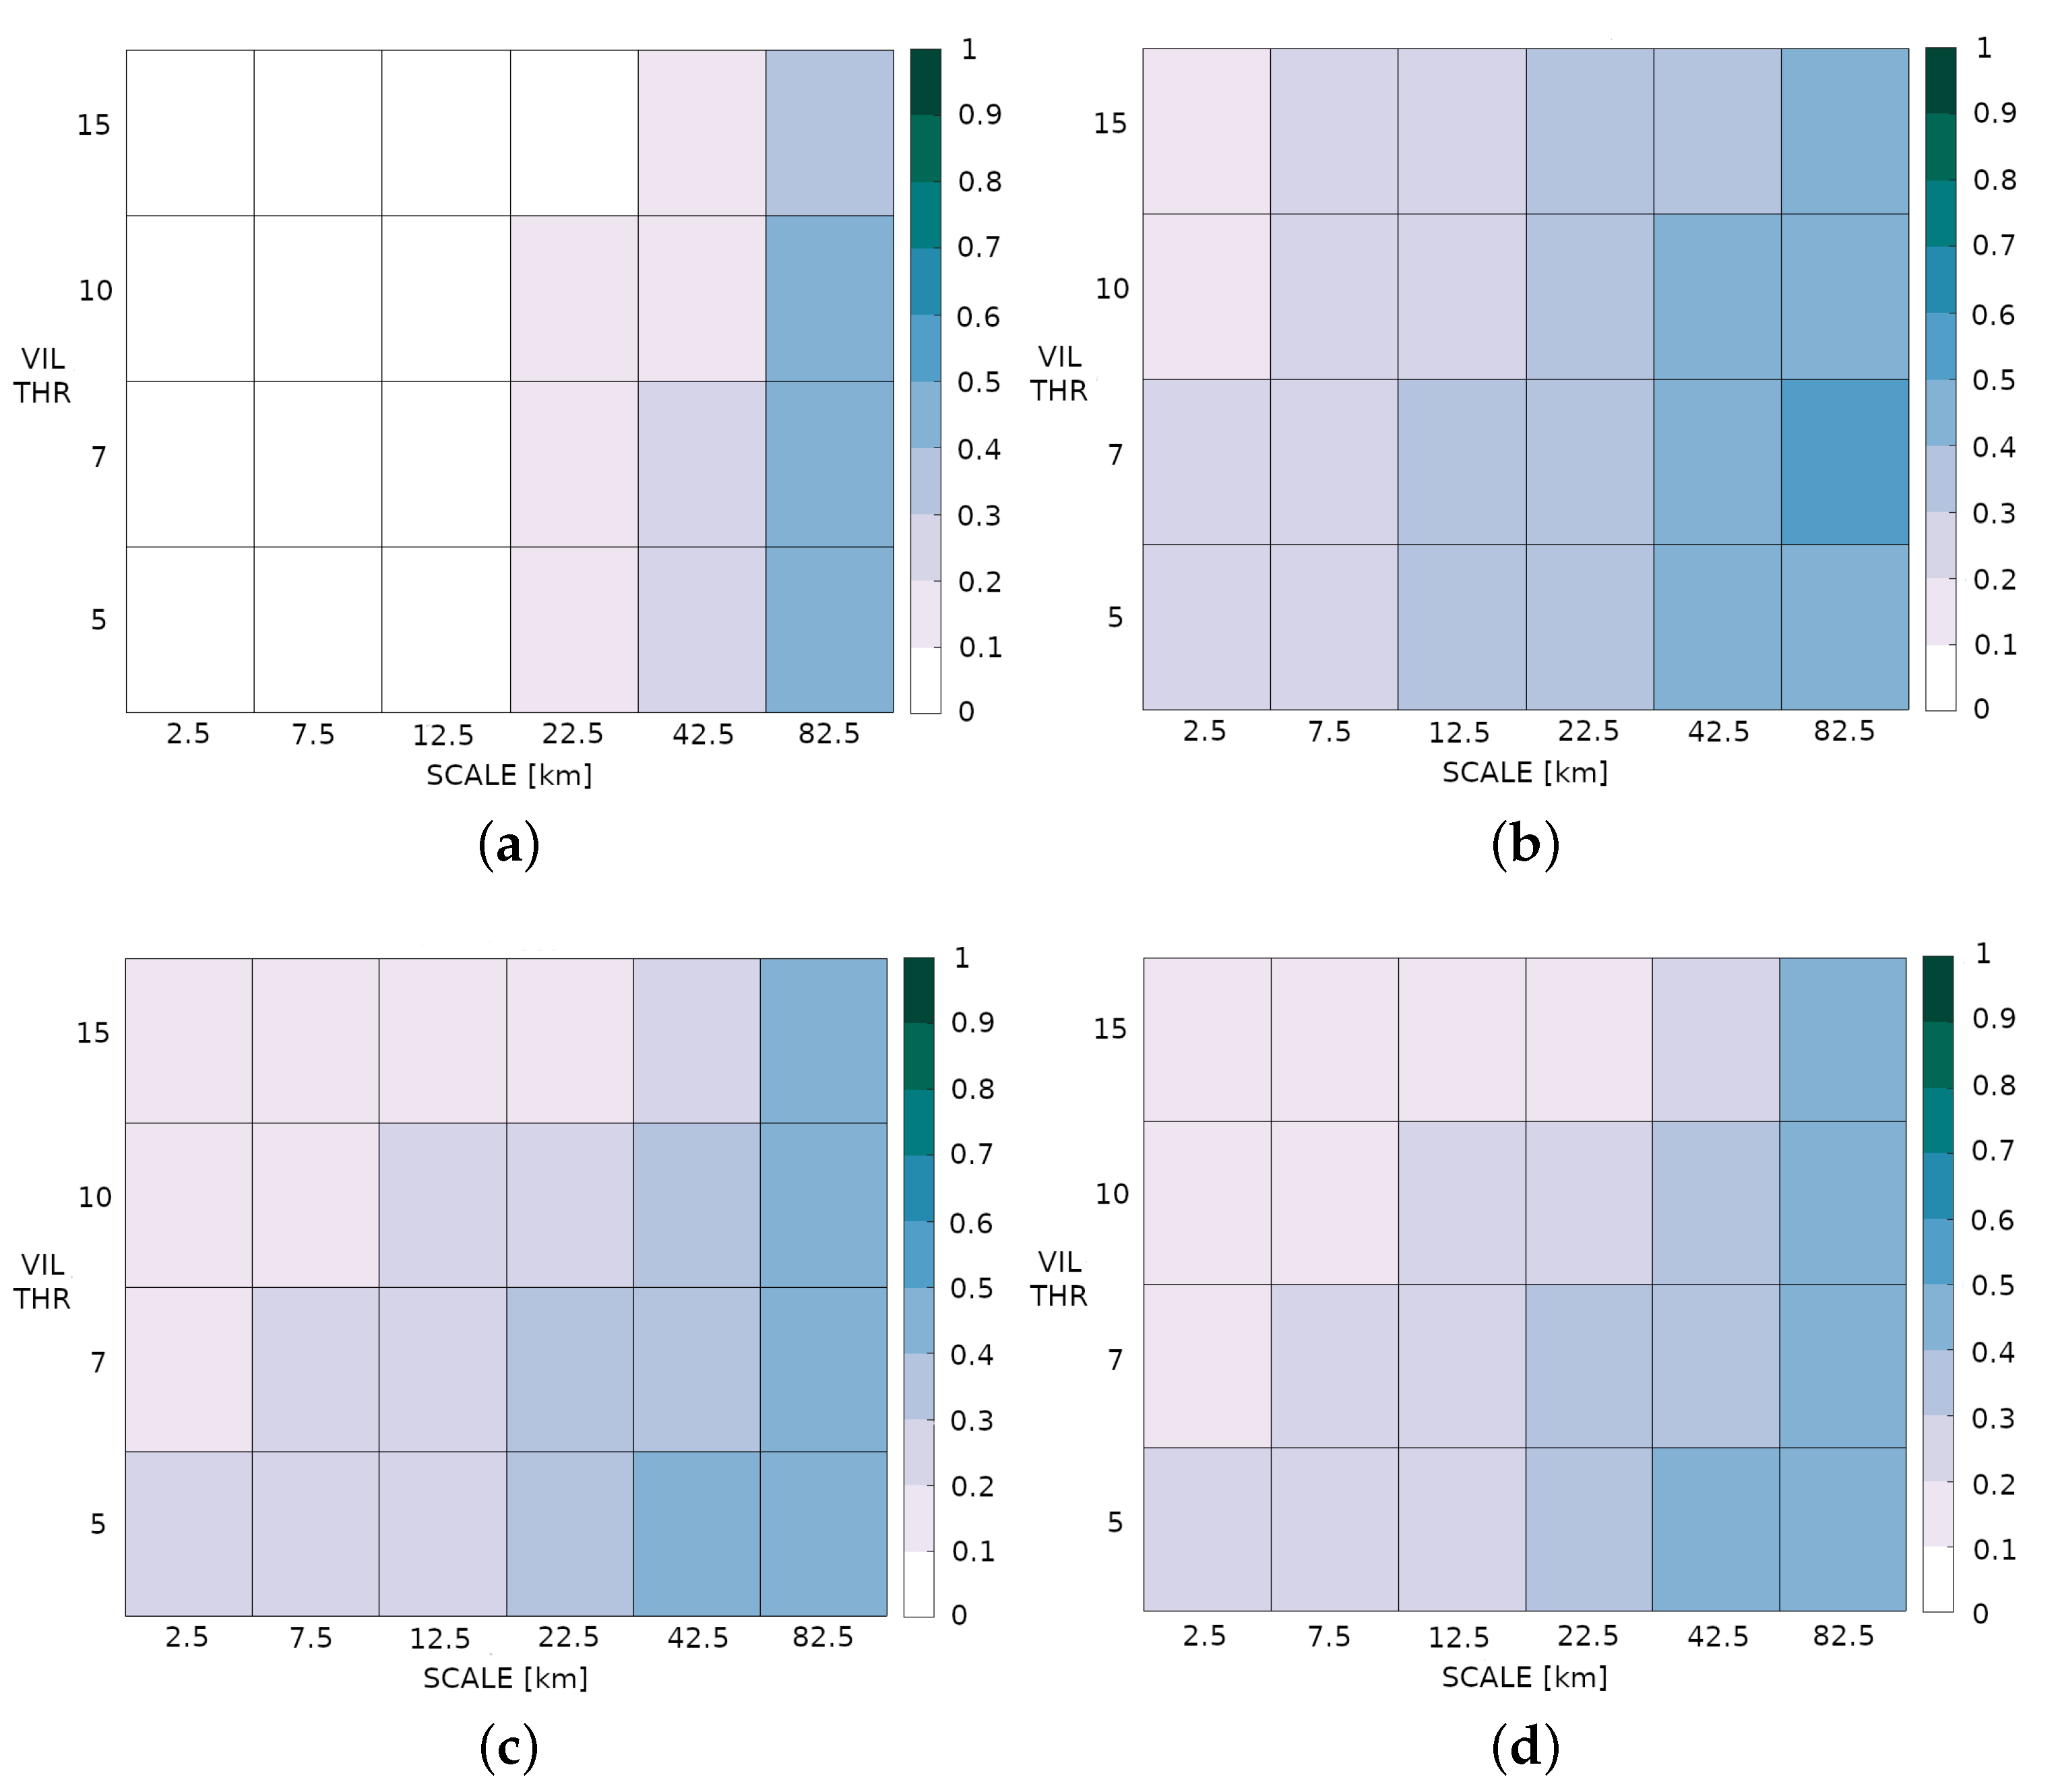
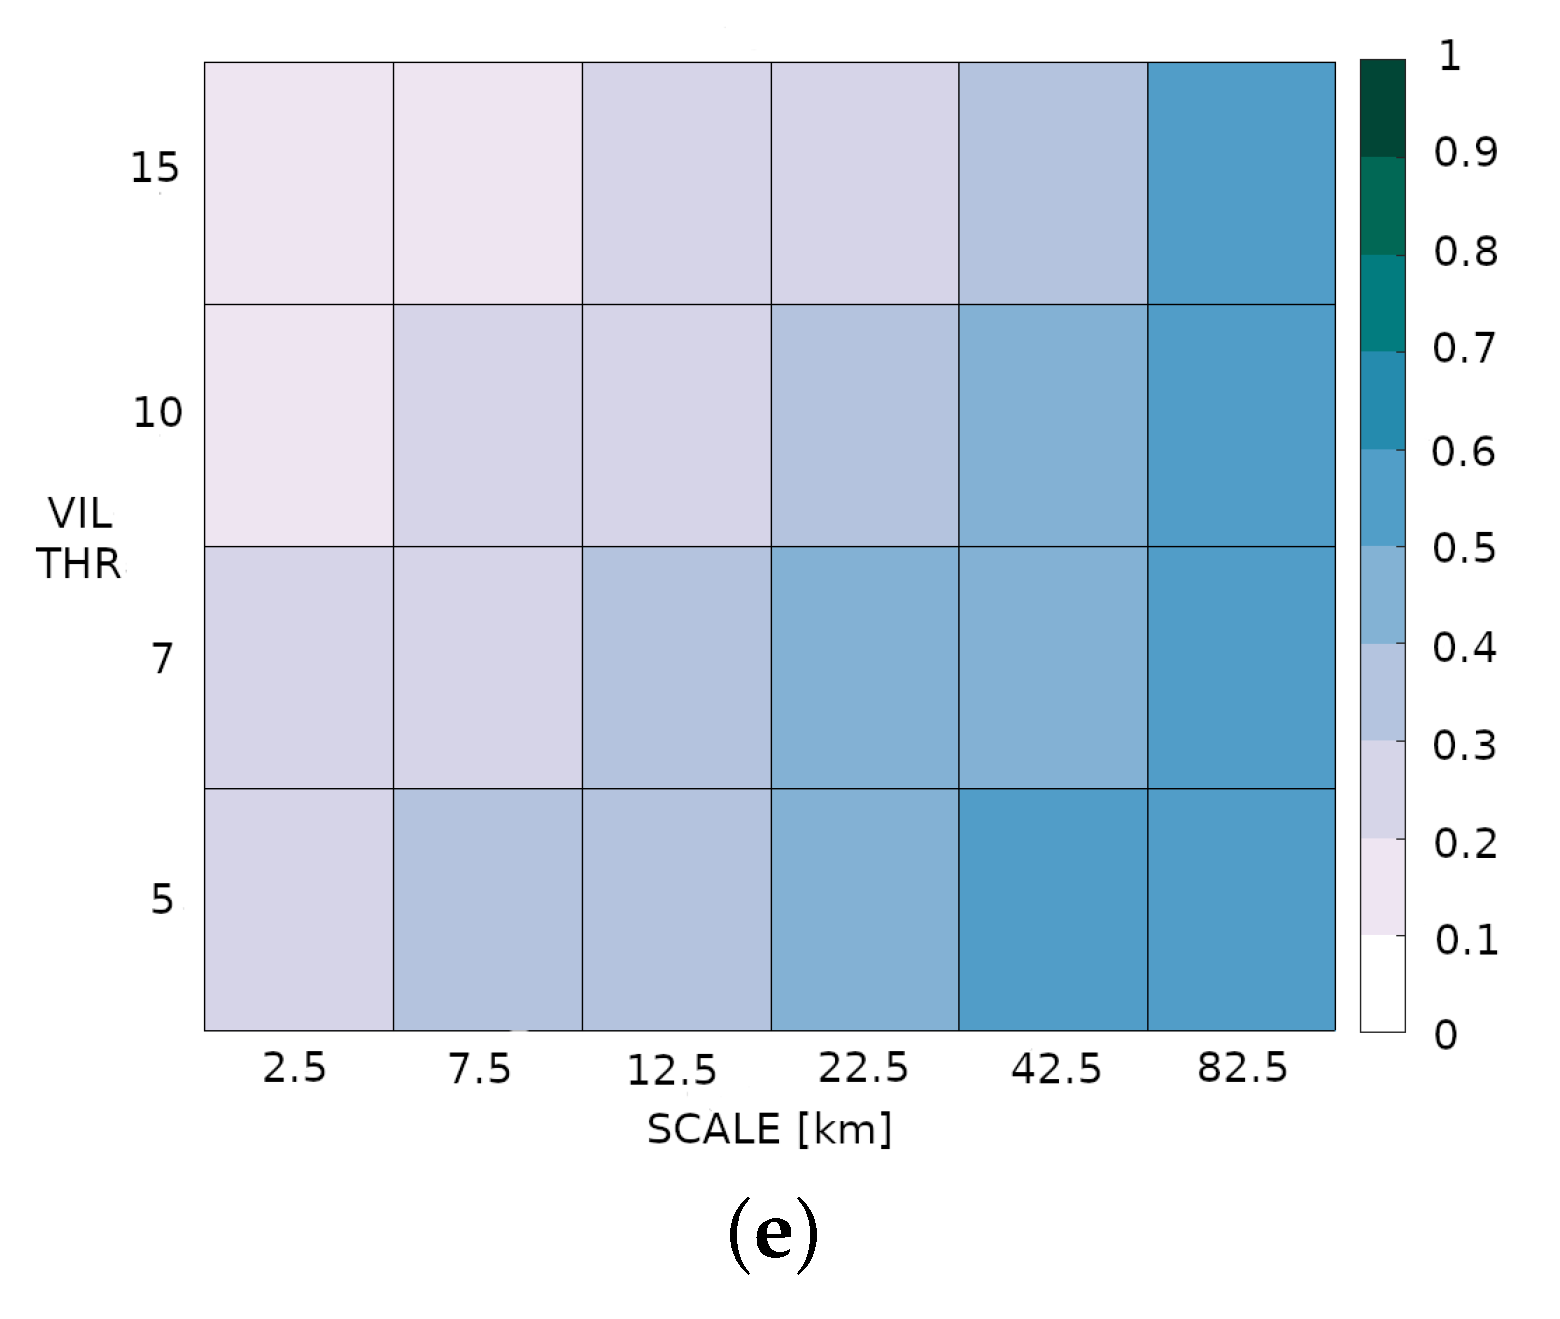
To mitigate the limitations of traditional verification, which compares the predicted and observed point values at the same grid box, a fuzzy approach was adopted [76]. This verification assumes that the forecast is useful even if a slight displacement, defined through a local neighborhood, occurs. For this study, the Fraction Skill Score (FSS) [72], which compares the fractional coverage of events in spatial windows of increasing size, was applied to a short-range VIL forecast. The statistical index was calculated every five minutes and averaged over a 55 min interval from 14:00 UTC to 14:55 UTC, the same adopted for the object-based evaluation. To evaluate the performance of the numerical simulation with more intense convective activity, the VIL thresholds of 10 kg m−2 and 15 kg m−2 were added. The computation of the FSS is repeated for several neighborhood sizes, respectively, 2.5 km, 7.5 km, 12.5 km, 22.5 km, 42.5 km and 82.5 km to evaluate how forecast skill varies with different scales. FSS values range from 0 (wrong forecast) to 1 (perfect forecast), but a value of 0.5 can be used to represent the lower limit of useful scales. The fuzzy verification is applied to the VIL fields for all numerical simulations in the NW area. The results confirm the difficulties for CTL experiments (radar data only) in simulating the squall line. In fact, the FSS shows low values at smaller scales even with lower thresholds (Figure 8a). This behavior suggests that a skillful spatial scale is only reached when averaging to 82.5 km; this is because the convective cell developed 1h in advance according to the object-based evaluation. The analysis of FSS for RDR-LIG (Figure 8b) shows significantly better (greater) values than CTL simulation for both low and high thresholds, confirming the added value of lightning assimilation in forecasting both convective and stratiform precipitation, although the score does not achieve a skillful scale. On the other hand, the fuzzy analysis for RDR-ZTD-LIG (Figure 8c) and RDR-TMP-LIG (Figure 8d) simulations shows no difference in FSS but a slight worsening compared with RDR-LIG. The lightning assimilation, performed with a nudging technique, probably produces a larger impact than weather stations or ZTD measurements that are assimilated, instead, with a 3D-Var scheme. Nevertheless, both the RDR-ZTD-LIG and RDR-TMP-LIG experiments are still better than CTL, proving the benefit of using lightning data also in combination with ZTD or temperature coming from weather stations. Finally, the FSS is also calculated for ALL, the experiment that uses all available observations (Figure 8e). In this case, the score shows higher values at each threshold compared with RDR-LIG, confirming a further improvement in forecasting the squall line according to the object analysis. Thus, the assimilation of different datasets proves to be effective for nowcasting the convective cell with an accuracy capable of supporting ATM activities.
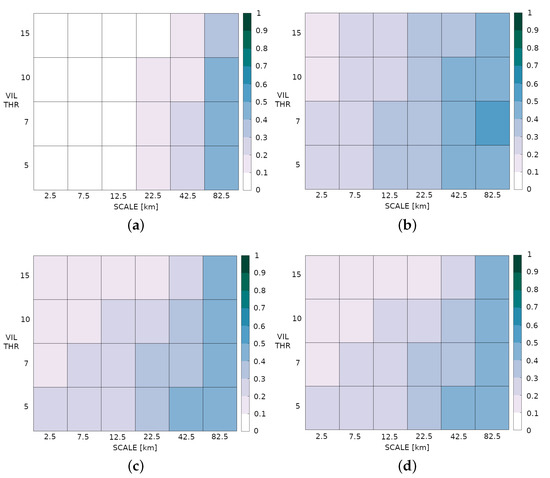
Figure 8.
Mean FSS computed in the NW area from 14:00 UTC to 14:55 UTC for CTL (a), RDR-LIG (b), RDR-ZTD-LIG (c), RDR-TMP-LIG (d) and ALL (e) simulations considering several VIL threshold values: 5 kg m−2, 7 kg m−2, 10 kg m−2 and 15 kg m−2 and different neighborhood sizes: 2.5 km, 7.5 km, 22.5 km, 12.5 km, 42.5 km and 82.5 km, respectively.
6.3. Qualitative Comparison
To qualitatively assess the impact of assimilated data, we took a cross-section of rain water and water vapor mixing ratio (hereafter, qrain and qvapor) through the squall line from the ground to 5000 m a.s.l at 15:00 UTC, when the squall line reached the maximum intensity over the Malpensa airport. The analysis for qrain confirms the difficulties of RDR (simulation with radar data only) to predict the exact location and time of convective cell; in fact, it develops 1 h before, thus no precipitation affects the airport at 15:00 UTC (Figure 9a). On the other side, the use of lightning data is able to correct the forecast and to trigger the convection at the right time in line with the statistical results. The RDR-LIG produces a larger qrain value in the surrounding area of Malpensa with a maximum few kilometers SE of the airport (Figure 9b), while the two simulations with ZTD and WS data show a similar spatial distribution for qrain (Figure 9c,d) but with larger values than the RDR-LIG experiment (Figure 9e), even if the qrain peak is reduced. The ALL experiment, instead, is able to predict a maximum qrain over the airport (45.6301°N, 8.7255°E), further improving the convective cell forecast in terms of intensity. In addition, the vertical cross-sections of qvapor are analyzed to strength the qualitative assessment. The results show that the assimilation of lightning data increases the water vapor content with respect to RDR (Figure 10a), promoting the triggering of the convection. More specifically, the RDR-LIG and RDR-ZTD-LIG experiments (Figure 10b,c) improve the distribution of water vapor at low levels, whereas the two simulations with weather station observations, RDR-TMP-LIG and ALL, respectively, increase the amount of water vapor also at higher levels (Figure 10d,e), enhancing the intensity of the convective cell.
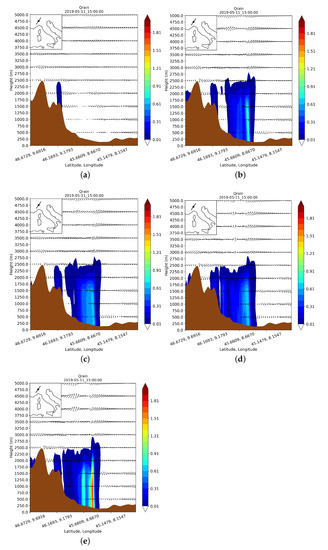
Figure 9.
Vertical cross-sections of rainwater mixing ratio (qrain, g kg−1) through the squall line for the CTL (a), RDR-LIG (b), RDR-ZTD-LIG (c), RDR-TMP-LIG (d) and ALL (e) simulations at 15:00 UTC, 5 May 2019.
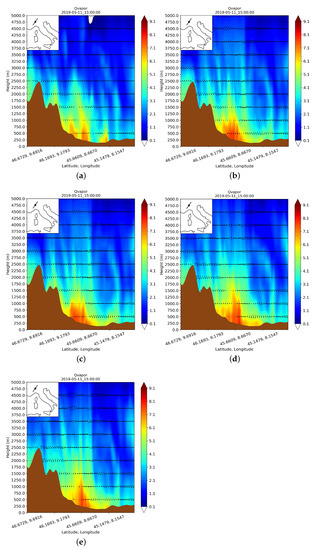
Figure 10.
Vertical cross-sections of water vapor mixing ratio (qvapor, g kg−1) through the squall line for the CTL (a), RDR-LIG (b), RDR-ZTD-LIG (c), RDR-TMP-LIG (d) and ALL (e) simulations at 15:00 UTC, 5 May 2019.
7. Conclusions
As part of the SINOPTICA project, the potentiality of the numerical prediction models to nowcast the evolution of severe convective events, benefiting from the assimilation of different types of observations, are explored. In this context, several numerical simulations with the WRF model are performed, assimilating different types of observations such as weather radar reflectivity, ZTD derived from ground GNSS data, temperature observations coming from in situ weather stations and lightning data, to evaluate if the NWP-based nowcasting system deployed for this work is able to support the Air Traffic Management (ATM) activities by providing a sufficiently accurate forecast. In this regard, a squall line event that affected Milano Malpensa airport causing huge flight delays and diversions was chosen as a case study. To assess the impact of assimilation in predicting convective precipitation, three different verification approaches are adopted, considering several VIL thresholds: object based, fuzzy and qualitative. All performed simulations provide the forecast at least 1 h in advance for the Malpensa event, giving ATM operators sufficient time to manage air traffic and potentially calculate new landing trajectories prior to an extreme convective event. However, the forecast accuracy strongly depends on the assimilated observation type, as evidenced by the statistical evaluations. The results suggest that the use of radar data only may be not sufficient to provide a reliable forecast for ATM purposes; in fact, both object and fuzzy validations show low values in terms of interest and FSS for stratiform as well as for convective precipitation, pointing out the poor performance of CTL simulation in predicting the position and timing of the squall line. In addition, the vertical cross-sections for qrain and qvapor show that CTL also anticipates the triggering of the convective cell by about 1 h. Conversely, the RDR-LIG simulation demonstrates the added value of assimilating lightning data. The high-interest values from the object-based evaluation reveal a good capability in simulating the position and timing of the squall line while passing over the airport; the forecast, therefore, can be integrated in an ATM system to support pilots in the landing phase. On the other hand, the addition of ZTD observations does not produce a significant impact: the evolution of interest values remains comparable to the simulation with radar and lightning data, while the FSS shows a slight worsening. This behavior is probably caused by the low number (around 400) of GNSS taken into account because the assimilation is only performed over the inner domain (Italy). The lightning and radar data are also assimilated together with temperature from about 2000 in situ weather stations. The latter are much more numerous than GNSS, and thus are able to produce a larger impact, increasing the amount of water vapor and the qrain at low levels over the Malpensa airport and surrounding area. However, the fuzzy verification is not able to recognize the impact produced by weather stations because the mean FSS value is considered, consequently the RDR-ZTD-LIG and RDR-TMP-LIG simulations show no difference. The object-based assessment, instead, is able to catch the signal of weather stations; in fact, the interest index shows greater value, especially at low thresholds, than the two simulations with lightning data, demonstrating the further benefits of assimilated weather stations. Finally, the ability of cycling assimilation with all available data is also evaluated. The results show the best performance in terms of FSS and interest, pointing out the positive impact of assimilating lightning data in combination with ZTD and temperatures. In addition, the qrain values increase in the surrounding area of Malpensa, providing a more accurate forecast also in terms of intensity. In conclusion, the NWP-based nowcasting with 3-h cycling assimilation demonstrates that the assimilation of lightning data improves the location, timing and intensity of the convective event, providing a highly reliable forecast of the squall line evolution at very high temporal resolution (5 min). Moreover, the addition of ZTD and weather station data to lightning data further enhances the forecast skill, also suggesting that the surface observations produce a positive impact for this event. The model outputs are, therefore, suitable to manage air traffic, giving useful information to pilots and operators for avoiding hazardous convective cells along the flight path. The next step in this work will be to perform the integration of MET information in an ATM system with a real traffic scenario to validate the results from an ATM perspective. Furthermore, the impact of GNSS-derived data will be further investigated, assimilating them both in parent and child domains trying to obtain a greater impact. Moreover, a comparison between ZTD and precipitable water vapor will be performed to evaluate if a further improvement can be produced. In addition, the development of a data quality procedure will also allow the assimilation of humidity and wind observations from weather stations that may further improve the forecast. Finally, to further investigate the impact of cycling 3D-Var and to strengthen the statistical analysis, a larger dataset, including downbursts, hailstorms and supercells, which have proven to have a considerable impact on approaching and take off phases, will be considered. In addition, NWP nowcasting will be tested for several airports to evaluate the performance in region with different orographic peculiarities and the versatility of the system. Although the results of this study are encouraging, the severe convective cells forecast at high temporal and spatial resolution remain a challenge. A further step forward in improving the predictive capability of a traditional nowcasting forecast system could be the application of a combined approach between WRF simulations with a 3D-Var cycling assimilation and a radar-based nowcasting system through a blending technique [54].
Author Contributions
Conceptualization, V.M., M.L. and M.M.; methodology, V.M., M.L. and S.F.; software, V.M., M.L. and S.F.; validation, V.M., M.L. and M.M.; formal analysis, V.M. and M.L.; investigation, V.M. and M.L.; resources, A.P.; data curation, R.B., S.F., E.R. and M.M.; writing—original draft preparation, V.M.; writing—review and editing, V.M., M.M., M.L., L.E., M.C.L., S.F., R.C.T., T.R., R.B., E.R., M.K., M.-M.T., O.G. and A.P.; visualization, V.M.; supervision, A.P. and M.M.; project administration, A.P.; funding acquisition, A.P. All authors have read and agreed to the published version of the manuscript.
Funding
This research was funded by the H2020 Satellite-Borne and In-Situ Observations to Predict The Initiation of Convection for ATM (SINOPTICA) project (Grant agreement ID: 892362, https://cordis.europa.eu/project/id/892362, accessed on 28 July 2022).
Data Availability Statement
The WRF output files that support the findings of this study are available from the corresponding author, upon reasonable request. Radar data and in situ weather station observations are provided and managed by the Italian Civil Protection Department (DPC).
Acknowledgments
The authors thank the National Center for Atmospheric Research (NCAR) for providing WRF and WRFDA code. Most of the simulations were performed thanks to the ECMWF Special Project “Investigating the impact of 3-h cycling 3D-VAR with GNSS measurements in Weather Research and Forecasting (WRF) model”.
Conflicts of Interest
The authors declare no conflict of interest.
References
- Ohsfeldt, M.; Thrasher, T.; Waitz, I.; Ratliff, G.; Sequeira, C.; Thompson, T.; Graham, M.; Cointin, R.; Gillette, W.; Gupta, M. Quantifying the relationship between air traffic management inefficiency, fuel burn and air pollutant emissions. In Proceedings of the 7th USA/Europe Air Traffic Management Research and Development Seminar, ATM 2007, Barcelona, Spain, 2–5 July 2007. [Google Scholar]
- WMO. 1989 World Meteorological Day celebrates meteorology in the service of aviation. Bull. Am. Meteorol. Soc. 1989, 70, 414–415. [Google Scholar] [CrossRef]
- Gultepe, I.; Feltz, W.F. Aviation Meteorology: Observations and Models. Introduction. Pure Appl. Geophys. 2019, 176, 1863–1867. [Google Scholar] [CrossRef]
- Kulesa, G. Weather and aviation: How does weather affect the safety and operations of airports and aviation, and how does FAA work to manage weather-related effects? In Proceedings of the Potential Impacts of Climate Change on Transportation US Department of Transportation Center for Climate Change and Environmental Forecasting, Washington, DC, USA, 1–2 October 2002; US Department of Energy and US Global Change Research Program: Washington, DC, USA, 2003. [Google Scholar]
- NTBS. NASDAC Review of National Transportation Safety Board (NTSB) Weather-Related Accidents (2003–2007); NTBS: Washington, DC, USA, 2010. [Google Scholar]
- Haddad, Z.S.; Park, K.W. Vertical profiling of tropical precipitation using passive microwave observations and its implications regarding the crash of Air France 447. J. Geophys. Res. Atmos. 2010, 115, D12129. [Google Scholar] [CrossRef]
- Yu, C.K.; Cheng, L.W.; Wu, C.C.; Tsai, C.L. Outer Tropical Cyclone Rainbands Associated with Typhoon Matmo (2014). Mon. Weather Rev. 2020, 148, 2935–2952. [Google Scholar] [CrossRef]
- Keller, T.L.; Trier, S.B.; Hall, W.D.; Sharman, R.D.; Xu, M.; Liu, Y. Lee waves associated with a commercial jetliner accident at Denver International Airport. J. Appl. Meteorol. Climatol. 2015, 54, 1373–1392. [Google Scholar] [CrossRef]
- Kessler, E. Wind shear and aviation safety. Nature 1985, 315, 179–180. [Google Scholar] [CrossRef]
- Eurocontrol. Climate Change Risks for European Aviation—Summary Report; Eurocontrol: Bruxelles, Belgium, 2021. [Google Scholar]
- Jentsch, A.; Kreyling, J.; Beierkuhnlein, C. A new generation of climate-change experiments: Events, not trends. Front. Ecol. Environ. 2007, 5, 365–374. [Google Scholar] [CrossRef]
- Giorgi, F.; Im, E.S.; Coppola, E.; Diffenbaugh, N.S.; Gao, X.J.; Mariotti, L.; Shi, Y. Higher Hydroclimatic Intensity with Global Warming. J. Clim. 2011, 24, 5309–5324. [Google Scholar] [CrossRef]
- Kalnay, E. Atmospheric Modeling, Data Assimilation and Predictability; Cambridge University Press: Cambridge, UK, 2003. [Google Scholar]
- Sugimoto, S.; Crook, N.A.; Sun, J.; Xiao, Q.; Barker, D.M. An examination of WRF 3DVAR radar data assimilation on its capability in retrieving unobserved variables and forecasting precipitation through observing system simulation experiments. Mon. Weather Rev. 2009, 137, 4011–4029. [Google Scholar] [CrossRef]
- Radhakrishnan, C.; Chandrasekar, V. CASA prediction system over dallas–fort worth urban network: Blending of nowcasting and high-resolution numerical weather prediction model. J. Atmos. Ocean. Technol. 2020, 37, 211–228. [Google Scholar] [CrossRef]
- Maiello, I.; Ferretti, R.; Gentile, S.; Montopoli, M.; Picciotti, E.; Marzano, F.; Faccani, C. Impact of radar data assimilation for the simulation of a heavy rainfall case in central Italy using WRF–3DVAR. Atmos. Meas. Tech. 2014, 7, 2919–2935. [Google Scholar] [CrossRef]
- Lagasio, M.; Silvestro, F.; Campo, L.; Parodi, A. Predictive capability of a high-resolution hydrometeorological forecasting framework coupling WRF cycling 3dvar and Continuum. J. Hydrometeorol. 2019, 20, 1307–1337. [Google Scholar] [CrossRef]
- Gao, J.; Stensrud, D.J. Assimilation of reflectivity data in a convective-scale, cycled 3DVAR framework with hydrometeor classification. J. Atmos. Sci. 2012, 69, 1054–1065. [Google Scholar] [CrossRef]
- Mazzarella, V.; Maiello, I.; Ferretti, R.; Capozzi, V.; Picciotti, E.; Alberoni, P.; Marzano, F.; Budillon, G. Reflectivity and velocity radar data assimilation for two flash flood events in central Italy: A comparison between 3D and 4D variational methods. Q. J. R. Meteorol. Soc. 2020, 146, 348–366. [Google Scholar] [CrossRef]
- Mazzarella, V.; Ferretti, R.; Picciotti, E.; Marzano, F.S. Investigating 3D and 4D Variational Rapid-Update-Cycling Assimilation of Weather Radar Reflectivity for a Flash Flood Event in Central Italy. Nat. Hazards Earth Syst. Sci. Discuss. 2021, 21, 2849–2865. [Google Scholar] [CrossRef]
- Wang, H.; Sun, J.; Zhang, X.; Huang, X.Y.; Auligné, T. Radar data assimilation with WRF 4D-Var. Part I: System development and preliminary testing. Mon. Weather Rev. 2013, 141, 2224–2244. [Google Scholar] [CrossRef]
- Sun, J.; Wang, H. Radar data assimilation with WRF 4D-Var. Part II: Comparison with 3D-Var for a squall line over the US Great Plains. Mon. Weather Rev. 2013, 141, 2245–2264. [Google Scholar] [CrossRef]
- Dillon, M.E.; Skabar, Y.G.; Ruiz, J.; Kalnay, E.; Collini, E.A.; Echevarría, P.; Saucedo, M.; Miyoshi, T.; Kunii, M. Application of the WRF-LETKF data assimilation system over southern South America: Sensitivity to model physics. Weather Forecast. 2016, 31, 217–236. [Google Scholar] [CrossRef]
- Sun, J.; Xue, M.; Wilson, J.W.; Zawadzki, I.; Ballard, S.P.; Onvlee-Hooimeyer, J.; Joe, P.; Barker, D.M.; Li, P.W.; Golding, B.; et al. Use of NWP for nowcasting convective precipitation: Recent progress and challenges. Bull. Am. Meteorol. Soc. 2014, 95, 409–426. [Google Scholar] [CrossRef]
- Yano, J.I.; Ziemiański, M.Z.; Cullen, M.; Termonia, P.; Onvlee, J.; Bengtsson, L.; Carrassi, A.; Davy, R.; Deluca, A.; Gray, S.L.; et al. Scientific Challenges of Convective-Scale Numerical Weather Prediction. Bull. Am. Meteorol. Soc. 2018, 99, 699–710. [Google Scholar] [CrossRef]
- Bryan, G.H.; Rotunno, R. Statistical convergence in simulated moist absolutely unstable layers. In Proceedings of the 11th Conference on Mesoscale Processes, Albuquerque, NM, USA, 24 October 2005; Volume 1. [Google Scholar]
- Haiden, T.; Kann, A.; Wittmann, C.; Pistotnik, G.; Bica, B.; Gruber, C. The Integrated Nowcasting through Comprehensive Analysis (INCA) system and its validation over the Eastern Alpine region. Weather Forecast. 2011, 26, 166–183. [Google Scholar] [CrossRef]
- Kann, A.; Schellander-Gorgas, T.; Wittmann, C. Enhanced short-range forecasting of sub-inversion cloudiness in complex terrain. Atmos. Sci. Lett. 2015, 16, 1–9. [Google Scholar] [CrossRef]
- Auger, L.; Dupont, O.; Hagelin, S.; Brousseau, P.; Brovelli, P. AROME–NWC: A new nowcasting tool based on an operational mesoscale forecasting system. Q. J. R. Meteorol. Soc. 2015, 141, 1603–1611. [Google Scholar] [CrossRef]
- Buzzi, A.; Alberoni, P. Analysis and numerical modelling of a frontal passage associated with thunderstorm development over the Po Valley and the Adriatic Sea. Meteorol. Atmos. Phys. 1992, 48, 205–224. [Google Scholar] [CrossRef]
- Barrett, A.I.; Gray, S.L.; Kirshbaum, D.J.; Roberts, N.M.; Schultz, D.M.; Fairman, J.G., Jr. Synoptic versus orographic control on stationary convective banding. Q. J. R. Meteorol. Soc. 2015, 141, 1101–1113. [Google Scholar] [CrossRef]
- Miglietta, M.M.; Manzato, A.; Rotunno, R. Characteristics and predictability of a supercell during HyMeX SOP1. Q. J. R. Meteorol. Soc. 2016, 142, 2839–2853. [Google Scholar] [CrossRef]
- Cacciamani, C.; Battaglia, F.; Patruno, P.; Pomi, L.; Selvini, A.; Tibaldi, S. A climatological study of thunderstorm activity in the Po Valley. Theor. Appl. Climatol. 1995, 50, 185–203. [Google Scholar] [CrossRef]
- Costa, S.; Mezzasalma, P.; Alberoni, P.; Levizzani, V. Mesoscale and radar analysis of the 30 June 1998 supercell. Phys. Chem. Earth Part B Hydrol. Ocean. Atmos. 2000, 25, 1289–1291. [Google Scholar] [CrossRef]
- Rädler, A.T.; Groenemeijer, P.; Faust, E.; Sausen, R. Detecting severe weather trends using an additive regressive convective hazard model (AR-CHaMo). J. Appl. Meteorol. Climatol. 2018, 57, 569–587. [Google Scholar] [CrossRef]
- Rädler, A.T.; Groenemeijer, P.H.; Faust, E.; Sausen, R.; Púčik, T. Frequency of severe thunderstorms across Europe expected to increase in the 21st century due to rising instability. NPJ Clim. Atmos. Sci. 2019, 2, 30. [Google Scholar] [CrossRef] [Green Version]
- Púčik, T.; Groenemeijer, P.; Rädler, A.T.; Tijssen, L.; Nikulin, G.; Prein, A.F.; van Meijgaard, E.; Fealy, R.; Jacob, D.; Teichmann, C. Future changes in European severe convection environments in a regional climate model ensemble. J. Clim. 2017, 30, 6771–6794. [Google Scholar] [CrossRef]
- Vulpiani, G.; Pagliara, P.; Negri, M.; Rossi, L.; Gioia, A.; Giordano, P.; Alberoni, P.P.; Cremonini, R.; Ferraris, L.; Marzano, F.S. The Italian radar network within the national early-warning system for multi-risks management. In Proceedings of the Fifth European Conference on Radar in Meteorology and Hydrology (ERAD 2008), Helsinki, Finland, 30 June–4 July 2008; Volume 184. [Google Scholar]
- Petracca, M.; D’Adderio, L.; Porcù, F.; Vulpiani, G.; Sebastianelli, S.; Puca, S. Validation of GPM dual-frequency precipitation radar (DPR) rainfall products over Italy. J. Hydrometeorol. 2018, 19, 907–925. [Google Scholar] [CrossRef]
- Chang, W.; Chung, K.S.; Fillion, L.; Baek, S.J. Radar data assimilation in the Canadian high-resolution ensemble Kalman filter system: Performance and verification with real summer cases. Mon. Weather Rev. 2014, 142, 2118–2138. [Google Scholar] [CrossRef]
- Liu, Z.Q.; Rabier, F. The potential of high-density observations for numerical weather prediction: A study with simulated observations. Q. J. R. Meteorol. Soc. 2003, 129, 3013–3035. [Google Scholar] [CrossRef]
- Biron, D.; De Leonibus, L.; Zauli, F. The lightning network LAMPINET of the Italian Air Force Meteorological Service. In Proceedings of the 19th International Lightning Detection Conference, Tucson, AZ, USA, 24–24 April 2006; pp. 24–25. [Google Scholar]
- De Leonibus, L.; Biron, D.; Laquale, P.; Zauli, F.; Melfi, D. Rainfall field reconstruction over Italy through lampinet lightning data. In Proceedings of the 20th International Lightning Detection Conference, Tucson, AZ, USA, 21–23 April 2008. [Google Scholar]
- De Jonge, P.J. A Processing Strategy For the Application of the GPS in Networks; NCC NederlandseCommissievoor Ceodesie: Delft, The Netherlans, 1998; Volume 46. [Google Scholar]
- Tagliaferro, G. On the Development of a General Undifferenced Uncombined Adjustment for GNSS Observations. Ph.D. Thesis, Polytechnic University of Milan, Milan, Italy, 2021. [Google Scholar]
- Sato, K.; Realini, E.; Tsuda, T.; Oigawa, M.; Iwaki, Y.; Shoji, Y.; Seko, H. A high-resolution, precipitable water vapor monitoring system using a dense network of GNSS receivers. J. Disaster Res. 2013, 8, 37–47. [Google Scholar] [CrossRef]
- Barindelli, S.; Realini, E.; Venuti, G.; Fermi, A.; Gatti, A. Detection of water vapor time variations associated with heavy rain in northern Italy by geodetic and low-cost GNSS receivers. Earth Planets Space 2018, 70, 28. [Google Scholar] [CrossRef]
- Fujita, M.; Kimura, F.; Yoneyama, K.; Yoshizaki, M. Verification of precipitable water vapor estimated from shipborne GPS measurements. Geophys. Res. Lett. 2008, 35, L13803. [Google Scholar] [CrossRef]
- Realini, E.; Sato, K.; Tsuda, T.; Manik, T. An observation campaign of precipitable water vapor with multiple GPS receivers in western Java, Indonesia. Prog. Earth Planet. Sci. 2014, 1, 17. [Google Scholar] [CrossRef]
- Greene, D.R.; Clark, R.A. Vertically integrated liquid water—A new analysis tool. Mon. Weather Rev. 1972, 100, 548–552. [Google Scholar] [CrossRef]
- Marshall, J.S. The distribution of raindrops with size. J. Meteorol. 1948, 5, 165–166. [Google Scholar] [CrossRef]
- Skamarock, W.C.; Klemp, J.B.; Dudhia, J.; Gill, D.O.; Barker, D.M.; Duda, M.; Wang, X.Y.; Wang, W.; Power, J.G. A Description of the Advanced Research WRF Version 3; NCAR Tech. Note NCAR/TN-475+STR; University Corporation for Atmospheric Research: Boulder, CO, USA, 2008; p. 113. [Google Scholar] [CrossRef]
- Barker, D.; Huang, X.Y.; Liu, Z.; Auligné, T.; Zhang, X.; Rugg, S.; Ajjaji, R.; Bourgeois, A.; Bray, J.; Chen, Y.; et al. The weather research and forecasting model’s community variational/ensemble data assimilation system: WRFDA. Bull. Am. Meteorol. Soc. 2012, 93, 831–843. [Google Scholar] [CrossRef]
- Lagasio, M.; Campo, L.; Milelli, M.; Mazzarella, V.; Poletti, M.L.; Silvestro, F.; Ferraris, L.; Federico, S.; Puca, S.; Parodi, A. SWING, The Score-Weighted Improved NowcastinG Algorithm: Description and Application. Water 2022, 14, 2131. [Google Scholar] [CrossRef]
- Lagasio, M.; Parodi, A.; Pulvirenti, L.; Meroni, A.N.; Boni, G.; Pierdicca, N.; Marzano, F.S.; Luini, L.; Venuti, G.; Realini, E.; et al. A synergistic use of a high-resolution numerical weather prediction model and high-resolution earth observation products to improve precipitation forecast. Remote Sens. 2019, 11, 2387. [Google Scholar] [CrossRef]
- Lagasio, M.; Parodi, A.; Procopio, R.; Rachidi, F.; Fiori, E. Lightning Potential Index performances in multimicrophysical cloud-resolving simulations of a back-building mesoscale convective system: The Genoa 2014 event. J. Geophys. Res. Atmos. 2017, 122, 4238–4257. [Google Scholar] [CrossRef]
- Fiori, E.; Ferraris, L.; Molini, L.; Siccardi, F.; Kranzlmueller, D.; Parodi, A. Triggering and evolution of a deep convective system in the Mediterranean Sea: Modelling and observations at a very fine scale. Q. J. R. Meteorol. Soc. 2017, 143, 927–941. [Google Scholar] [CrossRef]
- Iacono, M.J.; Delamere, J.S.; Mlawer, E.J.; Shephard, M.W.; Clough, S.A.; Collins, W.D. Radiative forcing by long-lived greenhouse gases: Calculations with the AER radiative transfer models. J. Geophys. Res. Atmos. 2008, 113, D13103. [Google Scholar] [CrossRef]
- Hong, S.Y.; Lim, J.O.J. The WRF single-moment 6-class microphysics scheme (WSM6). Asia-Pac. J. Atmos. Sci. 2006, 42, 129–151. [Google Scholar]
- Hong, S.Y.; Noh, Y.; Dudhia, J. A new vertical diffusion package with an explicit treatment of entrainment processes. Mon. Weather Rev. 2006, 134, 2318–2341. [Google Scholar] [CrossRef]
- Han, J.; Pan, H.L. Revision of convection and vertical diffusion schemes in the NCEP Global Forecast System. Weather Forecast. 2011, 26, 520–533. [Google Scholar] [CrossRef]
- Wang, H.; Huang, X.Y.; Sun, J.; Xu, D.; Zhang, M.; Fan, S.; Zhong, J. Inhomogeneous background error modeling for WRF-Var using the NMC method. J. Appl. Meteorol. Climatol. 2014, 53, 2287–2309. [Google Scholar] [CrossRef] [Green Version]
- Fierro, A.O.; Mansell, E.R.; Ziegler, C.L.; MacGorman, D.R. Application of a lightning data assimilation technique in the WRF-ARW model at cloud-resolving scales for the tornado outbreak of 24 May 2011. Mon. Weather Rev. 2012, 140, 2609–2627. [Google Scholar] [CrossRef]
- Prat, A.C.; Federico, S.; Torcasio, R.C.; Fierro, A.O.; Dietrich, S. Lightning data assimilation in the WRF-ARW model for short-term rainfall forecasts of three severe storm cases in Italy. Atmos. Res. 2021, 247, 105246. [Google Scholar] [CrossRef]
- Torcasio, R.C.; Federico, S.; Comellas Prat, A.; Panegrossi, G.; D’Adderio, L.P.; Dietrich, S. Impact of Lightning Data Assimilation on the Short-Term Precipitation Forecast over the Central Mediterranean Sea. Remote Sens. 2021, 13, 682. [Google Scholar] [CrossRef]
- Dixon, M.; Li, Z.; Lean, H.; Roberts, N.; Ballard, S. Impact of data assimilation on forecasting convection over the United Kingdom using a high-resolution version of the Met Office Unified Model. Mon. Weather Rev. 2009, 137, 1562–1584. [Google Scholar] [CrossRef]
- Xiao, Q.; Kuo, Y.H.; Sun, J.; Lee, W.C.; Lim, E.; Guo, Y.R.; Barker, D.M. Assimilation of Doppler radar observations with a regional 3DVAR system: Impact of Doppler velocities on forecasts of a heavy rainfall case. J. Appl. Meteorol. 2005, 44, 768–788. [Google Scholar] [CrossRef]
- Xiao, Q.; Kuo, Y.H.; Sun, J.; Lee, W.C.; Barker, D.M.; Lim, E. An approach of radar reflectivity data assimilation and its assessment with the inland QPF of Typhoon Rusa (2002) at landfall. J. Appl. Meteorol. Climatol. 2007, 46, 14–22. [Google Scholar] [CrossRef]
- Xiao, Q.; Sun, J. Multiple-radar data assimilation and short-range quantitative precipitation forecasting of a squall line observed during IHOP_2002. Mon. Weather Rev. 2007, 135, 3381–3404. [Google Scholar] [CrossRef]
- Sokol, Z.; Rezacova, D. Assimilation of radar reflectivity into the LM COSMO model with a high horizontal resolution. Meteorol. Appl. 2006, 13, 317–330. [Google Scholar] [CrossRef]
- Maiello, I.; Gentile, S.; Ferretti, R.; Baldini, L.; Roberto, N.; Picciotti, E.; Alberoni, P.P.; Marzano, F.S. Impact of multiple radar reflectivity data assimilation on the numerical simulation of a flash flood event during the HyMeX campaign. Hydrol. Earth Syst. Sci. 2017, 21, 5459–5476. [Google Scholar] [CrossRef]
- Roberts, N.M.; Lean, H.W. Scale-selective verification of rainfall accumulations from high-resolution forecasts of convective events. Mon. Weather Rev. 2008, 136, 78–97. [Google Scholar] [CrossRef] [Green Version]
- Davis, C.; Brown, B.; Bullock, R. Object-based verification of precipitation forecasts. Part I: Methodology and application to mesoscale rain areas. Mon. Weather Rev. 2006, 134, 1772–1784. [Google Scholar] [CrossRef]
- Davis, C.; Brown, B.; Bullock, R. Object-based verification of precipitation forecasts. Part II: Application to convective rain systems. Mon. Weather Rev. 2006, 134, 1785–1795. [Google Scholar] [CrossRef]
- Burcea, S.; Cică, R.; Bojariu, R. Radar-derived convective storms’ climatology for the Prut River basin: 2003–2017. Nat. Hazards Earth Syst. Sci. 2019, 19, 1305–1318. [Google Scholar] [CrossRef]
- Ebert, E.E. Fuzzy verification of high-resolution gridded forecasts: A review and proposed framework. Meteorol. Appl. J. Forecast Pract. Appl. Train. Tech. Model. 2008, 15, 51–64. [Google Scholar] [CrossRef]


Publisher’s Note: MDPI stays neutral with regard to jurisdictional claims in published maps and institutional affiliations. |
© 2022 by the authors. Licensee MDPI, Basel, Switzerland. This article is an open access article distributed under the terms and conditions of the Creative Commons Attribution (CC BY) license (https://creativecommons.org/licenses/by/4.0/).