Abstract
Sea ice concentration is an important observation element and a necessary input parameter for the numerical prediction of sea ice. In this study, a new method is developed for the inversion of sea ice concentration (SIC) in Liaodong Bay from MODIS data based on the Normalized Difference Water Index (NDWI). By comparing the inverted results of the NDWI method and the WU’s methods, as well as observations from six shore-based observation points on the east coast of Liaodong Bay in the winter of 2016/2017 and Landsat 8 OLI data, the method based on NDWI is shown to be a useful tool to estimate the SIC. The SIC obtained by the NDWI method is in good agreement with the survey data. The mean absolute error between the SIC obtained by the NDWI method and visual observation is about 10%. In the comparison data, 92% of the absolute error values of SIC are less than 20%. The average value of the error of the SIC obtained by the NDWI method is 1%, and that of the WU’s method is about −10%, which means the accuracy of SIC obtained by the NDWI method is better. The mean deviation of the error of the SIC obtained by the NDWI method and the WU’s method is about 9% and 13%, which shows a certain improvement in precision. The validation results with the Landsat 8 OLI data show the precision of the SIC obtained by the NDWI method is better than the WU’s method, which is consistent with the validation result of the survey data.
1. Introduction
The Bohai Sea region is the most important marine economic zone in Northern China. Liaodong Bay is the area with the heaviest ice conditions in the Bohai Sea. Sea ice in winter is a major potential threat to production activities, coastal traffic safety, marine farming, and offshore oil platforms in the Bohai Sea [1,2,3]. On the other hand, sea ice also provides potential freshwater resources [4]. Therefore, real-time monitoring and the accurate forecast of sea ice are of great importance.
The data of sea ice concentration (SIC) and other parameters are of great significance to engineering design, disaster prevention and mitigation, and resource utilization of sea ice in the Bohai Sea [5,6,7]. Traditional sea ice monitoring methods, such as shore-based and icebreaker observations, cannot obtain timely and accurate information about sea ice. Hence, over the past 30 years, remote sensing has become a powerful approach to sea ice monitoring because of its wide range of observation, and its fast and economic performance.
Optical remote sensing images [8,9,10,11,12,13], thermal infrared remote sensing images [14,15], and microwave remote sensing images [16,17], have been widely used in the estimation of sea ice in the Bohai Sea, especially for optical remote sensing. The main reasons are described as follows. Firstly, there is no perpetual night in the Bohai Sea and the weather in the Bohai Sea is relatively good. Secondly, the snowfall in the Bohai Sea is small. Due to the influences of wind and sea currents, the snow-covered area on sea ice in the Bohai Sea is small [18]. Even if there is snow cover, its thickness is only a few centimeters.
Moderate Resolution Imaging Spectroradiometer (MODIS) is a typical optical and infrared remote sensor. MODIS data have been used to monitor SIC in polar regions. For example, Drüe and Heinemann [19] used MODIS data to obtain polar SIC information. Cavalieri et al. [20] calculated the albedo using the reflectance of MODIS bands 1, 3, and 4, to classify sea ice and estimate SIC based on albedo. Chi et al. [21] used MODIS data to calculate SICs based on spectral unmixing with a new ice/water endmember extraction algorithm that exploits global/local representatives, and then trained a deep learning network with AMSR2 data. Eventually, they developed a new operational SIC retrieval algorithm for the entire Arctic Ocean using AMSR2 passive microwave data and high-resolution MODIS images, which outperform popular SIC products. Zhao et al. [22] used the albedo difference between sea ice and seawater in visible light to classify and obtain SIC data with a resolution of 12.5 km in the Antarctica by using MODIS data. In addition, Liu et al. [23] proposed an inversion algorithm for SIC based on Visible Infrared Imaging Radiometer (VIIRS) data. In the algorithm, the Normalized Difference Snow Index (NDSI) was used to identify sea ice, and to calculate SIC in the polar sea. Shi [24] proposed an improved threshold algorithm for determining the typical reflectance of pure sea ice pixels by the nearest neighbor pixel method. According to the difference of reflectivity, the improved algorithm adopts different methods to determine the threshold value of typical reflectivity of pure sea ice pixels.
The sea ice in the Bohai Sea is the first-year ice, which is different from the characteristics of that in the polar regions. In general, the thickness of sea ice in the Bohai Sea is mainly in the range of several centimeters to tens of centimeters, which is much smaller than sea ice in the polar regions. In thin ice regions, solar radiation can penetrate sea ice. Therefore, the reflectivity of pure ice pixels in the Bohai Sea is relatively low. On the other hand, the sediment content of seawater in the Bohai Sea is relatively large, and there may be more impurity particles on the surface of the sea ice, resulting in a very rough surface of sea ice. Hence, the inversion method of SIC in the polar regions may not be applicable in the Bohai Sea. At present, there are relatively few studies on the inversion of SIC in the Bohai Sea. Based on the empirical correspondence between the reflectivity of the ice surface, Wu et al. [9] used the reflectivity of the 1-band to invert the ice concentration in the Bohai Sea. Zhang and Zhang [25] used the Classification And Regression Trees (CART) method to invert the sea ice area from MODIS data, which effectively eliminated the misjudgement of sea ice when the traditional threshold method was used to invert the marine environments, such as high suspended sediment. Luo et al. [8] used the 4-channel of the Chinese ocean color and temperature scanner (COCTS) of the “HY-1A” satellite and the 5-channel of the coastal zone imager (CZI) to retrieve the SIC in the Bohai Sea. Liu et al. [26] determined the threshold value of the SIC inversion algorithm based on AVHRR satellite data and the measured spectral data, and conducted a multi-channel inversion of SIC based on the linear spectral mixture model (LSMM).
To accomplish real-time monitoring and an accurate prediction of the sea ice in the Bohai Sea, the Normalized Difference Water Index (NDWI) was used to invert the concentration for the first-year sea ice based on MODIS data. We estimated the SIC in the Liaodong Bay of the Bohai Sea and validated the method through sea ice survey data and high-resolution satellite data. The structure of this paper is as follows. Section 2 introduces the MODIS data and data processing, survey data, the method for calculating SIC from visual observation data, and Landsat 8 OLI data. Section 3 introduces the inversion methods of SIC. Section 4 mainly invert SIC by the NDWI methods in the Liaodong Bay, and compare it with that obtained by another method, the visual observation data and SIC obtained from Landsat 8 OLI data. Section 5 discusses and concludes the whole work.
2. Data and Data Processing
MODIS data is used for the inversion of SIC. The source of the data and the process of preprocessing are introduced here. Sea ice survey data and Landsat 8 OLI data would be used to verify the inversion result.
2.1. The MODIS Data
The MODIS is an instrument for Terra (EOS-AM) and Aqua (EOS-PM) series satellites. It has 36 spectral channels distributed in the electromagnetic spectrum ranging from 0.4 to 14 μm. The ground resolution of the MODIS instrument is 250 m, 500 m, and 1000 m, and the scan width is 2330 km. Global observation data can be obtained every day or every two days. In addition to calibrating the MODIS sensor before launch, it also uses blackbody, sunlight slower, sunlight diffuser stability monitors, and spectral radiation corrector, to calibrate it during flight to ensure the accuracy of quantification. The MODIS data used in this study were the L1B data provided by Level 1 and Atmosphere Archive and Distribution System (LAADS) of the National Aeronautics and Space Administration (NASA) and obtained after radiometric calibration. The MODIS products here are derived from MODIS on the Terra satellite with a spatial resolution of 1000 m and involve a total of seven bands (Table 1).

Table 1.
The central wavelength of the MODIS data.
To assist in analyzing the effect of inversion, we obtained the true color images of each day through MODIS data, some of which are shown below. The true color images are color composited using MODIS data in the manner of R: 1, G: 4, B: 3 and stretched by Gaussian stretching.
2.2. Sea Ice Survey Data
In the winter of 2016/2017, a sea ice survey was carried out along the eastern coast of the Liaodong Bay (Figure 1), and data including sea ice volume, concentration, and ice thickness, were obtained. Among them, the sea ice amount and concentration are important parameters to characterize the distribution of sea ice, which are mainly observed by the visual method. The visual observation method has been applied to the monitoring of sea ice in the Bohai Sea since the national marine census in 1958. According to the specifications, such as “The specification for offshore observations (GB/T 14914-2006)”, sea ice amount by visual observation (SIAv) refers to the proportion of the sea ice distribution area in the entire visible sea surface, and the SIC by visual observation (SICv) refers to the proportion of the floating ice coverage area in the sea surface of the floating ice distribution. The data were directly observed by the authors of the National Marine Environmental Monitoring Center (NMEMC, https://www.nmemc.org.cn/english/ (accessed on 25 June 2022)), who are personnel with many years of experience in the visual observation of sea ice, and all have nationally certified qualifications in sea ice observation. Therefore, the sea ice survey data is valid and reliable. When conducting SIAv observations, the entire visible sea surface is divided into 10 equal parts to estimate the proportion of sea ice distribution area. When the distribution area of sea ice accounts for less than 5% of the entire visible sea area, the ice volume is recorded as “0”; when it accounts for more than 5%, and less than 15%, it is recorded as 10%, and the rest are analogous. When observing SICv, the sea ice distribution in the entire visible sea surface is divided into 10 equal parts, and the percentage of sea ice coverage is estimated as SICv.
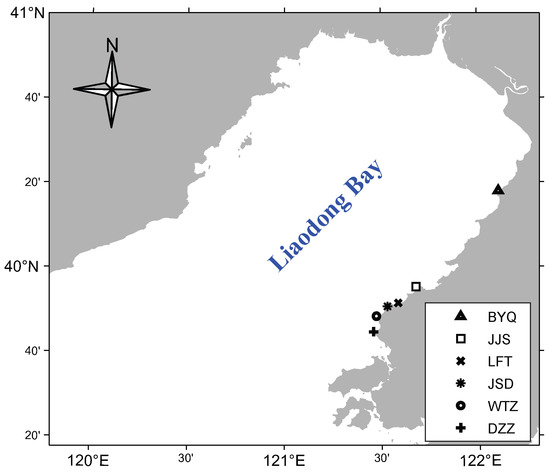
Figure 1.
Map of Liaodong Bay. Points represent the visual observation points in the winters of 2016 to 2017. The name of the observation points in the figure is the same as that in Table 2. In the figure, the BYQ stands for the Bayuquan observation point, JJS stands for the Jiangjunshi observation point, LFT stands for the Longfengtan observation point, WTZ stands for the Wentuozi observation point, and DZZ stands for the Dazuizi observation point.
Observations from two fixed observation points and four mobile observation points are used in this study. Fixed points and mobile observations are both human observations from a fixed point on the shore. At the fixed observation points, observations were conducted at 8:00 and 14:00 every day. At the mobile observation points, observations were carried out at most once a day, and the observing time was not fixed. Since the acquisition time of MODIS data of Terra satellites is around 11:00 Beijing time (belongs to East Eighth District Time Zone), the averaged observation data at 8:00 and 14:00 each day were compared with the satellite inversion results at the fixed observation points. As for the mobile observation points, only the data with observation time between 10:00 and 12:00 were compared with the satellite inversion results. The atmospheric visibility affects the accuracy of visual and satellite observations. Only data with horizontal visibility greater than 5 km is used here for comparison. The information on survey data after screening is shown in Table 2.

Table 2.
Sea ice visual observation points and data.
Generally, SIC in satellite remote sensing retrieval refers to the percentage of the area covered by sea ice within a certain range, which is used to describe the spatial concentration of sea ice. Therefore, the SIAv multiplied by the SICv is the average area percentage of sea ice in the visible range. This is consistent with the definition of SIC in satellite remote sensing retrieval and can be used to verify the satellite retrieval results. It can be expressed by the following formula:
The right side of the formula is the average value of SIC over R, which is the visual range. The S is the area of R. Affected by the curvature of the earth, the maximum distance of the visual horizon line (that is, the maximum value of R) is related to the altitude. According to” The specification for offshore observations (GB/T 14914-2006)”, the maximum long-range (D) calculation formula of the visible horizon is:
H is the altitude of the observation point with the unit of m and D is the farthest visible horizon with the unit of km. The maximum horizontal visibility distance of each observation point is shown in Table 2. Affected by the atmosphere visibility, the visual range obtained through field observations is smaller than D.
2.3. MODIS Data Processing
MODIS images of the Terra (EOS-AM) Satellite from January to February in 2017 were downloaded, and the MODIS images with glacial cloud coverage of less than 90% in Liaodong Bay were selected [27]. Data in a total of 32 days were screened, as shown in Table 3. MODIS data were subjected to the geometric correction and the correction of the ‘bow-tie’ effect with the Georeference MODIS tool in The Environment for Visualizing Images (ENVI). Since the absorption of solar short-wave radiation by the atmosphere weakens the radiation energy reaching the optical remote sensing satellite sensor, the scattering of solar short-wave radiation by the atmosphere introduces the scattered energy of the atmosphere. Therefore, accurately knowing the reflectivity of the surface requires atmospheric correction. First, the MODIS data is cropped to obtain an image (533 × 533 pixels) covering the Bohai Sea area. The Fast Line-of-sight Atmospheric Analysis of Spectral Hypercubes (FLAASH) atmospheric correction module of the ENVI remote sensing image processing software was used to perform atmospheric correction on MODIS data to obtain the sea ice reflectance [28]. Among the input parameters of FLAASH, the atmospheric profile model is mid-latitude winter, the aerosol model is marine type, and the visibility and water vapor content are shown in Table 3. The visibility and water vapor content were estimated based on observation data of the observation points on the east coast of the Liaodong Bay.

Table 3.
MODIS images with atmospheric correction parameters and TN.
The data is then preprocessed. The main preprocessing includes the atmospheric correction, removal of the land area, sea ice/seawater extraction, etc. The preprocessing process and related threshold selection are the same as Yuan et al. [29]. The determination of the NDWI threshold is mainly based on the Bayes classification criterion, and the intersection (“valley”) of the ice and water distribution curves in the NDWI distribution histogram is used as the threshold for ice and water identification. When there are multiple valleys in the histogram, the determination of the threshold also needs to take into account the actual number of sea ice, and finally determine the ice-water segmentation threshold, combined with manual interpretation of the true color images, as shown in Figure 2.

Figure 2.
The schematic diagram of the process of NDWI threshold (TN) determination on 20 January. The middle image shows the spatial distribution of NDWI. The right image is the NDWI distribution histogram in Liaodong Bay.
The sea water in the Bohai Sea contains a high content of sediments and shows a complex distribution. The sea ice was extracted by the NDWI:
ρ2 and ρ4 are the reflectance of the second and fourth bands of MODIS, respectively. TN is the NDWI threshold, determined according to the NDWI histogram. The threshold is significantly affected by the weather and varies greatly, as shown in Table 3.
2.4. The Landsat 8 OLI Data
The Landsat 8 satellite, launched in 2013, carries the Operational Land Imager (OLI). The OLI includes both multispectral and panchromatic bands, with a spatial resolution of 30 m in the multispectral band and 15 m in the panchromatic band [30]. In this study, the Landsat 8 OLI L1T level data, with a spatial resolution of 30 m released by the United States Geological Survey (USGS), was selected as the verification data. In order to reduce the influence of time-dependent changes in SIC on the accuracy of the results, the dates when the transit times of MODIS data and Landsat 8 OLI data are more consistent are selected. Finally, the acquisition date of Landsat 8 OLI is 10 January 2017, the acquisition time is 2:35 UTM, and the corresponding MODIS data acquisition time is 3:40 UTM.
The Landsat 8 OLI data was converted from integer to radiance using the Radiometric Calibration tool in ENVI. Input the 1–7 band radiance data into the ENVI atmospheric correction tool (FLAASH) to perform atmospheric correction, and the atmospheric parameter settings are the same as the MODIS data of the same day. After atmospheric correction, the sea ice reflectance data in bands 1–7 of Landsat 8 OLI were obtained. On the premise that there is no obvious positioning deviation between MODIS data and the Landsat 8 OLI, and based on the Bohai Sea range mask obtained from the MODIS data, the 1–7 band data of the Landsat 8 OLI was trimmed to obtain data including seawater and sea ice information. Due to the higher spatial resolution of Landsat 8 OLI, the threshold segmentation method used to extract sea ice extent from MODIS data is no longer applicable. The Iterative Selforganizing Data Analysis Techniques Algorithm (ISODATA) was used to perform cluster analysis to obtain the sea ice mask, and the initial categories are set to 2–7 [31]. After cluster analysis, six categories were obtained. Through visual interpretation, the misclassified pixel clusters were removed, and the categories were merged into two categories: sea ice and sea water (as shown in Figure 3b). In the SIC verification, to avoid the influence of factors such as coastline, sea ice boundary, and time change, this paper selects the 5 km × 5 km grid, as shown in Figure 3a, as the comparison cell. For MODIS data, the mean value of the SIC of each pixel in the cell is taken as the SIC of the cell. For Landsat 8 OLI data, the ratio of sea ice pixel area to cell area in a cell is taken as the cell’s SIC [24].
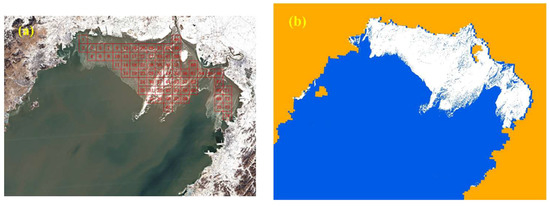
Figure 3.
The (a) Landsat 8 OLI image on 10 January 2017 and (b) the sea ice inversion result. The red grids and numbers in the left image are the distribution of the cells for validation and the Cell Id. The yellow area in the right image represents land area obtained from the MODIS data.
3. Introduction of SIC Inversion Method
After judging the ice and water by Equation (4), the SIC is calculated for the sea ice area. The main principle of estimating SIC from optical remote sensing data is that the reflectivity of sea water is lower than that of sea ice. As the proportion of sea ice area increases, the reflectivity of mixed pixels increases gradually. The sea ice does not have a complex three-dimensional surface structure, and it is generally believed that the mixed pixels of sea ice and seawater follow the law of linear mixed pixels. In satellite remote sensing, the piecewise linear methods [8,9,32] and linear spectral mixture models [26] are often used to invert SIC. Based on the characteristics of each channel of MODIS data, Wu et al. [9] used the first band of MODIS to calculate SIC:
The albedo of pure water is and the albedo of pure ice is [9]. This method provides an initial field of SIC for numerical prediction of sea ice in the Bohai Sea, which has been widely used [25].
For the pixel spectrum, the increase in the proportion of sea ice area and sea ice thickness can increase the reflectivity of the corresponding pixel. The phenomenon of foreign body with spectrum in remote sensing images has limited the precision of classification [33]. The SIC inversion using single-band reflectance and pixel decomposition methods is easily affected by this situation. At the same time, some complex meteorological conditions, such as sea fog or thin clouds, will cause the actual albedo of the sea surface to be high. In this case, SIC inversion using the single-channel albedo will be higher than the actual value. NDWI can reflect the spectral shape and eliminate the influence of sea ice thickness on the retrieval of SIC to a certain extent. In the sea ice pixels extracted above, the equation for inverting SIC using NDWI is shown as follows.
Among them, is the highest value corresponding to the pure water pixel, is the lowest value corresponding to the pure ice pixel. The visual observation data and MODIS data on 11 January 2017 both have the best weather and the highest reliability, which is selected to get the threshold values. By comparing with the visual observation, the NDWI value obtained from MODIS data near the observation points is used to calibrate the linear model, then get the slope and intercept. Assuming that the SIC is 0 and 1, the thresholds of the two values are obtained as , and , respectively. We use this method to invert the SIC in Liaodong Bay and compare it with that obtained by the method used by Wu et al. [9] (WU’s method for short).
4. Results and Analysis
Through the above process, we obtained retrieved SIC fields of Liaodong Bay for multiple dates based on the NDWI method and the WU method, respectively. This section will mainly compare the inversion effects of the two methods and demonstrate that the NDWI method has certain improvements. First, the sea ice extent and the averaged SIC of Liaodong Bay obtained by the two methods were compared, and the dates with large differences were selected and verified by the true color image to analyze the inversion effects of the two inversion methods. In addition, the SIC obtained from the sea ice survey data and Landsat 8 OLI data were taken as the “true value”, and the SICs inverted by the two methods were directly compared with the “true value”. The accuracy of the two inversion methods was evaluated by error analysis and statistical analysis.
4.1. Comparison of Retrieved SIC Fields
4.1.1. Differences in Retrieved Sea Ice Extent
Before the inversion of SIC, Equation (4) is used to distinguish the ice area and the water area. Only the SIC is calculated for the pixels determined to be the sea ice. Due to the different calculation methods, the calculated SIC may be less than or equal to 0% for the part areas that were previously determined to be ice areas. In this situation, the SIC of these pixels is assigned a value of 0%. Only the pixels with SIC greater than 0% are ultimately regarded as ice areas, and the summation of the ice areas is performed to obtain the sea ice extent of Liaodong Bay (Figure 4).
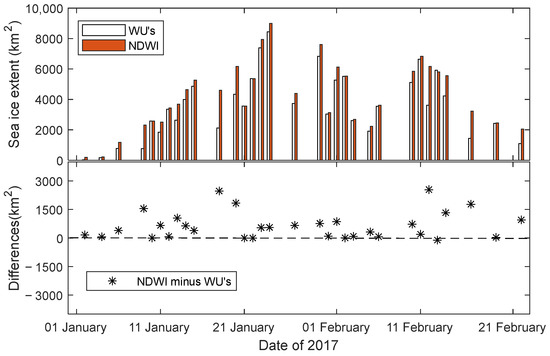
Figure 4.
Changes and differences of sea ice extent in Liaodong Bay retrieved by the two methods. The upper part is the sea ice extent of Liaodong Bay retrieved by the two methods, and the lower part is the difference between the sea ice extent of Liaodong Bay retrieved by the two methods.
The total area of Liaodong Bay is about 14,600 km2. It can be seen from Figure 4 that the sea ice extent inversion by the two methods can describe the development process of sea ice growth and melting in Liaodong Bay. The curves of sea ice extent obtained by the two methods have relatively consistent fluctuation characteristics. However, the sea ice extent obtained by the NDWI method is generally larger than that obtained by WU’s method. On 9, 13, 18, and 20 January, and 12, 14, and 17 February, the sea ice extent estimated by the NDWI method were significantly larger than the sea ice extent obtained by Wu’s method by more than 1000 km2. The spatial distribution of the retrieved SIC on these dates is compared with the true-color composite images (Figure 5 and Table 4).

Figure 5.
Spatial distribution of SIC inverted by the two methods and true-color composite image. The dates are listed on the left subfigure of each panel. The red curve in the true color image is the artificially interpreted outer edge of the sea ice area.

Table 4.
Comparison of inverted sea ice extent in Liaodong Bay DATE.
The spatial distribution of sea ice extent retrieved by the NDWI method shows a good agreement with the true-color composite image. Using the manual interpretation, the sea ice extent was extracted from the true-color composite image and listed in Table 4. It can be seen that the sea ice extent obtained by WU’s method is obviously smaller than that shown by the true-color composite images, and the sea ice extent obtained by NDWI is closer to the results of the true-color composite image. The difference between the sea ice extent extracted by NDWI and true-color composite image is mostly within 1000 km2, and the relative error is within 20%. On 14 February, the difference in sea ice extent between the NDWI and the true color image was large, with a relative difference of about 28%. It can be seen from the spatial distribution map that the sea ice in the western part of Liaodong Bay was inverted as a water area by the NDWI method on 14 February. From the true-color composite image, it can be seen that the color of sea ice and sea water in the western part of Liaodong Bay on February 14 was relatively close. On 17 February, the western part of Liaodong Bay was all water areas, and the extent of sea ice in Liaodong Bay was greatly reduced. It can be inferred that the thickness of the sea ice in the western part of Liaodong Bay was thin on February 14 and this area was determined as water. This results in the inverted sea ice extent being significantly smaller. In addition, the sea ice extent calculated by the artificial judgment method of the true-color composite image is the whole area within the outer edge of the ice area in Liaodong Bay. In other words, the water area within the outer edge of the ice area is regarded as ice area, which leads to an overestimation of sea ice extent. In terms of inversion of the sea ice extent, the NDWI method has a better performance than WU’s method.
4.1.2. Differences in the Inversion of the Averaged SIC
The averaged SIC in Liaodong Bay is shown in Figure 6. The averaged SIC estimated by the NDWI method is much larger than that estimated by WU’s method, which may be the result of the effect of sediment. It can be seen from the MODIS true-color composite images that the content of suspended sediment in the coastal area of Liaodong Bay is high. This will inevitably affect the spectral information of sea ice. Studies have found that the albedo of sea ice is inversely proportional to its content of particles in the surface layer. The higher the particle concentration, the lower the sea ice albedo [34]. Affected by the sediment and other substances in the sea water, there are likely to be more impurity particles on the surface of sea ice in the coastal area. And the albedo of these sea ice is lower than that of smooth sea ice under the same conditions. On the other hand, the albedo of seawater containing sediment is higher than that of clean seawater, which will also lead to the misjudgment of seawater as sea ice. All these causes make the SIC obtained by the single-channel inversion of WU’s method smaller than the actual situation.
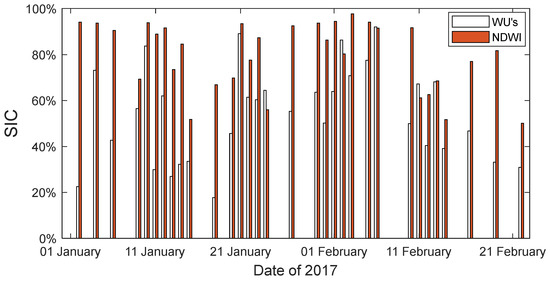
Figure 6.
The time series of averaged SIC in Liaodong Bay retrieved by two methods.
The dates when the absolute difference of the averaged SIC in Liaodong Bay obtained by the two methods was greater than 40%, and the absolute difference of sea ice extent was less than 1000 km2 were found, which were 11 and 14 January, and 10 and 20 February. The spatial distribution of SIC on these dates is shown in Figure 7. In the four days, the SIC inverted by the NDWI is much higher than that inverted by WU’s method. In the four days, the SIC in Liaodong Bay retrieved by the NDWI was relatively large, mostly greater than 80%, which is a reasonable distribution in the main ice area and is more consistent with the distribution of sea ice in the true-color composite image. Under normal circumstances, the sea ice in the main ice area is easy to accumulate, and the concentration is generally higher. The inverted results of the NDWI can reflect the accumulation characteristics of sea ice in the ice area. In the past few days, the SIC of the central location of the ice area retrieved by WU’s method is mostly less than 50%, which is inconsistent with the distribution characteristics of sea ice in the true color map and does not satisfy the general distribution characteristics of SIC.
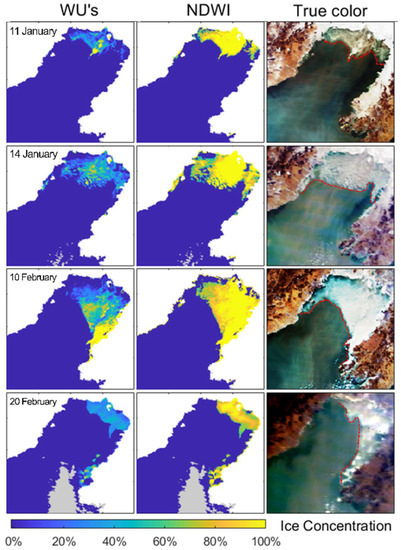
Figure 7.
Same as Figure 5, but on 11 and 14 January, and 10 and 20 February.
4.2. Comparison with Visual Observations
The SIC visually obtained from six points (Table 2) were compared with the inversion results. It can be seen from Figure 8 that the SIC at each measurement point fluctuates significantly, especially at the JSD, WTZ, and LFT points. It can be seen from the true-color composite image that these measuring points are located near the outer edge of the ice area on the east coast of Liaodong Bay.
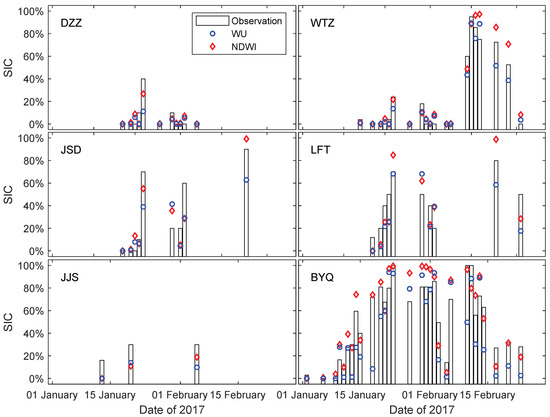
Figure 8.
Comparison of the retrieved SIC from MODIS with observed data by visual estimation at the shore-based observation points. Only valid comparison samples are shown here. In addition to meeting the time requirements and visibility requirements of Section 2.2, the valid comparison samples also need to meet the cloud coverage rate of the observation range of the measuring point during inversion is less than 50%. The satellite remote sensing images on 24 January were of poor quality and were not used as valid comparison samples.
The SIC inverted by the two methods is consistent with the time-varying characteristics of the visual observation results. All of them can reflect the strong fluctuation characteristics of ice conditions at the measuring points. Among them, WTZ and BYQ are two fixed measurement points. The observation time covers the entire ice age, and the complete development process of sea ice has been observed. The satellite inversion results at these two measuring points show a good agreement with the observed sea ice development process. However, compared with WU’s method, the time series of SIC retrieved by the NDWI method is more consistent with the actual measurement.
Taking the SIC obtained by visual observation as the true value, the error analysis of the SIC results retrieved by the NDWI and WU’s method was carried out. According to “The specification for offshore observations (GB/T 14914-2006)”, the accuracy of SICv and SIAv is ±10%. Also, SIC is equal to the product of SICv and SIAv (see Section 2.2). Therefore, the SIC calculated from the visual data has an accuracy of about ±20%. When the SIC difference between satellite inversion and visual observation is within 20%, the inversion results can be considered credible.
It can be seen from Figure 9 that the absolute error of the SIC obtained by WU’s method is within 40% and the proportion of the absolute error less than 20% is 73%. The mean absolute error was 14%, which was less than 20% and within the acceptable range. The absolute error of the SIC obtained by the NDWI method is within 30% and the proportion of the absolute error less than 20% is 92%. In other words, most of the sample errors are within the acceptable range. The proportion of absolute errors greater than 20% is only 8%, which is significantly better than the inversion results of WU’s method. The mean absolute error of SIC obtained by the NDWI method is 10%, which is better than that of WU’s method. The absolute error of SIC obtained by the two methods has no significant correlation with the value of SIC (Figure 9a,b). In addition, the error has no time-varying law.
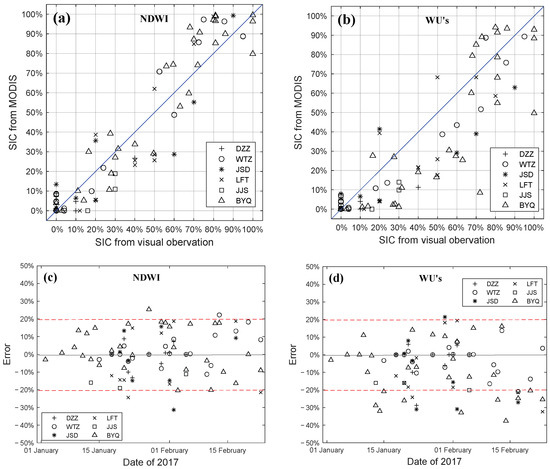
Figure 9.
The SIC obtained by (a) the NDWI method and (b) WU’s method as well as the observation value. The time series of the SIC error obtained by (c) the NDWI method and (d) WU’s method. Only the valid comparison samples in Figure 8 are shown.
The average value of the error of the SIC obtained by the NDWI method is 1%, and that of WU’s method is about −10%. This means that the accuracy of SIC obtained by the NDWI method is better than that of WU’s method. The mean deviation of the error of the SIC obtained by the NDWI method and WU’s method is about 9% and 13%, which shows the precision of the SIC obtained by the NDWI method is a little better than WU’s method. Therefore, the improvement of the NDWI method is mainly in terms of accuracy. On the other hand, WU’s method could be corrected by better tuning to remove the bias. It can be seen from Equation 5 that adjusting the values of Aw and Ai could directly reduce the bias of the SIC obtained by WU’s method. But changing the threshold of WU’s method does not guarantee the improvement of accuracy in other years
In conclusion, the inverted results of the NDWI are quite consistent with visual observation, and most of the inversion errors are within the acceptable range, which is a significant improvement compared with WU’s method.
In addition to the inversion method and the quality of satellite data, there are two important factors affecting the satellite remote sensing inversion error. First, there are errors in the SIAv, SICv, and visual range measured by visual observation, which will lead to certain errors in the SIC obtained based on visual data. On the other hand, the visual observation time and the satellite acquisition time are not completely consistent. The ice flow in Liaodong Bay is affected by strong tidal currents and has strong reciprocating motion characteristics. Based on the measured data, Shi et al. [35] analyzed the movement characteristics of floating ice on the east coast of Liaodong Bay and concluded that the movement of floating ice is mainly controlled by tidal currents, and the drift speed of floating ice can reach more than 1 m/s. This means that the floating ice can move 3.6 km in 1 h. In this case, the SIC in the observed sea area may change greatly within an hour. Although the visual observation data have certain limitations, the visual observation method is the mainstream observation method for ice conditions. Based on the relevant specifications, the visual observation results have certain accuracy. Comparing remote sensing results with visual observations is a more reliable method to assess the reliability of remote sensing methods.
4.3. Poor Performance of NDWI Inversion Method
The poor NDWI inversion results on 24 January may be caused by the poor quality of satellite data. It can be seen from Figure 10 that the distribution of sea ice extent, retrieved by the NDWI method on 24 January, is quite consistent with the true-color composite image. However, there are significant differences compared with the visual results. The SIC values from visual observation are about 100% (in the BYQ), 90% (in the LFT), 80% (in the JSD), 60% (in the WTZ), and 70% (in the DZZ), while the inversion results of the NDWI method are 90%, 70%, 40%, 20%, and 20%, the inversion results of WU’s method are 100%, 40%, 20%, 10%, and 0%. It can be seen that the inversion errors of SIC at the BYQ and LFT points are relatively small. The three observation points to the south are on the edge of the ice area. The inversion errors of SIC at these observation points are relatively large. The inversion results are smaller than the visual results, and compared with the visual observation, the SIC error of the NDWI method is obviously smaller than that of WU’s method.
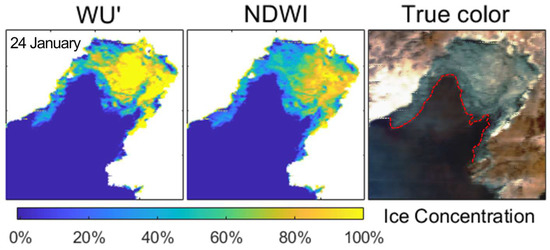
Figure 10.
Same as Figure 7, but on 24 January.
4.4. Compare with Landsat 8 OLI Data
Taking the SIC obtained by Landsat 8 OLI data as the true value here, the error analysis of SIC results retrieved by the NDWI and WU’s method was carried out. It can be seen from Figure 11 that the absolute error of the SIC obtained by WU’s method is within 45% and the proportion of the absolute error less than 20% is 89%. The mean absolute error was 13%, which was similar to the validation result by visual observations. The absolute error of the SIC obtained by the NDWI method is within 30% and the proportion of the absolute error less than 20% is 92%. The mean absolute error was 6%, which is also better than the inversion results of WU’s method.
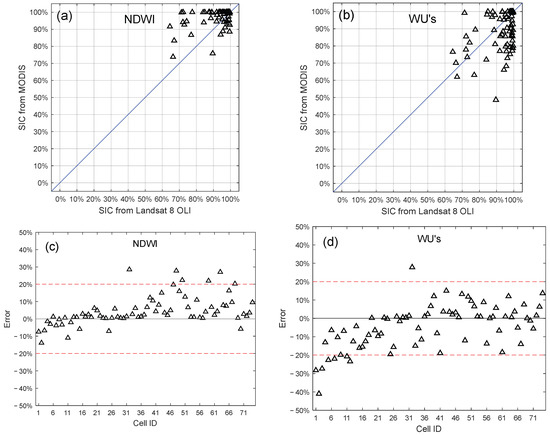
Figure 11.
SIC was obtained by (a) the NDWI and (b) WU’s method as well as SIC from Landsat 8 OLI data. The grid series of the SIC error was obtained by (c) the NDWI and (d) WU’s method.
The average value of the error of SIC obtained by the NDWI method is about 4%, and that of WU’s method is about −4%. This means that the accuracy of SIC obtained by the two methods is not significant. Consistent with the visual verification results, the SIC obtained by the WU method is relatively small, and the SIC obtained by the NDWI method is relatively large. The mean deviation of the error of the SIC obtained by the NDWI method and WU’s method is about 6% and 10%, which shows the precision of the SIC obtained by the NDWI method is better than WU’s method. This is consistent with the validation results of visual observations.
In general, the validation results of visual observations are consistent with those of high-resolution remote sensing data validation.
4.5. Discussions
In general, the SIC in Liaodong Bay retrieved by the NDWI method can better reflect the actual situation. Of course, when the sea ice thickness is small or at the edge of the ice area, the inversion results are worse. The inversion results in the center of the ice area are better. The input reflectance of the NDWI inversion model must be atmospheric corrected. The NDWI inversion model is not only suitable for MODIS data, but for other remote sensing data that can build NDWI. However, due to the influence of spectral response functions of different sensor channels, the values of model parameters may vary slightly. Although the threshold used by the NDWI inversion method here is based on one day’s data (11 January), the NDWI method has shown a noticeable improvement over WU’s method. The threshold for the NDWI inversion method can be further confirmed by referring to the measured results. This shows, from another aspect, that the NDWI method to invert SIC is scientific and has more room for improvement.
At present, the observed data of SIC are often obtained by visual observation, which has certain human factors and certain limitations. When comparing satellite inversion results with visual observations, attention should be paid to the differences in information sources, spatial scales, and observation time. Due to the lack of sufficient on-site observation data to verify and correct the inversion results, there are still some problems with the inversion method and selected parameters. In the future, large-scale comprehensive sea ice observations and surveys, as well as special marine experiment programs, are required to provide a large number of credible measured data for comparison and verification. On the other hand, the NDWI method proposed here can also be used for other similar spectral settings remote sensing data, or other regions such as the Arctic. However, due to the differences in the physical properties of sea ice and the spectral response function of the remote instrument, further model parameter calibration may be required in practical applications.
5. Conclusions
For the spectrum of a single pixel, the increase in the proportion of sea ice area and the increase in sea ice thickness can improve the reflectivity of sea ice, and there is the problem of the same spectrum for different objects. The SIC inversion using single-band reflectance and pixel decomposition methods is easily affected by this situation. Based on previous research and practice, this paper uses NDWI to invert SIC. NDWI can reflect the spectral shape and eliminate the influence of sea ice thickness on the estimation of SIC to a certain extent. In this paper, based on the NDWI method, SIC inversion in Liaodong Bay is carried out. The inversion results are compared with WU’s method and verified with the visual observation data and Landsat 8 OLI data. The following conclusions are drawn from the research.
(1) Compared with WU’s method, SIC inversion effect of the NDWI method is significantly improved. In most cases, the distribution of sea ice extent and concentration inverted by the NDWI method in Liaodong Bay is more consistent with the satellite true-color composite images.
(2) The SIC obtained by the NDWI method is in good agreement with the survey data. The mean absolute error between SIC obtained by NDWI inversion and the visual observation is about 10%, and 92% of the absolute error is less than 20%. The average value of the error of SIC obtained by WU’s method is 1%, and that of WU’s method is about −10%. This means the accuracy of SIC obtained by the NDWI method is better than that of WU’s method. The mean deviation of the error of SIC obtained by the NDWI method and WU’s method is about 8% and 13%, which shows the precision of SIC obtained by the NDWI method is a little better than WU’s method. The SIC retrieved by the NDWI method on 24 January is significantly smaller than the visual observation, which may be due to the poor quality of satellite data.
(3) Landsat 8 OLI data with a resolution of 30 m on 10 January is selected for verification, which is more consistent with MODIS data acquisition time. The validation results show the precision of SIC obtained by the NDWI method is better than WU’s method, which is consistent with the validation of visual observation.
Author Contributions
Conceptualization, W.S.; methodology, W.S. and S.Y.; investigation, W.S., Y.M. and S.Y.; software, W.S. and C.L.; formal analysis, W.S. and C.L.; writing—original draft preparation, W.S.; writing—review and editing, S.Y. and X.L.; supervision, N.X.; funding acquisition, W.S. and S.Y. All authors have read and agreed to the published version of the manuscript.
Funding
This research was funded by the Central Guidance on Local Science and Technology Development Fund of Dalian City (“Research on marine dynamic in-situ monitoring technology for risk warning of coastal nuclear power cold source blockage risk in Dalian”), and the Youth Science and Technology Star Project of Dalian (2020RQ020), the National Natural Science Foundation of China, grant number 41806219, and the National key research and development program, grant number 2018YFC1407602.
Data Availability Statement
The MODIS data used in this paper can be downloaded from https://ladsweb.modaps.eosdis.nasa.gov/missions-and-measurements/products/MOD021KM (accessed on 30 March 2022). The Landsat 8 OIL data used here can be downloaded from https://earthexplorer.usgs.gov/ (accessed on 10 June 2022).
Acknowledgments
The authors deeply thank the reviewers and editor for their constructive suggestions on the earlier version of the manuscript. The authors would like to thank NASA Land Processes Distributed Active Archive Center and the United States Geological Survey for providing the free data.
Conflicts of Interest
The authors declare no conflict of interest.
References
- Huang, Y.; Sun, J.; Wan, J.; Tian, Y. Experimental observations on the ice pile-up in the conductor array of a jacket platform in Bohai Sea. Ocean Eng. 2017, 140, 334–351. [Google Scholar] [CrossRef]
- Li, R.; Lu, Y.; Hu, X.; Guo, D.; Zhao, P.; Wang, N.; Lee, K.; Zhang, B. Space–time variations of sea ice in Bohai Sea in the winter of 2009–2010 simulated with a coupled ocean and ice model. J. Oceanogr. 2020, 77, 243–258. [Google Scholar] [CrossRef]
- Liu, M.; Wang, J.; Zhong, S.; You, H.; Liang, Q.; Chen, T.; Li, W.; Yang, X. Quantitative evaluation of sea-ice disaster in Bohai sea based on GOCI and Sentinel-1. J. Geod. Geoinf. Sci. 2021, 4, 49. [Google Scholar]
- Yu, Y.; Li, X.; Xu, Y.; Li, Q.; Gu, W. The estimate of sea ice resources in the bohai sea based on modis data. Resour. Sci. 2017, 39, 2166–2175. (In Chinese) [Google Scholar]
- Wang, A.; Tang, M.; Zhao, Q.; Liu, Y.; Li, B.; Shi, Y.; Sui, J. Analysis of sea ice parameters for the design of an offshore wind farm in the Bohai Sea. Ocean Eng. 2021, 239, 109902. [Google Scholar] [CrossRef]
- Karvonen, J.; Shi, L.; Cheng, B.; Similä, M.; Mäkynen, M.; Vihma, T. Bohai Sea Ice Parameter Estimation Based on Thermodynamic Ice Model and Earth Observation Data. Remote Sens. 2017, 9, 234. [Google Scholar] [CrossRef]
- Bian, C.; Jiang, W.; Pohlmann, T.; Sündermann, J. Hydrography-physical description of the Bohai Sea. J. Coast. Res. 2016, 74, 1–12. [Google Scholar] [CrossRef]
- Luo, Y.; Wu, H.; Zhang, Y.; Sun, C.; Liu, Y. Application of HY-1 satellite to sea ice monitoring and forecasting. Acta Oceanol. Sin. 2004, 23, 251–266. [Google Scholar]
- Wu, L.; Wu, H.; Sun, L.; Zhang, Y.; Liu, Y.; Wei, X. Retrieval of sea ice in the Bohai sea from MODIS data. J. Ocean Univ. China 2006, 36, 173–179. (In Chinese) [Google Scholar]
- Yan, Y.; Huang, K.; Shao, D.; Xu, Y.; Gu, W. Monitoring the characteristics of the Bohai Sea ice using high-resolution geostationary ocean color imager (GOCI) data. Sustainability 2019, 11, 777. [Google Scholar] [CrossRef]
- Su, H.; Ji, B.; Wang, Y. Sea ice extent detection in the Bohai Sea using Sentinel-3 OLCI data. Remote Sens. 2019, 11, 2436. [Google Scholar] [CrossRef]
- Yuan, S.; Liu, C.; Liu, X.; Chen, Y.; Zhang, Y. Research advances in remote sensing monitoring of sea ice in the Bohai sea. Earth Sci. Inform. 2021, 14, 1729–1743. [Google Scholar] [CrossRef]
- Liu, W.; Sheng, H.; Zhang, X. Sea ice thickness estimation in the Bohai Sea using geostationary ocean color imager data. Acta Oceanol. Sin. 2016, 35, 105–112. [Google Scholar] [CrossRef]
- Han, Y.; Gao, Y.; Zhang, Y.; Wang, J.; Yang, S. Hyperspectral Sea Ice Image Classification Based on the Spectral-Spatial-Joint Feature with Deep Learning. Remote Sens. 2019, 11, 2170. [Google Scholar] [CrossRef] [Green Version]
- Zeng, T.; Shi, L.; Marko, M.; Cheng, B.; Zou, J.; Zhang, Z. Sea ice thickness analyses for the Bohai Sea using MODIS thermal infrared imagery. Acta Oceanol. Sin. 2016, 35, 96–104. [Google Scholar] [CrossRef]
- Liu, M.; Dai, Y.; Zhang, J.; Zhang, X.; Meng, J.; Zhu, X.; Yin, Y. The microwave scattering characteristics of sea ice in the Bohai Sea. Acta Oceanol. Sin. 2016, 35, 89–98. [Google Scholar] [CrossRef]
- Huan, X.; Yibin, R. Detecting sea ice of Bohai Sea using SAR images based on a hybrid loss U-Net model. Acta Oceanol. Sin. 2021, 43, 157–170. (In Chinese) [Google Scholar]
- Ma, Y.; Cheng, B.; Xu, N.; Yuan, S.; Shi, H.; Shi, W. Long-Term Ice Conditions in Yingkou, a Coastal Region Northeast of the Bohai Sea, between 1951/1952 and 2017/2018: Modeling and Observations. Remote Sens. 2022, 14, 182. [Google Scholar] [CrossRef]
- Drüe, C.; Heinemann, G. High-resolution maps of the sea-ice concentration from MODIS satellite data. Geophys. Res. Lett. 2004, 31, L20403. [Google Scholar] [CrossRef]
- Cavalieri, D.; Markus, T.; Hall, D.; Ivanoff, A.; Glick, E. Assessment of AMSR-E Antarctic winter sea-ice concentrations using Aqua MODIS. IEEE Trans. Geosci. Electron. 2010, 48, 3331–3339. [Google Scholar] [CrossRef]
- Chi, J.; Kim, H.C.; Lee, S.; Crawford, M.M. Deep learning based retrieval algorithm for Arctic sea ice concentration from AMSR2 passive microwave and MODIS optical data. Remote Sens. Environ. 2019, 231, 111204. [Google Scholar] [CrossRef]
- Zhao, X.; Su, H.; Shi, Z.; Pang, X. Intercomparison of multi-sources sea ice concentration data in Antarctic. Geomat. Inf. Sci. Wuhan Univ. 2015, 40, 1460–1466. (In Chinese) [Google Scholar]
- Liu, Y.; Key, J.; Mahoney, R. Sea and freshwater ice concentration from VIIRS on Suomi NPP and the future JPSS satellites. Remote Sens. 2016, 8, 523. [Google Scholar] [CrossRef]
- Shi, K.; Zou, B.; Chen, S.; Xue, C.; Shi, L.; Zhang, T. Remote sensing inversion of sea ice concentration by a middle-resolution imaging spectrometer. J. Remote Sens. 2021, 15, 753–764. (In Chinese) [Google Scholar]
- Zhang, N.; Zhang, Q. Retrieval of the sea ice area from MODIS data by CART decision tree method. Mar. Sci. Bull. 2014, 33, 321–327. (In Chinese) [Google Scholar]
- Liu, Z.; Su, J.; Shi, X.; Zhao, J. Study on the multi-band retrieval algorithm for the Bohai Sea ice concentration using AVHRR data. Acta Oceanol. Sin. 2014, 36, 74–84. (In Chinese) [Google Scholar]
- MODIS Characterization Support Team (MCST). MODIS 1 km Calibrated Radiances Product; NASA MODIS Adaptive Processing System; Goddard Space Flight Center: Greenbelt, MD, USA, 2017. [Google Scholar] [CrossRef]
- Yuan, S.; Gu, W.; Liu, C.; Xie, F. Towards a semi-empirical model of the sea ice thickness based on hyperspectral remote sensing in the Bohai Sea. Acta Oceanol. Sin. 2017, 36, 80–89. [Google Scholar] [CrossRef]
- Yuan, S.; Liu, C.; Liu, X. Practical model of sea ice thickness of Bohai Sea based on MODIS data. Chin. Geogr. Sci. 2018, 28, 863–872. [Google Scholar] [CrossRef] [Green Version]
- Knight, E.; Kvaran, G. Landsat-8 operational land imager design, characterization and performance. Remote Sens. 2014, 6, 10286–10305. [Google Scholar] [CrossRef]
- Qin, Y.; Su, J.; Wang, M. Melt Pond Retrieval Based on the LinearPolar Algorithm Using Landsat Data. Remote Sens. 2021, 13, 4674. [Google Scholar] [CrossRef]
- Ludwig, V.; Spreen, G.; Pedersen, L.T. Evaluation of a New Merged Sea-Ice Concentration Dataset at 1 km Resolution from Thermal Infrared and Passive Microwave Satellite Data in the Arctic. Remote Sens. 2020, 12, 3183. [Google Scholar] [CrossRef]
- Xu, Z.; Hu, S.; Wang, G.; Zhao, J.; Yang, Y.; Cao, W.; Lu, P. A semianalytical algorithm for quantitatively estimating sediment and atmospheric deposition flux from MODIS-derived sea ice albedo in the Bohai Sea, China. J. Geophys. Res. Ocean 2016, 121, 3450–3464. [Google Scholar] [CrossRef]
- Zheng, J.; Ke, C.; Shao, Z. Winter sea ice albedo variations in the Bohai Sea of China. Acta Oceanol. Sin. 2017, 36, 56–63. [Google Scholar] [CrossRef]
- Shi, W.; Yuan, S.; Xu, N.; Chen, W.; Liu, Y.; Liu, X. Analysis of floe velocity characteristics in small-scaled zone in offshore waters in the eastern coast of Liaodong Bay. Cold Reg. Sci. Technol. 2016, 126, 82–89. [Google Scholar] [CrossRef]
Publisher’s Note: MDPI stays neutral with regard to jurisdictional claims in published maps and institutional affiliations. |
© 2022 by the authors. Licensee MDPI, Basel, Switzerland. This article is an open access article distributed under the terms and conditions of the Creative Commons Attribution (CC BY) license (https://creativecommons.org/licenses/by/4.0/).