Article

Surface Deformation Mechanism Analysis in Shanghai Areas Based on TS-InSAR Technology

1
College of Geomatics and Geoinformation, Guilin University of Technology, Guilin 541006, China
2
Beijing Vastitude Technology Co., Ltd., Beijing 100191, China
3
Natural Resources and Real Estate Registration Center of Guangxi Zhuang Autonomous Region, Nanning 530022, China
4
School of Geodesy and Geomatics, Wuhan University, Wuhan 430079, China
*
Author to whom correspondence should be addressed.
Remote Sens. 2022, 14(17), 4368; https://doi.org/10.3390/rs14174368
Submission received: 8 July 2022 / Revised: 24 August 2022 / Accepted: 28 August 2022 / Published: 2 September 2022

Abstract

:
To address the problem that surface deformation causes in urban areas by affecting urban security and threatening human life and property, this study first measured the surface deformation in Shanghai from 2016 to 2020 using the time series InSAR method. Then, the spatial–temporal distribution and evolution characteristics of deformation were investigated in detail. The deformation mechanism is explained by factors including groundwater and rainfall. By introducing the seasonal changes of tides and sediment accumulation, the reason for the uplift in the Shanghai area is further explained. Finally, the surface deformation of the reclamation area is detected further. Meanwhile, the spatial–temporal variation characteristics of the surface in the reclamation area are explored. Through time series InSAR technology, the results of surface deformation in Shanghai demonstrate the following: (1) The deformation in the study area is uneven in time, and the subsidence is especially apparent during the 2016–2017 period. The maximum cumulative subsidence amounts to −131.1 mm, and the PS points with subsidence rates greater than −5 mm/y occupy 41.36% of all the subsidence points. In addition, PS points with uplift rates greater than 5 mm/y account for 39.55% of all the uplift points. The overall spatial distribution in the Shanghai area is characterized by the uplift in the north and subsidence in the south, whereas the cumulative subsidence in the time series presents a slowing trend; (2) Surface subsidence and groundwater, rainfall, and urban development in the Shanghai area are correlated. Seasonal changes in tides contribute to surface uplift in coastal areas. Coastal sediment accumulation and soil changes also make direct contributions to the occurrence of surface uplift; (3) The deformation of the reclamation area and the completion time are correlated, and the subsidence points of the reclamation area are mainly concentrated on the surrounding dikes from 2016 to 2020. The cumulative subsidence of the two years from 2016 to 2017 is up to −102.2 mm. The results of this study systematically explore the spatial–-temporal evolution and causes of surface deformation in Shanghai, providing scientific data which can support the development of Shanghai.

1. Introduction

Recently, surface deformation in urban areas has become a major geological hazard, influencing urban safety and threatening human lives. It is mainly affected by groundwater, urban development, and other factors that can directly lead to accidents which threaten human security, including surface collapse [1,2,3]. According to the published data, 285 ground collapses occurred in China in 2021 [4]. Urban areas have complex feature types and large populations. Traditional deformation monitoring methods (e.g., GNSS, leveling) have low spatial–temporal resolution and are time-consuming and laborious, thereby seriously influencing the monitoring efficiency [5,6,7].
With the commissioning of microwave remote sensing satellites globally, interferometric synthetic aperture radar (InSAR) has been extensively applied in surface monitoring. The early InSAR technology was mainly applied to the creation of digital elevation models (DEM) of the ground surface. Subsequently, the concept of differential interferometry for synthetic aperture radar (DInSAR) was proposed. The DInSAR technique employs SAR images that cover the same area across two different time periods for differential interference processing to obtain the surface deformation throughout the study time [8,9]. When compared with traditional deformation monitoring technologies, DInSAR has the advantages of being an all day, all weather, and non-contact measurement system [10,11]. Nevertheless, this technique can be susceptible to spatial and temporal decorrelation and atmospheric delays, and the monitoring accuracy is often limited to the centimeter level, with large errors in monitoring small surface deformations over long time series [12]. As such, the concept of time series InSAR was proposed. This technique uses differential interference processing of multi-scene SAR images covering the same area within a long time series. It is also capable of obtaining small deformations within a long time series of the study area. Meanwhile, the time series InSAR significantly overcomes the effect of temporal decorrelation in DInSAR, which lowers the impact of atmospheric delays and has, as such, become one of the main methods of surface deformation monitoring at present [13,14,15,16].
Shanghai is a typical soft soil geological area and has been in a state of reclamation in recent years. Numerous scholars have investigated the deformation of the Shanghai area. Perissin et al. [17] adopted the time series InSAR technique for detecting ground deformation in the Shanghai area, exhibiting the feasibility of InSAR technology for deformation monitoring in urban areas, such as subways and roads. Zhang et al. [18] applied the SBAS-InSAR technique to extract the average subsidence rate field in the Shanghai area during the 2007–2010 period and compared it with the leveling data, thereby confirming the existence of an obvious subsidence funnel in the Shanghai area. Wang et al. [19] employed the PS-InSAR technique to monitor the deformation of elevated roads in the Shanghai area and compared it with the leveling data of the same period, and the maximum error did not exceed 3 mm/y, which verified the feasibility of the PS-InSAR technique in deformation monitoring. Yang et al. [20] used SBAS-InSAR technology to gather the subsidence information of reclamation areas in Shanghai using SAR image data of three different bands. These data were then compared and analyzed with the leveling data, which summarized the characteristics of subsidence law in the New Lingang District, also verifying the feasibility of SBAS-InSAR technology for micro-deformation detection. Other studies used InSAR technology to measure the settlement of infrastructure, such as viaducts, subways, and buildings in Shanghai, mainly using X-band SAR images. Previous studies have demonstrated that the surface of Shanghai has been in a changing state, and the phenomenon of uneven settlement is more obvious.
At present, studies associated with surface subsidence in Shanghai are relatively old and also lack timeliness. With the development of the Shanghai area, the deformation mechanism may also have changed, resulting in vague explanations of the current deformation mechanism. Many scholars have investigated the surface subsidence phenomenon in Shanghai and explained the mechanism in more detail, while the surface uplift information has been selectively ignored. Therefore, explanations for the surface uplift phenomenon in Shanghai are relatively few.
In this study, using the time series InSAR technique, the deformation rate fields in some areas in Shanghai during a long time series from 2016 to 2020 are obtained. Meanwhile, the mechanisms that cause surface uplift and subsidence phenomena in the Shanghai are discussed separately. The cumulative deformation field of the Shanghai reclamation area is further extracted for analysis. Moreover, it provides scientific data to support the prevention and control of surface hazards in the Shanghai area.

2. Study Area and Data

2.1. Study Area

Shanghai (120°52′ to 122°12′E, 30°40′ to 31°53′N) is located at the mouth of the Yangtze River. It is bordered by the East China Sea to the east, with an average elevation of approximately 4 m, and a relatively flat terrain. The soil porosity is large, and water content is high. Influenced by the overexploitation of groundwater and the construction of high-rise buildings and underground facilities, surface deformation occurs from time to time.
Shanghai has a subtropical monsoon climate with typical rainy weather. Significant rainfall occurs every summer and in early autumn. The seasonality of rainfall in the region is evident. The characteristics of the soft land in the Shanghai area, combined with the seasonal changes in rainfall, mean that regional deformation is also considered to be a seasonal change.
Underground excavation and land reclamation have been carried out in the Shanghai area due to the rapid economic development and urban expansion. Figure 1a shows the spatial distribution of the Shanghai area and the reclaimed land area in Shanghai after 1980. New Lingang City (NLC) is the location of the extensive reclamation area in Shanghai, where infrastructure was built after reclamation and the economy developed vigorously. At the early stage of reclamation, the surface of the reclaimed area is often affected by natural consolidation and changes in water content, and significant subsidence occurs over this period. Therefore, it is particularly vital to monitor the deformation of the reclaimed area.
In 2006, the Shanghai government proposed groundwater recharge, rational planning, strength monitoring, and other measures to avoid and lower the loss caused by land subsidence. Since 2013, Shanghai has implemented several policies to mitigate the occurrence of surface subsidence. Among them, the “Regulations of Shanghai Municipality on the prevention and control of land subsidence” have been implemented to limit the occurrence of subsidence from foundation pits, groundwater wells, groundwater recharge, etc. After a long period of settlement control and rectification, the settlement phenomenon in the Shanghai area has been alleviated to a certain extent. However, the surface subsidence problem caused by underground excavation, the natural consolidation of the reclamation area, and the increase in urban population still pose great challenges to the settlement control work in Shanghai.

2.2. Data

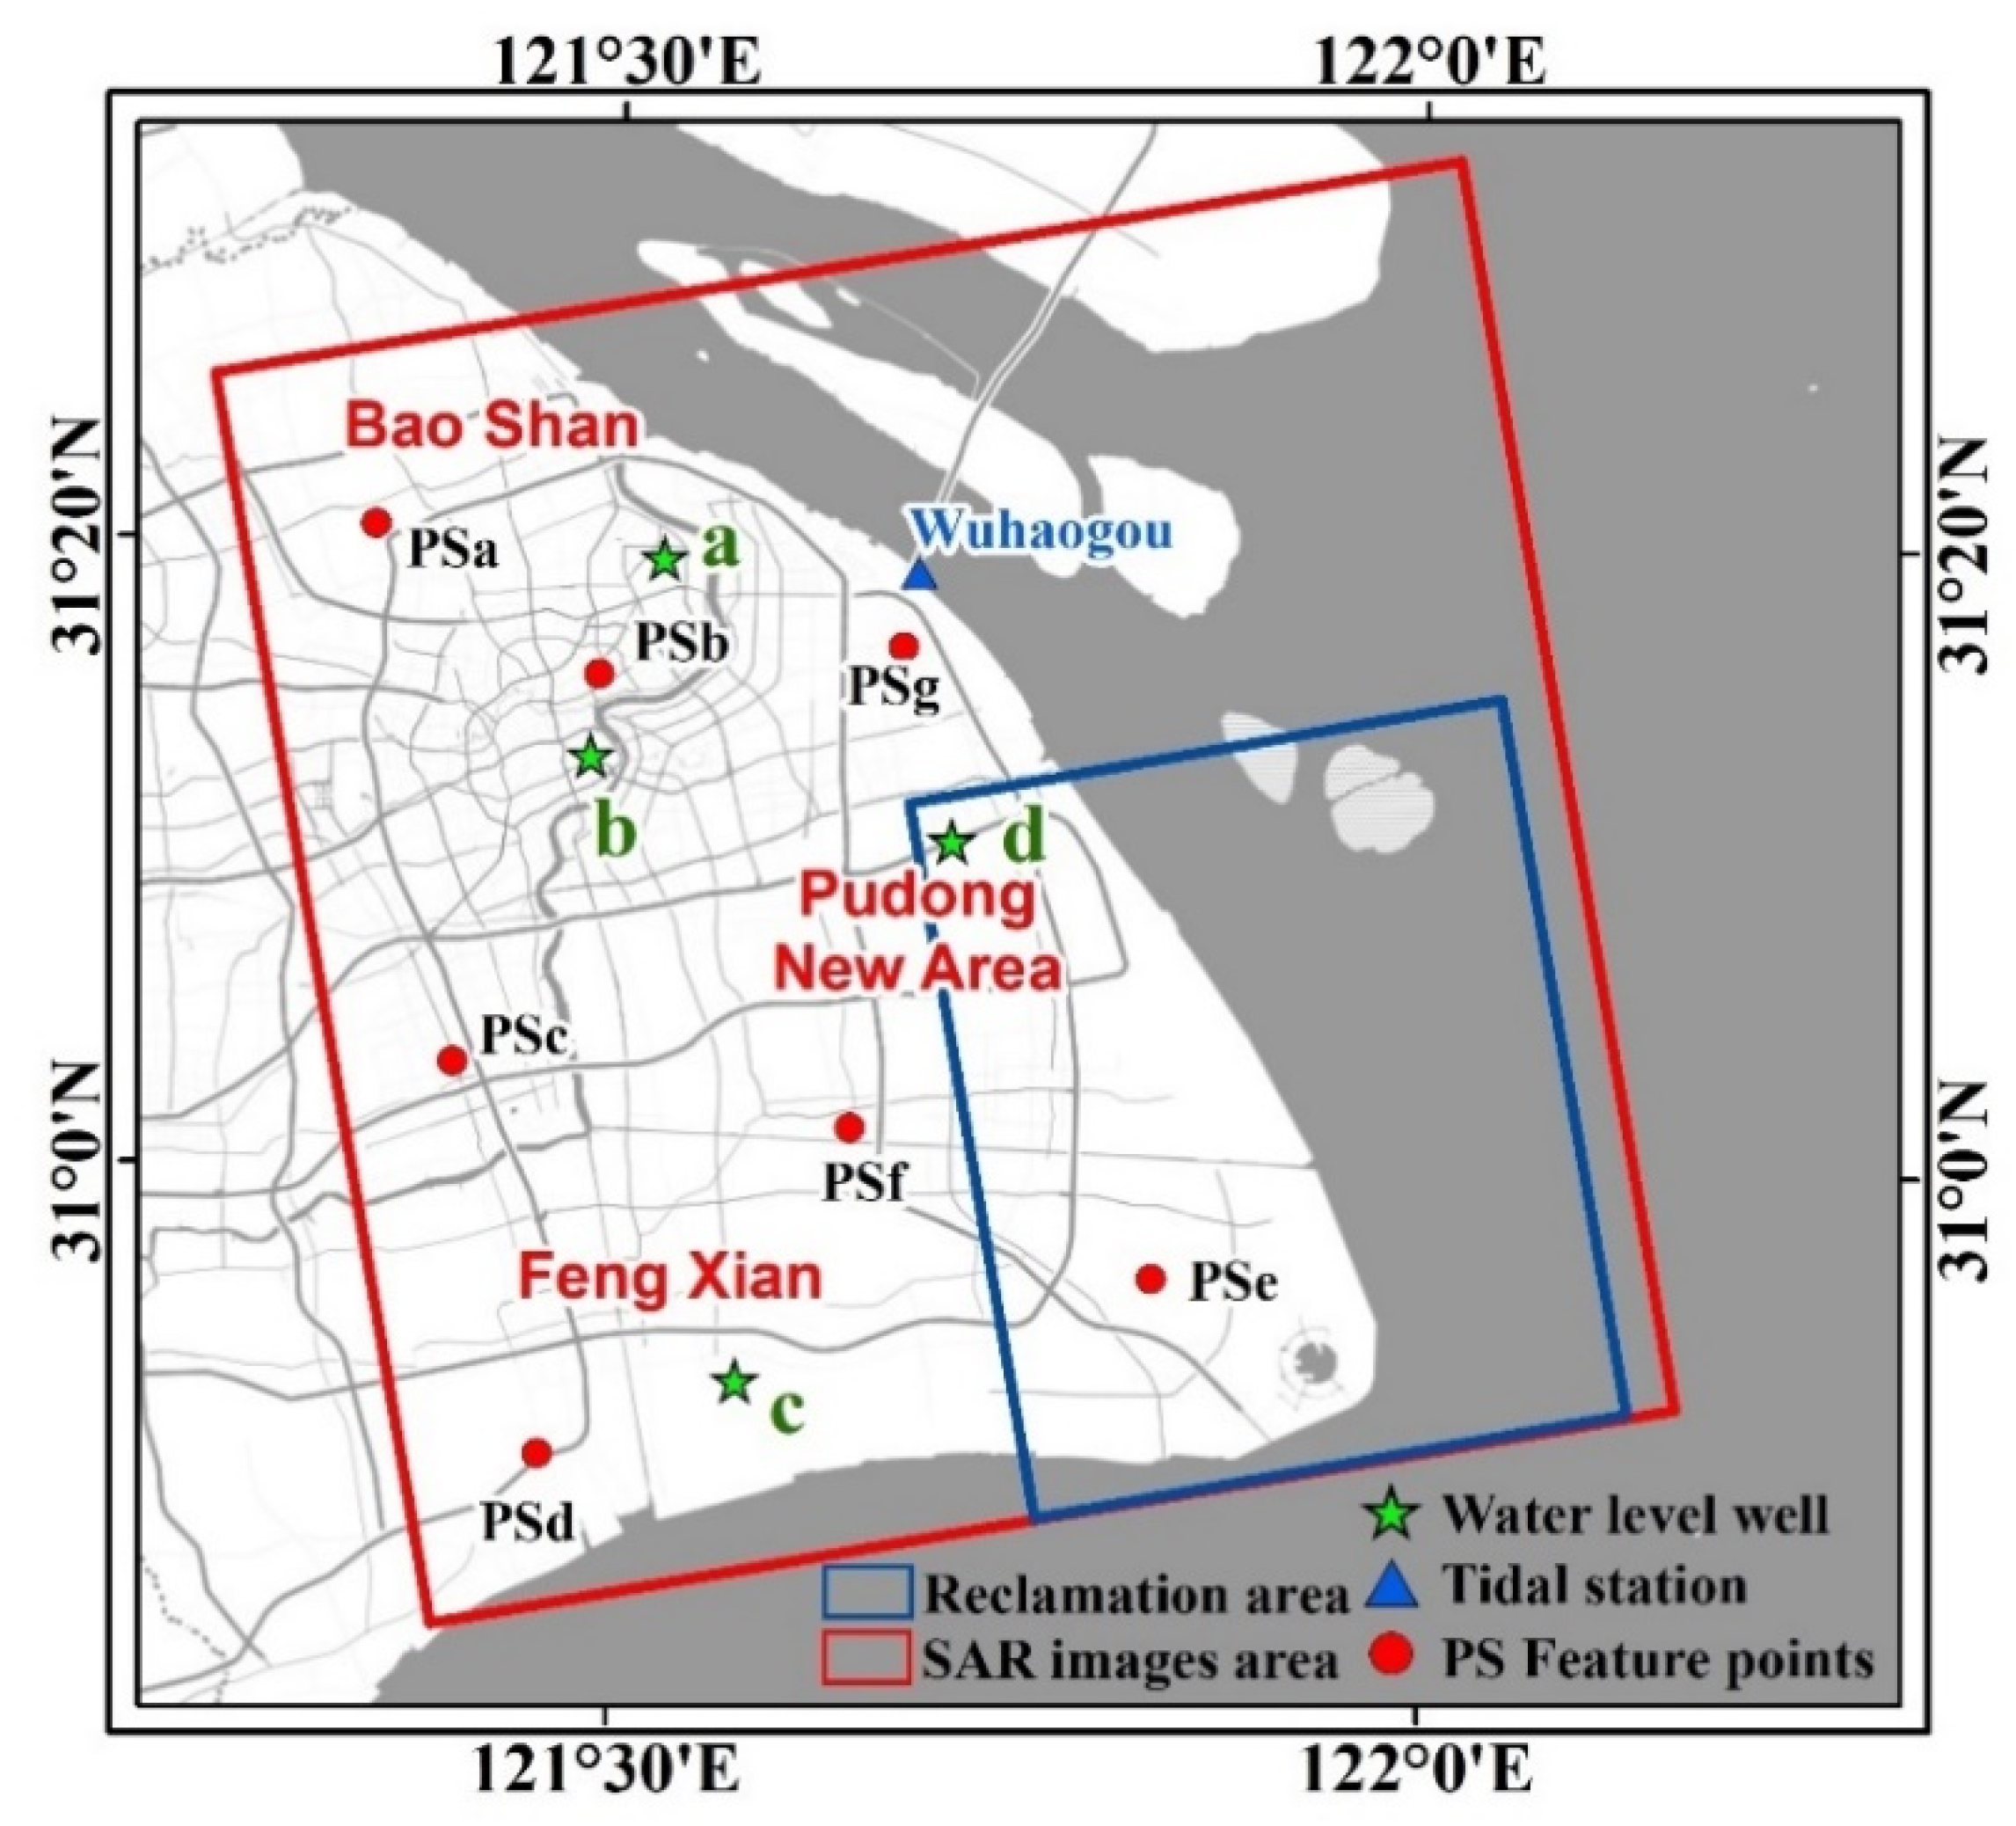
Sentinel-1A is an Earth observation satellite under the European Space Agency’s Copernicus program. It carries C-band synthetic aperture radar (SAR) and provides continuous SAR imagery. The revisiting period of the satellite is 12 days, and it can continuously and effectively monitor the micro-subsidence of urban land. In this study, 61 scenes of ascending orbit Sentinel-1A TOPS SAR images covering the Shanghai area from May 2016 to December 2020 were selected to detect the temporal variation of the average subsidence rate and cumulative deformation. Detailed parameters of SAR images are shown in Table 1. Figure 1b presents the SAR image coverage area. The ALOS World 3D-30 m (AW3D30) released by JAXA is employed as an external digital elevation model (DEM) to remove the phase caused by terrain undulations. The precise orbit determination (POD) data published by the European Space Agency were adopted for orbit refinement and phase re-flattening. Rainfall data were provided by the National Meteorological Science Data Center of China. Groundwater level data were provided by the Shanghai Geological Data Information Sharing Platform. Nighttime light remote sensing was taken from the NPP VIIRS annual synthetic product data, and tidal data were obtained from the maritime data published by the China Maritime Administration. The above data are used to discuss and explore the mechanism of subsidence occurrence in the Shanghai area. The data distribution is shown in Figure 2.

3. Methods

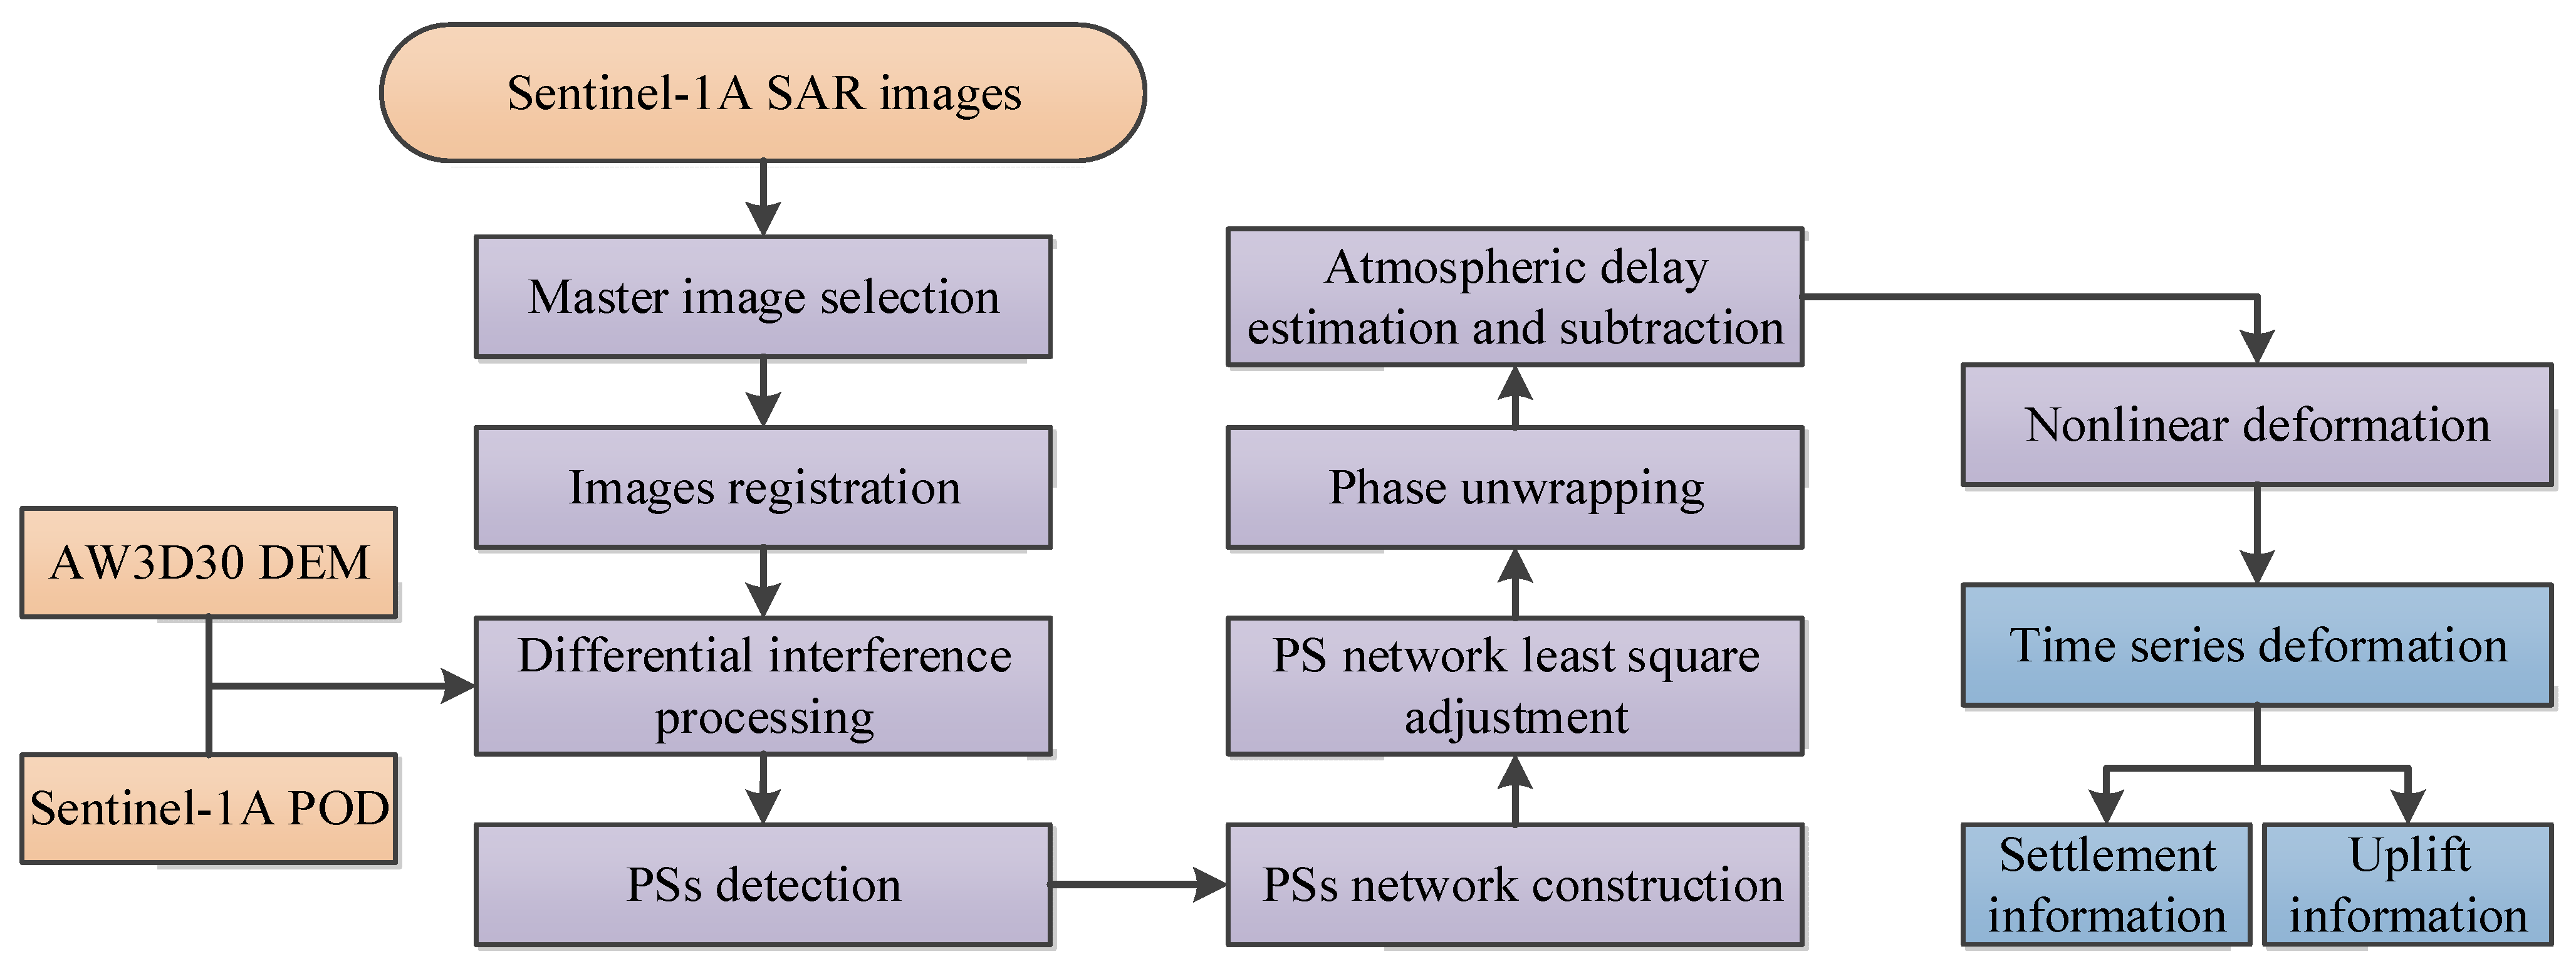
Multi-temporal InSAR technology uses the feature in which high correlation PS points are maintained on the SAR image of the internal time series of long time series to perform differential interference processing. Afterwards, the network adjustment and calculation are performed in order to eliminate multiple phases and errors. After phase unwrapping, the deformation field in the study area is obtained because the number of SAR images used in this paper is high, the coverage range of the study area is wide, and the amount of data calculation is large. To avoid decorrelation, the load of data processing and error transmission is reduced. Meanwhile, 61 SAR images in the Shanghai area are grouped. Among them, 25 SAR images were from May 2016 to December 2017. A group of 36 SAR images were obtained from January 2018 to December 2020. The flow chart of the research method is displayed in Figure 3, and the specific data processing process is presented as follows [21,22,23]:
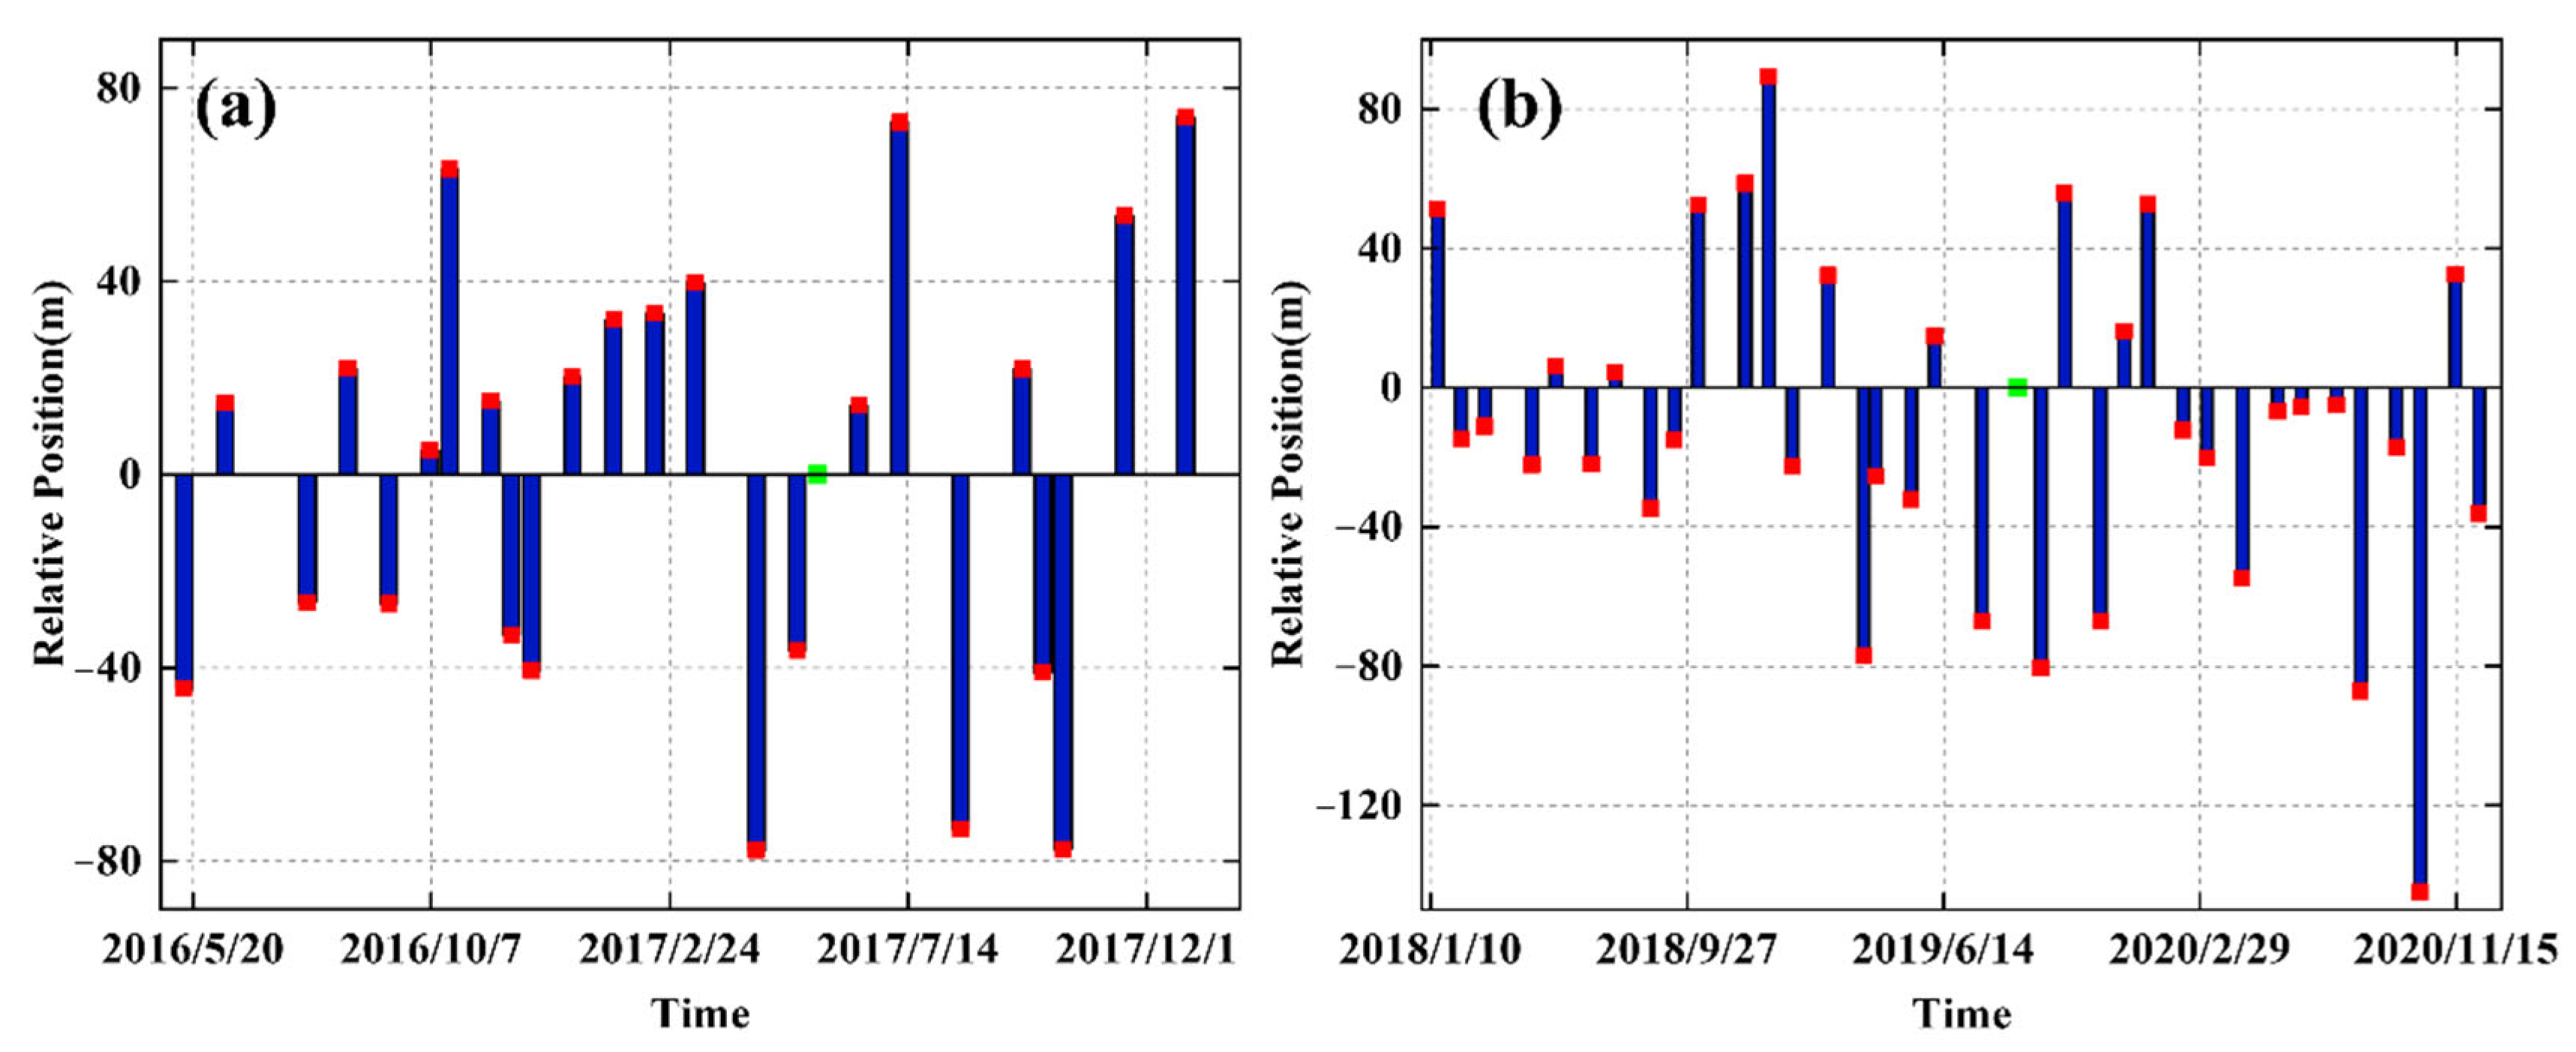
(1) The SAR image set is arranged in chronological order. According to the time span and spatial baseline length of the study period, this study selected 22 May 2017 and 28 August 2019 as the primary image of the two workflows. Based on the imaging time and imaging position of the primary image, the relative spatial–temporal baselines of other secondary images are calculated. To ensure the reliability of data processing, the spatial baseline is limited to less than 200 m. Meanwhile, the secondary images with spatial baselines greater than 200 m are eliminated. The workflow relative to the spatial and temporal baseline is presented in Figure 4.
(2) To ensure the accuracy of differential interference between primary image and secondary images, sub-pixel registration accuracy of the secondary images to the primary image is realized by coarse registration, fine registration, and a resampling operation. The master and secondary images after registration were processed by differential interferometry after registration. The combination of differential interferograms in this study contains 24 and 35 pairs of differential interferograms. In the original interferogram obtained by interference processing, the initial interference phase on each resolution cell is the sum of multiple components, including the following phases:
ϕ = ϕ r e f + ϕ t o p o + ϕ d e f + ϕ a t m + ϕ n o i s e
where ϕ denotes the interferometric phase generated by the interferometric pair, ϕ r e f is the phase caused by the reference ellipsoid, ϕ t o p o corresponds to the terrain phase caused by the ground fluctuation, ϕ d e f represents the deformation phase resulting from the surface displacement between the two imaging times, ϕ a t m is the difference in atmospheric delay phase during the two radar images, and ϕ n o i s e denotes the noise phase. Here, ϕ r e f can be removed using the satellite precise orbit state data according to the interference geometry relationship, and the terrain phase ϕ t o p o can be removed based on the precise orbit state data and the existing digital elevation model [24,25].
(3) In this paper, the amplitude deviation index method was employed to identify PS points. This method employs the temporal amplitude information to measure the signal-to-noise ratio of pixels and applies the temporal amplitude characteristics to replace the phase noise level. The method is shown as follows:
D A = σ i μ i ,
where D A corresponds to amplitude dispersion, σ i is the standard deviation of amplitude time series, and μ i represents the mean of amplitude time series. When the deviation index is less than the threshold, the resolved pixel is determined as the PS point.
(4) By adopting the free connection network method, an irregular triangular network is established for PS points. Theoretically, the free network connection network is more stable than the traditional triangulated irregular network (TIN) network. Due to the calculation error of the irregular triangular network in the solution, the sum of the deformation rate difference and the elevation correction difference is not 0. To make the baseline parameters of PS network global rational, the regional network least square method can be used to eliminate the geometric contradiction of baseline observation. At the same time, the linear subsidence rate of each PS can be calculated.
(5) After the processing of the above steps, the phase information left in the interference phase is called the residual phase. The residual phase φ i res can be further decomposed into nonlinear deformation phase φ i nl   , atmospheric phase φ i a , and decorrelation noise φ i n , as in the following [26]:
φ i res   = φ i nl   + φ i a + φ i n .
Atmospheric and nonlinear deformation signals show strong spatial autocorrelation in a short space range and belong to low-frequency signals in the space domain. The noise in the interference phase is mainly decorrelation noise. The high-frequency signal in the residual phase is random in time and space. Atmospheric delay and decorrelating noise are not correlated with time, revealing high-frequency characteristics, whereas nonlinear deformation has a strong correlation with time, exhibiting low-frequency characteristics. Therefore, the temporal residual phase of PS timing points is filtered by a high-pass filter in time to obtain the sum of the atmospheric phase and decorrelation noise phase in the interference phase. The atmospheric phase, decorrelation noise, and nonlinear deformation phase of PS points in each interferogram can be separated by low-pass filtering in space. In the current experiment, the atmosphere high period is 365 days, with the atmosphere low period being 1200 m.
(6) By adding the nonlinear deformation rate vector to the linear deformation rate vector, the surface deformation rate in Shanghai during the study period can be acquired.
Figure 3. Flow chart of surface deformation information obtained by time series InSAR technology.
Remotesensing 14 04368 g003
Figure 4. Time-position of Sentinel-1A images. (a) The SAR images from May 2016 to December 2017; (b) SAR images from January 2018 to December 2020. Red and green square represent primary image and secondary images, respectively.
Remotesensing 14 04368 g004

4. Results

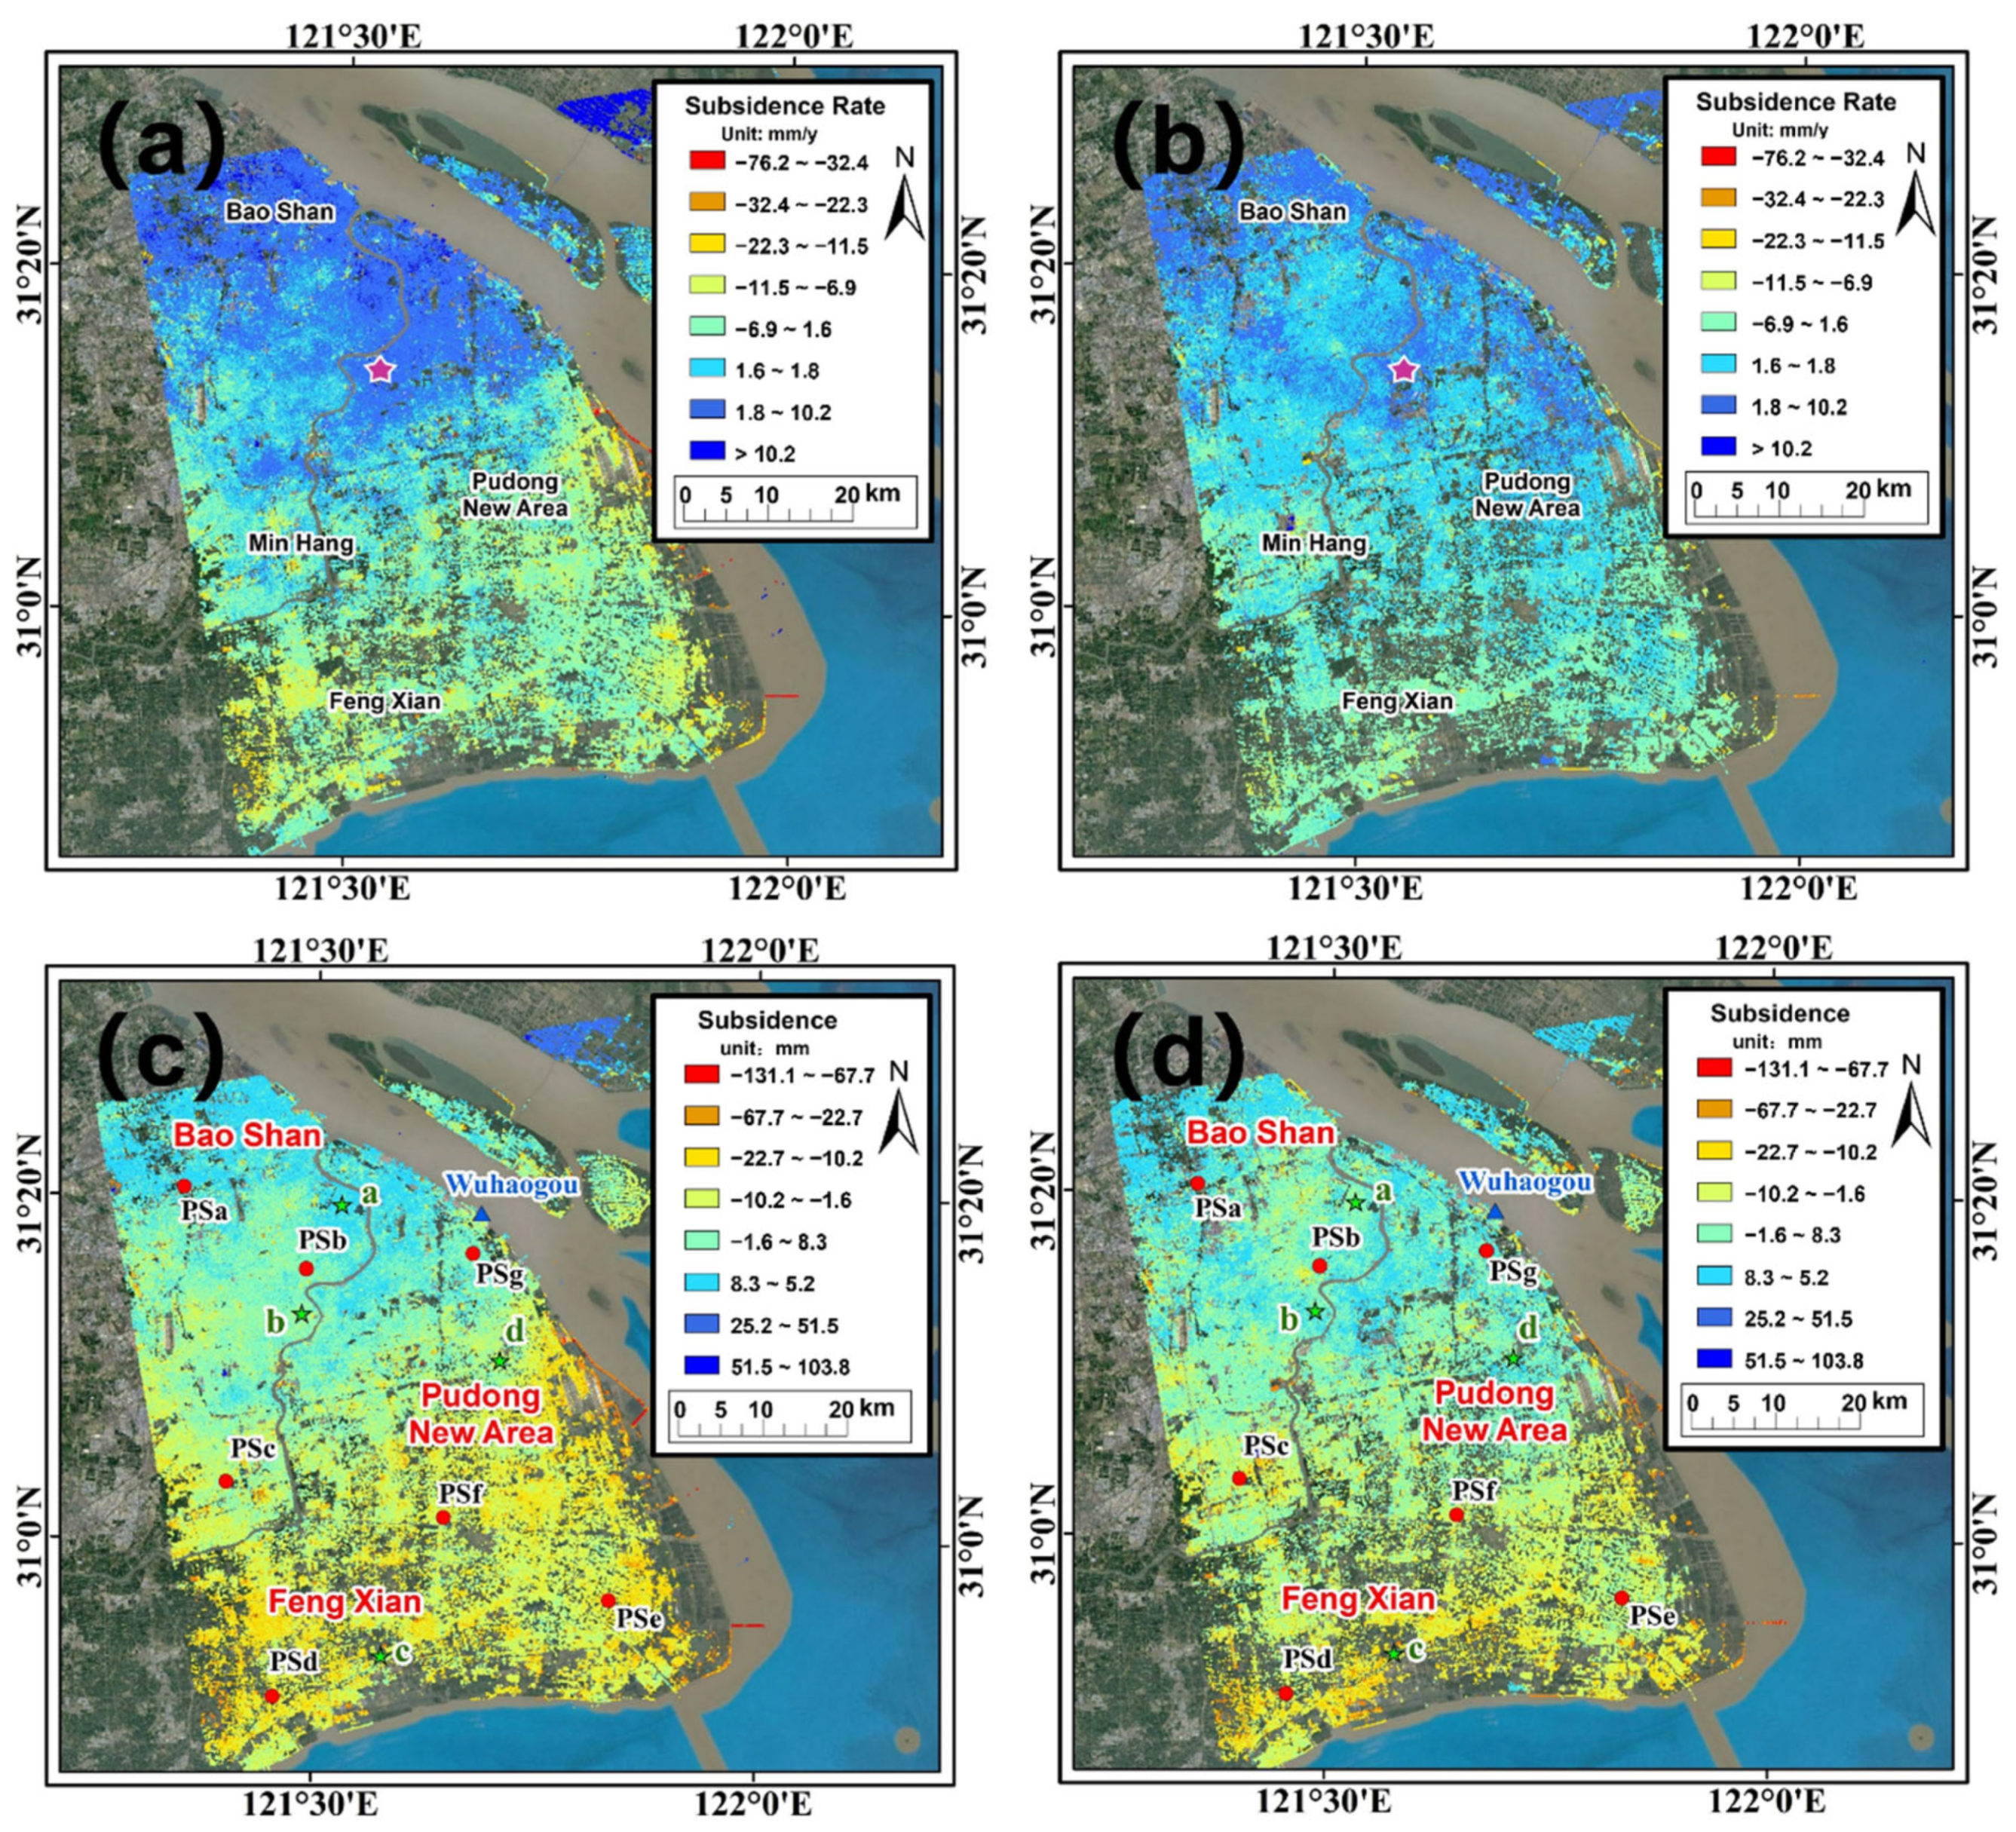
May 2016 to December 2017 is a group of 25 scenes of SAR images. Figure 5a,c show the subsidence rate map and cumulative subsidence, respectively. January 2018 to December 2020 is a group of 36 scenes of SAR images. Figure 5b,d reveal the subsidence rate map and cumulative subsidence, respectively. In order to ensure the reliability of the data, the same reference point was selected in this experiment. The purple pentagram is the reference point. The land subsidence results in Shanghai from 2016 to 2020 were obtained for this time. To study the subsidence situation in Shanghai in the early stage, we summarized the previous research results of land subsidence monitoring in Shanghai, as shown in Table 2.
The results obtained by time series InSAR demonstrate that the spatial distribution of subsidence in Shanghai shows an uneven subsidence phenomenon of “south-sinking and north-lifting”. In the northern part of Shanghai, the Baoshan District, Jing’an District, and other old urban areas of Shanghai show a small uplift or stabilization, with annual subsidence rates ranging from −0.5 mm/y to 10.6 mm/y. In the southern part, New Pudong District and Fengxian District present a more obvious widespread subsidence phenomenon, with a maximum subsidence rate of −76.2 mm/y. During the period from April 2016 to December 2020, the subsidence phenomenon in Shanghai shows a decreasing trend in Figure 5a,b, where the subsidence rate is located above −6.9 mm/y in most areas in the southern part of the Shanghai area in 2016–2017. By contrast, Figure 5b reveals that the subsidence rate in the southern region decreases significantly from 2018 to 2020, with most of the regions having a subsidence rate of −4.6 to −6.9 mm/y, and that the annual subsidence rate decreases significantly. Comparing these results with Figure 5c,d, the key subsidence areas in the Shanghai region did not change significantly during the period from 2016 to 2020, with subsidence being mainly concentrated in the Fengxian District in the south and in some areas of the New Pudong District in the east. In addition, the key areas showed an obvious subsidence funnel phenomenon. The New Pudong District in the east has been experiencing more obvious subsidence phenomena, which will be explored in the subsequent sections.

4.1. Internal Precision Analysis of Surface Deformation Results

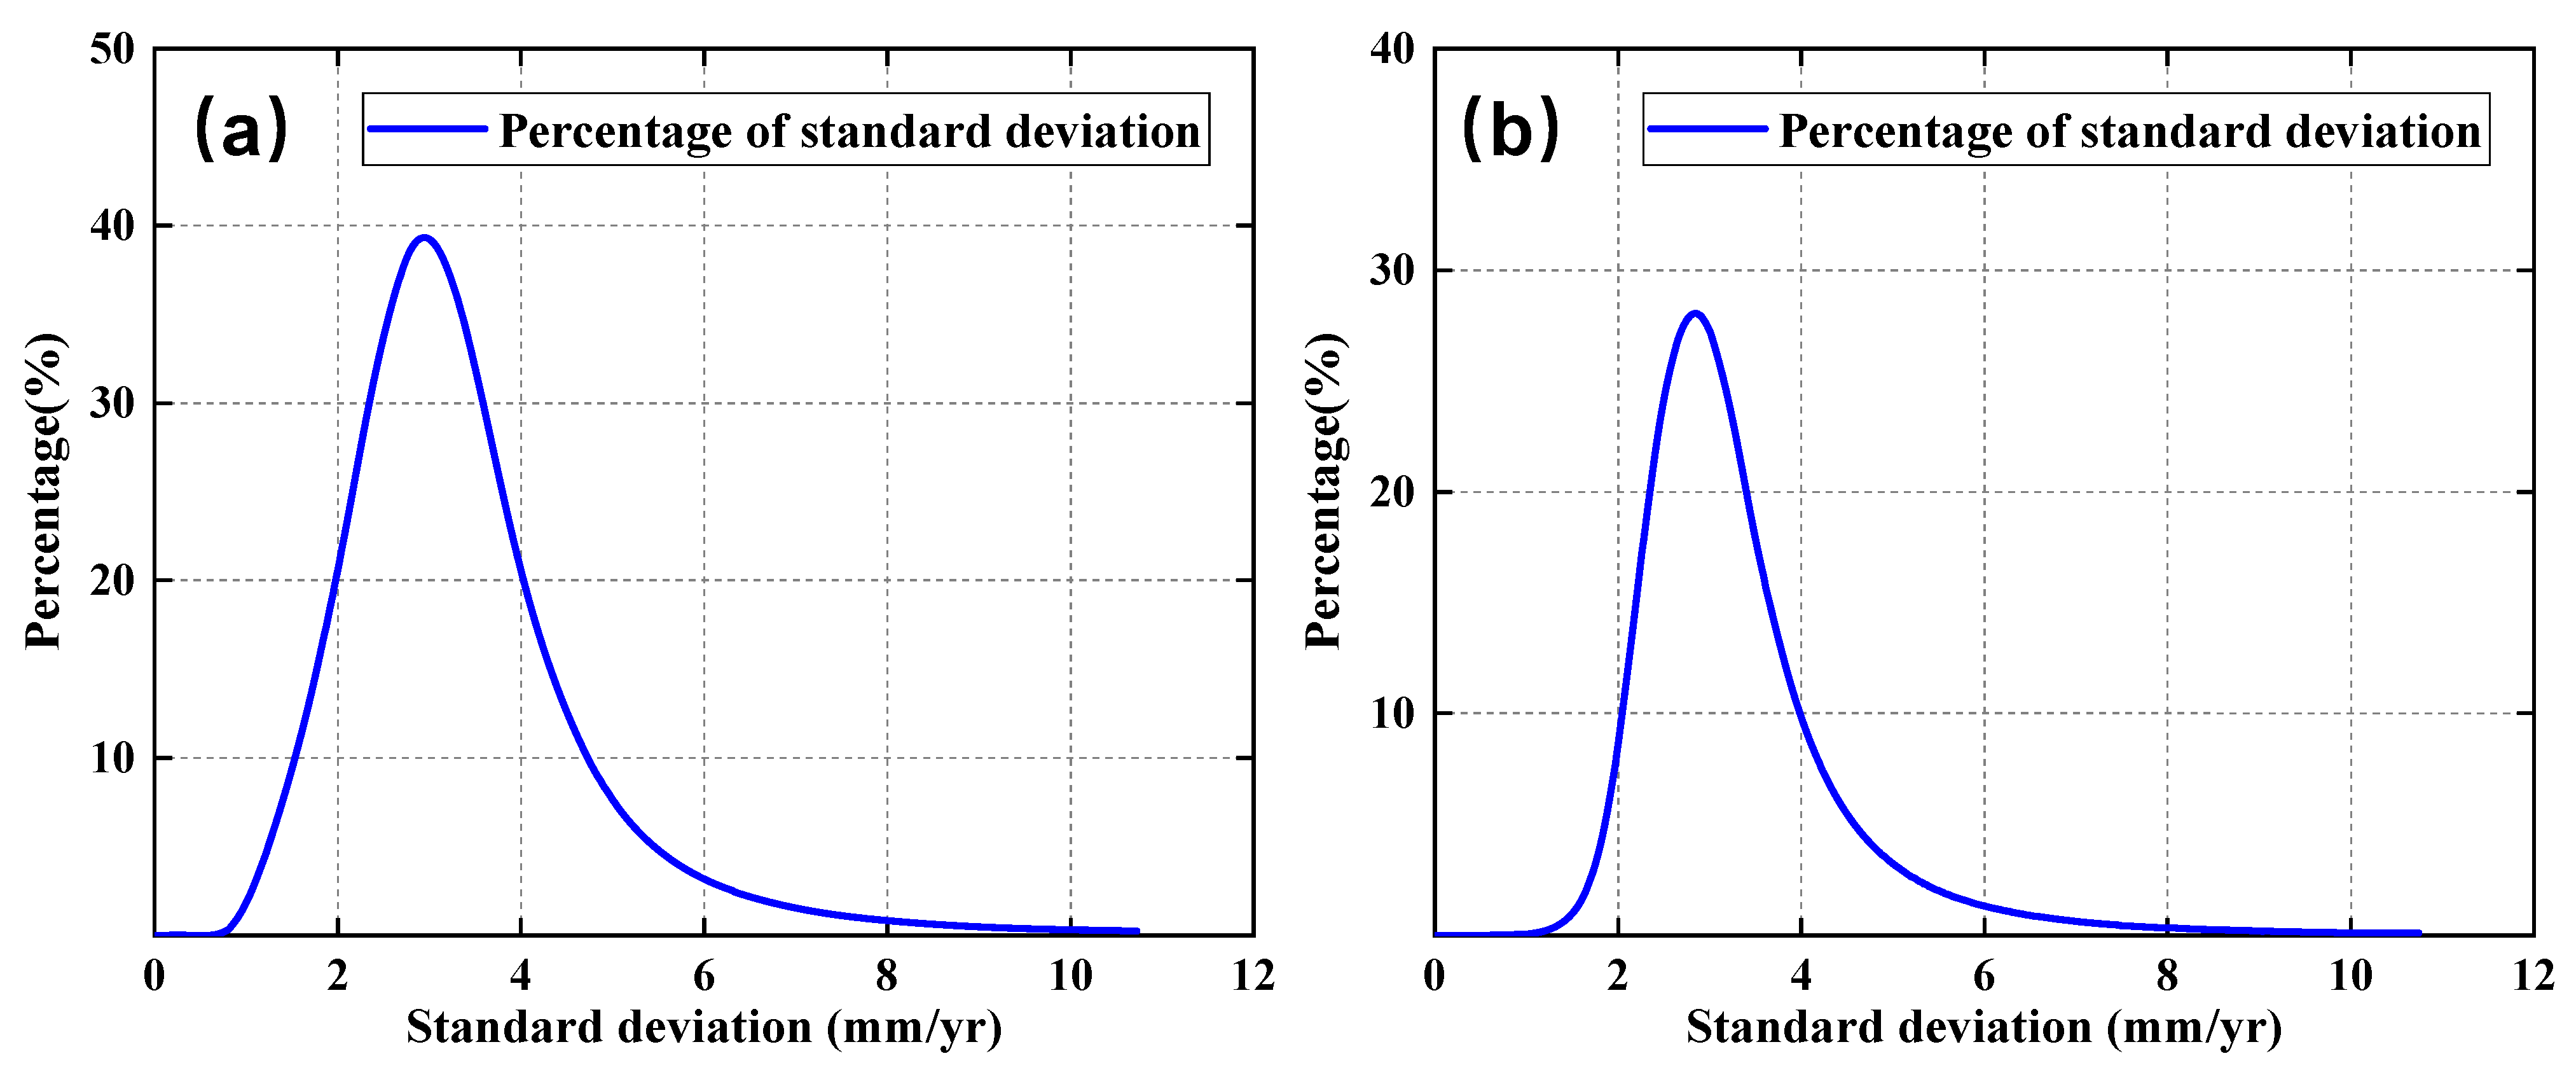
The statistical results are illustrated in Figure 6. The time span of the two processes and the number of images is different. As a result, the number of detected PS points vary significantly. According to the statistics, 3,291,793 PS points were detected in the treatment stream from May 2016 to December 2017. Furthermore, 93.3% of the PS points had a standard deviation of less than 5 mm/y, and the maximum standard deviation of the target points was 10.72 mm/y. In total, 1,993,016 PS points were detected in the treatment stream from January 2018 to December 2020. In addition, 94.2% of the PS points had a standard deviation of less than 5 mm/y, and the maximum standard deviation of the target points was 11.76 mm/y.
The above analysis demonstrates that the inversion results of surface deformation in the Shanghai area based on Sentinel-1A TOPS data using the time series InSAR technique have high reliability and precision.

4.2. Analysis of Surface Deformation Feature Points in Shanghai Area

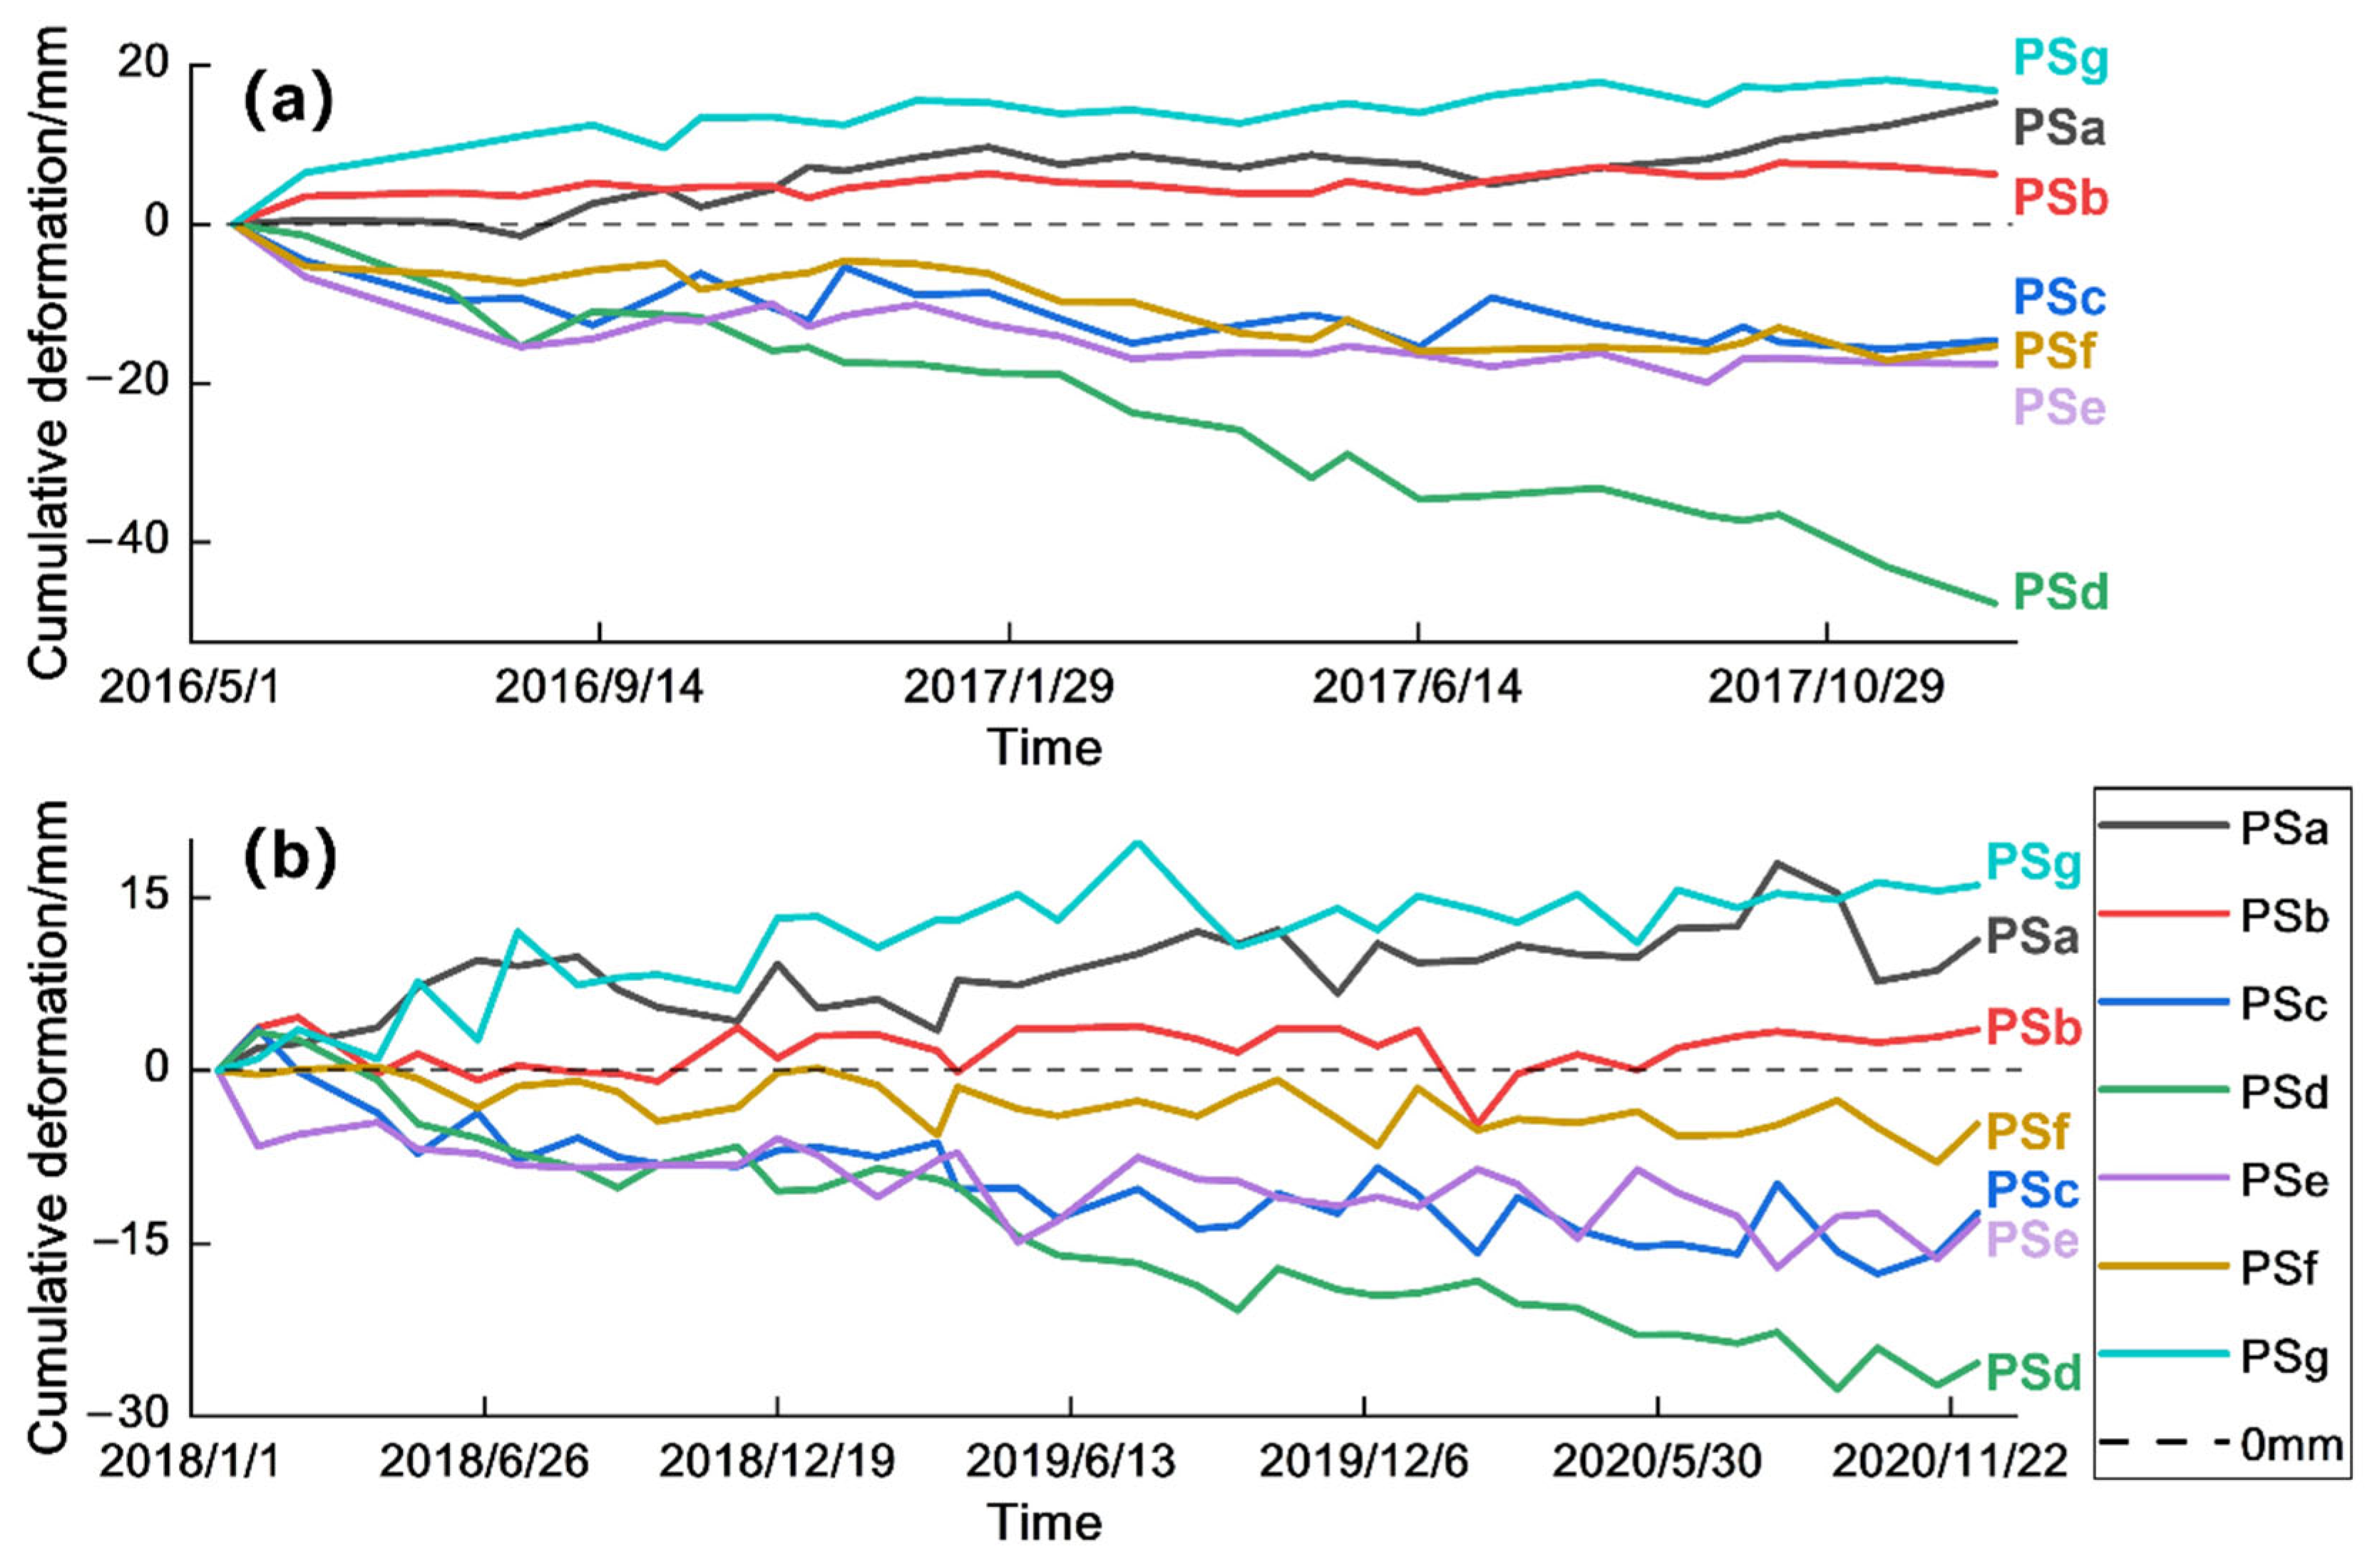
To better investigate the spatial distribution characteristics and time series variation of subsidence in Shanghai, seven characteristic points in Shanghai were selected for analysis and discussion in the current section. The average value of the cumulative subsidence of PS points within 400 m around the characteristic points was selected for specific analysis in this chapter to further confirm the inhomogeneity of subsidence in the Shanghai area. The time series variation of the characteristic points is shown in Figure 7.
Feature point A is located near Gucun Park in Baoshan District in the northeastern part of the Shanghai region. During the study period, the area presents the uplift. However, during the period from June 2018 to December 2020, ground subsidence is observed in the area, which is related to the construction of Metro Line 15 in the area. From June 2018 to December 2020, the area still generally shows a surface uplift trend, suggesting that the construction of Metro Line 15 exerts a minimal impact on the surface deformation of the area on a large scale [7]. Feature point B is located near Ruihong New Town in the Hongkou District, which is an old urban area of Shanghai. Figure 7 presents that the average cumulative subsidence at this site in both time periods was between ±7 mm, with no major deformation occurring. Feature point C is situated near Yinqiao Garden in the Minhang District, Shanghai, where the ground surface has been subsiding during the two study periods. Feature point D is located near the village of Mailou in the Fengxian District. Several large factories are located at this site, and the surface has been showing a subsidence trend during the study period. The amount of subsidence is large. Feature point E is located near Dingjiazhai in New Pudong District, and Figure 6 illustrates that the surface of the site presents a subsidence trend. Feature point F is located near Xinchang Town, in the New Pudong District, where the surface shows subsidence during the study period. Meanwhile, the subsidence trend has slowed down. Feature point G is in the community of Jindianyuan, in the New Pudong District, where the surface shows a continuous uplifting trend.
In general, the surface deformation trends in different regions of Shanghai are obvious, but still interspersed with nonlinear deformation, showing jagged lines in the mean cumulative deformation variogram. The above results prove that the surface deformation in Shanghai is influenced by numerous different factors, which will be discussed in Section 5.

4.3. Time Series Change of Deformation Rate in Shanghai from 2016 to 2020

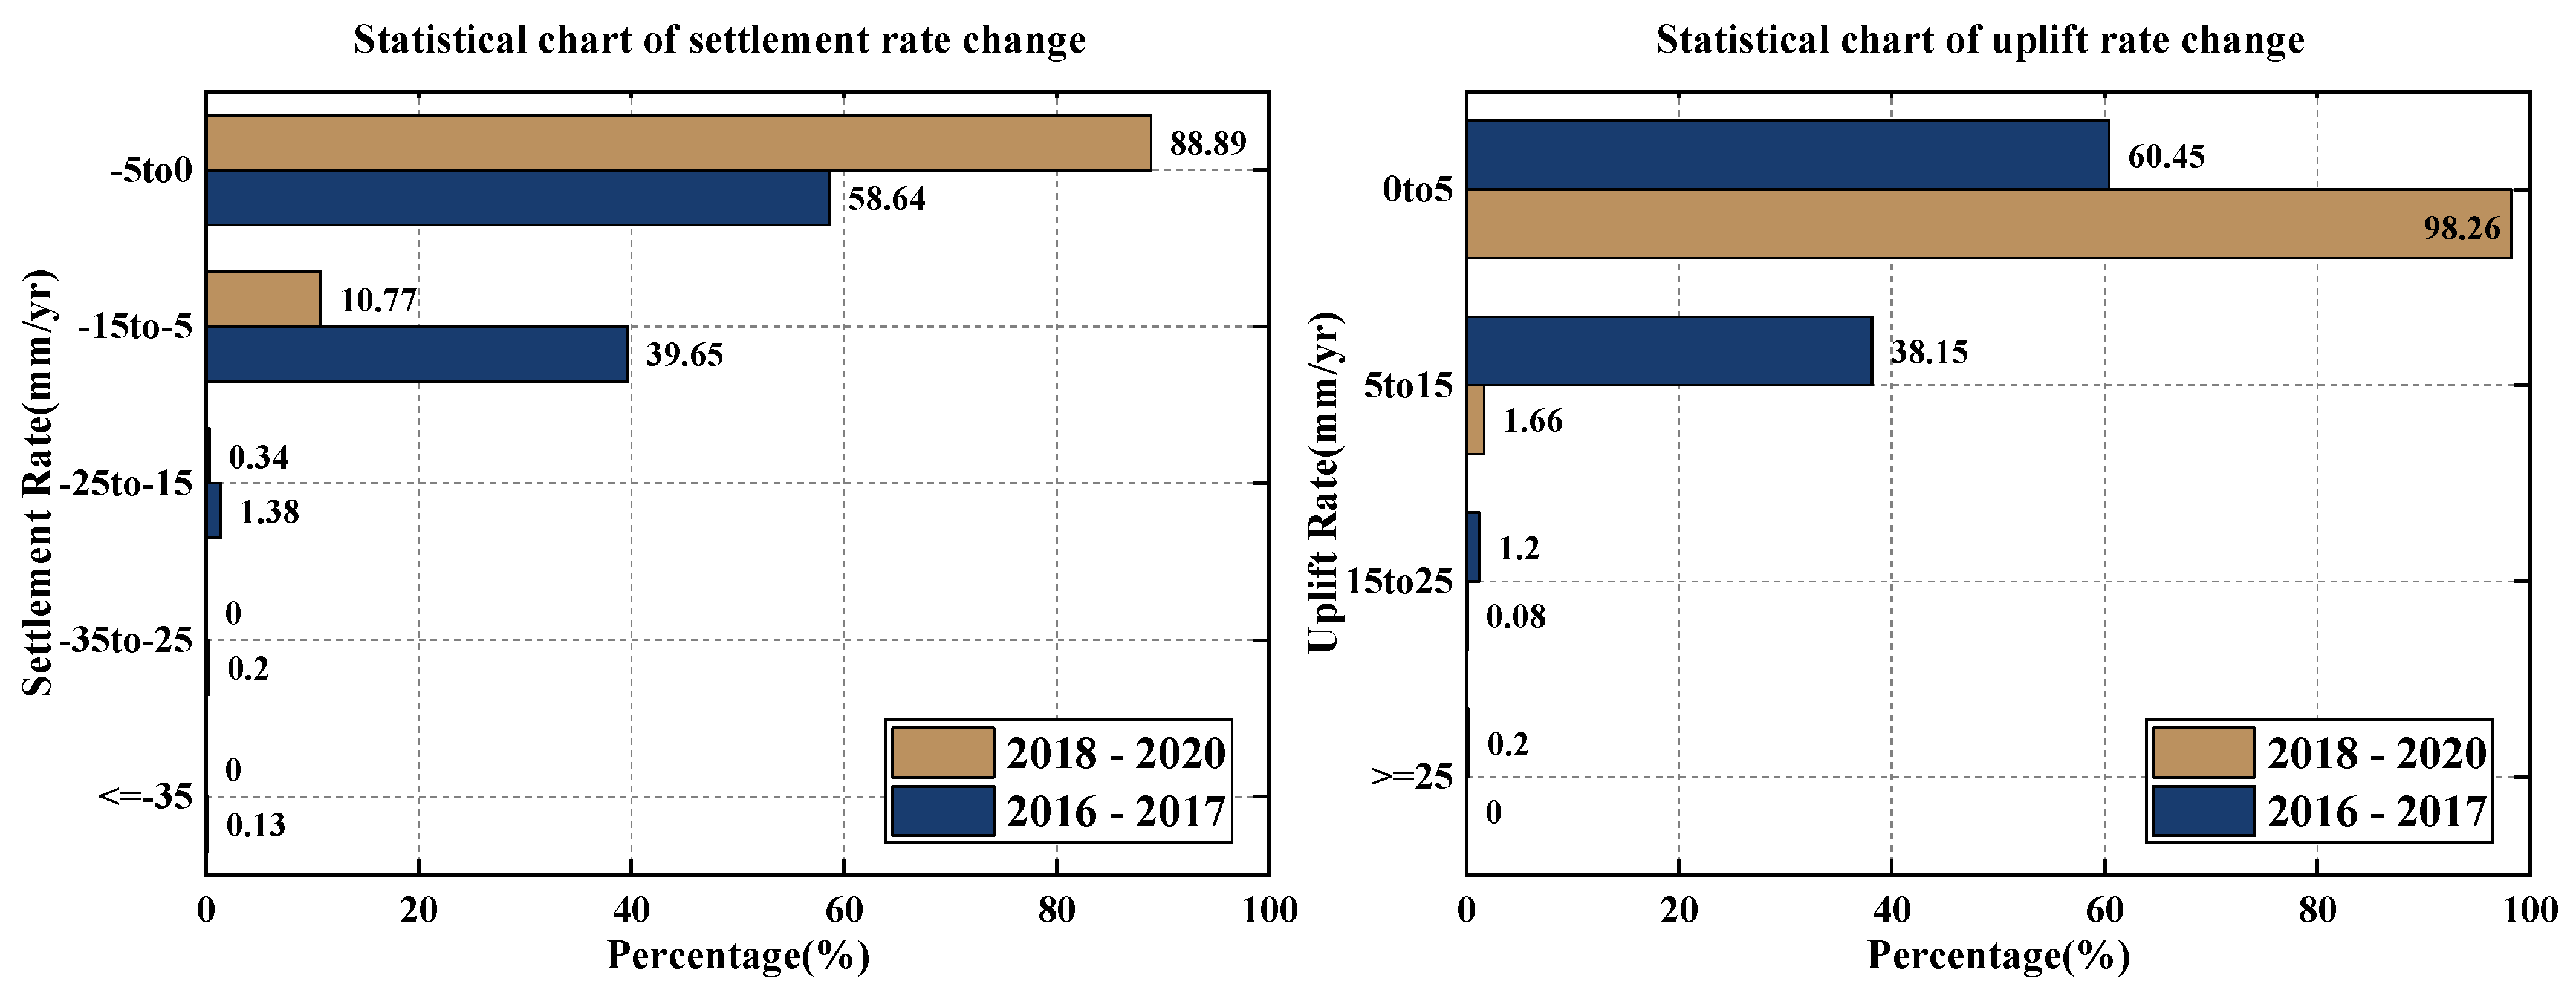
To investigate the surface deformation in Shanghai from 2016 to 2020, this section applies mathematical statistics to the two sections of deformation information acquired via time series InSAR technology. To further comprehend the time series change in deformation rate, this section presents the statistics of surface subsidence and uplift information separately. The statistical results are shown in Figure 8.
Based on the statistical map of surface subsidence change, the surface subsidence rate in Shanghai presents a slowdown trend during the period from 2016 to 2020. In total, 41.36% of all the PS points had a surface subsidence rate over −5 mm/y during 2016–2017, whereas the proportion decreases to 11.11% during 2018–2020. Compared with 2016–2017, higher surface subsidence rates did not occur in the Shanghai area during 2018–2020. Additionally, the subsidence rates were all less than −25 mm/y. The statistical map of surface uplift changes shows that the PS points with surface uplift rates above 5 mm/y accounted for 39.55% of all uplifted PS points in the Shanghai area during 2016–2017, whereas 98.26% of all uplifted PS points are in the range of 0–5 mm/y during the period 2018–2020. Compared with 2016–2017, the ratio of stable PS points with a surface deformation rate of −5 mm/y–5 mm/y in the Shanghai area during 2018–2020 has been significantly increased, also confirming the easing trend of surface subsidence in the Shanghai area.
In general, the surface uplift and subsidence in the Shanghai area during 2016–2020 showed a slowing trend in the proportion of PS sites with large subsidence rates declining significantly. Moreover, most PS sites were between −5 mm/y and 5 mm/y, with relatively stable deformation, which is related to subsidence control initiatives, including groundwater extraction control, implemented in the Shanghai area in recent years.

5. Discussion

5.1. Analysis of the Causes of Surface Subsidence in Shanghai Area

5.1.1. Influence of Regional Groundwater Levels and Surface Deformation

The overextraction of groundwater has been a direct problem causing surface subsidence [31,32,33]. In recent years, the total annual water consumption in Shanghai has been above 7 billion cubic meters. Among this, industrial water consumption accounts for approximately 40% of the city’s total water consumption, making it the main aspect of water consumption [34]. In order to alleviate the overexploitation of groundwater, the Shanghai region has been using groundwater recharge to protect the regional groundwater reserves. As of 2020, Shanghai has achieved 10 consecutive years of maintaining artificial recharge of water more than extraction [35]. The phenomenon of groundwater overexploitation in Shanghai has been alleviated to a certain extent by the protective actions of the Shanghai government. However, the seasonal variation of groundwater level still influences the occurrence of surface deformation. Thus, investigating the relationship between groundwater level and surface deformation in Shanghai is especially vital.
In this section, four groundwater level monitoring wells distributed in different areas of Shanghai were selected to monitor the water level in 2020 with the average cumulative subsidence within 300 m around them being selected for performing comparative analysis. The spatial locations of the monitoring points are shown in Figure 2, and the comparison maps are displayed in Figure 9. Well A is located in Zhongyuan Road, in the Yangpu District, which is in the old city of Shanghai. The fluctuation of groundwater level in 2020 is relatively small. Wells B, C, and D are in Wenmiao Road, in the Huangpu District, Qianqiao Town, in the Fengxian District, and near Huayuangang Bridge, in the Pudong New District, respectively. The three points have different spatial locations and show differences in groundwater level where the seasonal variation in water level is more apparent.
Based on Figure 9, a certain correlation between the groundwater level and the regional cumulative subsidence in Shanghai is found. An increase in the regional groundwater level will directly generate an uplift of the ground surface, whereas a decrease in the groundwater level will also result in a significant tendency for the ground surface to sink. With the change in groundwater level, the buoyancy effect on the ground surface will accordingly change. An increment in the groundwater level increases the buoyancy force, which in turn causes the surface to lift, whereas a decrease in the groundwater level causes the surface to sink.

5.1.2. Analysis of Rainfall and Surface Deformation

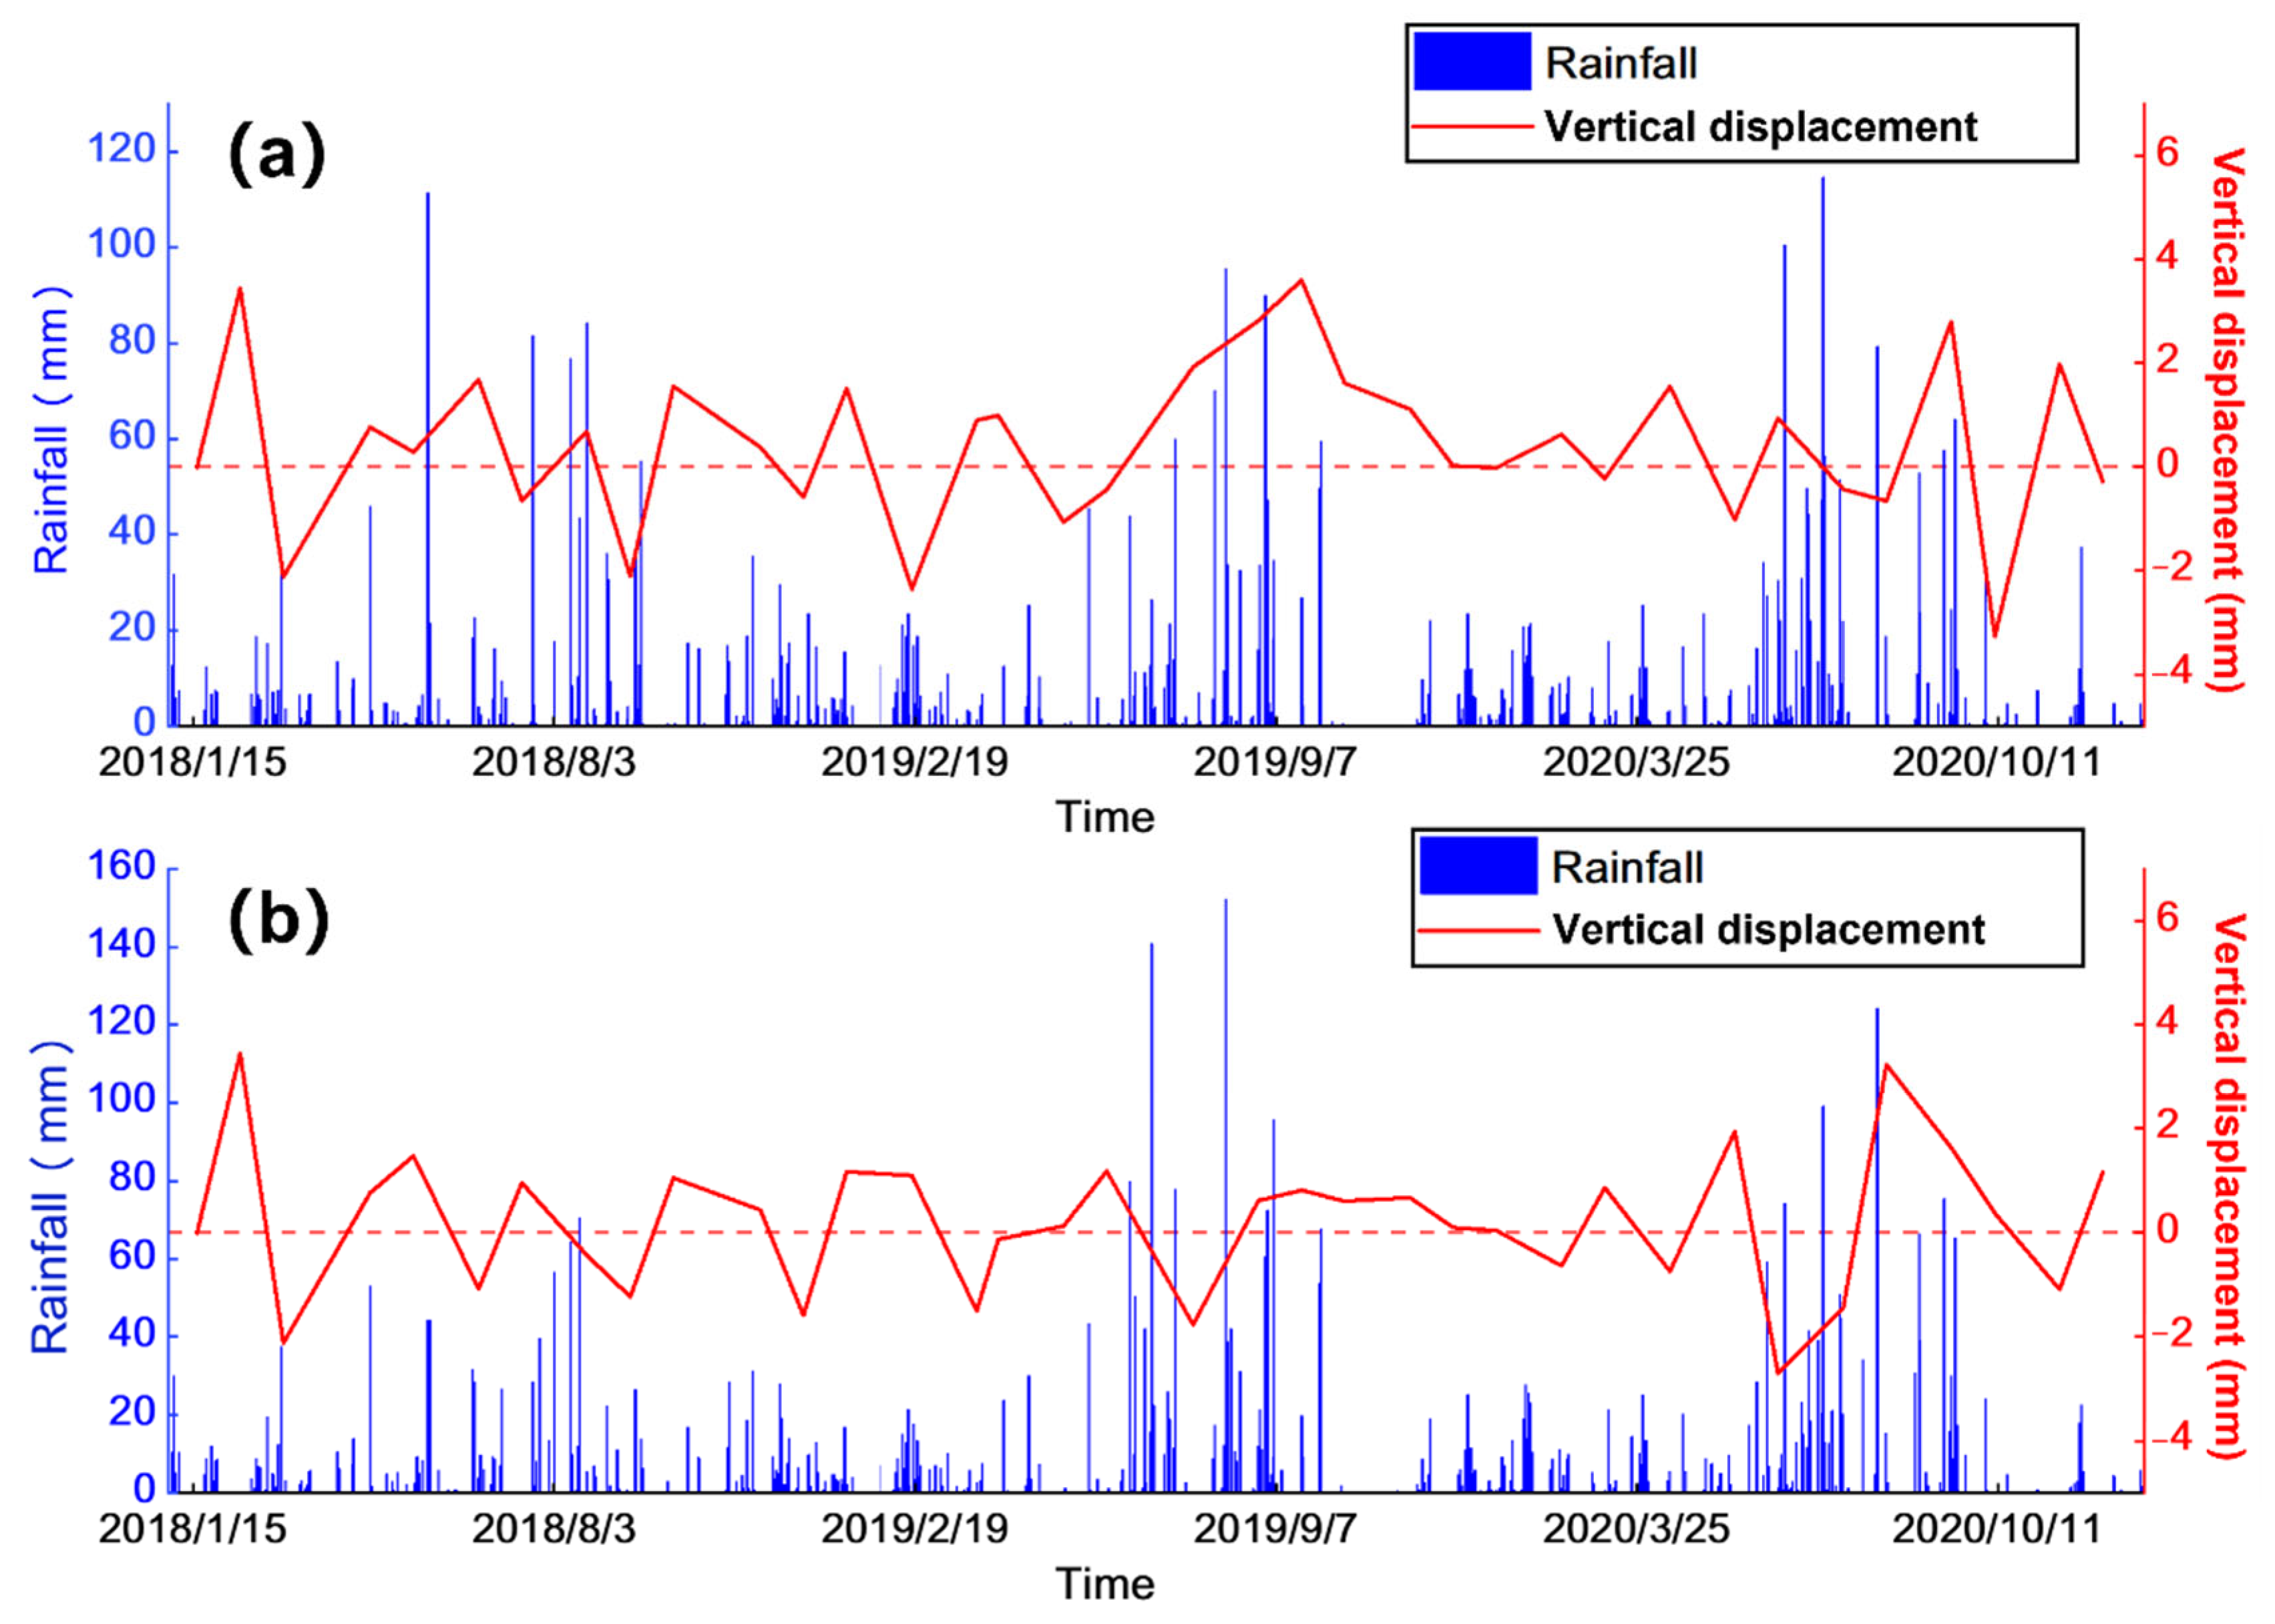
To explore the relationship between rainfall and surface deformation in the Shanghai area, this section selected the surface deformation time series from 2018 to 2020 to develop the analysis. The PS points within 400 m around two meteorological stations in the Shanghai area were extracted and averaged to acquire the monthly surface deformation variables for comparison. The comparison results are shown in Figure 10. Shanghai is in the lower reaches of the Yangtze River, with four wet and rainy seasons and typical mei-yu weather occurring annually. The influence of regional precipitation on the ground surface cannot be ignored. Figure 10 illustrates a certain correlation between rainfall and surface deformation. In months with more rainfall, the regional surface deformation variables are positive. In some months, the surface uplift is further increased with the regional precipitation. Influenced by mei-yu weather, the Shanghai region experiences prolonged and persistent precipitation from June to August annually [36,37]. Based on the time series changes of deformation, the surface uplifts to different degrees after the rainfall in the rainy weather, directly indicating the linear correlation between the rainfall and the surface form deformation. This is a direct indication of the correlation between rainfall and surface displacement. Nevertheless, in a few time periods, the time series curves of displacement and precipitation are not correlated, suggesting that the surface displacement in Shanghai is influenced by a combination of factors, and that the influence of precipitation becomes the dominant factor in months with increased precipitation [38,39,40].
In this section, grey relational analysis (GRA) is applied to explore the data described by the grey relational grade (GRG). Quantitative studies of rainfall at meteorological stations and average subsidence within 400 m around the stations were conducted. As determined through comparative calculation, the grey correlation degree between the average subsidence and the rainfall in Shanghai is 0.77. Moreover, this value indicates a good correlation and a certain correlation trend between the discrete time series of average subsidence and rainfall.

5.1.3. Correlation between Urban Development and Surface Deformation

With the expansion of urbanization in Shanghai, infrastructure has been built in numerous places. The construction of infrastructure also significantly increases the surface load, which causes different degrees of surface subsidence. As a result, the urbanization development in Shanghai should be further monitored. Moreover, the key development areas should be investigated systematically.
Nighttime light remote sensing satellites can acquire regional nighttime light data to reflect the spatial distribution of human activities, and then explore the regional economic construction and development [41,42]. In the current section, the NPP VIIRS 500 m nighttime light remote sensing data covering the Shanghai area are obtained. In order to make the data more representative, we select the synthetic products of nighttime light for the years 2016, 2018, and 2020. The changes in the nighttime light distribution after differencing the nighttime light remote sensing data of 2018 and 2016, and 2020 and 2018, are displayed in Figure 11, respectively. The results of the difference reveal that the regional distribution of light changes in Shanghai is uneven and fragmented. A more obvious rising trend of lights is observed near Dishui Lake and Pudong International Airport in the New Pudong District, conforming to the spatial distribution of the key subsidence areas in the New Pudong District in Figure 3c,d (see the enlarged drawing in Figure 11 for details). At the same time, a more obvious rising trend of lights is found in the Fengxian District, which remains basically the same as the key subsidence area after comparison, also proving the application of remote sensing of lights at night in urban development.

5.1.4. Relationship between Shallow Surface Geological Structure and Surface Deformation

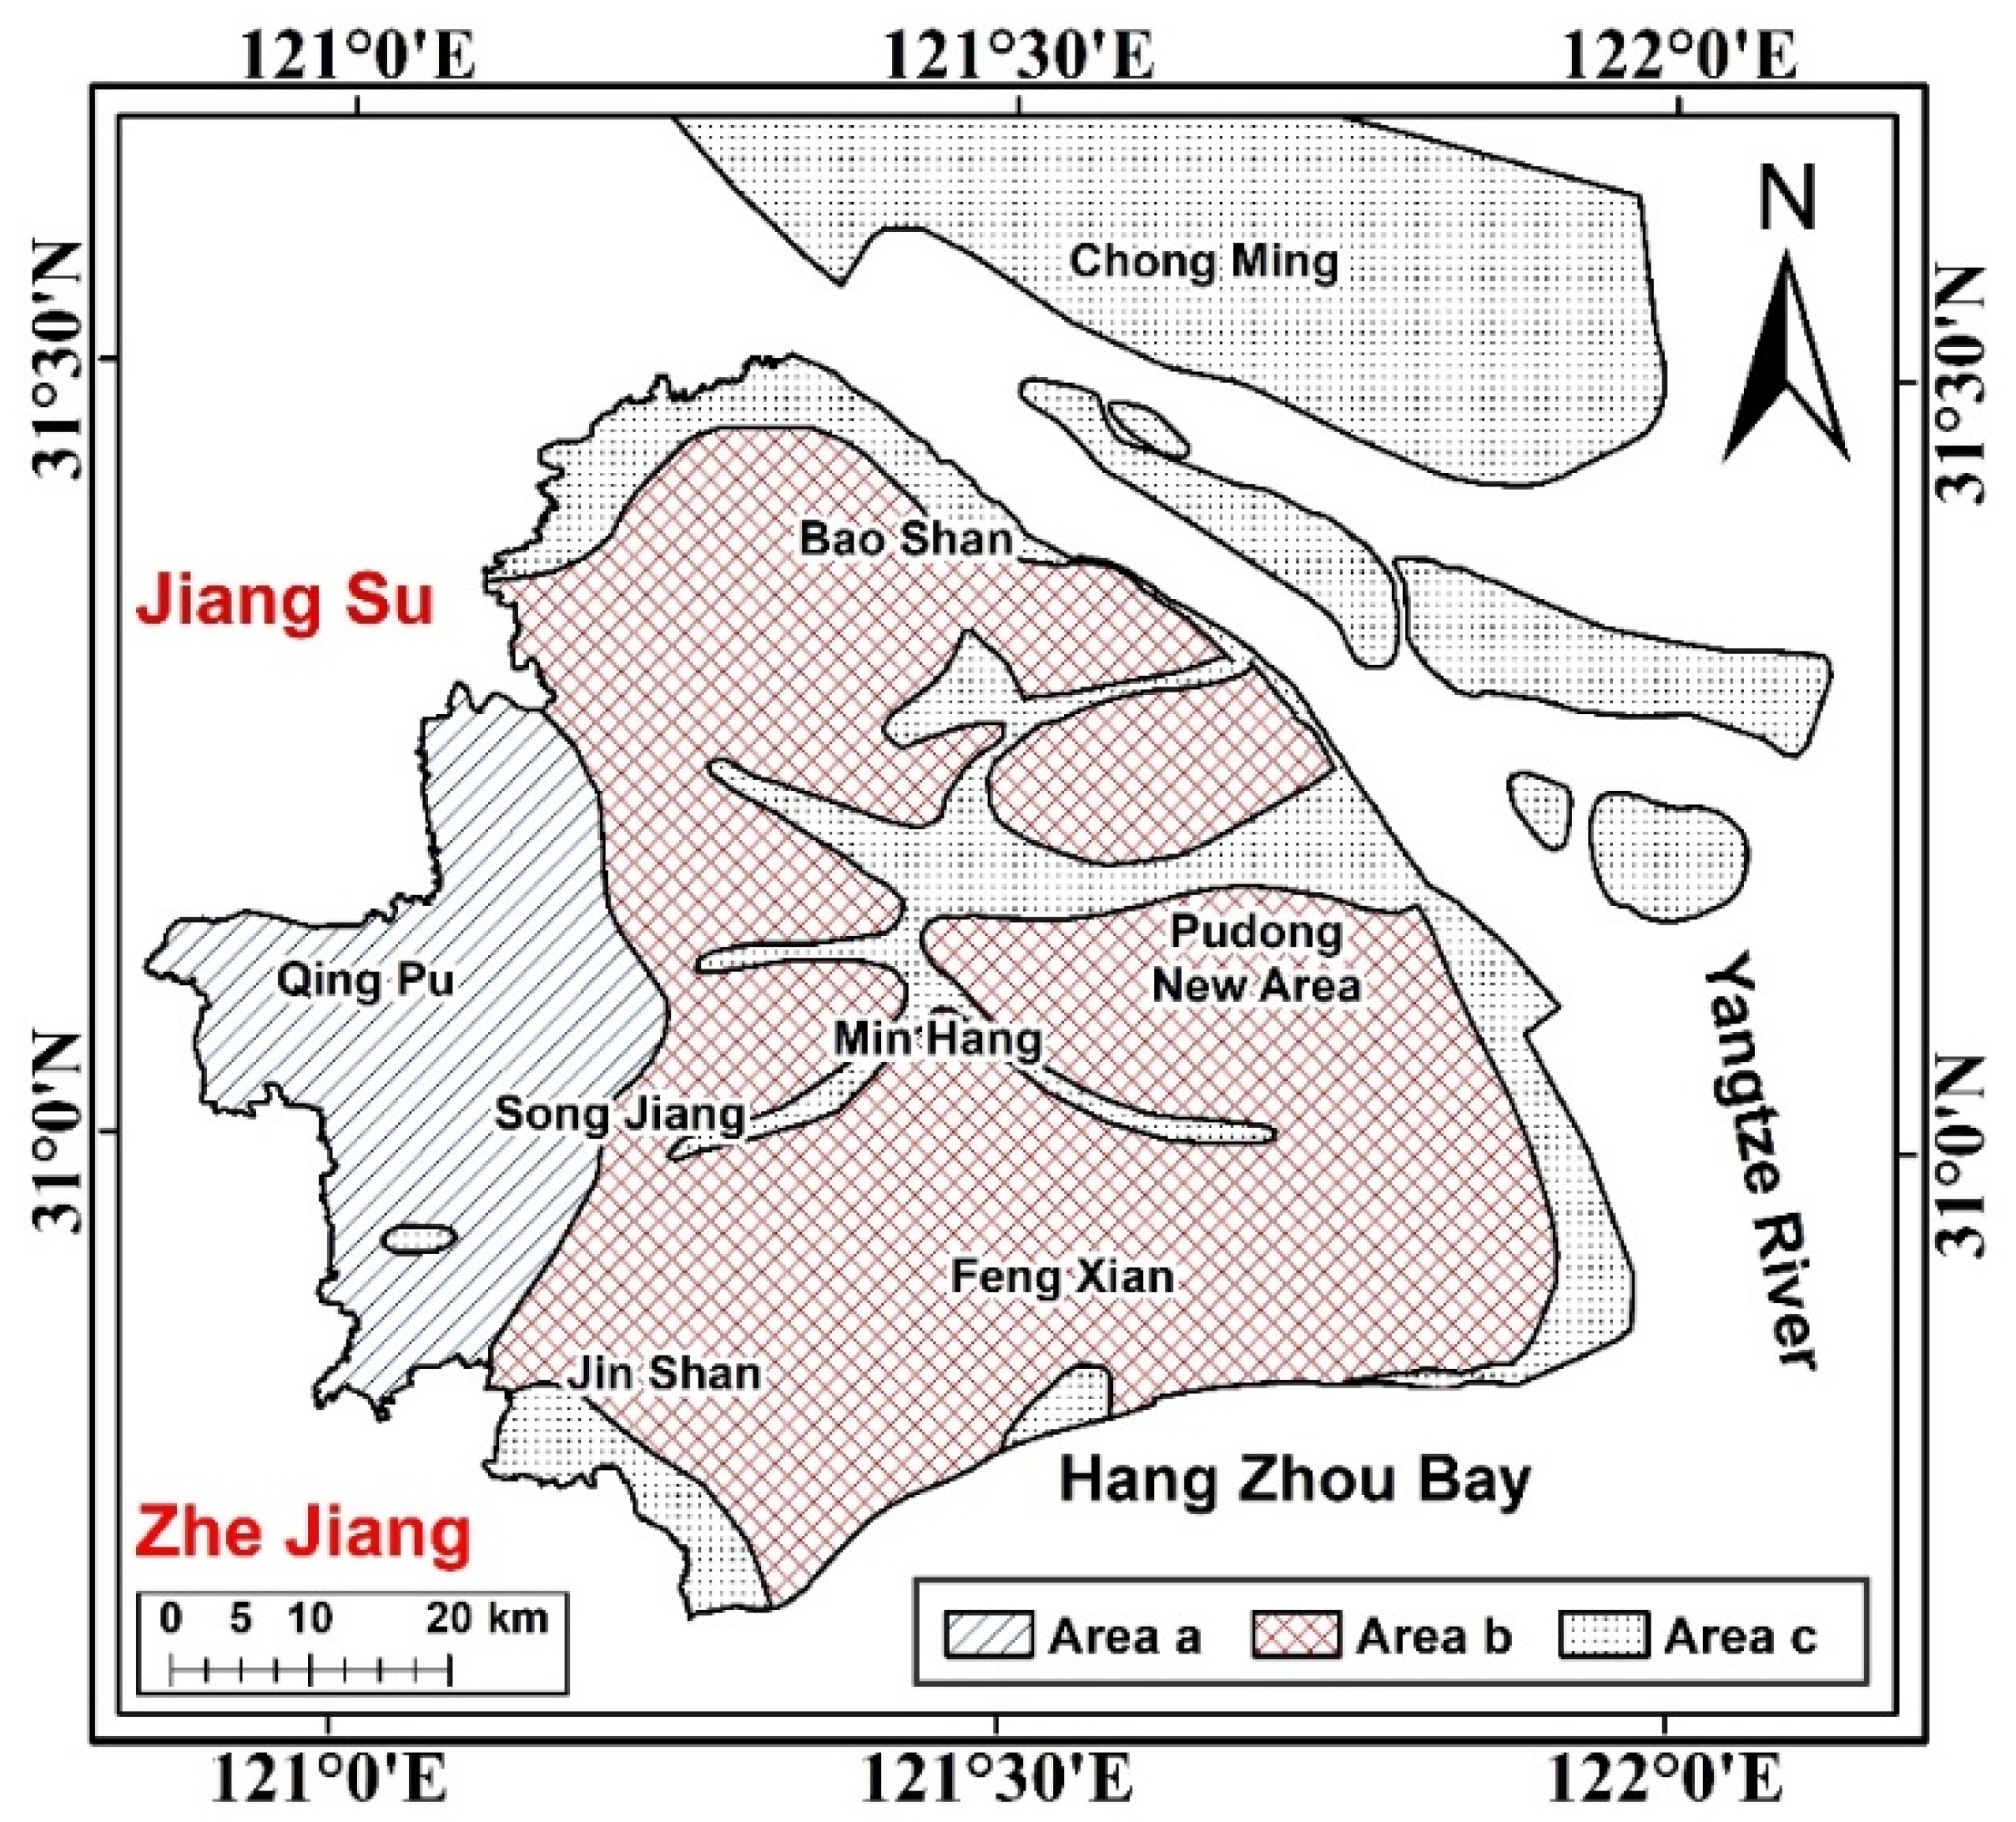
The shallow surface of the Shanghai area, which is a typical soft soil geological area, is dominated by quaternary powder clay and fine sand [43,44]. The shallow soil layers in Shanghai are more evenly distributed, with silty powdery clay in the upper layer and silty clay in the lower layer, which together form a typical soft soil in Shanghai. In the soft soil layer, the soil has high water content and relatively soft hardness. The Shanghai soil layer is mostly composed of soft clayey soil, which has adverse engineering geological properties, such as high water content, large voids, and high compressibility. Based on the deep stratum, the Shanghai area is zoned by engineering a geological soil structure. Most of the Shanghai area is dominated by sandy soils, while Yangtze River rock-type sediments exist in the deep layers, and they have undergone several deposition and soil formation processes to form paleosol layers, which we call the first and second hard soil layers [45,46]. The first and second hard soil layers are hard clay layers, with low natural water content, dense soil quality that are not easy to compress; thus, they can be applied as pile foundation bearing layers for buildings [47]. The soils in Shanghai are classified into the following three types, namely a Region A soil structure type area, where the first and second hard soil layers exist, a Region B soil structure type area, where the second hard soil layer exists and the first hard soil layer is missing, and a Region C soil structure type area where the first and second hard soil layers are missing. Figure 12 shows the distribution of geological types.
Region A is mainly located in the western part of the districts of Songjiang, Qingpu, and Jinshan. The geomorphology of this type is dominated by alluvial lake plains with relatively low-lying terrain. This type of soil has first and second hard soil layers, and the shallow sand layer is not developed in most areas. Therefore, the foundation conditions of this type of soil structure are suitable for building foundation structures. Region B has a type of soil which has a second hard soil layer without the first hard soil layer, and is distributed in most areas of the Jiading and Baoshan Districts, the eastern parts of the Qingpu and Songjiang Districts, the western parts of the Minhang District, the eastern and northern parts of the Jinshan District, most of the Nanhui District, and in Chuansha of the New Pudong District, as well as local areas of downtown. In general, these soil structure types are considered to have fair foundation conditions. Region c has no second hard soil layer, and no first hard soil layer is distributed in the local area of downtown and the northern part of the Baoshan District, as well as on the three islands of Chongming, Changxing, and Heng Sha in the estuary of Yangtze River. The third soft soil layer is locally missing. Its first and second soft soil layers are thicker, with obvious rheological and thixotropic phenomena. The estuary area is prone to seepage and vibration liquefaction. Therefore, the comprehensive analysis refers to the type of soil structure with poor foundation conditions.
Under the same water level conditions, the surface of the type a area is less influenced by groundwater level changes, and the surface deformation is relatively small. Thus, large-scale subsidence does not occur easily. The b type refers to a single hard soil layer area wherein groundwater level and soil water content change, and other reasons will generate a certain impact on the surface deformation of this type of area. The c type is not distributed on the first and second hardness layers. The soil hardness and the influence of groundwater are low, and surface deformation is likely to occur.

5.2. Analysis of Surface Uplift Phenomenon in Shanghai Area

5.2.1. Sediment Accumulation and Surface Uplift

Shanghai is located at the mouth of the Yangtze River. The sediment carried by the middle and upper reaches of the Yangtze River tends to slow down significantly after entering the lower reaches because the terrain becomes gentler. Under the action of gravity, the sediment carried by the Yangtze River will settle near the Yangtze River inlet and gradually deposit in the riverbed and the inlet downstream. Especially near the inlet area, the area of the river water crossing section increases, whereas the flow velocity becomes significantly lower due to the huge resistance of the East China Sea water. Moreover, this phenomenon generates a significant decrease in the maximum weight of objects that the water body can push, and an exponential decrease in the maximum capacity of the water body to carry sediment. In addition, a large amount of sediment will be gathered and deposited near the sea inlet. The collapse prevention project built on the west coast of Chongming Island has significantly prevented the land collapse caused by the impact of water, which has further expanded the area of Chongming Island and continued the growth of the land coastline. As a result of the aforementioned factors, the estuary of the Yangtze River has become narrower and longer, and the Yangtze River needs a longer time to enter the East China Sea, providing sufficient spatial and temporal conditions for the sediment deposition and weakening the obstruction of seawater. After depositing the sediment near the coast, the tidal action will also influence the sediment near the coastline. Consequently, a large amount of sediment is silted up at the inlet and slowly forms islands with a growing trend in area [48,49].
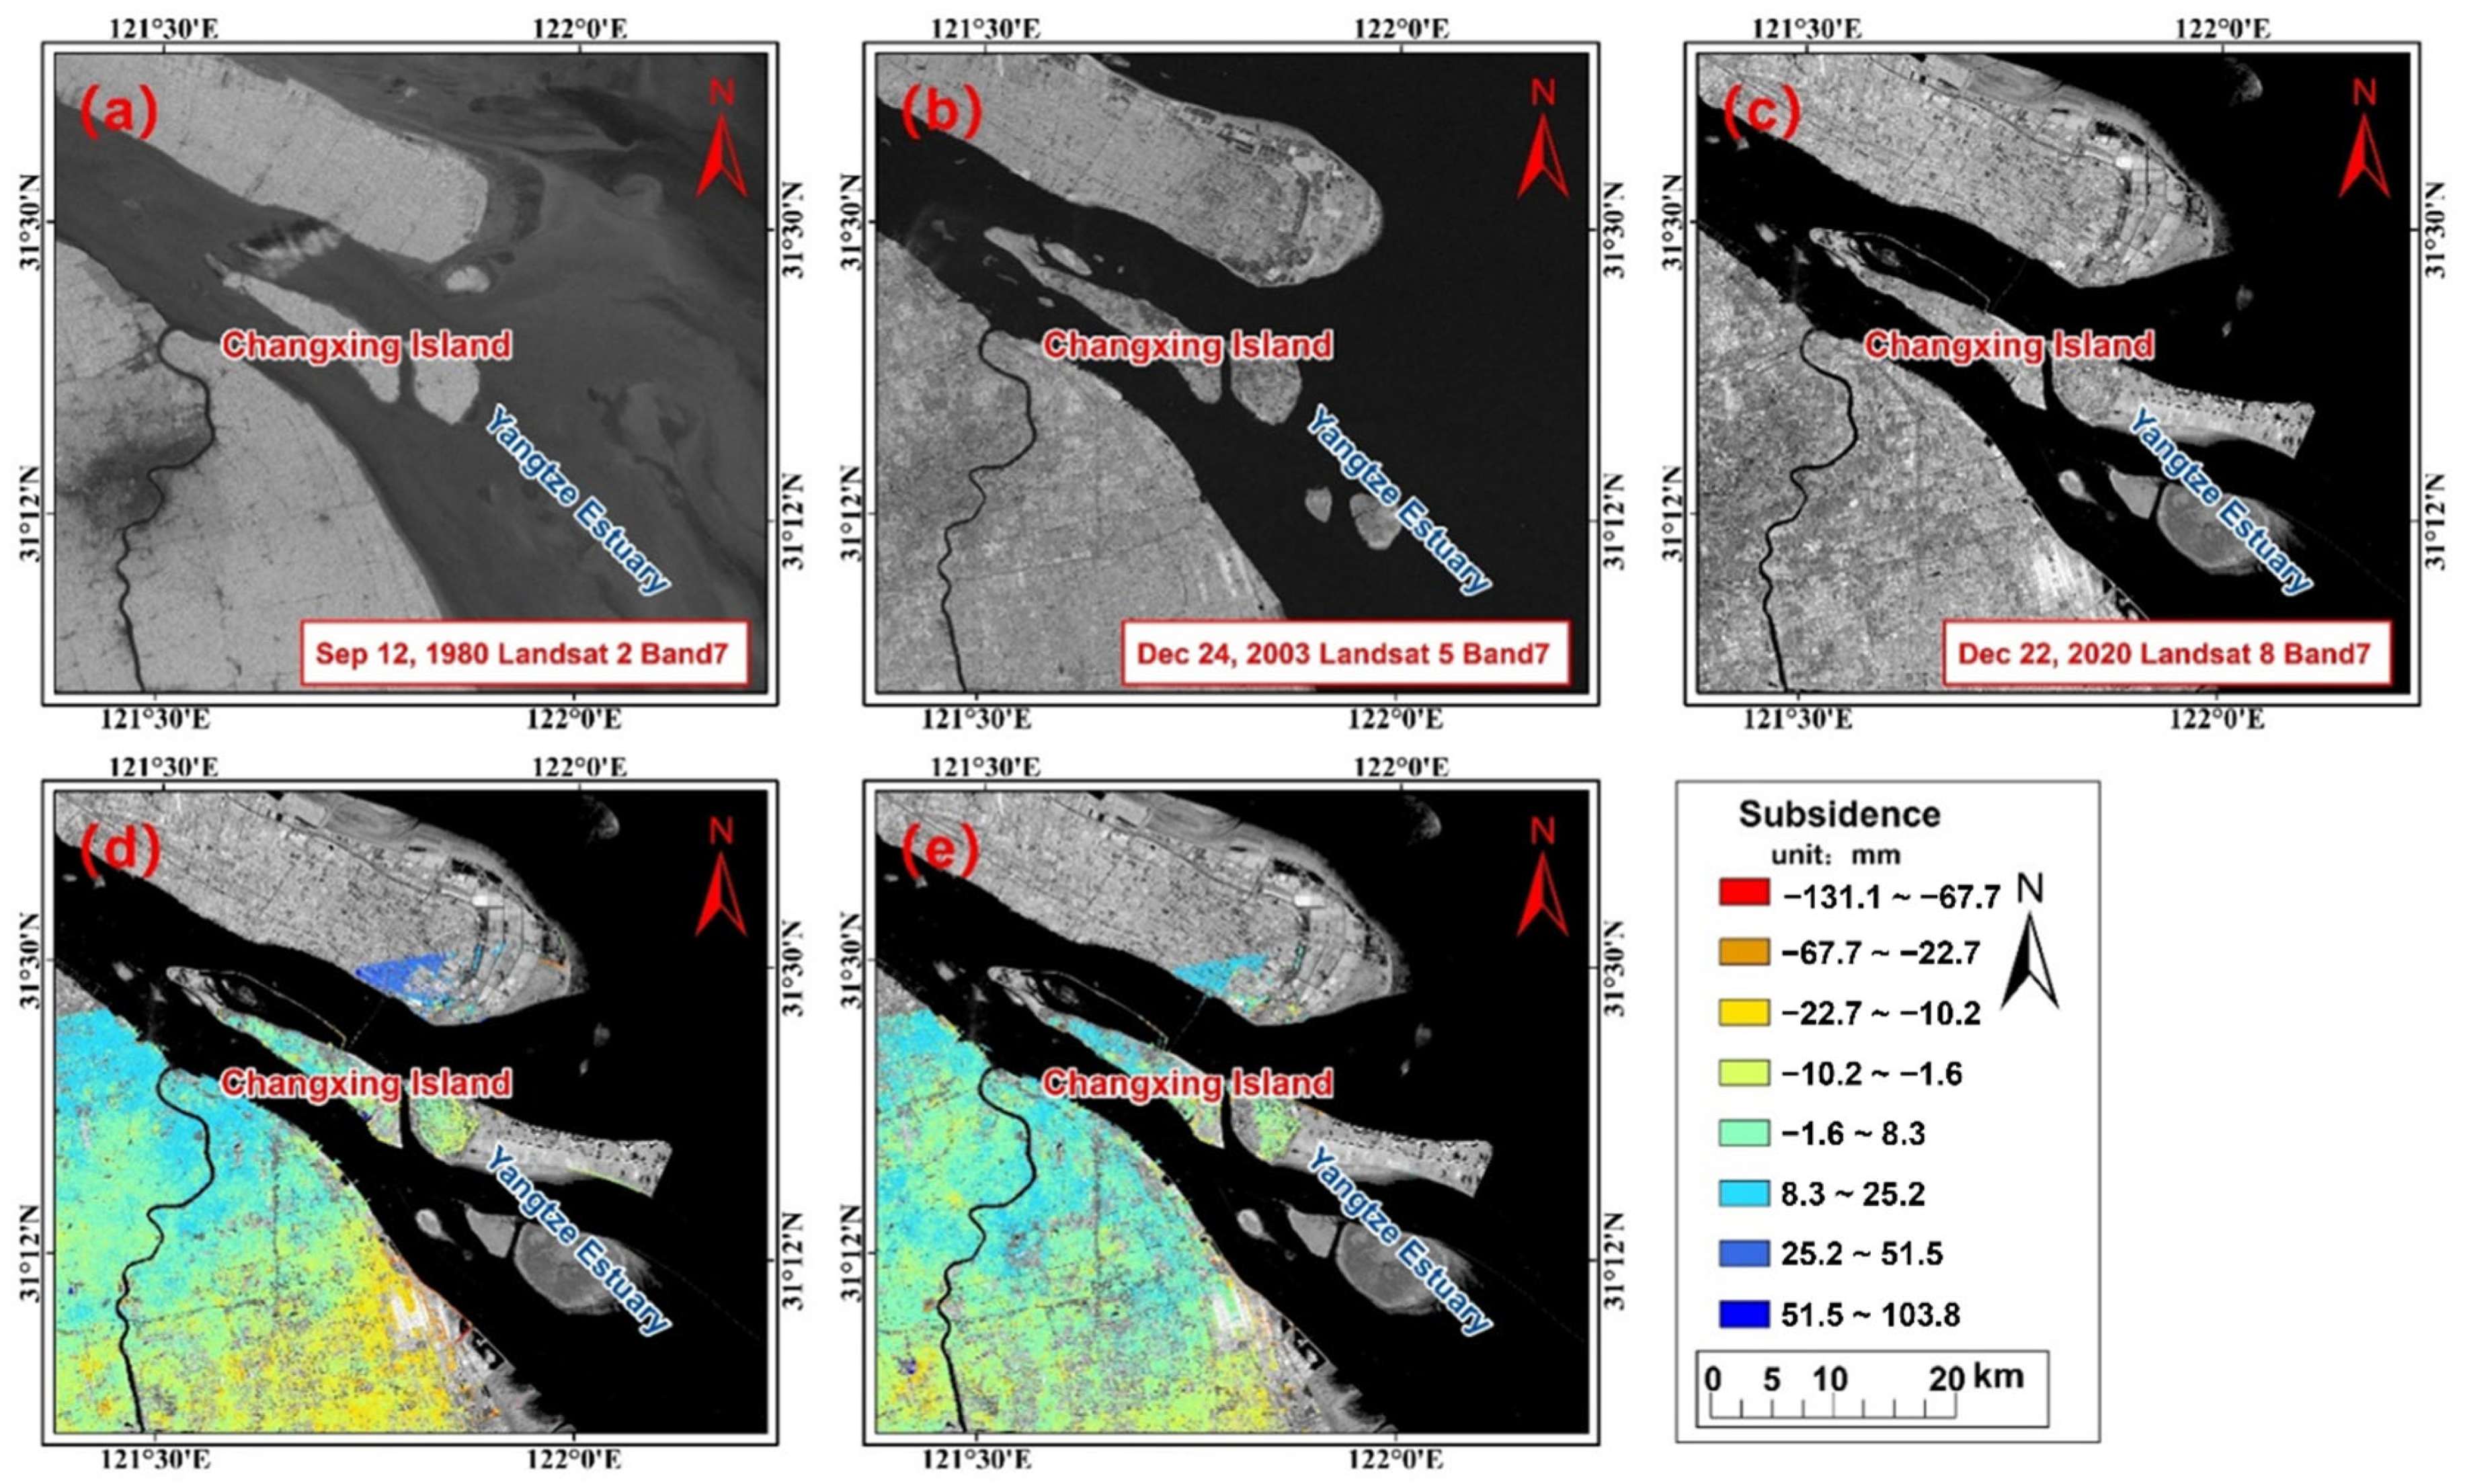
To better understand the sediment accumulation in Shanghai, this section obtains the short-wave infrared band (band 7) images taken by Landsat series satellites at the estuary of the Yangtze River in September 1980, December 2003, and December 2020. The time sequence change diagram is illustrated in Figure 13. The time sequence change in the image shows that the sediment accumulation in Shanghai is obvious, and the accumulated sediment is mostly adopted for land reclamation at the sea to satisfy the needs of urban expansion. The accumulation of sediment replenishes the coastal land soil layer, directly generating the uplift of the coastal surface.

5.2.2. Correlation Analysis between the Seasonal Variation of Tide and Coastal Surface Uplift

Tide is a natural phenomenon occurring in coastal areas. It refers to the periodic movement of sea water under the gravitational action of the moon and the sun. Shanghai faces the Pacific Ocean in the East and the Yangtze River in the north. [50,51] Thus, the tide phenomenon is evident. According to the data released by the National Marine Information Center, the tidal height difference in the coastal areas in Shanghai is approximately 400 cm in a day, and the variation of tidal height is similar to the distribution of sinusoidal function. Shanghai is a typical soft soil foundation area, with high soil moisture content and high urban groundwater level. During the process of tidal change in coastal areas, the tide increases the weight and volume of groundwater located in coastal areas, which can, thus, change the groundwater pressure on the formation sediments, leading to the extrusion of groundwater to the lower stratum and the increment of upward stratum buoyancy and the lifting phenomenon [52,53,54,55].
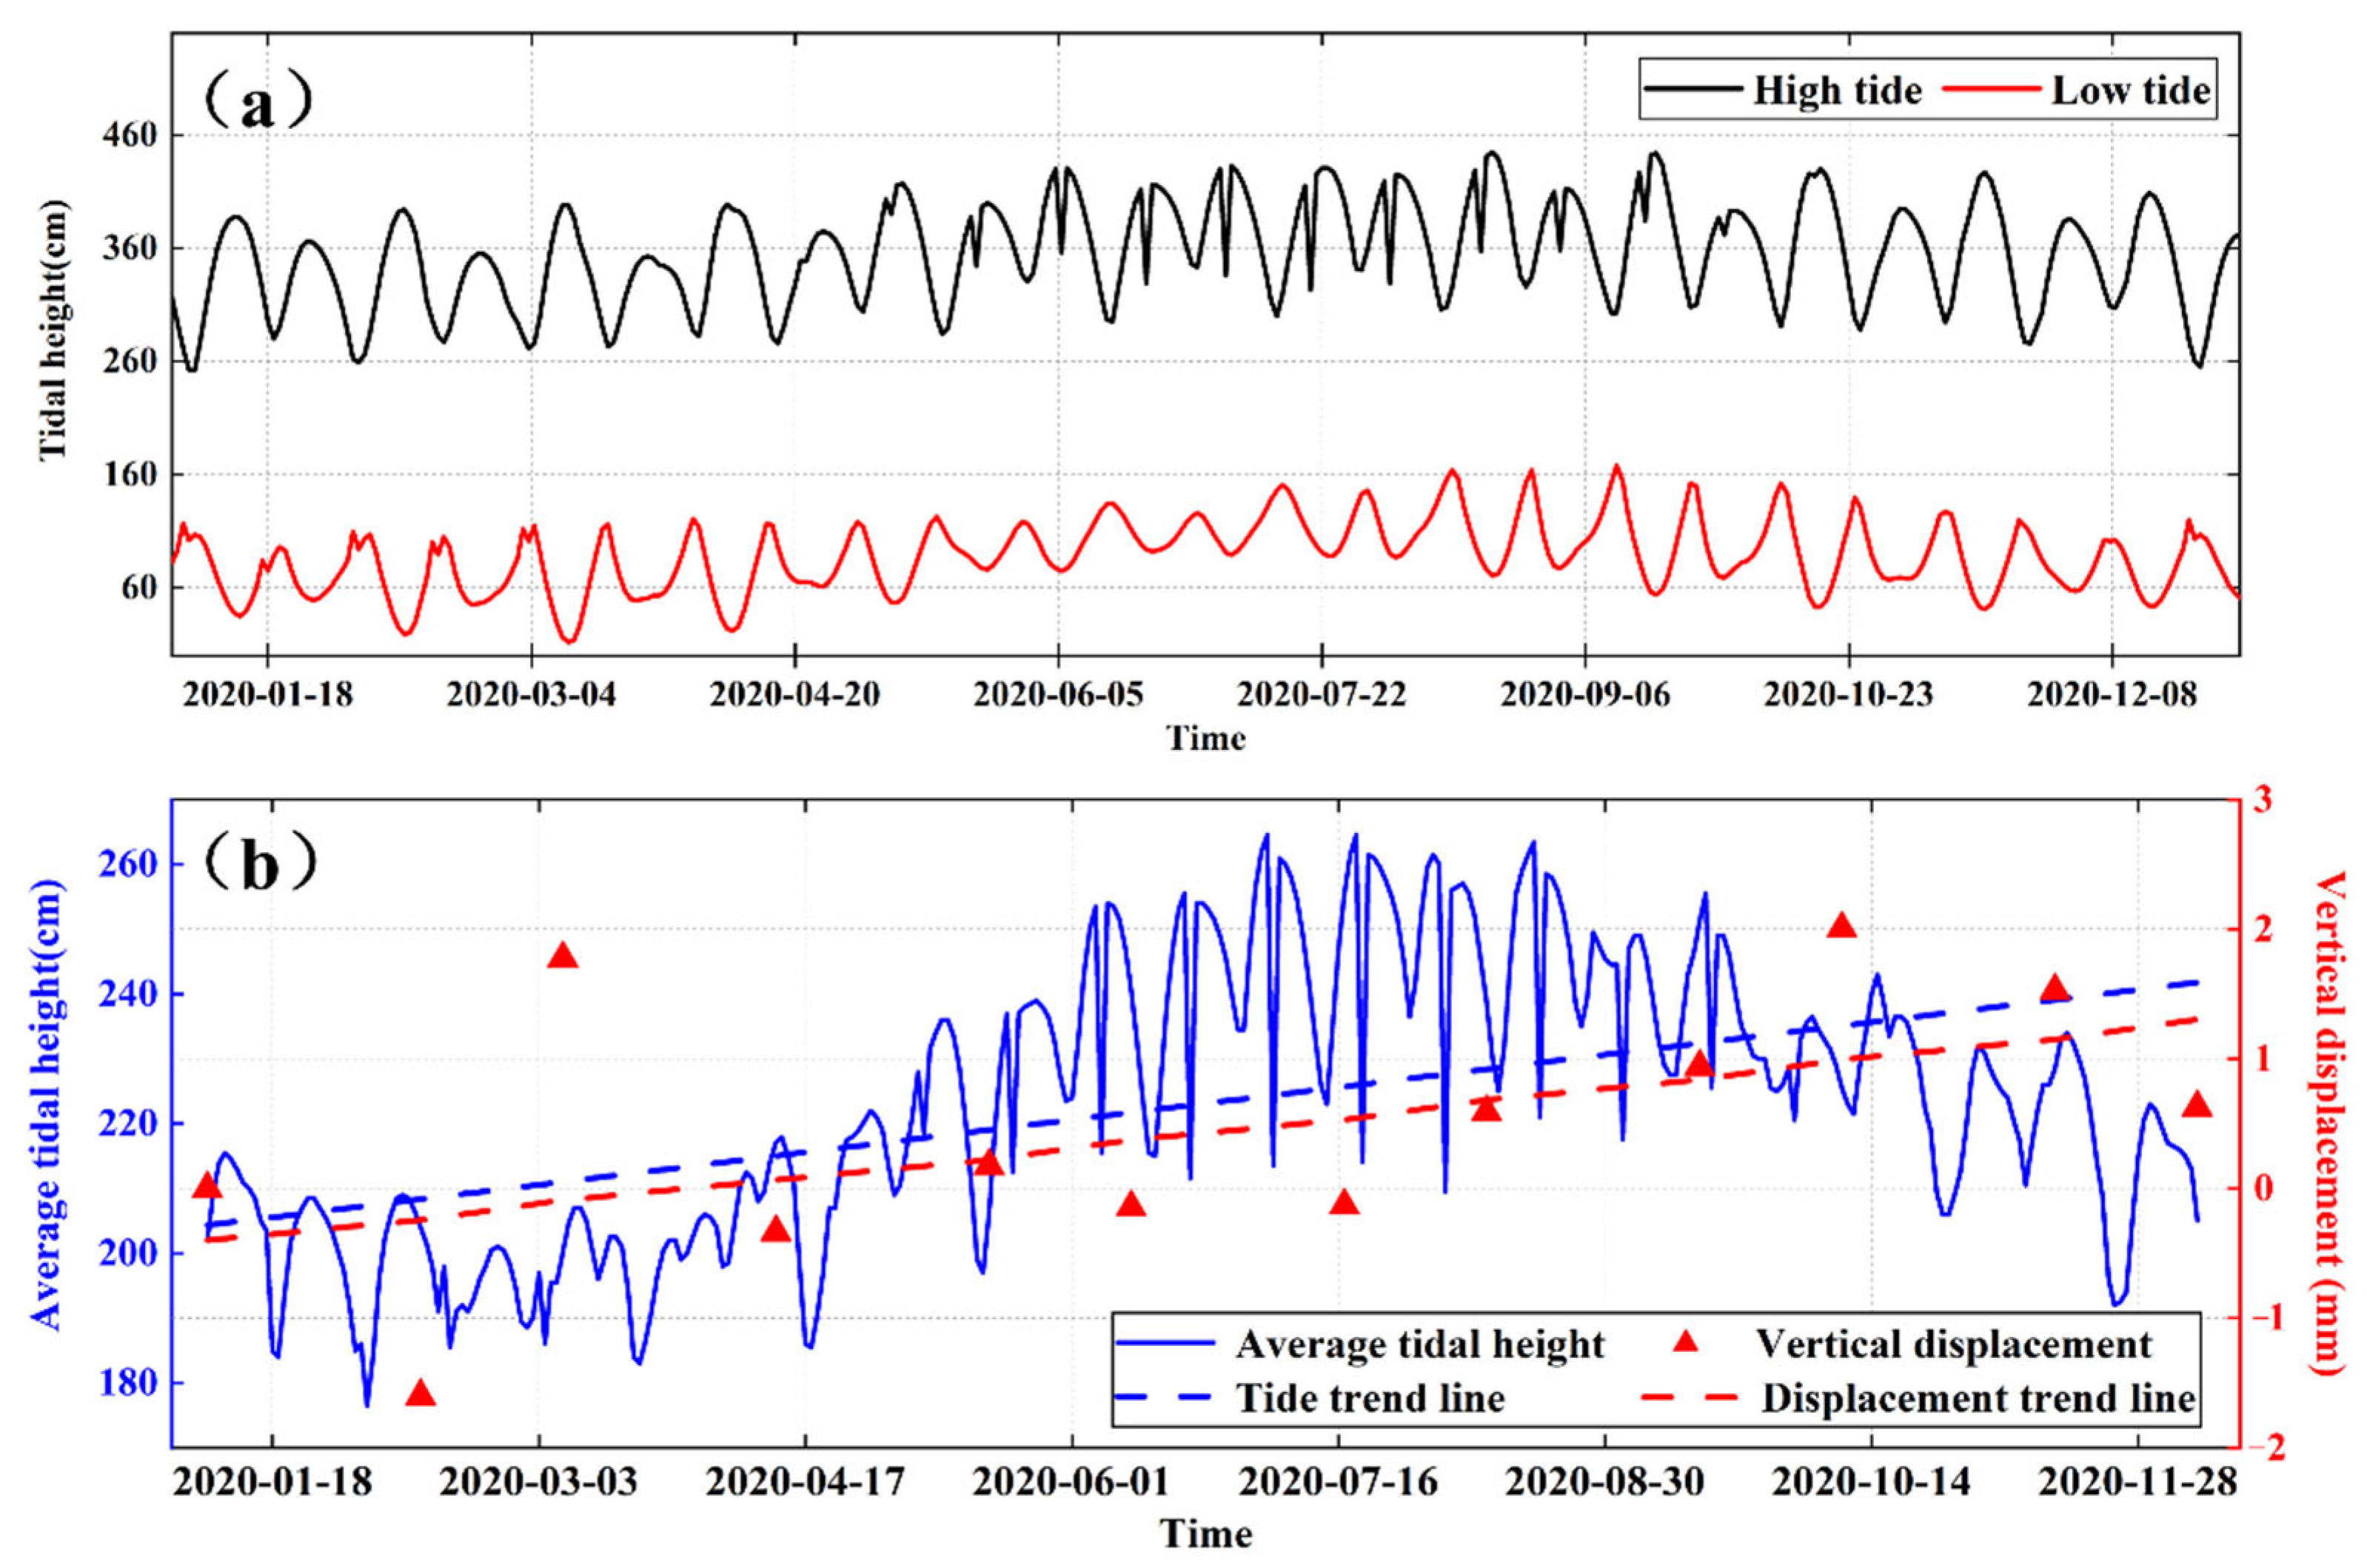
To investigate the impact of tidal changes on the surface of Shanghai’s coastal areas, we obtained the changes in the daily maximum, low tide height, and average tide height from the Wuhaogou tidal monitoring station in Shanghai in 2020 (the spatial distribution of the station is illustrated in Figure 2). The average subsidence within 200 m around Wuhaogou Station is selected for comparison. Figure 14b shows the average tidal variation of Wuhaogou tidal station in 2020. The seasonal variation of the tide is evident. In summer (June–August), the tide height presents an upward trend. Additionally, the surface is also uplifted in varying degrees. A certain lag occurs with the change in tide height. This phenomenon is caused by the long-term effect of tide on the surface, which influences the land groundwater level and soil water content, and then increases the buoyancy and soil water content of the upper soil layer of groundwater, generating surface uplift.
In this section, the average settlement within 200 m around the Wuhao Gou site was compared with the average tidal height, and the trends of the deformation of both were extracted separately. After comparing the trends, it was found that the average settlement within 200 m is well correlated with the average tidal height data in the time series and has a certain correlation trend. Meanwhile, combined with the graph of mean tidal height change, we found that the tidal water to surface settlement is a slow process, and there is a certain lag effect between surface response and tidal change.

5.2.3. Analysis and Study on Surface Deformation and Soil Expansion

The soil in Shanghai is generally silty clay with high water content and porosity, which is a typical soft soil geological area. Recently, with the implementation of groundwater recharge in Shanghai, the water level in all parts of the region shows an upward trend, resulting in new deformation characteristics in the surface in Shanghai. Shanghai is in the lower reaches of the Yangtze River alluvial plain, where soil water content is high. Seasonal changes in temperature are observed. In addition, rainfall is often accompanied by physical and chemical changes in soil water expansion.
A physical expansion of soil water occurs. Soil water mainly includes chemically bound water, hygroscopic water, and free water. Chemically bound water and hygroscopic water cannot flow in the soil gap, and gasification separation can only occur under certain conditions. Therefore, it is not the focus of this section. Free water refers to the water that can move in the pores between soil particles, which is composed of groundwater, rainfall, as well as other factors. It is influenced by seasonal changes and plant absorption. The change is obvious. Some water in free water is added to groundwater by gravity. The groundwater supplement increases the groundwater level, enhances the buoyancy of the stratum, and causes surface uplift. Furthermore, some free water is absorbed by the muddy soil layer, and the water content of the soil layer increases, while the compression rate of the shallow soil layer decreases after water absorption, and a certain degree of physical expansion then occurs [56,57]. Influenced by the change in physical temperature, the moisture content and gas volume between soil layers will also change. Afterwards, the soil layer thermal expansion phenomenon occurs.
Soil water chemical expansion occurs. According to the survey, heavy metal pollution caused by human activities was observed in the coastal and inland areas of Shanghai. Sediments at the bottom of the lake and the bottom of the sea show more cations. The soil is characterized by high water content. The particles with negative charges are subject to electrostatic repulsion and diffusion to the surface, whereas the particles with positive charges present the opposite movement, forming a diffusion double layer on the surface of the sediment. Due to the negative charge on the surface of the diffusion double layer, the repulsion force will be generated, and then the gap between the soil layers will increase, contributing to surface uplift [58,59].

5.3. Surface Deformation in Reclamation Area of Shanghai

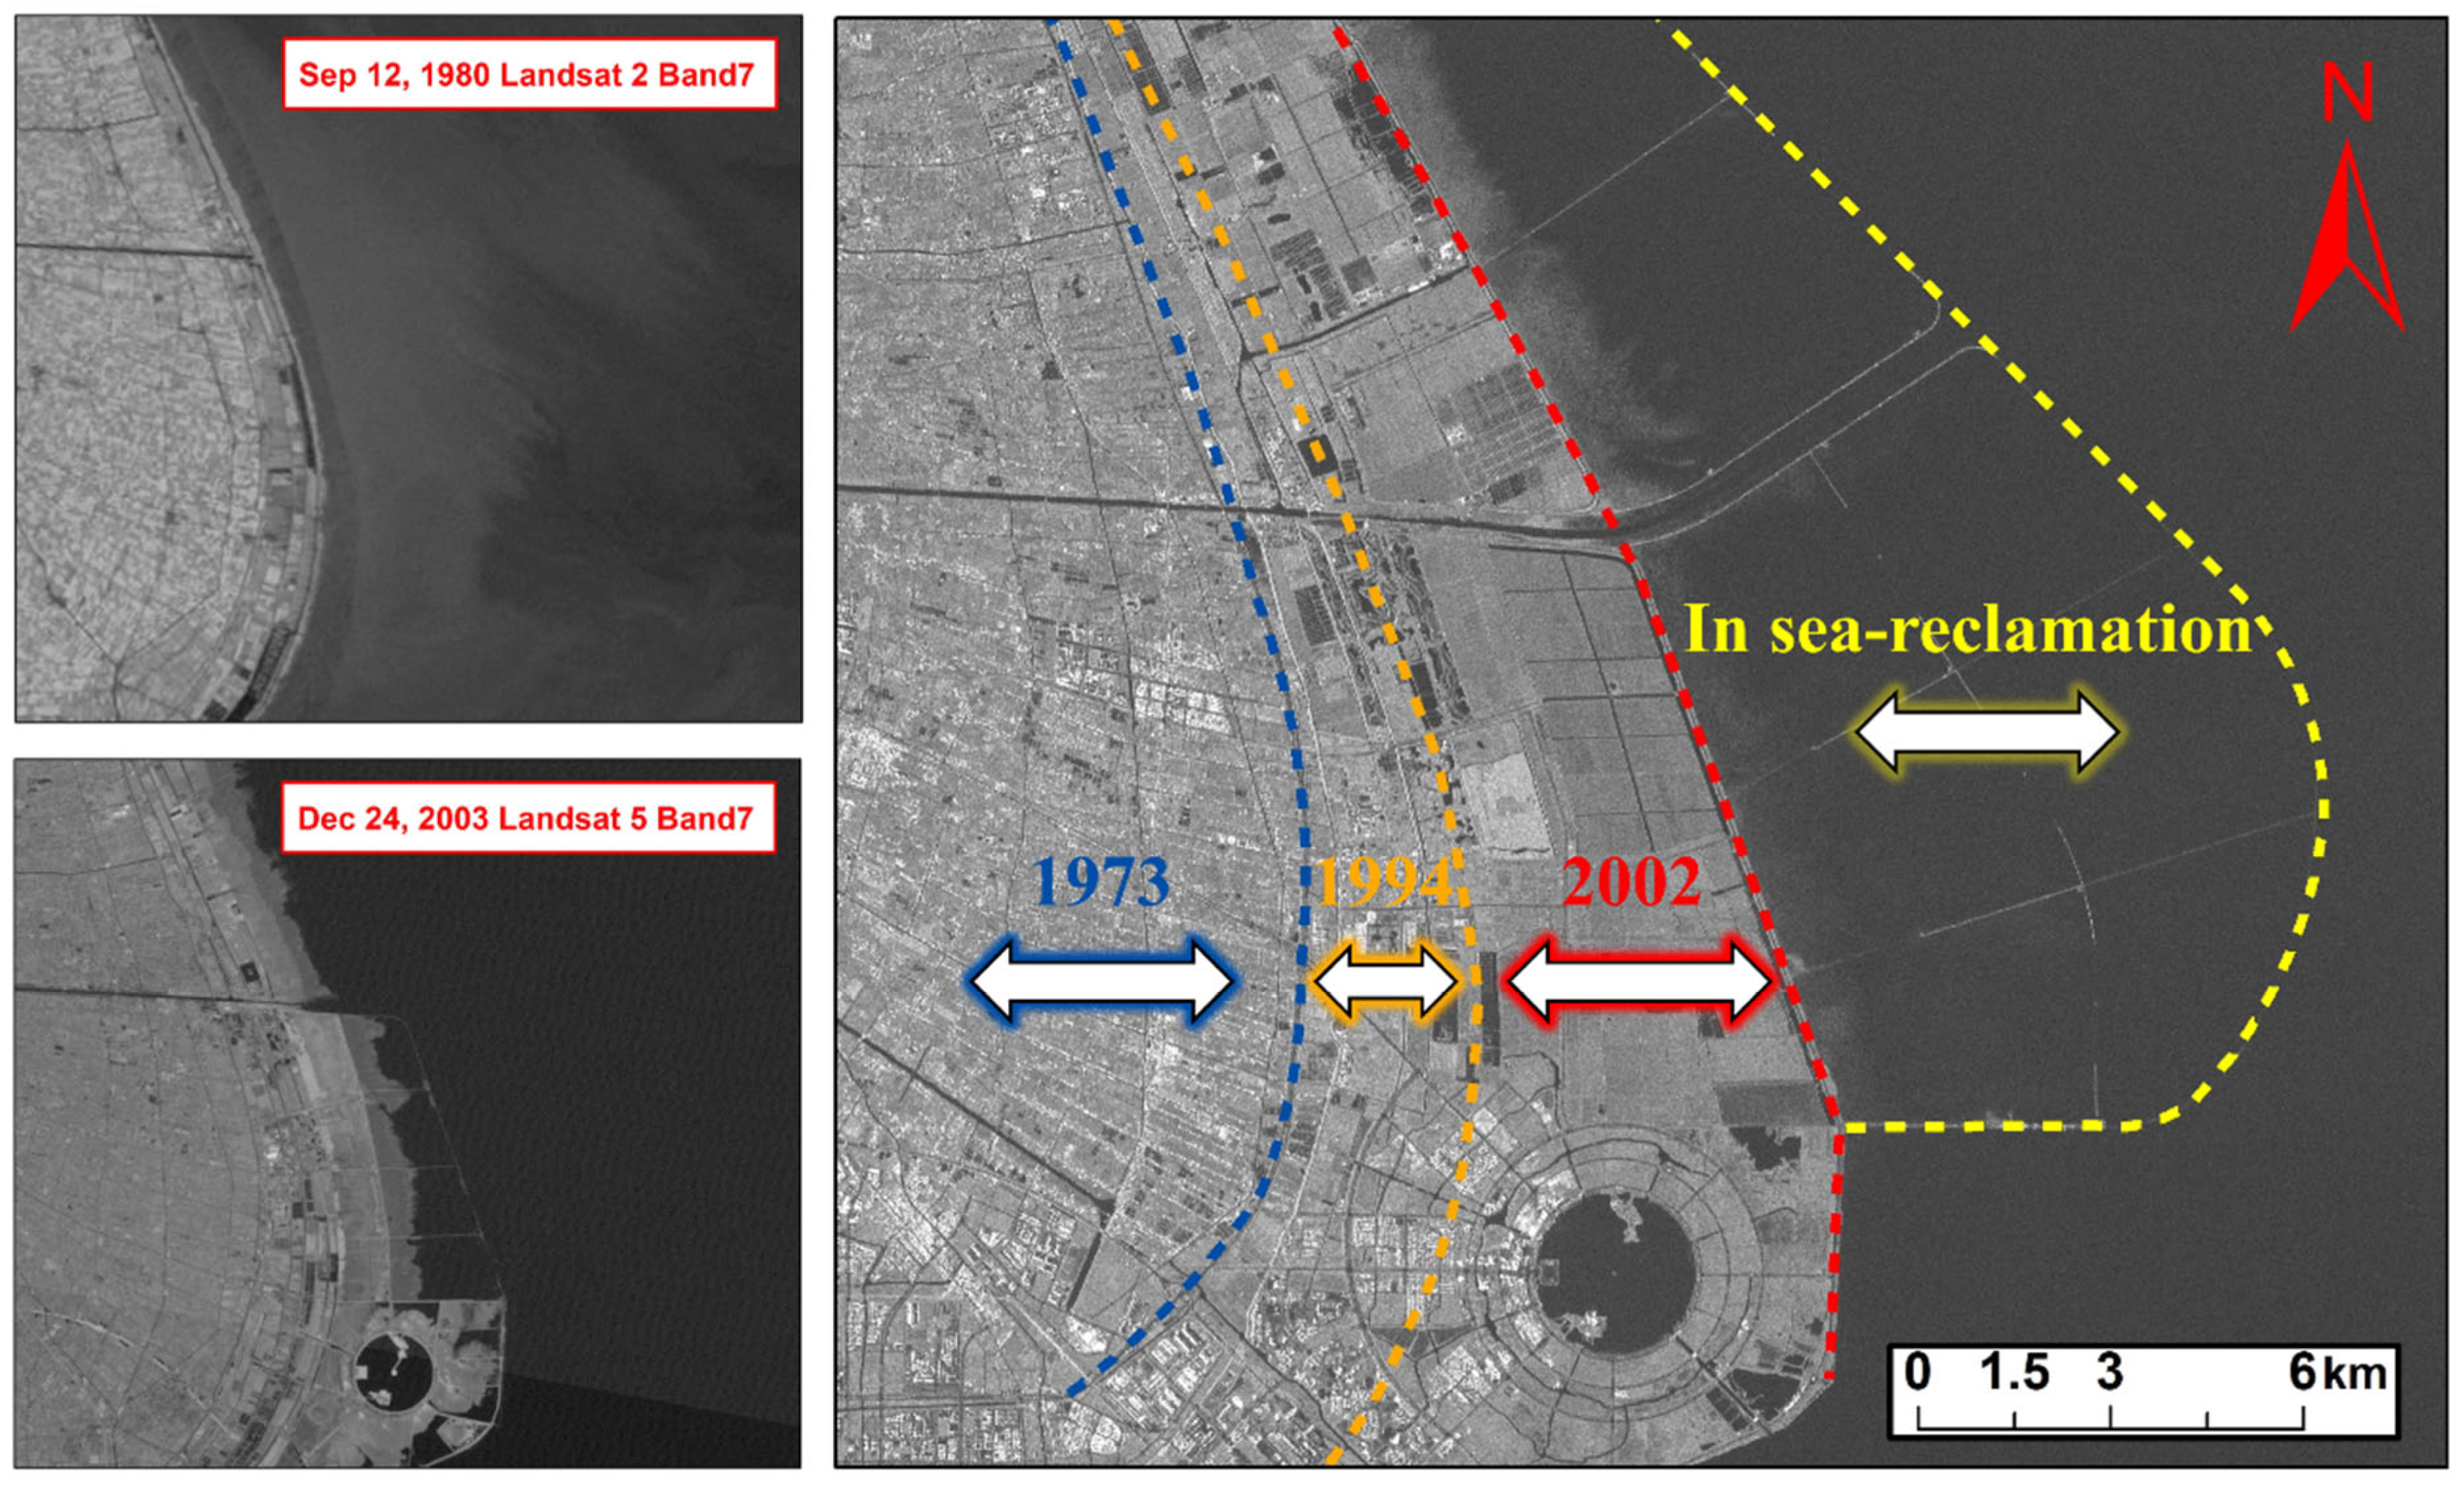
The demand for land construction increases with the rapid development of population and economy in Shanghai. In order to alleviate the demand for land construction, Shanghai has made many reclamations near its coast, especially in the eastern part. The reclamation project in Shanghai, which is mainly makes use of dredge fill, is the largest reclamation project in China [60,61,62]. As a result, monitoring the deformation caused by the natural consolidation of the surface after reclamation is of particular importance. The reclamation situation in Shanghai is illustrated in Figure 15.
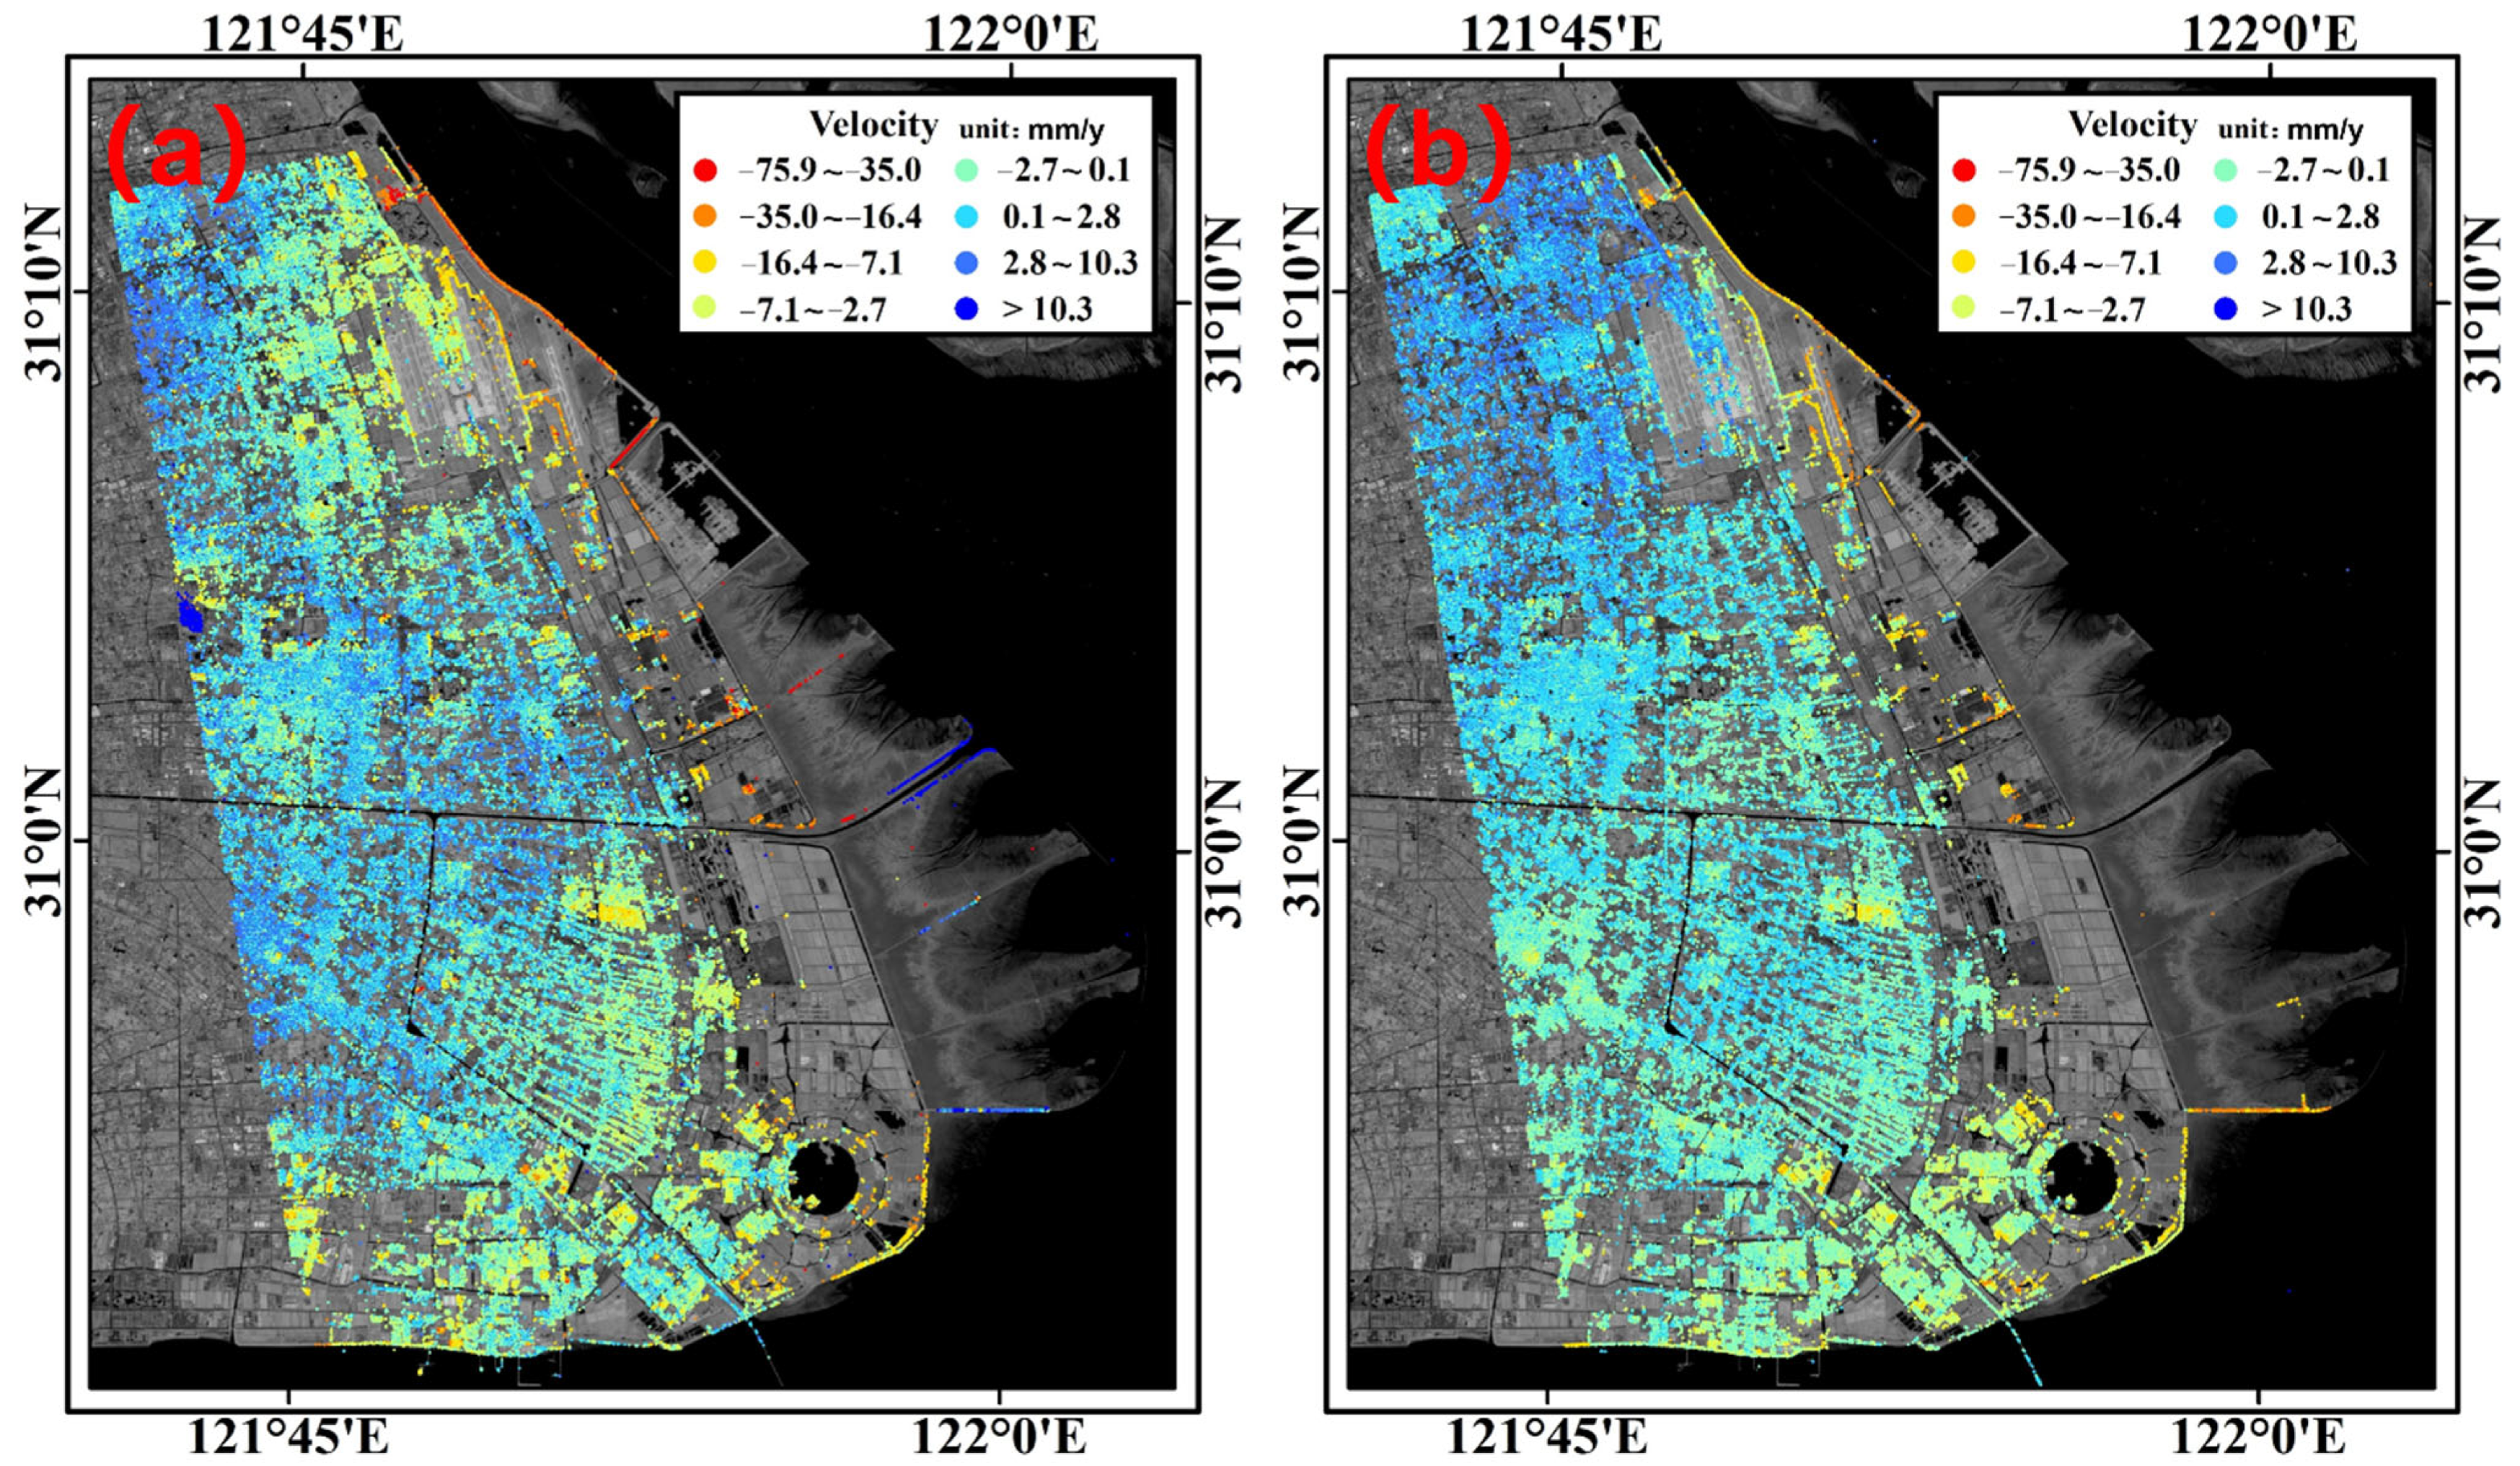
To further explore the deformation of the reclamation area in Shanghai, the present section divides the deformation of the eastern coastal reclamation area from May 2016 to December 2020 into two periods for performing further analysis. With the aim of increasing the number of detected PS points, the coherence threshold was set to 0.75, and the deformation rate field is obtained, as shown in Figure 16. After InSAR processing, 741,688 PS points were detected from May 2016 to December 2017, and 688,691 PS points were detected from January 2018 to December 2020. These PS points are mainly concentrated on sea dikes and buildings in the reclamation area. The distribution of PS points in the early reclamation area is relatively concentrated, and the distribution in the new reclamation area is comparatively discrete but can reflect the basic subsidence trend.
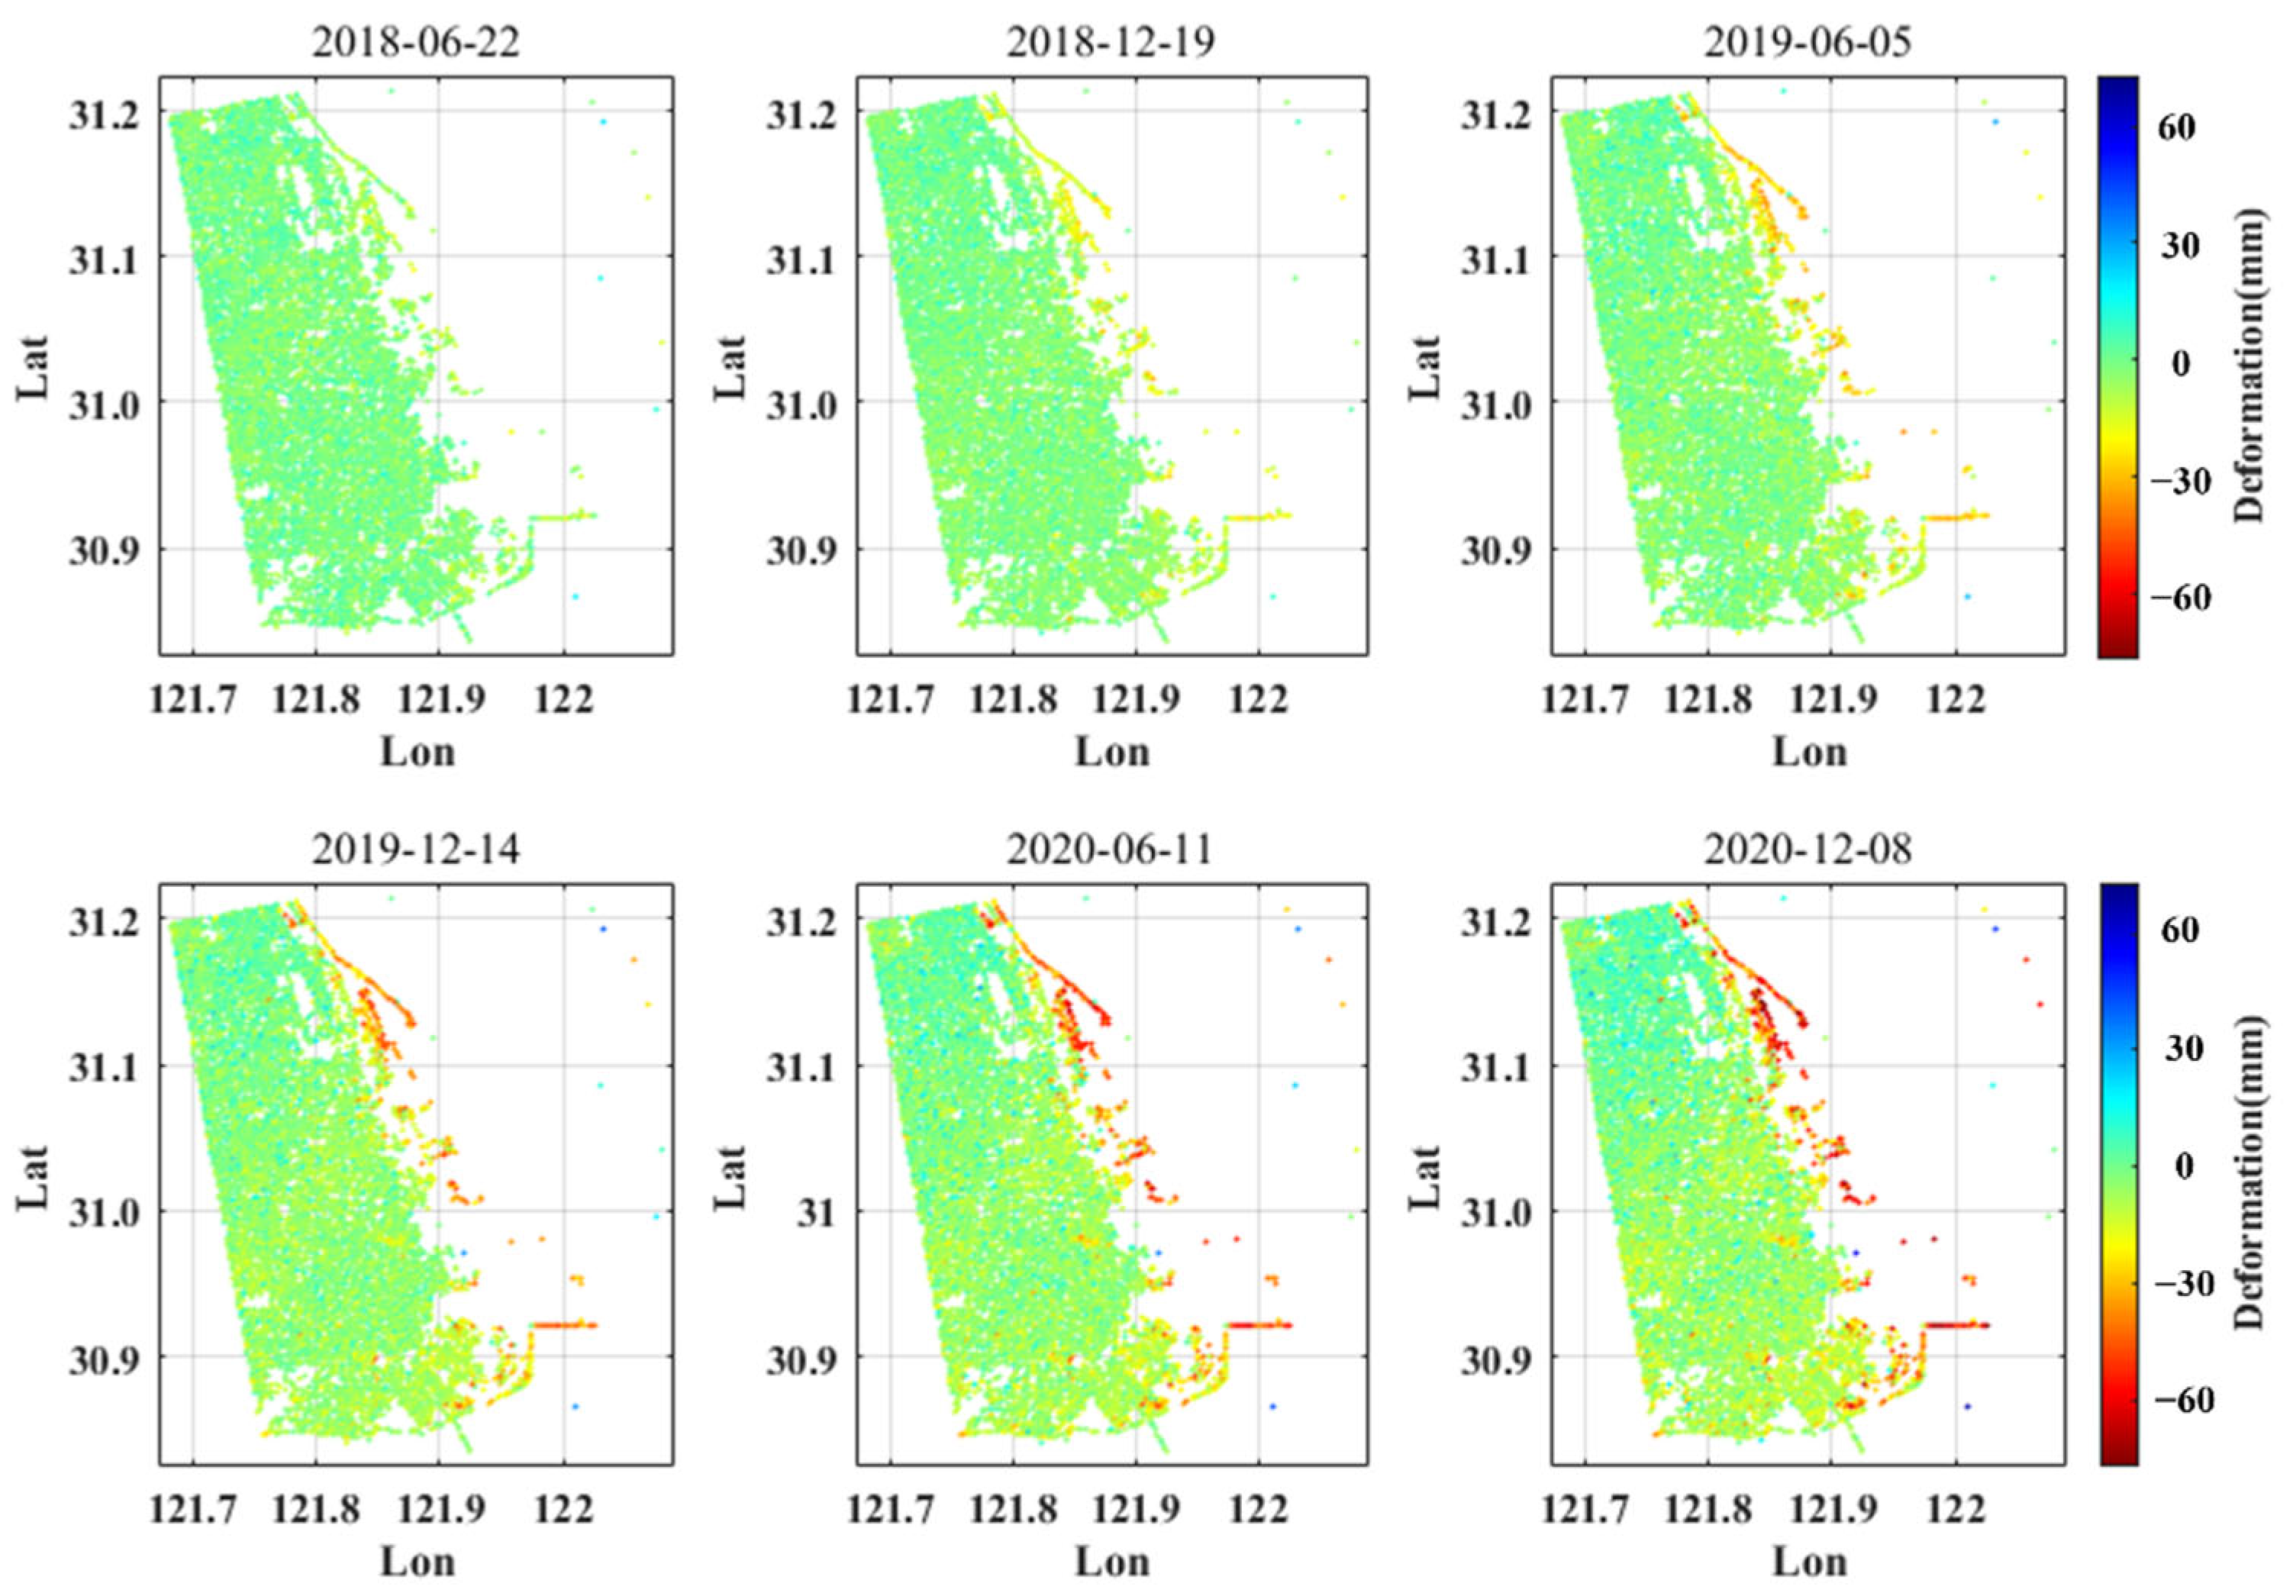
From 2016 to 2017, the subsidence of the new reclamation area in the eastern part of the reclamation area was relatively obvious, with the cumulative subsidence in some areas being approximately −50 mm. In addition, the subsidence of the polder embankment in the northeast is serious, and the maximum cumulative subsidence is −102.2 mm.
From 2018 to 2020, the key subsidence part of the reclamation area is still concentrated in the eastern dike, and the northeast dike is still the key subsidence area. However, the maximum cumulative subsidence is reduced to −76 mm, and the subsidence rate is relatively slow. The subsidence trend of other areas in the study area is relatively stable, and the cumulative subsidence is concentrated from 10 mm to −10 mm, further showing that the natural consolidation of the early reclamation area has been basically completed. The specific cumulative deformation is displayed in Figure 17.
In general, the surface of the new reclamation area in Shanghai presents a surface subsidence phenomenon dominated by natural consolidation, whereas the previous reclamation area has basically completed natural consolidation, and the surface deformation tends to remain stable without large deformation. The subsidence of the reclamation area is mainly concentrated on sea dikes. The cumulative subsidence during 2016–2017 is up to −102.2 mm whereas the subsidence rate generally shows a slowing trend. In the follow-up, the deformation monitoring of the sea dikes should be constantly strengthened in order to ensure the normal operation of land reclamation.

6. Conclusions

To conclude, based on the time series InSAR technology, this paper employs 61 Sentinel-1A’s TOPS image data to obtain the deformation rate field and cumulative deformation variables in a long time series in Shanghai from 2016 to 2020. Combined with the study in rainfall change, groundwater level change, and urbanization development in Shanghai, the spatial and temporal characteristics of land subsidence in Shanghai are investigated. The surface uplift phenomenon in Shanghai is explored in detail from the aspects of soil expansion and tidal change. The surface subsiding in the reclamation area of the east coast of Shanghai is detailed. The main research results are presented as follows:
(1) The uneven deformation of Shanghai, located in the eastern coastal area, in 2016–2020, is evident, with the maximum subsidence rate being −76.2 mm/y. Shanghai is generally stable in the north and has subsidence in the south. From the perspective of the time series, the surface subsidence in Shanghai tends to slow down. The proportion of PS points with a surface subsidence rate of over −5 mm/y in all PS points is decreased by 30.25%.
(2) The surface subsidence in Shanghai is influenced by several factors. The seasonal variation of groundwater level and precipitation and surface deformation have a certain correlation and a certain lag effect. Urban development and infrastructure construction are positively correlated with land subsidence. The distribution of soft soil foundation and the first and second hard soil layers in the shallow surface of Shanghai area is similar to the distribution of subsidence key areas, proving the influence of soil quality on the surface deformation in the Shanghai area.
(3) The surface uplift in Shanghai is mainly distributed in the northern region, especially in the coastal region. The sediment accumulation at the estuary of the Yangtze River not only increases the length of the regional coastline, but also supplements the land soil layer, causing the occurrence of surface uplift. In addition, we introduce tidal data for analysis. After extracting the trend of tide and average cumulative shape variable, we found that the correlation between the tide and average cumulative shape variable is obvious. Due to the influence of tides, the soil moisture and groundwater level in the coastal areas of Shanghai will change seasonally, thus, affecting the occurrence of surface uplift. Soil physical expansion caused by mei-yu weather and groundwater changes in Shanghai and soil chemical expansion caused by heavy metal pollution have become the factors responsible for the occurrence of surface uplift.
(4) The deformation of the reclamation area and negatively correlated with the completion time, indicating the longer the completion time of the reclamation area, the more stable the surface deformation will be. During the period from 2016 to 2020, the subsidence points in the reclamation area of the eastern coast of Shanghai are mainly concentrated on the surrounding dikes, and the cumulative subsidence shows a slow trend, which is associated with the natural consolidation of the reclamation area.

Author Contributions

All authors contributed to the manuscript and discussed the results. J.L. and L.Z. put forward the idea of this paper. J.L. processed and analyzed the sentinel data and contributed to the manuscript of the paper. L.Z. made criticism and revised the manuscript. Z.Z. analyzed the relationship between rainfall and ground subsidence. J.Q. analyzed the results of TS-InSAR. L.X. analyzed the deformation and made critical comments on the manuscript. D.Z. analyzed the deformation of the reclamation area and made critical comments on the manuscript. L.H. processes and analyzes the NPP-VIIRS data. All authors have read and agreed to the published version of the manuscript.

Funding

This work was supported by the Guangxi Science and Technology Plan Project (Grant Nos. GUIKE AD19110107 and GUIKE AD19245060); Science and technology project of State Grid Ningxia Electric Power Co., Ltd. (Grant No. SGTYHT/20-JS-221); the National Natural Science Foundation of China (Grant No. 42064002); the Natural Science Foundation of Guangxi (Grant No. 2020GXNSFBA159033); the Guangxi Spatial Information Key Laboratory of Surveying and Mapping (Grant No. 19-185-10-05); and the Natural Science Foundation of Hubei (Grant No. 2020CFB282).

Data Availability Statement

Data incorporated in this research is available free through these webpages: Sentinel-1A (https://scihub.copernicus.eu/dhus/#/home accessed on 20 December 2021), SRTM DEM (http://srtm.csi.cgiar.org/srtmdata. accessed on 12 December 2021), satellite precise orbit data (https://qc.sentinel1.eo.esa.int/aux_poeorb accessed on 20 December 2021).

Acknowledgments

Thanks to the Sentinel-1A image and satellite precise orbit data provided by ESA, AW3D30 data provided by JAXA, rainfall data provided by China National Meteorological Science Data Center, groundwater level data provided by the Shanghai Geological Data Information Sharing Platform and NPP-VIIRS data provided by NOAA. And the Anonymous Reviewers of Applied Sciences for their thorough review, and their instructive comments and suggestions.

Conflicts of Interest

The authors declare no conflict of interest.

References

  1. Hu, R.L.; Yue, Z.Q.; Wang, L.C.; Wang, S.J. Review on current status and challenging issues of land subsidence in China. Eng. Geol. 2004, 76, 65–77. [Google Scholar] [CrossRef]
  2. Ma, T.; Du, Y.; Ma, R.; Xiao, C.; Liu, Y. Review: Water–rock interactions and related eco-environmental effects in typical land subsidence zones of China. Hydrogeol. J. 2018, 26, 1339–1349. [Google Scholar] [CrossRef]
  3. Bagheri-Gavkosh, M.; Hosseini, S.M.; Ataie-Ashtiani, B.; Sohani, Y.; Ebrahimian, H.; Morovat, F.; Ashrafi, S. Land subsidence: A global challenge. Sci. Total Environ. 2021, 778, 146193. [Google Scholar] [CrossRef] [PubMed]
  4. China Statistics Press. China Statistical Yearbook; China Statistics Press: Beijing, China, 2021.
  5. Zhou, L.; Guo, J.M.; Li, X.; Hu, J.Y. Monitoring and analyzing on ground subsidence in Beijing area based on SBAS-InSAR. J. Geod. Geodyn. 2016, 36, 793–797. [Google Scholar]
  6. Poland, M.; Burgmann, R.; Dzurisin, D.; Lisowski, M.; Masterlark, T.; Owen, S.; Fink, J. Constraints on the mechanism of long-term, steady subsidence at Medicine Lake volcano, northern California, from GPS, leveling, and InSAR. J. Volcanol. Geotherm. Res. 2006, 150, 55–78. [Google Scholar] [CrossRef]
  7. Li, J.H.; Zhou, L.; Ren, C.; Liu, L.L.; Zhang, D.; Shi, Y.J. Spatiotemporal Inversion and Mechanism Analysis of Surface Subsidence in Shanghai Area Based on Time-Series InSAR. Appl. Sci. 2021, 11, 7460. [Google Scholar] [CrossRef]
  8. Massonnet, D.; Rossi, M.; Carnlona, C.; Adragna, F.; Peltzer, G.; Feigl, K.; Rabaute, T. The displacement field of the Landers earthquake mapped by radar interferometry. Nature 1993, 364, 138–142. [Google Scholar] [CrossRef]
  9. Atzori, S.; Hunstad, I.; Chini, M.; Salvi, S.; Tolomei, C.; Bignami, C.; Stramondo, S.; Trasatti, E.; Antonioli, A.; Boschi, E. Finite fault inversion of DInSAR coseismic displacement of the 2009 L’Aquila earthquake (central Italy). Geophys. Res. Lett. 2009, 36, L15305. [Google Scholar] [CrossRef]
  10. Zhou, L.; Guo, J.M.; Hu, J.Y.; Li, J.W.; Xu, Y.F.; Pan, Y.J.; Shi, M. Wuhan surface subsidence analysis in 2015–2016 based on sentinel-1A data by SBAS-InSAR. Remote Sens. 2017, 9, 982. [Google Scholar] [CrossRef]
  11. Blanco-Sanchez, P.; Mallorquí, J.J.; Duque, S.; Monells, D. The coherent pixels technique (CPT): An advanced DInSAR technique for nonlinear deformation monitoring. In Earth Sciences and Mathematics; Birkhäuser: Basel, Switzerland, 2008; Volume 165, pp. 1167–1193. [Google Scholar]
  12. Guo, J.M.; Zhou, L.; Yao, C.L.; Hu, J.Y. Surface Subsidence Analysis by Multi-Temporal InSAR and GRACE: A Case Study in Beijing. Sensors 2016, 16, 1495. [Google Scholar] [CrossRef]
  13. Yu, Q.; Yan, X.; Wang, Q.; Yang, T.; Lu, W.; Yao, M.; Dong, J.; Zhan, J.; Huang, X.; Niu, C.; et al. A spatial-scale evaluation of soil consolidation concerning land subsidence and integrated mechanism analysis at macro-, and micro-scale: A case study in Chongming East Shoal Reclamation Area, Shanghai, China. Remote Sens. 2021, 13, 2418. [Google Scholar] [CrossRef]
  14. Li, D.; Deng, K.Z.; Gao, X.X.; Niu, H.P. Monitoring and Analysis of Surface Subsidence in Mining Area Based on SBAS-InSAR. Geomat. Inf. Sci. Wuhan Univ. 2018, 43, 1531–1537. [Google Scholar]
  15. Zhao, Y.; Zhou, L.; Wang, C.; Li, J.; Qin, J.; Sheng, H.; Huang, L.; Li, X. Analysis of the Spatial and Temporal Evolution of Land Subsidence in Wuhan, China from 2017 to 2021. Remote Sens. 2022, 14, 3142. [Google Scholar] [CrossRef]
  16. Zhang, Z.; Lin, H.; Wang, M.; Liu, X.; Chen, Q.; Wang, C.; Zhang, H. A Review of Satellite Synthetic Aperture Radar Interferometry Applications in Permafrost Regions: Current Status, Challenges, and Trends. IEEE Geosci. Remote Sens. Mag. 2022, 1, 2–23. [Google Scholar] [CrossRef]
  17. Perissin, D.; Wang, Z.; Lin, H. Shanghai subway tunnels and highways monitoring through Cosmo-SkyMed Persistent Scatterers. ISPRS J. Photogramm. 2012, 73, 58–67. [Google Scholar] [CrossRef]
  18. Zhang, L.N.; Wu, J.C.; Li, T.; Chen, J. Monitoring Ground Deformation Based on Small Baseline Approach in Shanghai. J. Tongji Univ. (Nat. Sci.) 2012, 40, 1564–1568. [Google Scholar]
  19. Wang, R.; Yang, T.L.; Yang, M.S.; Liao, M.S.; Lin, J.X.; Zhang, L. Attribution Analysis on Deformation Feature of the Shanghai Elevated Highway by Persistent Scatterer SAR Interferometry. Geomat. Inf. Sci. Wuhan Univ. 2018, 43, 2050–2057. [Google Scholar]
  20. Yang, M.S.; Yang, T.L.; Zhang, L.; Lin, J.X.; Qin, X.X.; Liao, M.S. Spatio-Temporal Characterization of a Reclamation Settlement in the Shanghai Coastal Area with Time Series Analyses of X-, C-, and L-Band SAR Datasets. Remote Sens. 2018, 10, 329. [Google Scholar] [CrossRef]
  21. Ferretti, A.; Prati, C.; Rocca, F. Permanent scatterers in SAR interferometry. IEEE Trans. Geosci. Remote Sens. 2001, 39, 8–20. [Google Scholar] [CrossRef]
  22. Beradino, P.; Fornaro, G.; Lanari, R.; Sansosti, E. A new algorithm for surface deformation monitoring based on small baseline differential SAR interferograms. IEEE Trans. Geosci. Remote Sens. 2002, 40, 2375–2383. [Google Scholar] [CrossRef]
  23. Zhu, J.J.; Li, Z.W.; Hu, J. Research Progress and Methods of InSAR for Deformation Monitoring. Acta Geod. Cartogr. Sin. 2017, 46, 1717–1733. [Google Scholar]
  24. Zhang, Z.J.; Wang, C.; Wang, M.M.; Wang, Z.W.; Zhang, H. Surface deformation monitoring in Zhengzhou city from 2014 to 2016 using time-series InSAR. Remote Sens. 2018, 10, 1731. [Google Scholar] [CrossRef]
  25. Li, D.R.; Liao, M.S.; Wang, Y. Progress of permanent scatterer interferometry. Geomat. Inf. Sci. Wuhan Univ. 2004, 29, 10–24. [Google Scholar]
  26. Liu, Q.; Yue, G.S.; Ding, X.B.; Yuan, K.; Feng, G.C.; Xiong, Z.Q. Temporal and spatial characteristics analysis of Deformation along Foshan subway using time series InSAR. Geomat. Inf. Sci. Wuhan Univ. 2019, 44, 1099–1106. [Google Scholar]
  27. Chen, J.; Wu, J.; Zhang, L.; Zou, J.; Liu, G.; Zhang, R.; Yu, B. Deformation Trend Extraction Based on Multi-Temporal InSAR in Shanghai. Remote Sens. 2013, 5, 1774. [Google Scholar] [CrossRef]
  28. Yu, L.; Yang, T.L.; Zhao, Q.; Liu, M.; Pepe, A. The 2015–2016 Ground Displacements of the Shanghai Coastal Area Inferred from a Combined COSMO-SkyMed/Sentinel-1 DInSAR Analysis. Remote Sens. 2017, 9, 1194. [Google Scholar] [CrossRef]
  29. Zhao, J.W.; Wu, J.C.; Ding, X.L.; Wang, M.Z. Elevation Extraction and Deformation Monitoring by Multitemporal InSAR of Lupu Bridge in Shanghai. Remote Sens. 2017, 9, 897. [Google Scholar] [CrossRef] [Green Version]
  30. Qin, X.Q.; Yang, T.L.; Yang, M.S.; Zhang, L.; Liao, M.S. Health Diagnosis of Major Transportation Infrastructures in Shanghai Metropolis Using High-Resolution Persistent Scatterer Interferometry. Sensors 2017, 17, 2770. [Google Scholar] [CrossRef]
  31. Galloway, D.L.; Burbey, T.J. Review: Regional land subsidence accompanying groundwater extraction. Hydrogeol. J. 2011, 19, 1459–1486. [Google Scholar] [CrossRef]
  32. Garg, S.; Motagh, M.; Indu, J.; Karanam, V. Tracking hidden crisis in India’s capital from space: Implications of unsustainable groundwater use. Sci. Rep. 2022, 12, 651. [Google Scholar] [CrossRef]
  33. Famiglietti, J. The global groundwater crisis. Nat. Clim. Chang. 2014, 4, 945–948. [Google Scholar] [CrossRef]
  34. Shanghai Water Authority. Shanghai Water Resources Bulletin 2019; Shanghai Water Authority: Shanghai, China, 2019. [Google Scholar]
  35. Shanghai Water Authority. Shanghai Water Resources Bulletin 2020; Shanghai Water Authority: Shanghai, China, 2020. [Google Scholar]
  36. Zhou, L.; Li, J.H.; Wang, C.; Li, S.; Zhu, Z.L.; Lu, J.J. Analysis of Time Series InSAR Based Settlement Monitoring along the 2018- 2020 Metro Line in Shanghai Area. J. Geod. Geodyn. 2021, 41, 1177–1182. [Google Scholar]
  37. Chen, T.; Zhang, F.H.; Yu, C.; Ma, J.; Zhang, X.D.; Shen, X.L.; Zhang, F.; Luo, Q. Synoptic Analysis of Extreme Meiyu Precipitation over Yangtze River Basin During June–July 2020. Meteorol. Mon. 2020, 46, 1415–1426. [Google Scholar]
  38. Shi, M.; Gong, H.L.; Gao, M.L.; Chen, B.B.; Zhang, S.K.; Zhou, C.F. Recent ground subsidence in the North China Plain, China, revealed by sentinel-1A datasets. Remote Sens. 2020, 12, 3579. [Google Scholar] [CrossRef]
  39. Rateb, A.; Hermas, E. The 2018 long rainy season in Kenya: Hydrological changes and correlated land subsidence. Remote Sens. 2020, 12, 1390. [Google Scholar] [CrossRef]
  40. Wasowski, J.; Pisano, L. Long-term InSAR, borehole inclinometer, and rainfall records provide insight into the mechanism and activity patterns of an extremely slow urbanized landslide. Landslides 2020, 17, 445–457. [Google Scholar] [CrossRef]
  41. Levin, N.; Kyba, C.C.M.; Zhang, Q.L.; Miguel, A.S.D.; Román, M.O.; Li, X.; Portnov, B.A.; Molthan, A.L.; Jechow, A.; Miller, S.D.; et al. Remote sensing of night lights: A review and an outlook for the future. Remote Sens. Environ. 2020, 237, 111443. [Google Scholar] [CrossRef]
  42. Li, X.; Elvidge, C.; Zhou, Y.; Cao, C.Y.; Warner, T. Remote sensing of night-time light. Int. J. Remote Sens. 2017, 38, 5855–5859. [Google Scholar] [CrossRef]
  43. Wu, H.W.; Li, Q.; Liu, G.B. Characteristics of one-dimensional compressibility of Shanghai clay. Chin. J. Geotech. Eng. 2011, 33, 630–636. [Google Scholar]
  44. He, P.; Wang, W.D.; Xu, Z.H. Empirical correlations of compression index and swelling index for Shanghai clay. Rock Soil Mech. 2018, 39, 3773–3782. [Google Scholar]
  45. Gao, G.Y.; Chen, Q.S.; He, J.F.; Zhang, X.L. Effect of rise of groundwater table on seismic ground response of soft soil in Shanghai. Chin. J. Geotech. Eng. 2011, 33, 989–995. [Google Scholar]
  46. Xu, S.; Chen, Y.L.; Zhao, C.X. One-dimensional consolidation tests of creep deformation and secondary consolidation charhcteristics of soft soils in Shanghai area. J. Eng. Geol. 2008, 16, 65–71. [Google Scholar]
  47. Wei, Z.X. Geological Atlas of Shanghai City; Geological Publishing House: Beijing, China, 2010. [Google Scholar]
  48. Han, Y.; Du, J.; Song, K.S.; Ma, X.Y.; Zhang, D.F. Land Use Pattern and Its Change in the Mouth of Yangtze River for 5 Periods. Wetland Sci. 2017, 15, 608–612. [Google Scholar]
  49. Dai, Z.J.; Mei, X.F.; Darby, S.E.; Lou, Y.Y.; Li, W.H. Fluvial sediment transfer in the Changjiang (Yangtze) river-estuary depositional system. J. Hydrol. 2018, 566, 719–734. [Google Scholar] [CrossRef] [Green Version]
  50. Lei, M.F.; Wang, Q.J.; Liu, X.L.; Xu, B.; Zhang, H.Q. Influence of ocean tidal loading on InSAR offshore areas deformation monitoring. Geod. Geodyn. 2017, 8, 70–76. [Google Scholar] [CrossRef]
  51. Li, J.; Jiang, H.K. A Reviw on Tidal Triggering of Earthquakes. Earthquake 2011, 31, 36–47. [Google Scholar]
  52. Bredehoeft, J.D. Response of well-aquifer systems to earth tides. J. Geophys. Res. 1967, 72, 3075–3087. [Google Scholar] [CrossRef]
  53. Van Camp, M.; Vauterin, P. Tsoft: Graphical and interactive software for the analysis of time series and Earth tides. Comput. Geosci. 2005, 31, 631–640. [Google Scholar] [CrossRef]
  54. Melchior, P. Earth tides. Geophys. Surv. 1974, 1, 275–303. [Google Scholar] [CrossRef]
  55. Talke, S.A.; Jay, D.A. Changing Tides: The Role of Natural and Anthropogenic Factors. Annu. Rev. Mar. Sci. 2020, 12, 121–151. [Google Scholar] [CrossRef]
  56. Xie, P.; Zhang, S.X.; Zhou, L.; Li, X.L.; Xiao, J.H.; Cai, J.F. Detection of the Urban Surface Deformation and New Strategy for Flood Prevention in Wuhan Central District. Geomat. Inf. Sci. Wuhan Univ. 2021, 46, 1015–1024. [Google Scholar]
  57. Carlson, T.N.; Gillies, R.R.; Schmugge, T.J. An interpretation of methodologies for indirect measurement of soil water content. Agr. Forest Meteorol. 1995, 77, 191–205. [Google Scholar] [CrossRef]
  58. Smiles, D.E. Hydrology of swelling soils: A review. Soil Res. 2000, 38, 501–521. [Google Scholar] [CrossRef]
  59. Xiao, J.; Guo, J.X.; Chang, J.; Yang, H.P.; Chen, G.Y. Effect of acid rain on swelling property and microstructure of natural expansive soil. Arab. J. Geosci. 2022, 15, 25. [Google Scholar] [CrossRef]
  60. Shi, Y.; Huang, C.J.; Shi, S.; Gong, J.Y. Tracking of Land Reclamation Activities Using Landsat Observations—An Example in Shanghai and Hangzhou Bay. Remote Sens. 2022, 14, 464. [Google Scholar] [CrossRef]
  61. Tang, M.; Zhao, Q.; Pepe, A.; Devlin, A.T.; Falabella, F.; Yao, C.F.; Li, Z.J. Changes of Chinese Coastal Regions Induced by Land Reclamation as Revealed through TanDEM-X DEM and InSAR Analyses. Remote Sens. 2022, 14, 637. [Google Scholar] [CrossRef]
  62. Ma, G.; Zhao, Q.; Wang, Q.; Liu, M. On the effects of InSAR temporal decorrelation and its implications for land cover classification: The case of the ocean-reclaimed lands of the Shanghai megacity. Sensors 2018, 18, 2939. [Google Scholar] [CrossRef] [Green Version]
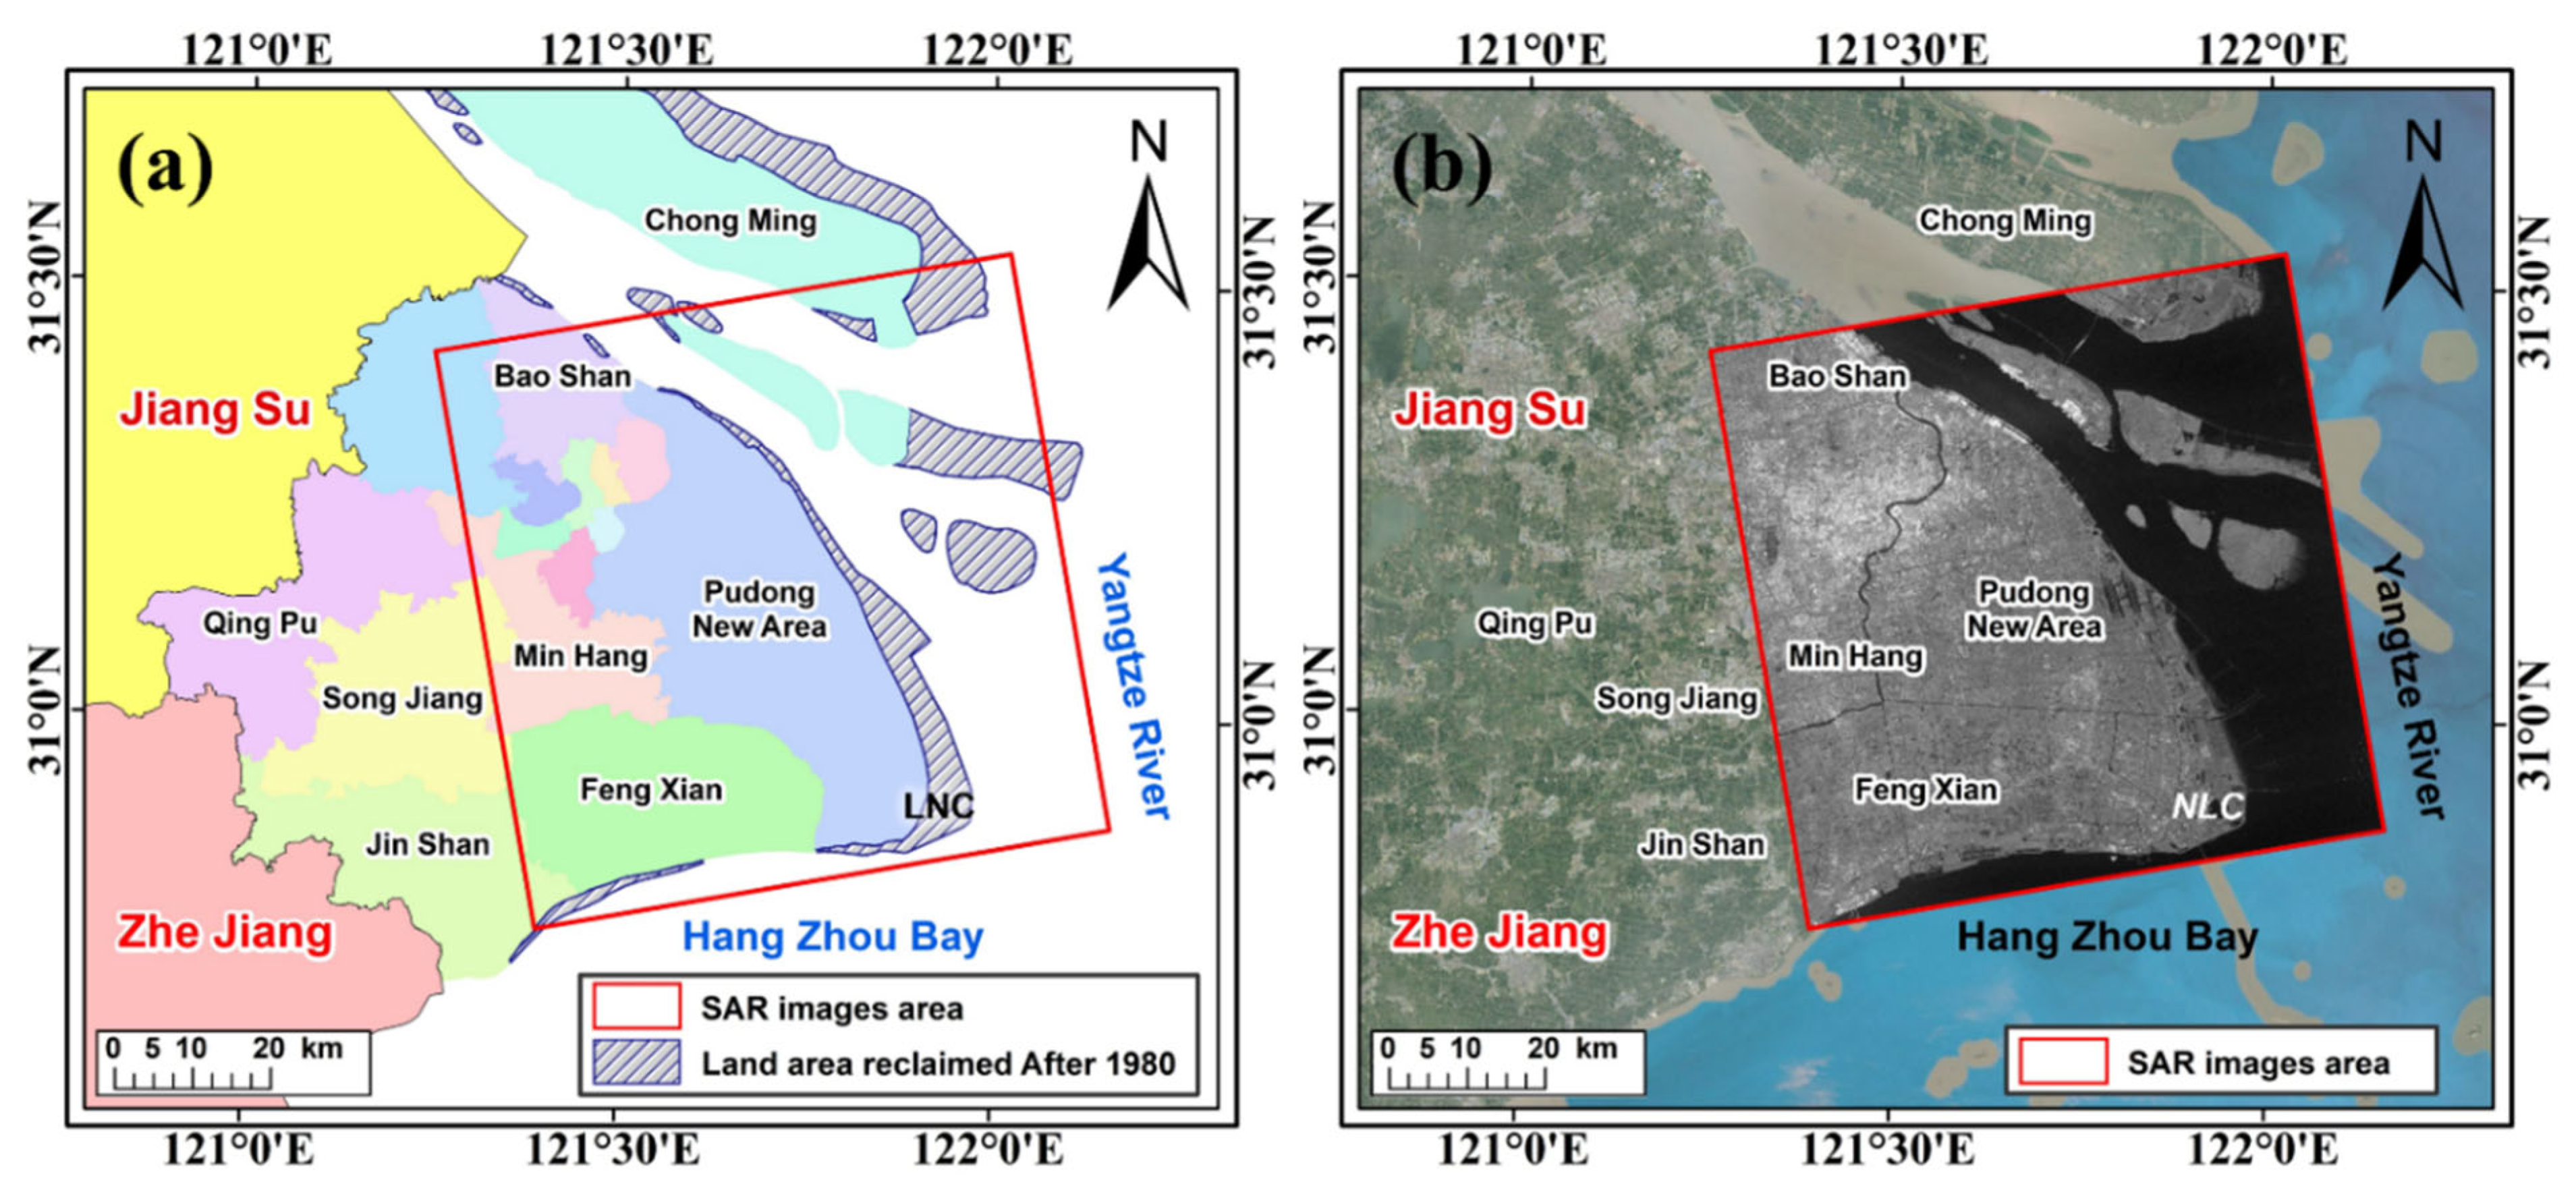
Figure 1. Location of the study area; (a) The red outline shows the SAR image coverage area of Sentinel-1A, and the colored plate shows the administrative division near Shanghai; (b) the red outline displays Sentinel-1A SAR images.
Remotesensing 14 04368 g001
Figure 2. Spatial and temporal distribution of data. The green star is the location of water level wells, the blue triangle is the tide monitoring station of Wuhaogou, and the red circle is the location of PS feature points with different spatial distributions.
Remotesensing 14 04368 g002
Figure 5. Subsidence in the Shanghai area. (a) Surface subsidence rate in Shanghai from May 2016 to December 2017; (b) surface subsidence rate in Shanghai from January 2018 to December 2020. The red star is the reference point of data processing; (c) cumulative surface subsidence in Shanghai from May 2016 to December 2017; (d) cumulative surface subsidence in Shanghai from January 2018 to December 2020. The purple pentagram is the reference point.
Remotesensing 14 04368 g005
Figure 6. Standard deviation statistics of deformation information in the Shanghai area obtained by time series InSAR technique. (a) Standard deviation of deformation information in 2016–2017; (b) standard deviation of deformation information in 2018–2020.
Remotesensing 14 04368 g006
Figure 7. Changes in time series of feature points. (a) Cumulative subsidence changes of feature points a–g from June 2016 to December 2017; (b) cumulative subsidence changes of feature points a–g from January 2018 to December 2020. The black dotted line is the 0 mm deformation line.
Remotesensing 14 04368 g007
Figure 8. Statistical chart of the change in deformation information in Shanghai region from 2016 to 2020.
Remotesensing 14 04368 g008
Figure 9. Comparison of groundwater level and average cumulative deformation variables. (ad) are the changes of groundwater level wells a-d respectively.
Remotesensing 14 04368 g009
Figure 10. Regional rainfall versus average accumulated deformation. (a,b) are rainfall variation maps of two meteorological observation points in Shanghai.
Remotesensing 14 04368 g010
Figure 11. Here, (a) shows the change in nighttime light in the Shanghai area from 2016–2018; (b) shows the change in nighttime light in the Shanghai area from 2018–2020.
Remotesensing 14 04368 g011
Figure 12. Geological type distribution map (Area a—solid and stable foundation; area b—relatively stable foundation; Area c—foundation with poor stability).
Remotesensing 14 04368 g012
Figure 13. Time series change in the Yangtze River Estuary. (a) Landsat 2 Band7 in September 1980; (b) Landsat 5 Band7 in December 2003; (c) Landsat 8 Band7 in December 2020; (d) accumulated deformation at the estuary during 2016–2017; (e) accumulated deformation at the estuary during 2018–2020.
Remotesensing 14 04368 g013
Figure 14. (a) Variation of daily high and low tide at Wuhaogou tidal station in 2020; (b) Comparison of average tide height and average cumulative subsidence at Wuhaogou tidal station.
Remotesensing 14 04368 g014
Figure 15. Reclamation area in Shanghai (the blue, orange and red lines are the borders up to 1973, 1994, and 2002, respectively, while the yellow line is an area currently being filled).
Remotesensing 14 04368 g015
Figure 16. Deformation rates for 2016–2020 in the eastern coastal reclamation area of Shanghai: (a) from May 2016 to December 2017 and (b) from January 2018 to December 2020.
Remotesensing 14 04368 g016
Figure 17. Temporal variation of cumulative variables relative to 2018-01-17.
Remotesensing 14 04368 g017
Table 1. Basic parameters of SAR images.
ParameterValue
Band (wavelength in cm)C (5.6 cm)
Imaging modeSentinel-1A IW
Number of images61
Pass directionAscending
Time spanFrom 15 May 2016 to 8 December 2020
Table 2. Summary of the previous studies of land subsidence in Shanghai.
StudyBandMethodPeriodResearch ObjectDeformation RATE
Perissin, et al. (2012) [17]XPS-InSAR2008–2010Major subways and highways−40 mm/y~40 mm/y
Chen, et al. (2013) [27]XMT-InSAR2007–2010Main urban surface−21.6 mm/y~12.8 mm/y
Yu, et al. (2017) [28]X/CD-InSAR2015–2016Coastal areas−30 mm/y~30 mm/y
Zhao, et al. (2017) [29]XPS-InSAR2008–2010Lupu Bridge−10 mm/y~10 mm/y
Qin, et al. (2017) [30]XPS-InSAR2013–2016Major transportation lines−22 mm/y~6 mm/y
Yang, et al. (2018) [20]X/C/LTS-InSAR2007–2010New Lingang City−35 mm/y~10 mm/y
Publisher’s Note: MDPI stays neutral with regard to jurisdictional claims in published maps and institutional affiliations.