Technical Note

Insights into the Landslides Triggered by the 2022 Lushan Ms 6.1 Earthquake: Spatial Distribution and Controls

1
Key Laboratory of Mountain Hazards and Earth Surface Processes, and Institute of Mountain Hazards and Environment, Chinese Academy of Sciences, Chengdu 610041, China
2
State Key Laboratory of Geohazard Prevention and Geoenvironment Protection, Chengdu University of Technology, Chengdu 610059, China
3
China-Pakistan Joint Research Center on Earth Sciences, Islamabad 45320, Pakistan
4
University of Chinese Academy of Sciences, Beijing 100049, China
*
Author to whom correspondence should be addressed.
Remote Sens. 2022, 14(17), 4365; https://doi.org/10.3390/rs14174365
Submission received: 29 July 2022 / Revised: 25 August 2022 / Accepted: 30 August 2022 / Published: 2 September 2022

Abstract

:
On 1 June 2022, a magnitude Ms 6.1 (Mw 5.8) earthquake, named the 2022 Lushan earthquake, struck the southern segment of the Longmenshan fault zone, with an epicenter at 30.395°N, 102.958°E and a focal depth of approximately 12.0 km. To gain insight into the landslides triggered by this event and the characteristics of coseismic landslides in the Longmenshan fault zone, we collected multitemporal satellite images and carried out field investigations. The results reveal that the 2022 Lushan event triggered at least 1288 landslides over an affected area of 1470 km2. The total landslide area is 5.33 km2, and the highest landslide concentration reaches 22.3 landslides/km2. The landslide distribution has a hanging wall effect, and the right bank area of the Qingyi River, featuring deep-cutting gorges, is part of an area with obvious concentrated landslides; this area consists mainly of intrusive rocks, including granite, gabbro and hornblende. The coseismic landslides in the Longmenshan fault zone have hanging wall effects, and the landslides triggered by the 2022 Lushan event are distributed in higher and steeper areas.

Graphical Abstract

1. Introduction

Coseismic landslides, which are triggered by earthquakes, occur worldwide and can cause severe damage to life and livelihoods [1,2]. Coseismic landslides are also important mass-wasting phenomena caused by the detachment of large masses from slopes during seismic shaking [3,4,5], and some studies have indicated that coseismic mass wasting may restrict mountain growth [6]. Accordingly, a fundamental understanding of the occurrence, spatial distribution and corresponding factors influencing coseismic landslides can provide crucial guidance for disaster prevention and mitigation, post-disaster reconstruction measures, and regional landscape evolution [7,8,9,10].
Although seismic events are widespread, not every earthquake can trigger landslides, and some basic conditions are required, including mountains with relatively steep slopes, fractured rocks or loose deposits, and movement space [2,11,12,13,14,15]; the eastern and southern margins of the Qinghai–Tibetan Plateau are well-known coseismic landslide-prone areas [2,4,16,17,18,19]. In recent decades, some earthquakes have triggered numerous landslides in these areas; for example, the 2005 Kashmir Mw 7.6, 2015 Gorkha Mw 7.8 and 2017 Nyingchi Mw 6.4 earthquakes on the southern margin triggered 2930, 47,200 and 3130 landslides, respectively [20,21,22]; the 2008 Wenchuan Mw 7.9, 2010 Yushu Mw 6.9, 2013 Lushan Mw 6.6 and 2017 Jiuzhaigou Mw 6.5 earthquakes on the eastern margin triggered 197,481, 2036, 15,645 and 5633 landslides, respectively [23,24,25]. On the eastern margin of the Qinghai–Tibetan Plateau, the Longmenshan fault zone may be a typical coseismic landslide-prone area, in which landslides have occurred as a result of the 2008 Wenchuan and 2013 Lushan earthquakes [26].
For coseismic landslides triggered by individual earthquakes, their distributions and sizes are usually influenced by some physical factors, including slopes, rocks, faults, seismic shaking, and elevation [1,2]. Keefer first collected landslide data on 40 worldwide seismic events to determine the relationship between the spatial distribution and seismic parameters and noted several factors controlling landslide occurrence, such as the distance to the epicenter and surface rupture zone [1]. Subsequent studies extended this scope, and some principles have been generally accepted; the landslide-affected area, landslide volume, and maximum distance from the source area to the seismogenic fault generally increase with increasing earthquake magnitude [1,2,11,27]. The nearby seismogenic fault area usually exhibits stronger seismic shaking and is typically prone to coseismic landslides [28]. However, local geological parameters, such as stratigraphy, topography, climate conditions, active faults, and tectonic regime, also influence landslide occurrence [2,9,29]. Thus, to analyze landslides triggered by a certain earthquake, it is necessary to distinguish the factors controlling the spatial and size distributions of coseismic landslides.
On 1 June 2022, a magnitude Ms 6.1 (Mw 5.8) earthquake struck the Longmenshan fault zone, and it was the third earthquake with a magnitude (Ms) > 6.0 in the Longmenshan fault zone following the 2008 Wenchuan and 2013 Lushan earthquakes [30]. Thus, to understand coseismic landslides triggered by this event, this study establishes a complete landslide inventory and analyzes the spatial and size distributions and corresponding controls.

2. Study Area

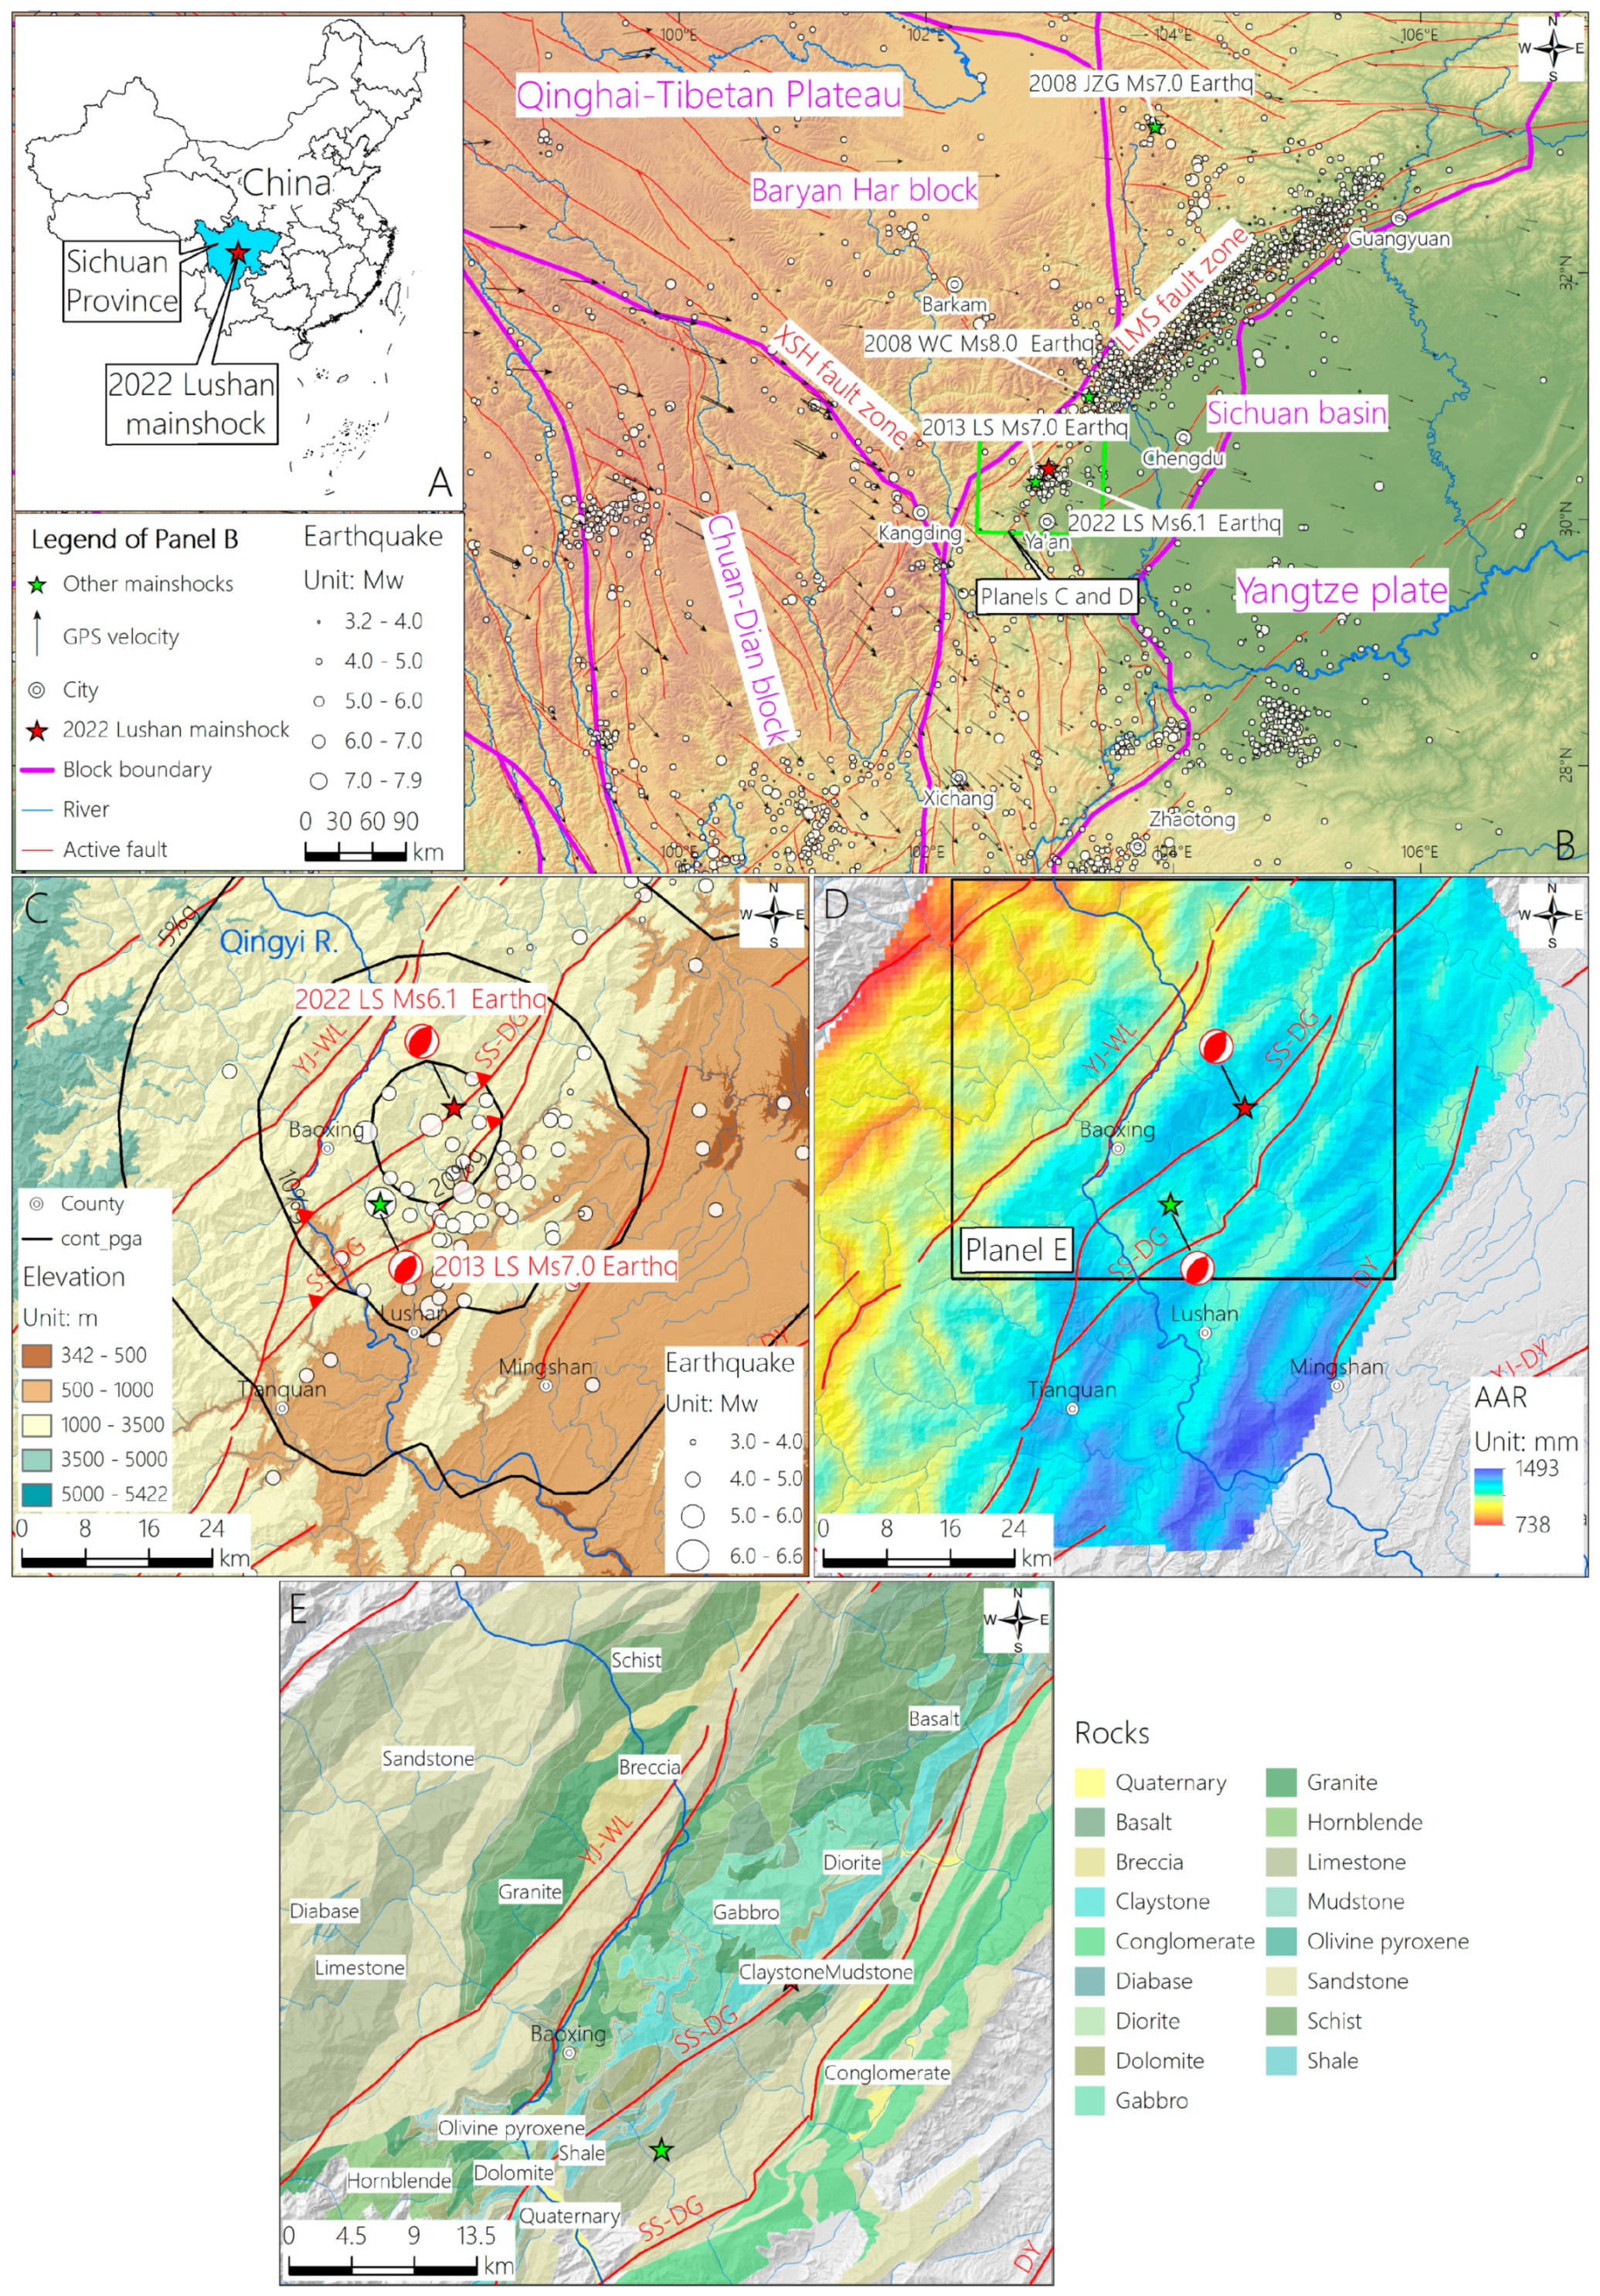
2.1. Regional Setting

The 2022 Lushan earthquake occurred in Lushan County, Sichuan Province, China (Figure 1A), which is located in the Longmenshan fault zone (Figure 1B). The Longmenshan fault zone is located on the eastern margin of the Qinghai–Tibetan Plateau and is part of the transition zone between the Baryan Har fault block and stable Sichuan Basin (Figure 1B) [31,32]. Regional global positioning system (GPS) measurements near the Longmenshan fault zone present an obvious decrease from more than 10 mm/yr in the Baryan Har fault block to less than 6 mm/yr in the Sichuan Basin [33], and much strain energy accumulates in this area [34]. The Longmenshan fault zone consists of a series of reverse faults, including the Wenchuan–Maoxian (also called the back-range fault), Yingxiu–Beichuan (also called the central fault), and Guanxian–Anxian (also called the front-range fault) faults [35]. Most faults in this zone are related to the convergence of crustal material moving slowly from the high Tibetan Plateau to the west against the strong crust underlying the Sichuan Basin and southeastern China [24,30].
There is no doubt that the Longmenshan fault zone is very active, and numerous earthquakes have occurred in this zone (Figure 1B) [36]. In the past 20 years, 19 other earthquakes of Mw 5 and larger have occurred within 100 km of the 2022 event (Figure 1B) [30]. In addition, the Longmenshan fault zone experiences an intense elevation drop of more than 3000 m from more than 4000 m in the Qinghai–Tibetan Plateau to less than 500 m in the Sichuan Basin [37]. Numerous rivers also cut this area into deep gorges [38,39].
The 2022 Lushan event occurred on the southern segment of the Longmenshan fault zone; the epicenter was only approximately 15 km from that of the 2013 earthquake (Figure 1B), and the maximum peak ground acceleration (PGA) reached 0.32 g (Figure 1C). The Shuangshi–Daguan (SS-DG) fault is considered the seismogenic fault, which was the same seismogenic fault as that of the 2013 Lushan earthquake (Figure 1C) [30,40,41]. The focal mechanism of the 2022 Lushan event indicates that the rupture occurred on a moderately northwest-dipping reverse fault, which is similar to the 2013 event, while the focal depth of the 2022 event (10 km) was shallower than that of the 2013 event (14 km; Figure 1C) [30,41].
The topography of the 2022 earthquake-affected area includes a deep-cutting gorge, with elevations ranging from 1000–3500 m, and the river basin is mainly part of the Qingyi River basin (Figure 1C). The annual average rainfall varies from 700–1500 mm/yr, and the annual rainfall intensity along the Shuangshi–Daguan fault varies from 1100–1300 mm/yr (Figure 1D). The stratigraphic units in the earthquake-affected area range from the pre-Paleozoic to Quaternary periods and are dominated by Cretaceous and Triassic strata; for rock types, granite, gabbro, hornblende, limestone, schist, sandstone, mudstone, and shale are the main rock types in the study area (Figure 1E) [23].

2.2. Landslide Mapping

This study mainly focuses on the spatial and size distributions of coseismic landslides triggered by the 2022 Lushan event; thus, a complete landslide inventory may be crucial. To establish a relatively complete landslide inventory, we adopt field investigation and remote sensing interpretation (Figure 2).
Approximately three days after the mainshock, we carried out a field investigation before the remote sensing interpretation (Figure 2). During the field investigation, we preliminarily mapped the typical characteristics of coseismic landslides, including potential landslide patterns and landslide compositions, and confirmed the coseismic landslide mapping area. Additionally, the field investigation enhanced later landslide mapping accuracy, as numerous coseismic landslides were investigated during the field survey.
For remote sensing interpretation, we collected multiple high-resolution satellite images from before and after the 2022 Lushan event, as shown in Figure 2. The multiple images from after the 2022 event mainly consist of Sentinel 2 images (resolution: 10 m), Planet images (resolution: 3 m) and unmanned aerial vehicle (UAV) images (resolution < 1 m). The multitemporal Sentinel 2 images (28 June 2022, 3 July 2022 and 6 July 2022) were adopted to clarify the basic spatial distribution of coseismic landslides and to confirm the coseismic landslide mapping area together with previous field investigations (coseismic landslide mapping area: 2036 km2, black box in Figure 2). Then, based on this mapping area, we collected the corresponding high-resolution Planet image from 7 July 2022, as this image is the first no-cloud image after the seismic event (Figure 2). Small regional UAV images (30 km2) after the 2022 Lushan event near Baoxing County were also collected. For satellite images before the 2022 Lushan event, we collected the latest Sentinel 2 images with no clouds on 4 May 2022 (Figure 2).
In this study, the landslide inventories contain two sub-inventories, i.e., a coseismic landslide inventory and preexisting landslide inventory. The coseismic landslide mapping procedure can be summarized as follows: i. first, we imported Planet (post-earthquake), UAV (post-earthquake) and Sentinel 2 (pre-earthquake) images to the GIS platform (Arcgis 10.2); ii. we established a polygon file (shp file) and used this polygon file to map coseismic landslide boundaries according to satellite images pre- and post-earthquake; iii. as the coseismic landslides were also divided into newly triggered landslides and reactivated landslides, we classified the characteristics of every coseismic landslide and completed the landslide inventory. The preexisting landslide inventory includes landslides that existed before the 2022 Lushan earthquake, and its establishment procedure was similar to that of the coseismic landslide inventory.

2.3. Relevant Data Preparation

In this study, topographic, geological, climate, and seismic data were collected to analyze the regional setting and evaluate the influencing factors. The topographic data contain elevation, slope, aspect and local relief. The elevation data were digital elevation models with 30 m resolution that were downloaded from ALOS World 3D—30 m (https://www.eorc.jaxa.jp/ALOS/en/aw3d30/data/index.htm (accessed on 10 July 2022)). Slope and aspect were both directly derived from the 30 m DEM on the GIS platform, and local relief was calculated as the maximum elevation difference from the DEM data in a moving window of a 5-km radius.
Geological data contain lithology data and active faults, the lithology data are from a digitized 1:250, 000 geological map, and active faults are from [31]. Seismic data contain the regional earthquake inventory and PGA data of the 2022 Lushan earthquake, the regional earthquake inventory is from the global earthquake catalog (https://earthquake.usgs.gov/earthquakes/map (accessed on 10 July 2022)), and the PGA data of the 2022 Lushan earthquake are from [30]. Annual rainfall data (2007–2018) are from [42]. The landslide inventory triggered by the 2008 Wenchuan and 2013 Lushan earthquakes was from [23,24].

3. Results

3.1. Spatial and Size Distributions

The inventory of coseismic landslides triggered by the 2022 Lushan Ms 6.1 earthquake contains 1288 landslides, with a cumulative extent of 5.33 km2 over an affected area of approximately 1470 km2, and the highest landslide concentration reaches 22.3 landslides/km2 (Figure 3).
For the spatial distribution, some general patterns can be summarized as follows: i. the meizoseismal area near the epicenter and the seismogenic fault (SS-DG fault) with the strongest seismic shaking (PGA ≥ 0.24 g) contain fewer landslides (Figure 3 and Figure 4), which indicates that seismic shaking is not the most important factor for landslide occurrence therein.
ii. The area between the SS-DG and YJ-WL faults features the highest landslide concentration; 1077 landslides are concentrated in this area, occupying 83.6% of the total, and these landslides are especially close to the YJ-WL fault (Figure 3 and Figure 4).
iii. The right bank of the Qingyi River features a deep-cutting gorge, and the highest landslide concentration is in this area, reaching 22.3 landslides/km2 (Figure 3 and Figure 4).
iv. The hanging wall area shows a greater landslide concentration than the footwall area; there are 1267 landslides in the hanging wall area (98.4% of the total), whereas only 21 landslides are in the footwall area (accounting for 1.6%), and the zones with the highest landslide concentrations are both located in the hanging wall area (Figure 3 and Figure 4).
For the size distribution, 94 landslides, 1069 landslides and 125 landslides have areas ≥ 10,000 m2, 10,000 m2 > areas ≥ 1000 m2 and areas < 1000 m2, respectively, accounting for 7.3%, 83.0% and 9.7% of the total number of landslides, respectively. The average landslide area is 4140 m2, and the largest landslide area is approximately 1.01 × 10⁵ m2. Furthermore, for the 2022 Lushan earthquake, the ratio of the landslide number in each area interval to the total number of landslides (Figure 5A) follows an exponential distribution, i.e.,   Y = 0.029 × e [ ( log ( x ) 2.95 ) 2 / 0.2738 ] (x is the number of landslides in each area interval, and y is the ratio; Figure 5A). The 2008 Wenchuan earthquake landslides follow a similar distribution.
In terms of the landslide frequency density p, landslides with an area A > 104 m2 exhibit a power-law scaling of log(p) = −2.64 × log(A) + 9.1, where β = −2.64 (Figure 5B). This β value is higher than the coseismic inventories of the 2008 Wenchuan (2.34) and 2013 Lushan earthquakes (2.34; Figure 5B) and other coseismic inventories, such as the Chi Chi earthquake (−2.30), the Palu earthquake (−2.441), the Northridge earthquake (−2.39) and the Nippes earthquake (−2.47) [15,43]. Figure 5C shows the relationship between the cumulative number ratio N and the landslide area A, similarly demonstrating a power-law relationship of log(N) = −2.04 × log(A) + 7.0, where β = −2.04. The coseismic inventories of the 2008 Wenchuan and 2013 Lushan earthquakes also follow similar exponents (Figure 5C).

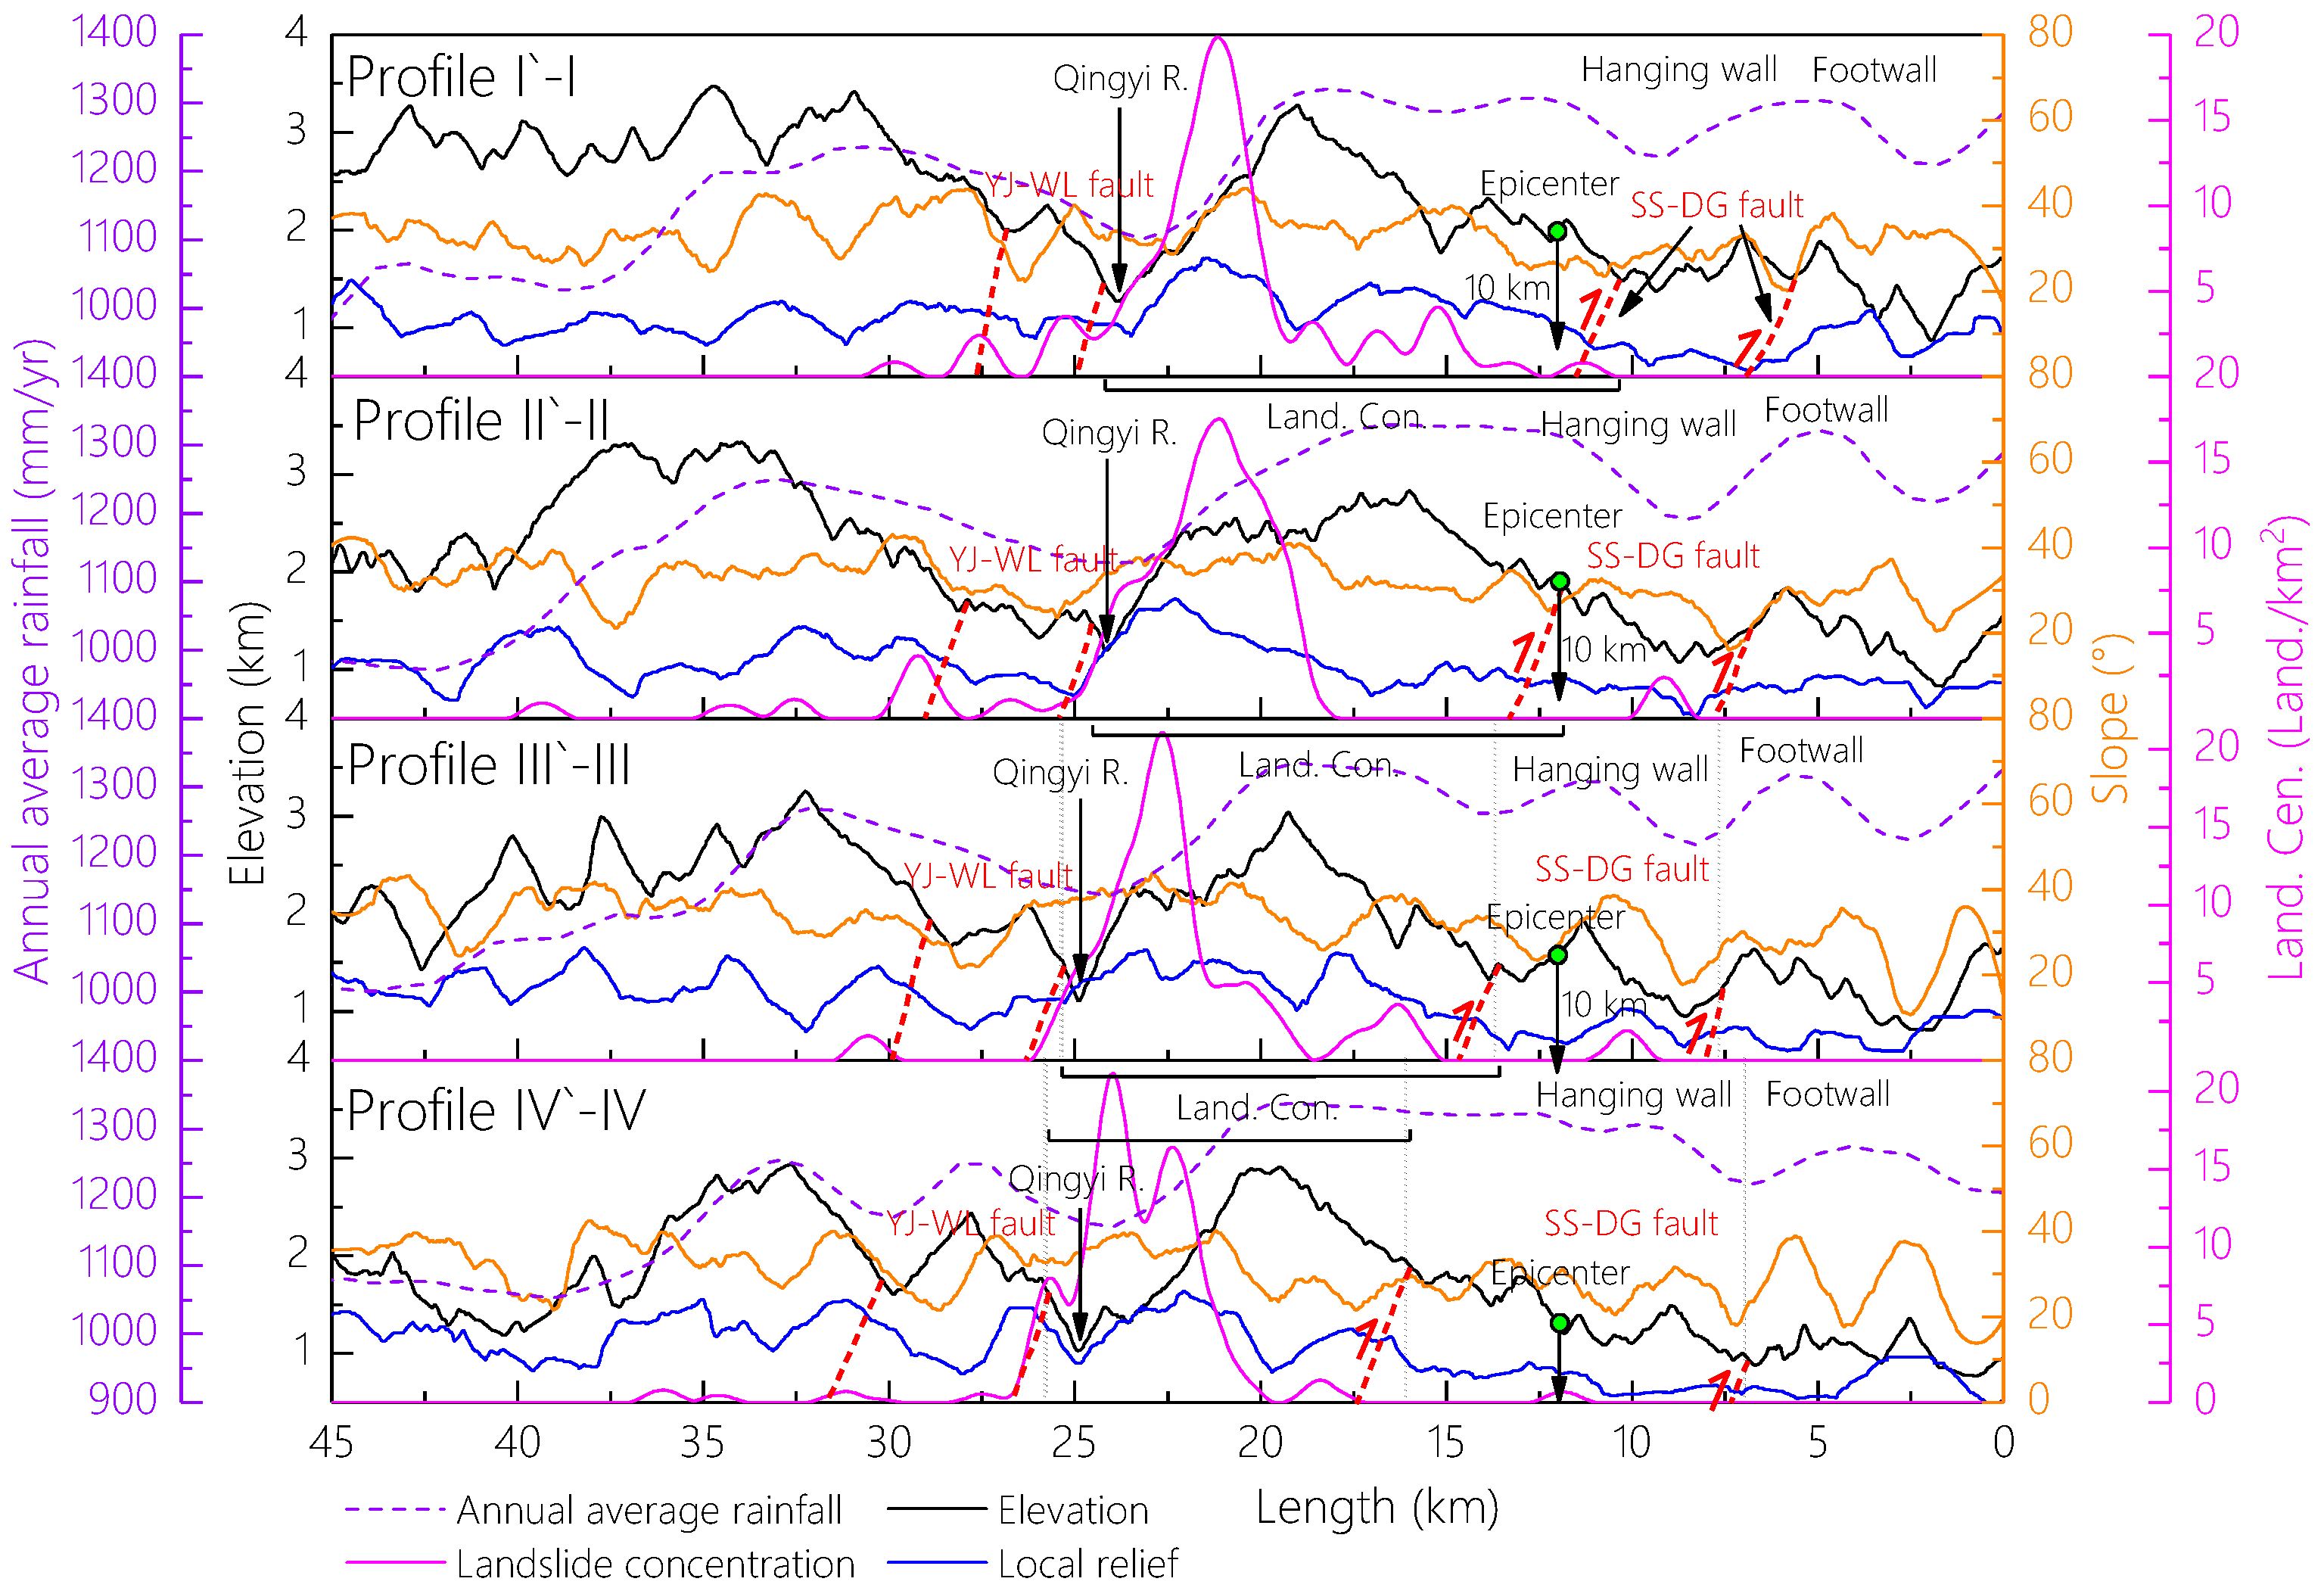
3.2. Potential Landslide Patterns

As this area is part of the southern segment of the Longmenshan fault zone, the mountains are fractured; earthquakes are frequently coupled, such as the 2013 Lushan earthquake; and landslides occur frequently during common periods (Figure 6B) [23,24]. Figure 6A,B show the preexisting landslides in the study area, and the interpretation reveals that there are at least 457 preexisting landslides in the landslide-affected area. There is no doubt that the sudden seismic shaking induced by the 2022 event could have reactivated them again; thus, the coseismic landslides can be divided into newly triggered landslides and reactivated landslides (Figure 6C–E). Based on identification, 1027 landslides are newly triggered landslides and 261 are reactivated landslides, accounting for 79.8% and 10.2%, respectively.
According to the volume classification, the largest landslide has a scale of approximately 6 × 10⁵ m3, with an area, length, and width of 6 × 10⁵ m3, 560 m and 200 m, respectively; the landslide is a medium-sized landslide, and this landslide also temporarily blocked the Qingyi River (Figure 6F). Other landslides are small landslides with volumes less than 105 m3. According to field investigations, most coseismic landslides are shallow landslides with depths less than 10 m.
According to the landslide pattern classification, landslides can be divided into rock landslides and soil landslides. Rock landslides are a common landslide type and can be divided into rock falls and rockslides (Figure 6G,H). Soil landslides mainly occur on surficial deposits, and all soil landslides are small shallow landslides (Figure 6I).

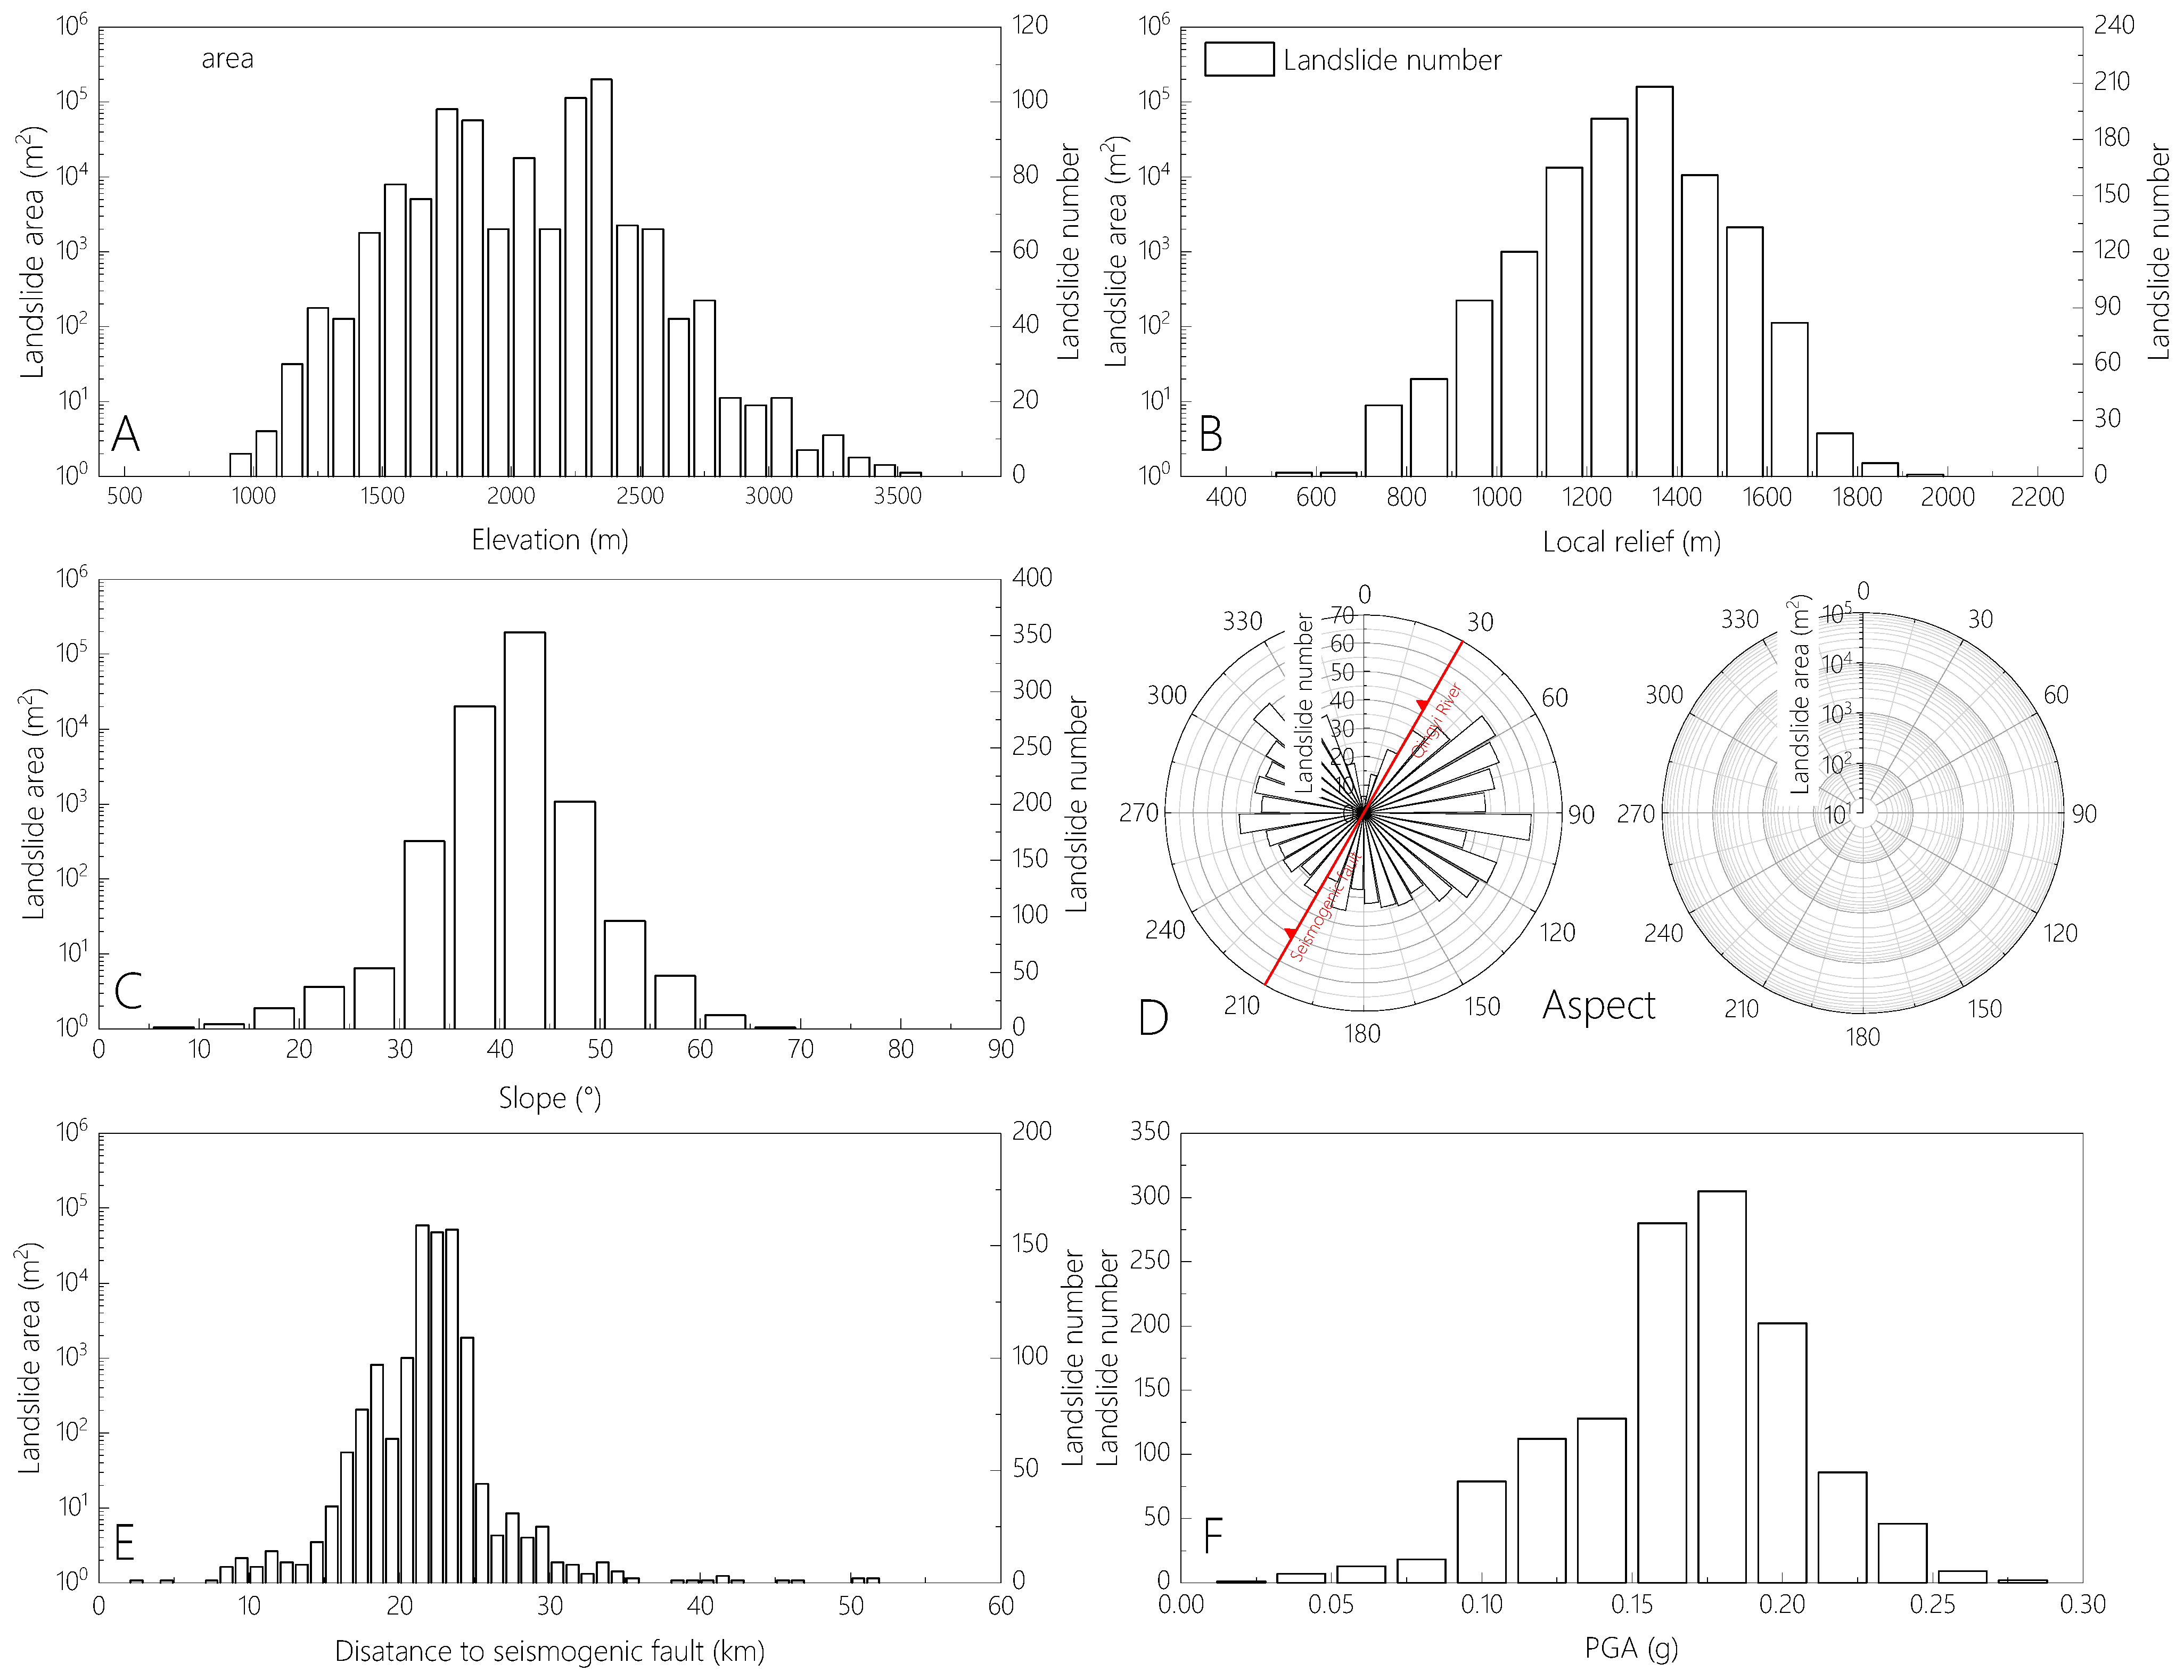
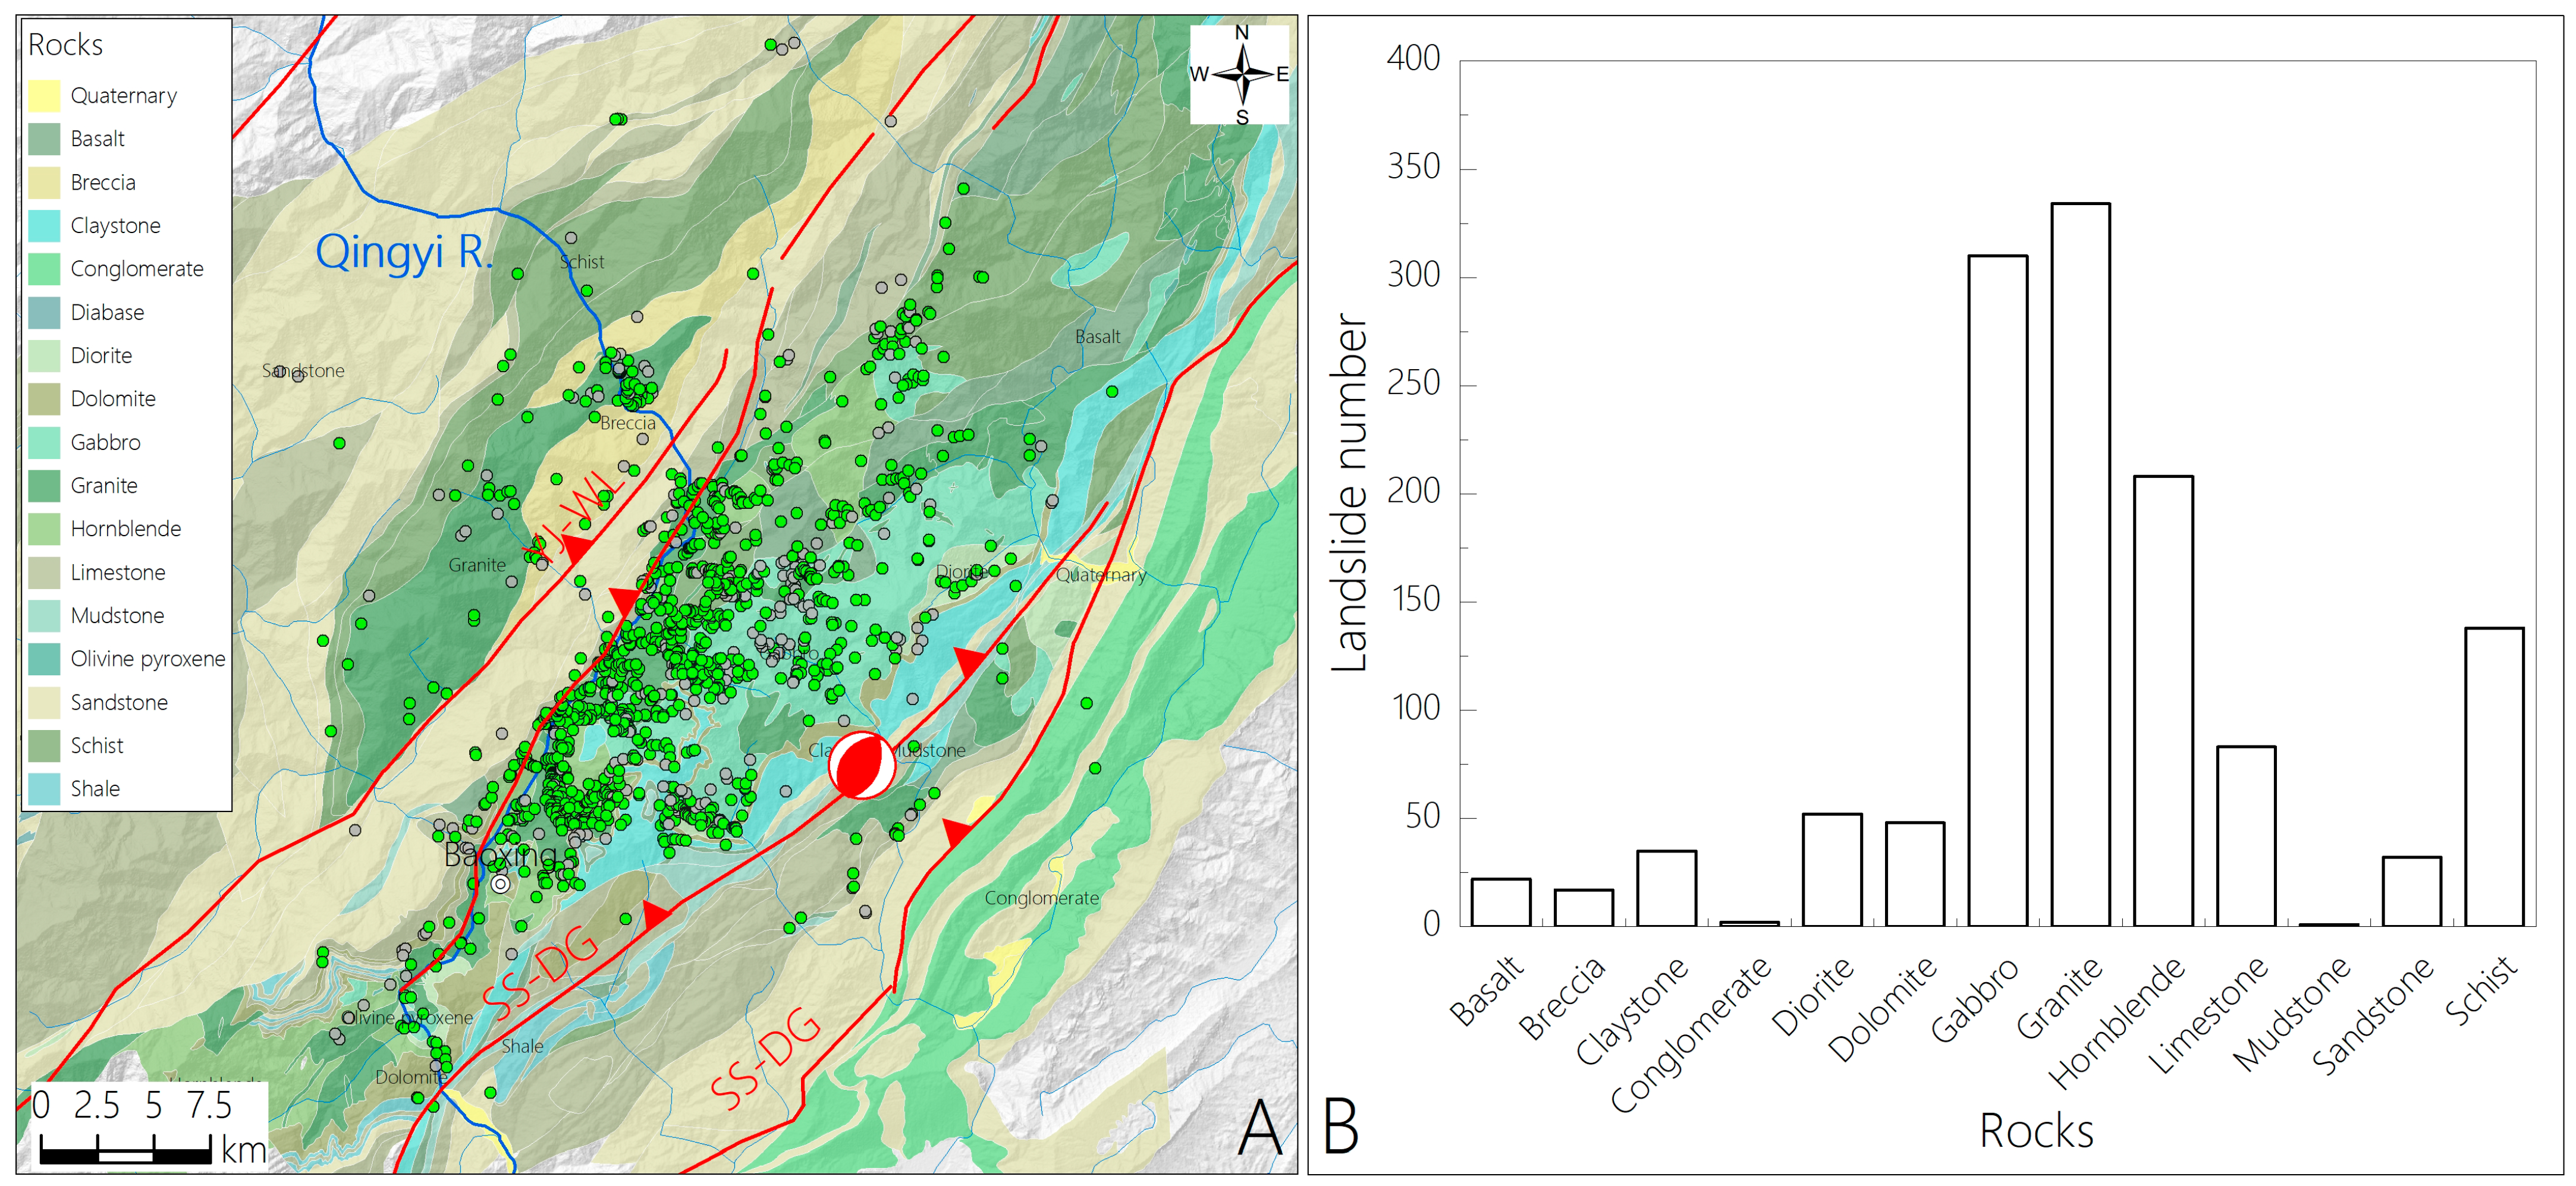
3.3. Distribution Related to Seismic Faults, PGA, Lithology, and Topographic Factors

To gain insight into the potential factors influencing landslide distribution, seven factors, i.e., elevation, local relief, slope, aspect, distance to the seismogenic fault, PGA and rocks, are adopted, as shown in Figure 7 and Figure 8. As coseismic landslides are mainly concentrated in a relatively small region on the right bank of the Qingyi River (Figure 4), the factor of distance to the river profile is not adopted. Additionally, there is no obvious relationship between landslides and annual rainfall (Figure 4).
For landslide elevation, with elevation growth, the landslide number increases and then decreases, and the elevation of 1500–2600 m contains 967 landslides occupying 75.1% of the total. This elevation range mainly corresponds to the lower–middle upper section of the mountain (right bank of the Qingyi River; Figure 4). In addition, the elevation growth has little influence on the landslide area distribution (Figure 7A). As coseismic landslides occur in a relatively small region that could have similar topographic features, the local relief also has a similar distribution and increases and then decreases as the local relief increases (Figure 7B). Areas with local reliefs of 1000–1600 m may be landslide-prone, and this interval includes 978 landslides, occupying 75.9% of the total. As relief increases, the landslide area remains similar.
For the slope distribution, the slope angles of 30–50° may include a concentrated landslide area, and 1105 landslides in these intervals occupy 85.8%, especially within 35–45° (640 landslides, occupying 49.9%; Figure 7C). Additionally, for slopes gentler than 40°, the landslide area has greater amplitude variation with increasing slope, whereas for slopes steeper than 40°, the amplitude variation decreases with increasing angle (Figure 7C). The slope aspect distribution also reveals that more landslides have a strike of approximately east–west, which is roughly orthogonal to the extensional directions in valleys and active faults (Figure 7D). The slope aspect has little influence on landslide occurrence.
For the distance to the seismogenic fault, 1021 landslides are concentrated in a distance range of 15–25 km, accounting for 79.3%, and this distance range coincides with the right bank area of the Qingyi River (Figure 4 and Figure 7E). This phenomenon is obviously different from landslides triggered by the 2008 Wenchuan and 2013 Lushan earthquakes, which were both closer to seismogenic faults and had high landslide numbers [23,24]. The area with PGA values of 0.12–0.2 g contains 1113 landsides, occupying 86.4% of the total (Figure 7F).
Figure 8 shows the spatial distribution of landslides relative to different lithologies. Complex lithologies, including sedimentary rocks (sandstone, mudstone, etc.), metamorphic rocks (schist, etc.), extrusive rocks (basalt, etc.) and intrusive rocks (granite, gabbro, hornblende, etc.), cover landslide-affected areas (Figure 8A). Statistically, the intrusive rocks, especially granite (334 landslides), gabbro (310 landslides) and hornblende (208 landslides), are located in the coseismic landslide-prone area (Figure 8B); 852 landslides are composed of these three rock types, occupying 66.2% of the total. There are also 138 landslides that have occurred in schist, occupying 10.7%. Few landslides occur in other rock types (Figure 8B).

4. Discussion

4.1. Basic Characteristics of Coseismic Landslides in the Longmenshan Fault Zone

As mentioned, in the past 15 years, two mega-earthquakes have occurred in the Longmenshan fault zone, i.e., the 2008 Wenchuan Ms 8.0 and 2013 Lushan Ms 7.0 earthquakes, and these two earthquakes both triggered numerous landslides [23,24]. Here, we preliminarily compare their typical characteristics. Initially, these three seismic events were thrust events, and 197,481, 15,645 and 1288 landslides were triggered by the 2008 Wenchuan [23] and 2013 [24] and 2022 Lushan earthquakes, respectively. Their spatial and sizes distributions are shown in Figure 3 and Figure 9.
In terms of the landslide number, the coseismic landslides triggered by the 2008 Wenchuan and 2013 Lushan earthquakes both lie above the fitting line, and the 2022 Lushan event lies below the fitting line (Figure 10A); thus, slightly fewer coseismic landslides were triggered by the 2022 Lushan event. In terms of the spatial distribution, for all coseismic landslides triggered by these three events, the hanging wall area contained many more landslides than the footwall area (Figure 3 and Figure 9) [2,23,24,45]; thus, landslides in the hanging wall appeared widely in the Longmenshan fault zone. Additionally, the 2008 and 2013 events occurred closer to seismogenic faults, with higher landslide numbers/concentrations [23,24], while the 2022 event did not show a similar phenomenon (for a detailed discussion, see Section 3.1). For the 2008 Wenchuan and 2013 Lushan earthquakes, most large landslides occurred along seismogenic faults [24,46].
The controlled elevations of landslides triggered by the Wenchuan and 2013 and 2022 Lushan earthquakes range from 700–1700 m, 1000–2000 m and 1500–2600 m, respectively; the controlled slopes of landslides triggered by the 2008 Wenchuan and 2013 and 2022 Lushan earthquakes range from 20–45°, 20–40° and 20–40°, respectively [23,24]. Thus, the coseismic landslides triggered by the 2022 Lushan event occurred at a higher elevation and on a steeper slope. Some studies indicate that as mountains and slopes increase, the seismic amplification effect increases [47]; thus, coseismic landslides of the 2022 Lushan event received stronger seismic shaking within these topographic features.
The total landslide areas of these three earthquakes lie above the fitting lines (Figure 10B), and their average landslide areas are 5874 m2 (2008 Wenchuan) [23], 1193 m2 (2013 Lushan) [24] and 4161 m2 (2022 Lushan).

4.2. Limitations

This study attempts to establish a landslide inventory of the 2022 Lushan earthquake in China and evaluate the spatial and size distributions of coseismic landslides and their possible controlling factors. However, there remain some limitations in the landslide mapping and related analyses.
With regard to landslide mapping, as mentioned in Section 2.2 with the continuous cloud-covered epicentral area after the mainshock (date: 1 June 2022), the earliest high-resolution satellite images without clouds were accessed approximately one month later (date: 7 July 2022). There is no doubt that rainfall, aftershocks, etc., could have added or enlarged slope failures during this time, causing uncertainties in the results. Related studies also reveal that this uncertainty is usually less than 10%, and the results do not change [43].
Moreover, for spatial analysis, this study adopted only the PGA to analyze the influences of seismic shaking on the spatial and size distributions; however, the PGA index cannot reflect the actual seismic shaking of the microterrain. Finally, we acquired only regional annual rainfall data. Although annual rainfall data could preliminarily reflect the influences of long-term rainfall on the spatial and size distributions [15,43,44], additional moisture and daily or hourly rainfall data prior to the earthquake should also be collected (if possible) to check whether recent rainfall influences landslide occurrence [43].

5. Conclusions

To gain insight into the spatial and size distributions of coseismic landslides triggered by the 2022 Lushan earthquake in the Longmenshan fault zone, we mapped coseismic landslides and carried out field investigations. We found that the 2022 Lushan event triggered at least 1288 landslides over an area of 1470 km2; most landslides were concentrated in the area between the seismogenic fault (SS-DG fault) and another active fault (YJ-WL fault), especially on the right bank of the Qingyi River, while few landslides occurred near the epicenter and seismogenic fault areas with the strongest seismic shaking. The total landslide area is 5.33 km2, and the distribution of the ratio in the different area intervals follows an exponential distribution, i.e., Y = 0.029 × e [ ( log ( x ) 2.95 ) 2 / 0.2738 ] . There are 1028 coseismic landslides classified as newly triggered landslides an 262 classified as reactivated landslides, and these landslides occupy 79.8% and 10.2%, respectively. Rock and soil landslides were both found, and most are small shallow landslides.
The hanging wall effect defines the common pattern for the coseismic landslide distribution in the Longmenshan fault zone; the 2008 and 2013 events both occurred closer to the seismogenic fault, with a higher landslide number/concentration, and this pattern did not occur with the 2022 event; landslides as a result of the 2022 Lushan event are distributed in higher and steeper areas. Additionally, optical satellite/UAV images have been an important medium to gain insight into the spatial and size distributions of coseismic landslides, while they are often disturbed by local climates, resulting in delayed results.

Author Contributions

Landslide mapping, B.Z. and W.L.; field investigation, B.Z., Y.W. and H.W.; writing—original draft preparation, B.Z., L.S. and W.L.; methodology, B.Z. and L.S.; supervision, L.S. funding acquisition, W.L. All authors have read and agreed to the published version of the manuscript.

Funding

This research is supported by the National Natural Science Foundation of China (Grant No. 42007273), the National Key Research and Development Program of China (Grant No. 2021YFC3000401), the Second Tibetan Plateau Scientific Expedition and Research Program (STEP) (Grant No. 2021QZKK0202), the Special Assistant Researcher Foundation of the Chinese Academy of Sciences (Zhao Bo), the China Postdoctoral Science Foundation (Grant No. 2020M673292, and 2021T140650) and the IMHE Youth S&T Foundation (Grant No. SDS-QN-2106). The authors express their gratitude for this financial assistance. Most of the data in this article are derived from published materials.

Data Availability Statement

Relative data is available under request to the first author.

Acknowledgments

We appreciate all of editors and anonymous reviewers for giving significant comments that contributed to improve this article.

Conflicts of Interest

The authors declare that there is no conflict of interest.

References

  1. Keefer, D.K. Landslides caused by earthquakes. Geol. Soc. Am. Bull. 1984, 95, 406–421. [Google Scholar] [CrossRef]
  2. Fan, X.; Scaringi, G.; Korup, O.; West, A.J.; Van Westen, C.J.; Tanyas, H.; Huang, R. Earthquake-induced chains of geologic hazards: Patterns, mechanisms, and impacts. Rev. Geophys. 2019, 57, 421–503. [Google Scholar] [CrossRef]
  3. Korup, O.; Montgomery, D.R.; Hewitt, K. Glacier and landslide feedbacks to topographic relief in the Himalayan syntaxes. Proc. Natl. Acad. Sci. USA 2010, 107, 5317–5322. [Google Scholar] [CrossRef] [PubMed]
  4. Jones, J.N.; Boulton, S.J.; Stokes, M.; Bennett, G.L.; Whitworth, M.R. 30-Year record of Himalaya mass-wasting reveals landscape perturbations by extreme events. Nat. Commun. 2021, 12, 6701. [Google Scholar] [CrossRef] [PubMed]
  5. Kincey, M.E.; Rosser, N.J.; Robinson, T.R.; Densmore, A.L.; Shrestha, R.; Pujara, D.S.; Swirad, Z.M. Evolution of coseismic and post-seismic landsliding after the 2015 Mw 7.8 Gorkha earthquake, Nepal. J. Geophys. Res. Earth Surf. 2021, 126, e2020JF005803. [Google Scholar] [CrossRef]
  6. Parker, R.N.; Densmore, A.L.; Rosser, N.J.; De Michele, M.; Li, Y.; Huang, R.; Petley, D.N. Mass wasting triggered by the 2008 Wenchuan earthquake is greater than orogenic growth. Nat. Geosci. 2011, 4, 449–452. [Google Scholar] [CrossRef]
  7. Keefer, D.K. Statistical analysis of an earthquake-induced landslide distribution—The 1989 Loma Prieta, California event. Eng. Geol. 2000, 58, 231–249. [Google Scholar] [CrossRef]
  8. Tanyaş, H.; Van Westen, C.J.; Allstadt, K.E.; Anna Nowicki Jessee, M.; Görüm, T.; Jibson, R.W.; Hovius, N. Presentation and analysis of a worldwide database of earthquake-induced landslide inventories. J. Geophys. Res. Earth Surf. 2017, 122, 1991–2015. [Google Scholar] [CrossRef]
  9. Valagussa, A.; Marc, O.; Frattini, P.; Crosta, G.B. Seismic and geological controls on earthquake-induced landslide size. Earth Planet. Sci. Lett. 2019, 506, 268–281. [Google Scholar] [CrossRef]
  10. Sassa, K.; Fukuoka, H.; Scarascia-Mugnozza, G.; Evans, S. Earthquake-induced-landslides: Distribution, motion and mechanisms. Soils Found. 1996, 36, 53–64. [Google Scholar] [CrossRef] [Green Version]
  11. Meunier, P.; Hovius, N.; Haines, A.J. Regional patterns of earthquake-triggered landslides and their relation to ground motion. Geophys. Res. Lett. 2007, 34, 1–5. [Google Scholar] [CrossRef]
  12. Roback, K.; Clark, M.K.; West, A.J.; Zekkos, D.; Li, G.; Gallen, S.F.; Godt, J.W. The size, distribution, and mobility of landslides caused by the 2015 Mw7.8 Gorkha earthquake, Nepal. Geomorphology 2018, 301, 121–138. [Google Scholar] [CrossRef]
  13. Khazai, B.; Sitar, N. Evaluation of factors controlling earthquake-induced landslides caused by Chi-Chi earthquake and comparison with the Northridge and Loma Prieta events. Eng. Geol. 2004, 71, 79–95. [Google Scholar] [CrossRef]
  14. Sassa, K.; Fukuoka, H.; Wang, F.; Wang, G. Dynamic properties of earthquake-induced large-scale rapid landslides within past landslide masses. Landslides 2004, 2, 125–134. [Google Scholar] [CrossRef]
  15. Zhao, B. Landslides triggered by the 2018 Mw 7.5 Palu supershear earthquake in Indonesia. Eng. Geol. 2021, 294, 106406. [Google Scholar] [CrossRef]
  16. Gorum, T.; Fan, X.; van Westen, C.J.; Huang, R.Q.; Xu, Q.; Tang, C.; Wang, G. Distribution pattern of earthquake-induced landslides triggered by the 12 May 2008 Wenchuan earthquake. Geomorphology 2011, 133, 152–167. [Google Scholar] [CrossRef]
  17. Xu, C. Preparation of earthquake-triggered landslide inventory maps using remote sensing and GIS technologies: Principles and case studies. Geosci. Front. 2015, 6, 825–836. [Google Scholar] [CrossRef]
  18. Kargel, J.S.; Leonard, G.J.; Shugar, D.H.; Haritashya, U.K.; Bevington, A.; Fielding, E.J.; Young, N. Geomorphic and geologic controls of geohazards induced by Nepal’s 2015 Gorkha earthquake. Science 2016, 351, aac8353. [Google Scholar] [CrossRef]
  19. Shafique, M.; van der Meijde, M.; Khan, M.A. A review of the 2005 Kashmir earthquake-induced landslides; from a remote sensing prospective. J. Asian Earth Sci. 2016, 118, 68–80. [Google Scholar] [CrossRef]
  20. Zhao, B.; Wang, Y.; Li, W.; Su, L.J.; Lu, J.; Zeng, L.; Li, X. Insights into the geohazards triggered by the 2017 Ms 6.9 Nyingchi earthquake in the east Himalayan syntaxis, China. Catena 2021, 205, 105467. [Google Scholar] [CrossRef]
  21. Basharat, M.; Ali, A.; Jadoon, I.A.; Rohn, J. Landsliding in the 2005 Kashmir earthquake region, NW Himalayas, Pakistan. In An Open Repository of Earthquake-Triggered Ground Failure Inventories; Schmitt, R., Tanyas, H., Nowicki Jessee, M.A., Zhu, J., Biegel, K.M., Allstadt, K.E., Jibson, R.W., Thompson, E.M., van Westen, C.J., Sato, H.P., et al., Eds.; U.S. Geological Survey Data Release Collection: Reston, VA, USA, 2017. [Google Scholar] [CrossRef]
  22. Xu, C. Landslides Triggered by the 2015 Gorkha, Nepal Earthquake. Int. Arch. Photogramm. Remote Sens. Spat. Inf. Sci. 2018, XLII-3, 1989–1993. [Google Scholar] [CrossRef]
  23. Xu, C.; Xu, X.; Yao, X.; Dai, F. Three (nearly) complete inventories of landslides triggered by the 12 May 2008 Wenchuan Mw 7.9 earthquake of China and their spatial distribution statistical analysis. Landslides 2014, 11, 441–461. [Google Scholar] [CrossRef]
  24. Xu, C.; Xu, X.; Shyu, J.B.H. Database and spatial distribution of landslides triggered by the Lushan, China Mw 6.6 earthquake of 20 April 2013. Geomorphology 2015, 248, 77–92. [Google Scholar] [CrossRef]
  25. Ling, S.; Sun, C.; Li, X.; Ren, Y.; Xu, J.; Huang, T. Characterizing the distribution pattern and geologic and geomorphic controls on earthquake-triggered landslide occurrence during the 2017 Ms 7.0 Jiuzhaigou earthquake, Sichuan, China. Landslides 2021, 18, 1275–1291. [Google Scholar] [CrossRef]
  26. Jia, K.; Zhou, S.; Zhuang, J.; Jiang, C. Possibility of the independence between the 2013 Lushan earthquake and the 2008 Wenchuan earthquake on Longmen Shan fault, Sichuan, China. Seismol. Res. Lett. 2014, 85, 60–67. [Google Scholar] [CrossRef]
  27. Havenith, H.B.; Torgoev, A.; Braun, A.; Schlögel, R.; Micu, M. A new classification of earthquake-induced landslide event sizes based on seismotectonic, topographic, climatic and geologic factors. Geoenviron. Disasters 2016, 3, 6. [Google Scholar] [CrossRef]
  28. Chang, T.Y.; Cotton, F.; Tsai, Y.B.; Angelier, J. Quantification of hanging-wall effects on ground motion: Some insights from the 1999 Chi-Chi earthquake. Bull. Seismol. Soc. Am. 2004, 94, 2186–2197. [Google Scholar] [CrossRef]
  29. Keefer, D.K. Investigating landslides caused by earthquakes—A historical review. Surv. Geophys. 2002, 23, 473–510. [Google Scholar] [CrossRef]
  30. USGS. M 5.8–48 km W of Linqiong, China. 2022. Available online: https://earthquake.usgs.gov/earthquakes/eventpage/us7000he1h/executive (accessed on 10 July 2022).
  31. Deng, Q.D.; Cheng, J.; Ma, J.; Du, P. Seismic activities and earthquake potential in the Tibetan Plateau. Chin. J. Geophys. 2014, 57, 678–697. [Google Scholar] [CrossRef]
  32. Zhang, Y.H.; Yao, R.W.; Wang, Y.; Duo, J.; Cao, H.W. Zircon U–Pb and sericite Ar–Ar geochronology, geochemistry and S–Pb–Hf isotopes of the Zebuxia Pb–Zn deposit, Tibet, southwestern China. Ore Geol. Rev. 2022, 148, 104999. [Google Scholar] [CrossRef]
  33. Zhao, B.; Huang, Y.; Zhang, C.; Wang, W.; Tan, K.; Du, R. Crustal deformation on the Chinese mainland during 1998–2014 based on GPS data. Geod. Geodyn. 2015, 6, 7–15. [Google Scholar] [CrossRef]
  34. Zhao, B.; Wang, Y.S.; Luo, Y.H.; Li, J.; Zhang, X.; Shen, T. Landslides and dam damage resulting from the Jiuzhaigou earthquake (8 August 2017), Sichuan, China. R. Soc. Open Sci. 2018, 5, 171418. [Google Scholar] [CrossRef] [PubMed]
  35. Xu, X.W.; Wen, X.Z.; Yu, G.H.; Chen, G.H.; Klinger, Y.; Hubbard, J.; Shaw, J.H. Coseismic reverse- and oblique-slip surface faulting generated by the 2008 Mw 7.9 Wenchuan earthquake, China. Geology 2009, 37, 515–518. [Google Scholar] [CrossRef]
  36. Pei, S.; Niu, F.; Ben-Zion, Y.; Sun, Q.; Liu, Y.; Xue, X.; Shao, Z. Seismic velocity reduction and accelerated recovery due to earthquakes on the Longmenshan fault. Nat. Geosci. 2019, 12, 387–392. [Google Scholar] [CrossRef]
  37. Hubbard, J.; Shaw, J.H. Uplift of the Longmen Shan and Tibetan plateau, and the 2008 Wenchuan (M = 7.9) earthquake. Nature 2009, 458, 194–197. [Google Scholar] [CrossRef]
  38. Zhang, Y.; Dai, Y.; Wang, Y.; Huang, X.; Xiao, Y.; Pei, Q. Hydrochemistry, quality and potential health risk appraisal of nitrate enriched groundwater in the Nanchong area, southwestern China. Sci. Total Environ. 2021, 784, 147186. [Google Scholar] [CrossRef]
  39. Liu, F.; Yang, S. The effect of the Wenchuan earthquake on the fluvial morphology in the Longmen Shan, eastern Tibetan Plateau: Discussion and speculation. Quatern. Int. 2015, 371, 280–289. [Google Scholar] [CrossRef]
  40. Fan, X.; Fang, C.; Dai, L.; Wang, X.; Luo, Y.; Wang, Y.; Wei, T.; Wang, Y. Near real time prediction of spatial distribution probability of earthquake-induced landslides-Take the Lushan Earthquake on 1 June 2022 as an example. J. Eng. Geol. 2022, 30, 729–739. [Google Scholar] [CrossRef]
  41. USGS. M 6.6–56 km WSW of Linqiong, China. 2013. Available online: https://earthquake.usgs.gov/earthquakes/eventpage/usb000gcdd (accessed on 10 July 2022).
  42. Brocca, L.; Filippucci, P.; Hahn, S.; Ciabatta, L.; Massari, C.; Camici, S.; Schüller, L.; Bojkov, B.; Wagner, W. SM2RAIN–ASCAT (2007–2018): Global daily satellite rainfall data from ASCAT soil moisture observations. Earth Syst. Sci. Data 2019, 11, 1583–1601. [Google Scholar] [CrossRef] [Green Version]
  43. Zhao, B.; Wang, Y.S.; Li, W.L.; Lu, H.Y.; Li, Z.Y. Evaluation of factors controlling the spatial and size distributions of landslides, 2021 Nippes earthquake, Haiti. Geomorphology 2022, 415, 108419. [Google Scholar] [CrossRef]
  44. Fan, X.; Scaringi, G.; Xu, Q.; Zhan, W.; Dai, L.; Li, Y.; Huang, R. Coseismic landslides triggered by the 8th August 2017 Ms 7.0 Jiuzhaigou earthquake (Sichuan, China): Factors controlling their spatial distribution and implications for the seismogenic blind fault identification. Landslides 2018, 15, 967–983. [Google Scholar] [CrossRef]
  45. Crosta, G.B.; Hermanns, R.; Frattini, P.; Valbuzzi, E.; Valagussa, A. Large slope instabilities in Northern Chile: Inventory, characterization and possible triggers. In Landslide Science for a Safer Geoenvironment; Springer International Publishing: Berlin, Germany, 2014; pp. 175–181. [Google Scholar] [CrossRef]
  46. Xu, Q.; Zhang, S.; Li, W. Spatial distribution of large-scale landslides induced by the 5.12 Wenchuan earthquake. J. Mt. Sci. 2011, 8, 246–260. [Google Scholar] [CrossRef]
  47. Zhao, B.; Wang, Y.S.; Su, L.J.; Luo, Y.H.; Zhang, J. Directional seismic response to the complex topography: A case study of 2013 Lushan Ms 7.0 earthquake. J. Mt. Sci. 2020, 17, 2049–2067. [Google Scholar] [CrossRef]
Figure 1. Regional setting of the 2022 Lushan earthquake. (A)—location of the 2022 Lushan earthquake, (B)—regional tectonic setting of the 2022 Lushan earthquake, (C)—focal mechanism and regional active faults, (D)—annual average rainfall distribution, (E)—lithological map. The fault block information (Panel B) and active faults (Panels BE) are acquired from [31]; PGA contours (Panel B) are retrieved from [30]; earthquakes (Panels B,C) are from the USGS (https://earthquake.usgs.gov/earthquakes (accessed on 5 May 2022)); the annual average rainfall (Panel D) is from [42]; and the lithologies (Panel E) are from a 1:250,000 geological map. In Panel B, LMS—Longmenshan, XSH—Xianshuihe, WC—Wenchuan, LS—Lushan, JZG—Jiuzhaigou; in Panel B, SS-DG—Shuangshi–Daguan, XJ-DY—Yanjin–Wulong, DY—Dayi; in Panel C, AAR—annual average rainfall.
Remotesensing 14 04365 g001
Figure 2. Coverage of pre- and post-earthquake satellite images. The Sentinel 2 images are multitemporal images from 4 May 2022, 28 June 2022, 3 July 2022 and 6 July 2022. The Sentinel 2 images are from Sentinel Hub (https://www.sentinel-hub.com (accessed on 10 July 2022)).
Remotesensing 14 04365 g002
Figure 3. Spatial distribution of landslides triggered by the 2022 seismic event. (A)—spatial distribution of landslides with different landslide areas and PGAs, (B)—spatial distribution of landslide concentrations. The results of the four profiles in Panel B are shown in Figure 4.
Remotesensing 14 04365 g003
Figure 4. Profiles of the landslide concentration, slope, elevation, and local relief, indicating landslide characteristics. The locations of the profiles are listed in Figure 3B.
Remotesensing 14 04365 g004
Figure 5. Statistical relationships of coseismic landslides. (A)—landslide number ratio vs. landslide area, (B)—frequency density p vs. landslide area, (C)—cumulative number ratio N vs. landslide area.
Remotesensing 14 04365 g005
Figure 6. Potential landslide patterns induced by the 2022 Lushan seismic event. (A)—spatial distribution of preexisting landslides before the 2022 Lushan event, (B)—field image of preexisting landslides, (C)—spatial distribution of newly triggered landslides and reactivated landslides, (D,F)—field and satellite images of the largest landslide (rockslide), (E)—field image of reactivated landslides, (GI)—field images of rockslides, rockfalls, and soil landslides.
Remotesensing 14 04365 g006
Figure 7. Topographic factors, seismogenic faults and seismic shaking (PGA) influencing the spatial distribution of landslides. (A)—elevation, (B)—local relief, (C)—slope, (D)—aspect, (E)—distance to the seismogenic fault, (F)—PGA. PGA—peak ground acceleration.
Remotesensing 14 04365 g007
Figure 8. Spatial (A) and statistical distribution (B) of coseismic landslides in different lithologies. The lithologies are from a 1:250,000 geological map.
Remotesensing 14 04365 g008
Figure 9. Spatial and size distributions of coseismic landslides triggered by the 2008 Wenchuan (Panels A,B) and 2013 Lushan (Panels C,D) earthquakes. The landslide inventories of the Wenchuan and Lushan earthquakes are from [23,24], all PGA contours are from the USGS (https://www.usgs.gov/ (accessed on 12 July 2022)), and the seismogenic faults of the Wenchuan and Lushan earthquakes are from [24,44]. For panels A and B, M-W F.—Maoxian–Wenchuan fault, YX-BC F.—Yingxiu–Beichuan fault, G-A F.—Guanxian–Anxian fault; abbreviations in Panels C,D are listed in the caption of Figure 1.
Remotesensing 14 04365 g009
Figure 10. Worldwide distribution of landslide numbers (A) and landslide areas (B). For the landslide number distribution (A), other events are from [23,24,44]; for the landslide area distribution (B), other events are from [23,44].
Remotesensing 14 04365 g010
Publisher’s Note: MDPI stays neutral with regard to jurisdictional claims in published maps and institutional affiliations.

