Quantifying the Influences of Driving Factors on Vegetation EVI Changes Using Structural Equation Model: A Case Study in Anhui Province, China
Abstract
:1. Introduction
2. Materials and Methods
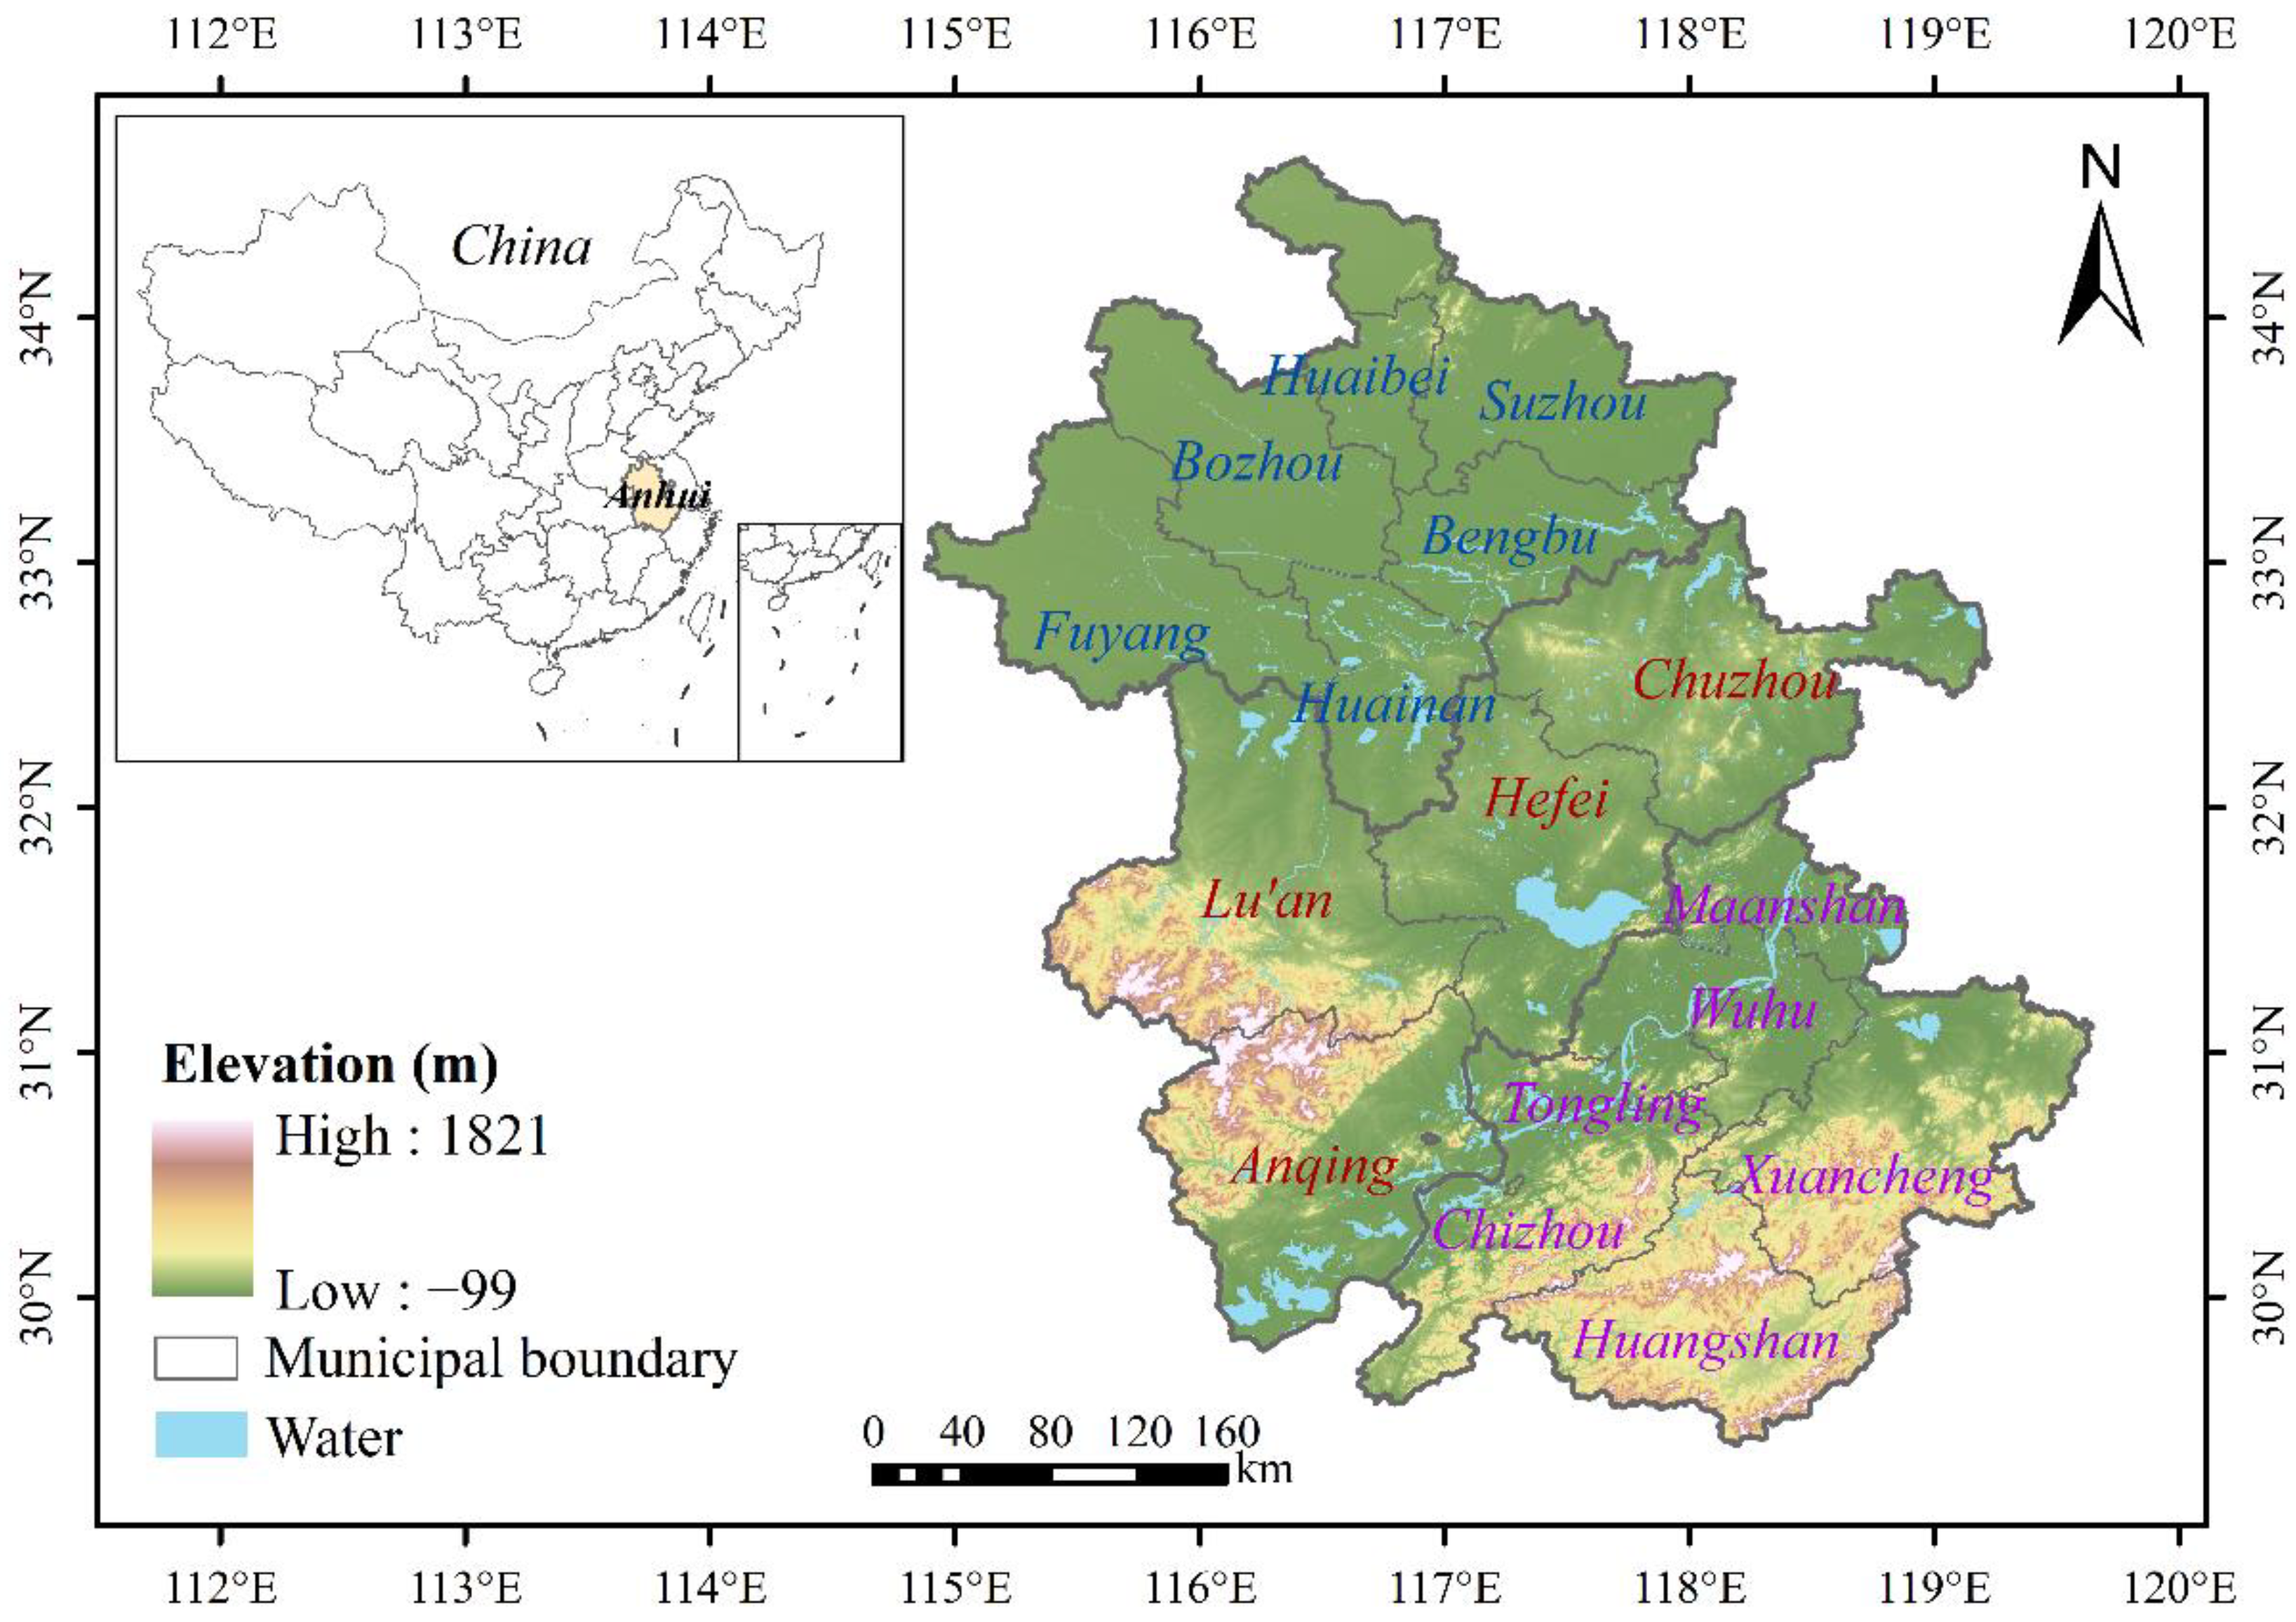
2.1. Study Area
2.2. Data Acquisition and Processing
2.2.1. EVI Data
2.2.2. Topographic Factors
2.2.3. Human Activity Factors
2.2.4. Climate Factors
2.2.5. Data Processing
2.3. Methods
2.3.1. Univariate Linear Regression
2.3.2. Coefficient of Variation
2.3.3. Hurst Index
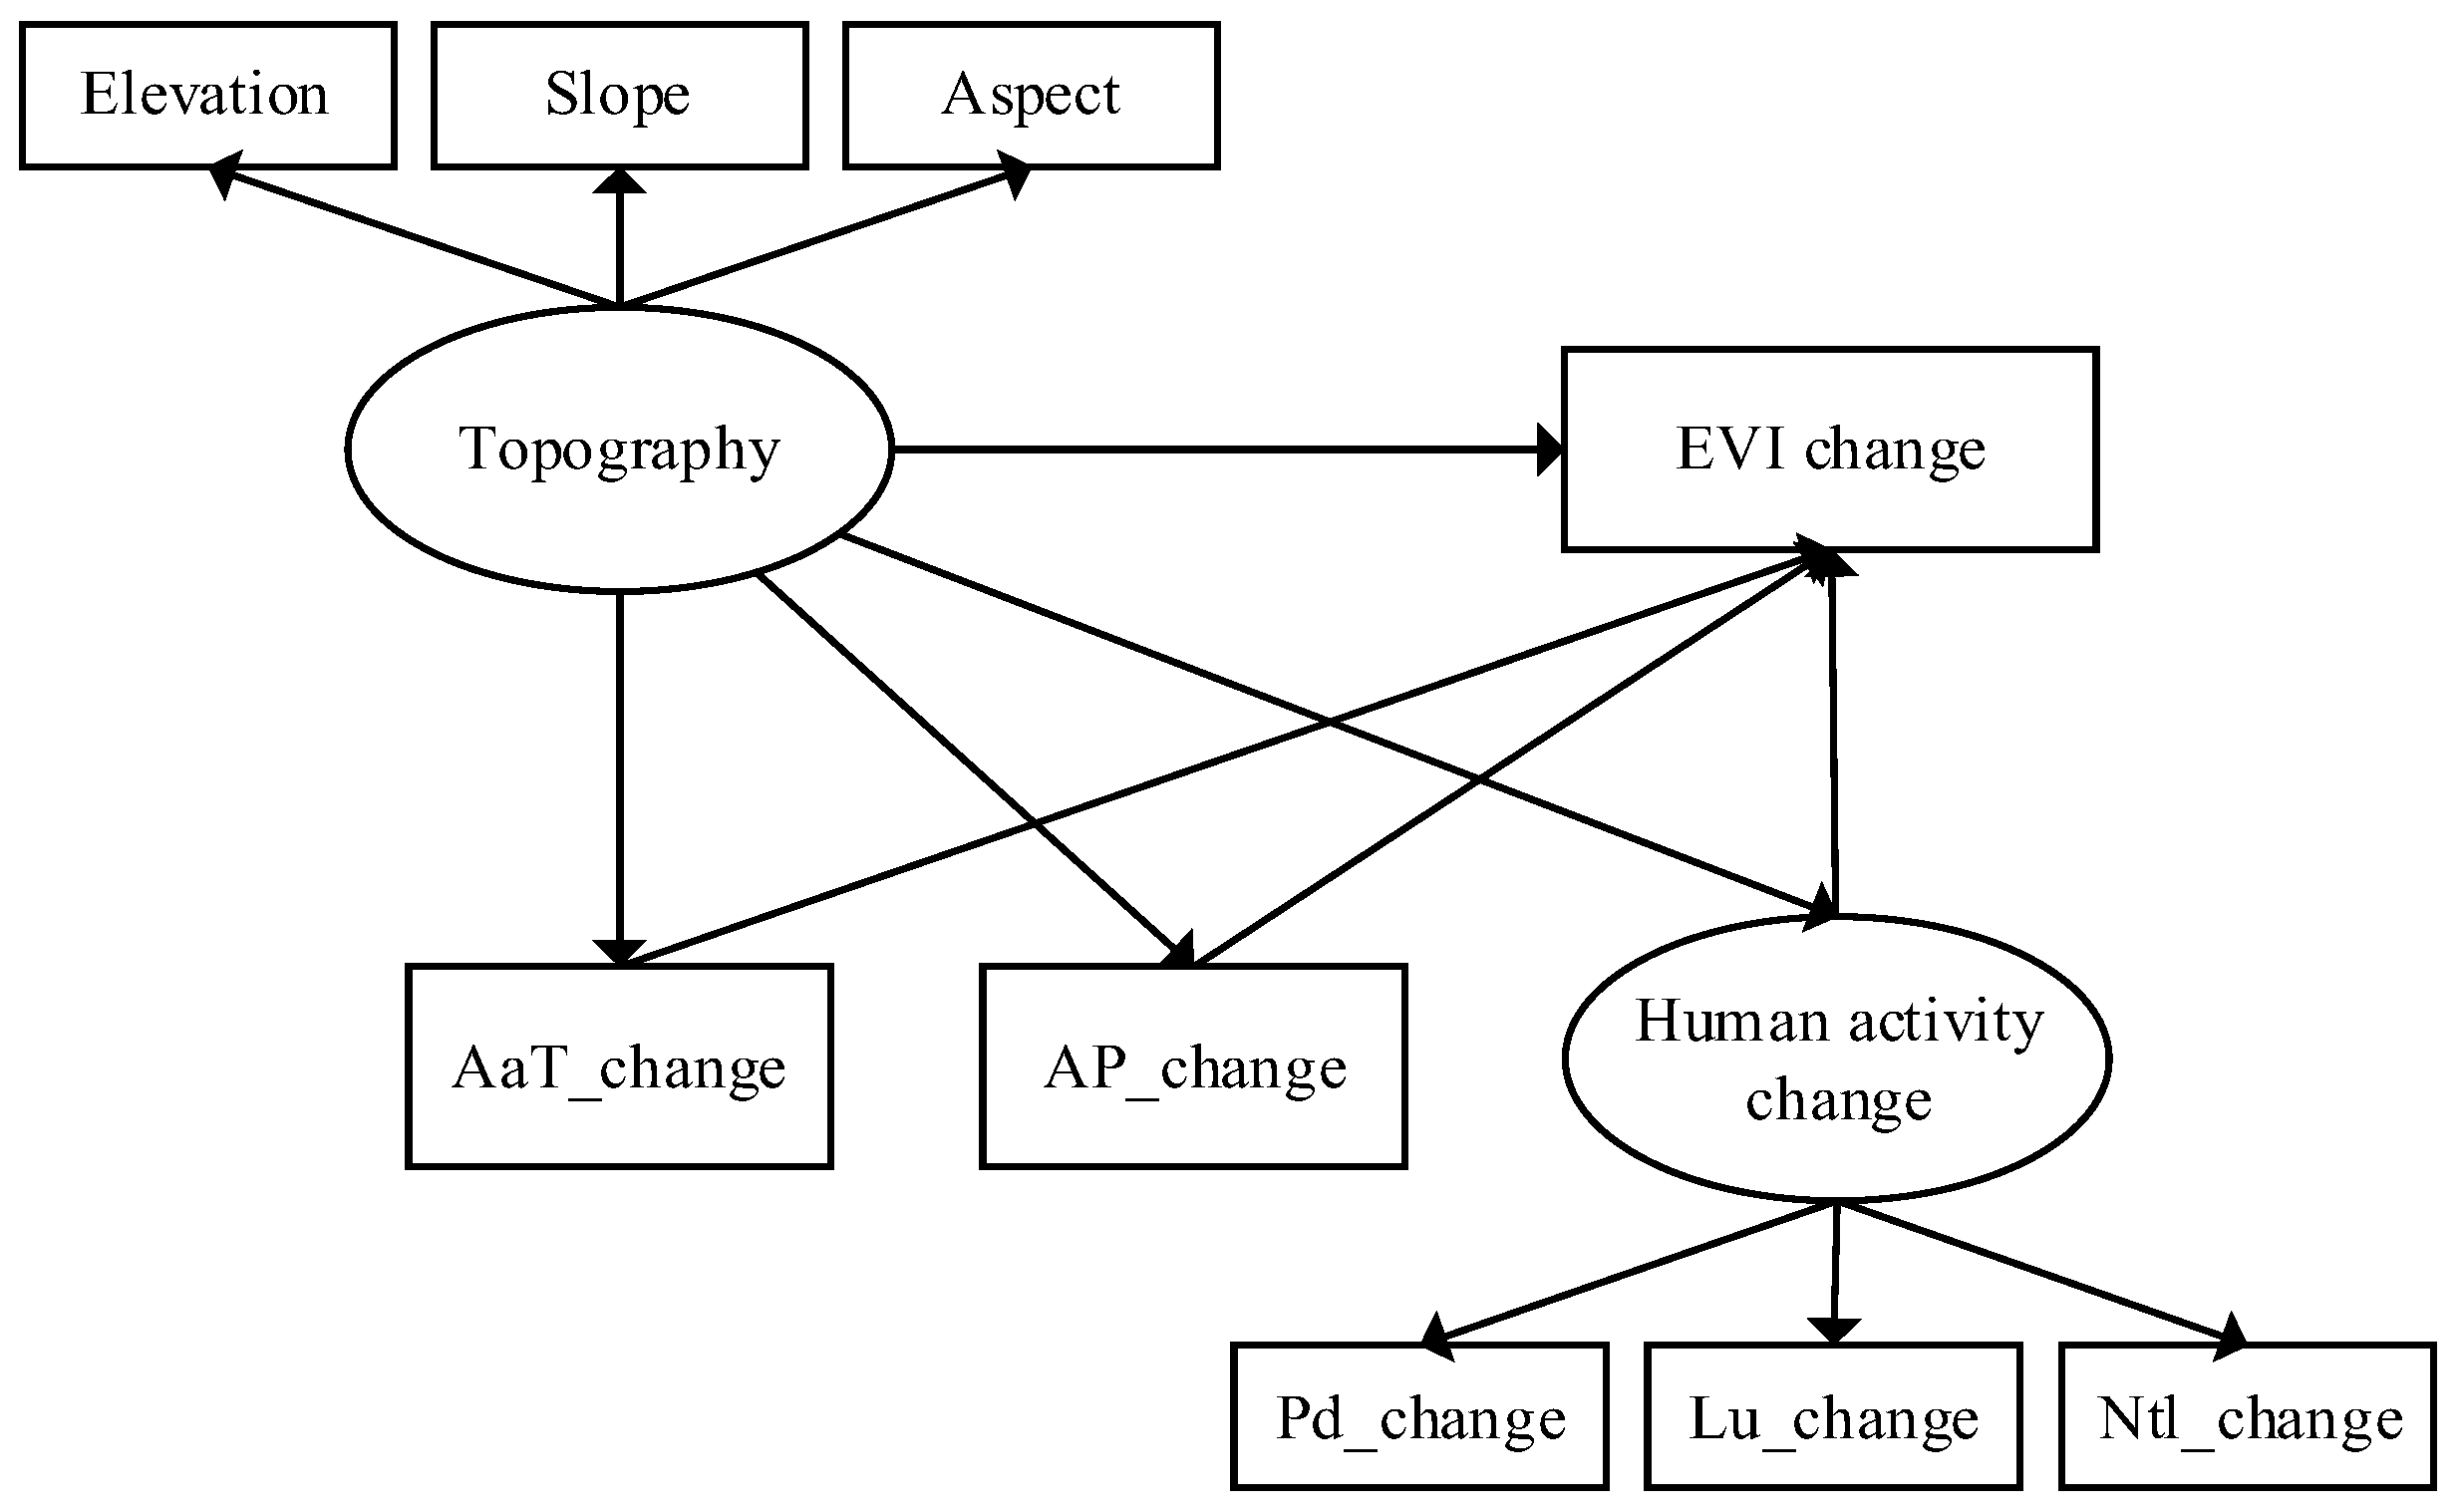
2.3.4. Structural Equation Model
3. Results
3.1. Spatial and Temporal Variations in EVI in Anhui Province
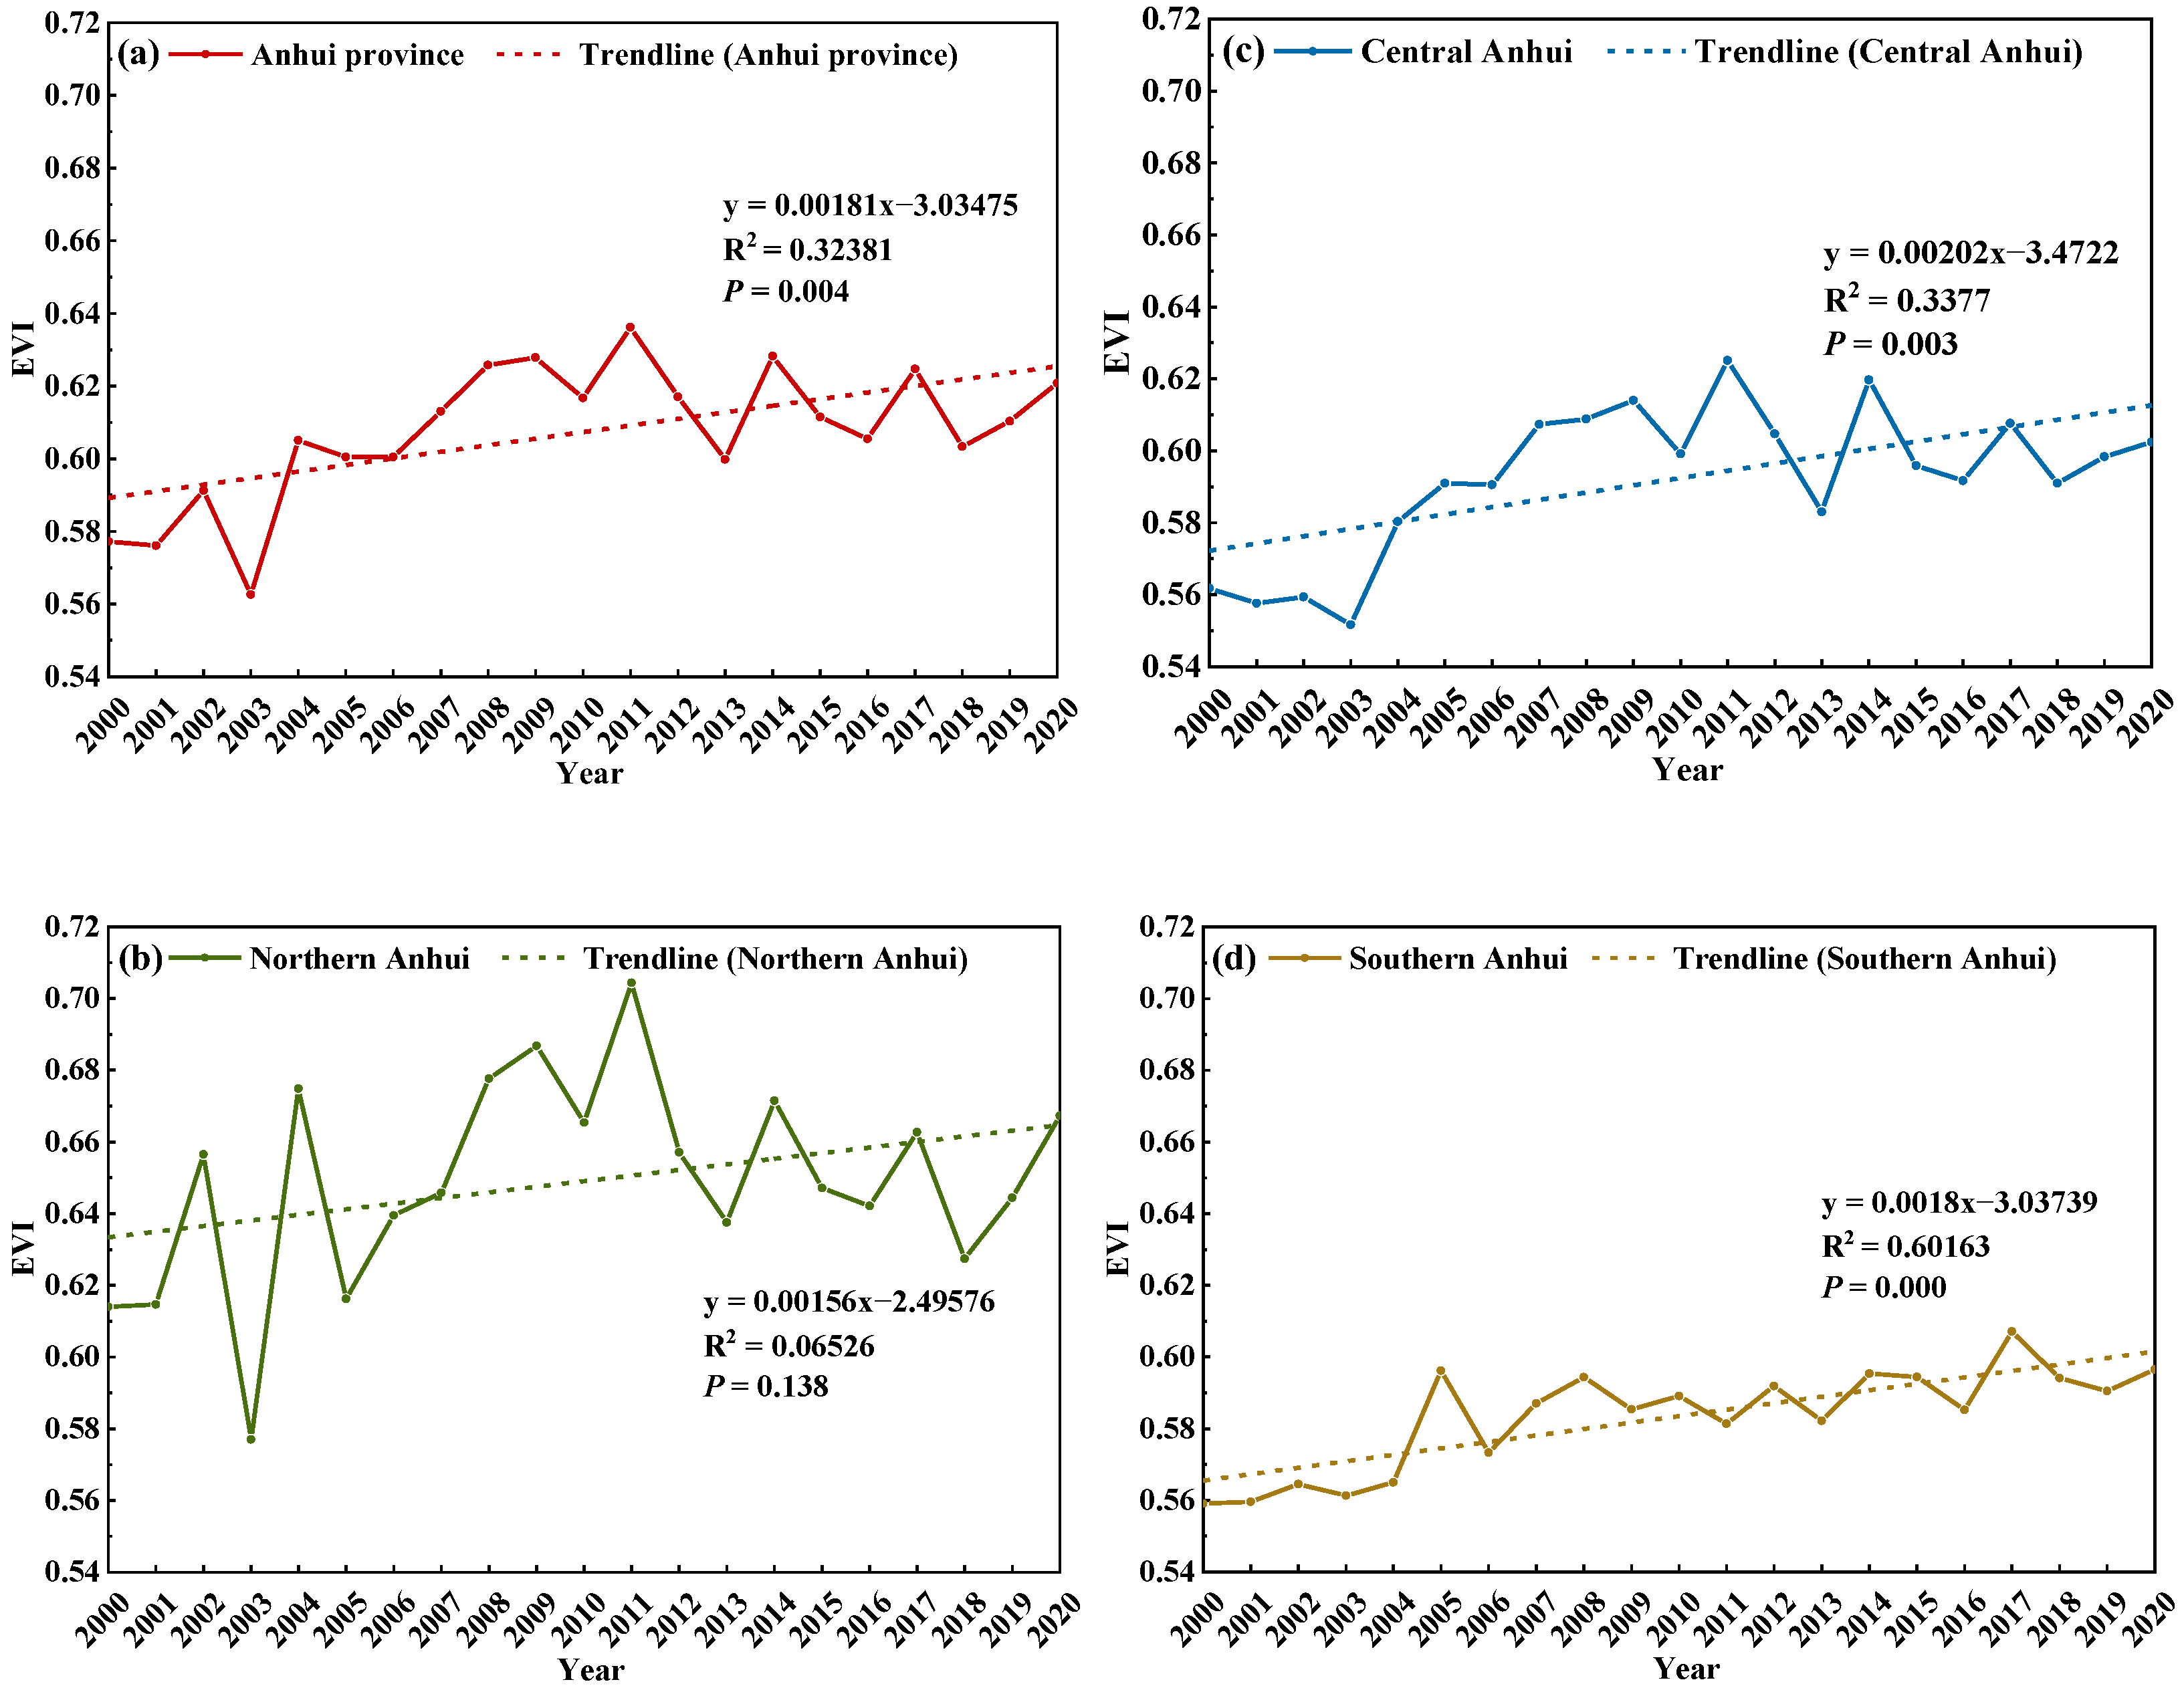
3.1.1. Interannual Variation in EVI
3.1.2. Spatial Distribution Characteristics of EVI and Areas of Transfer
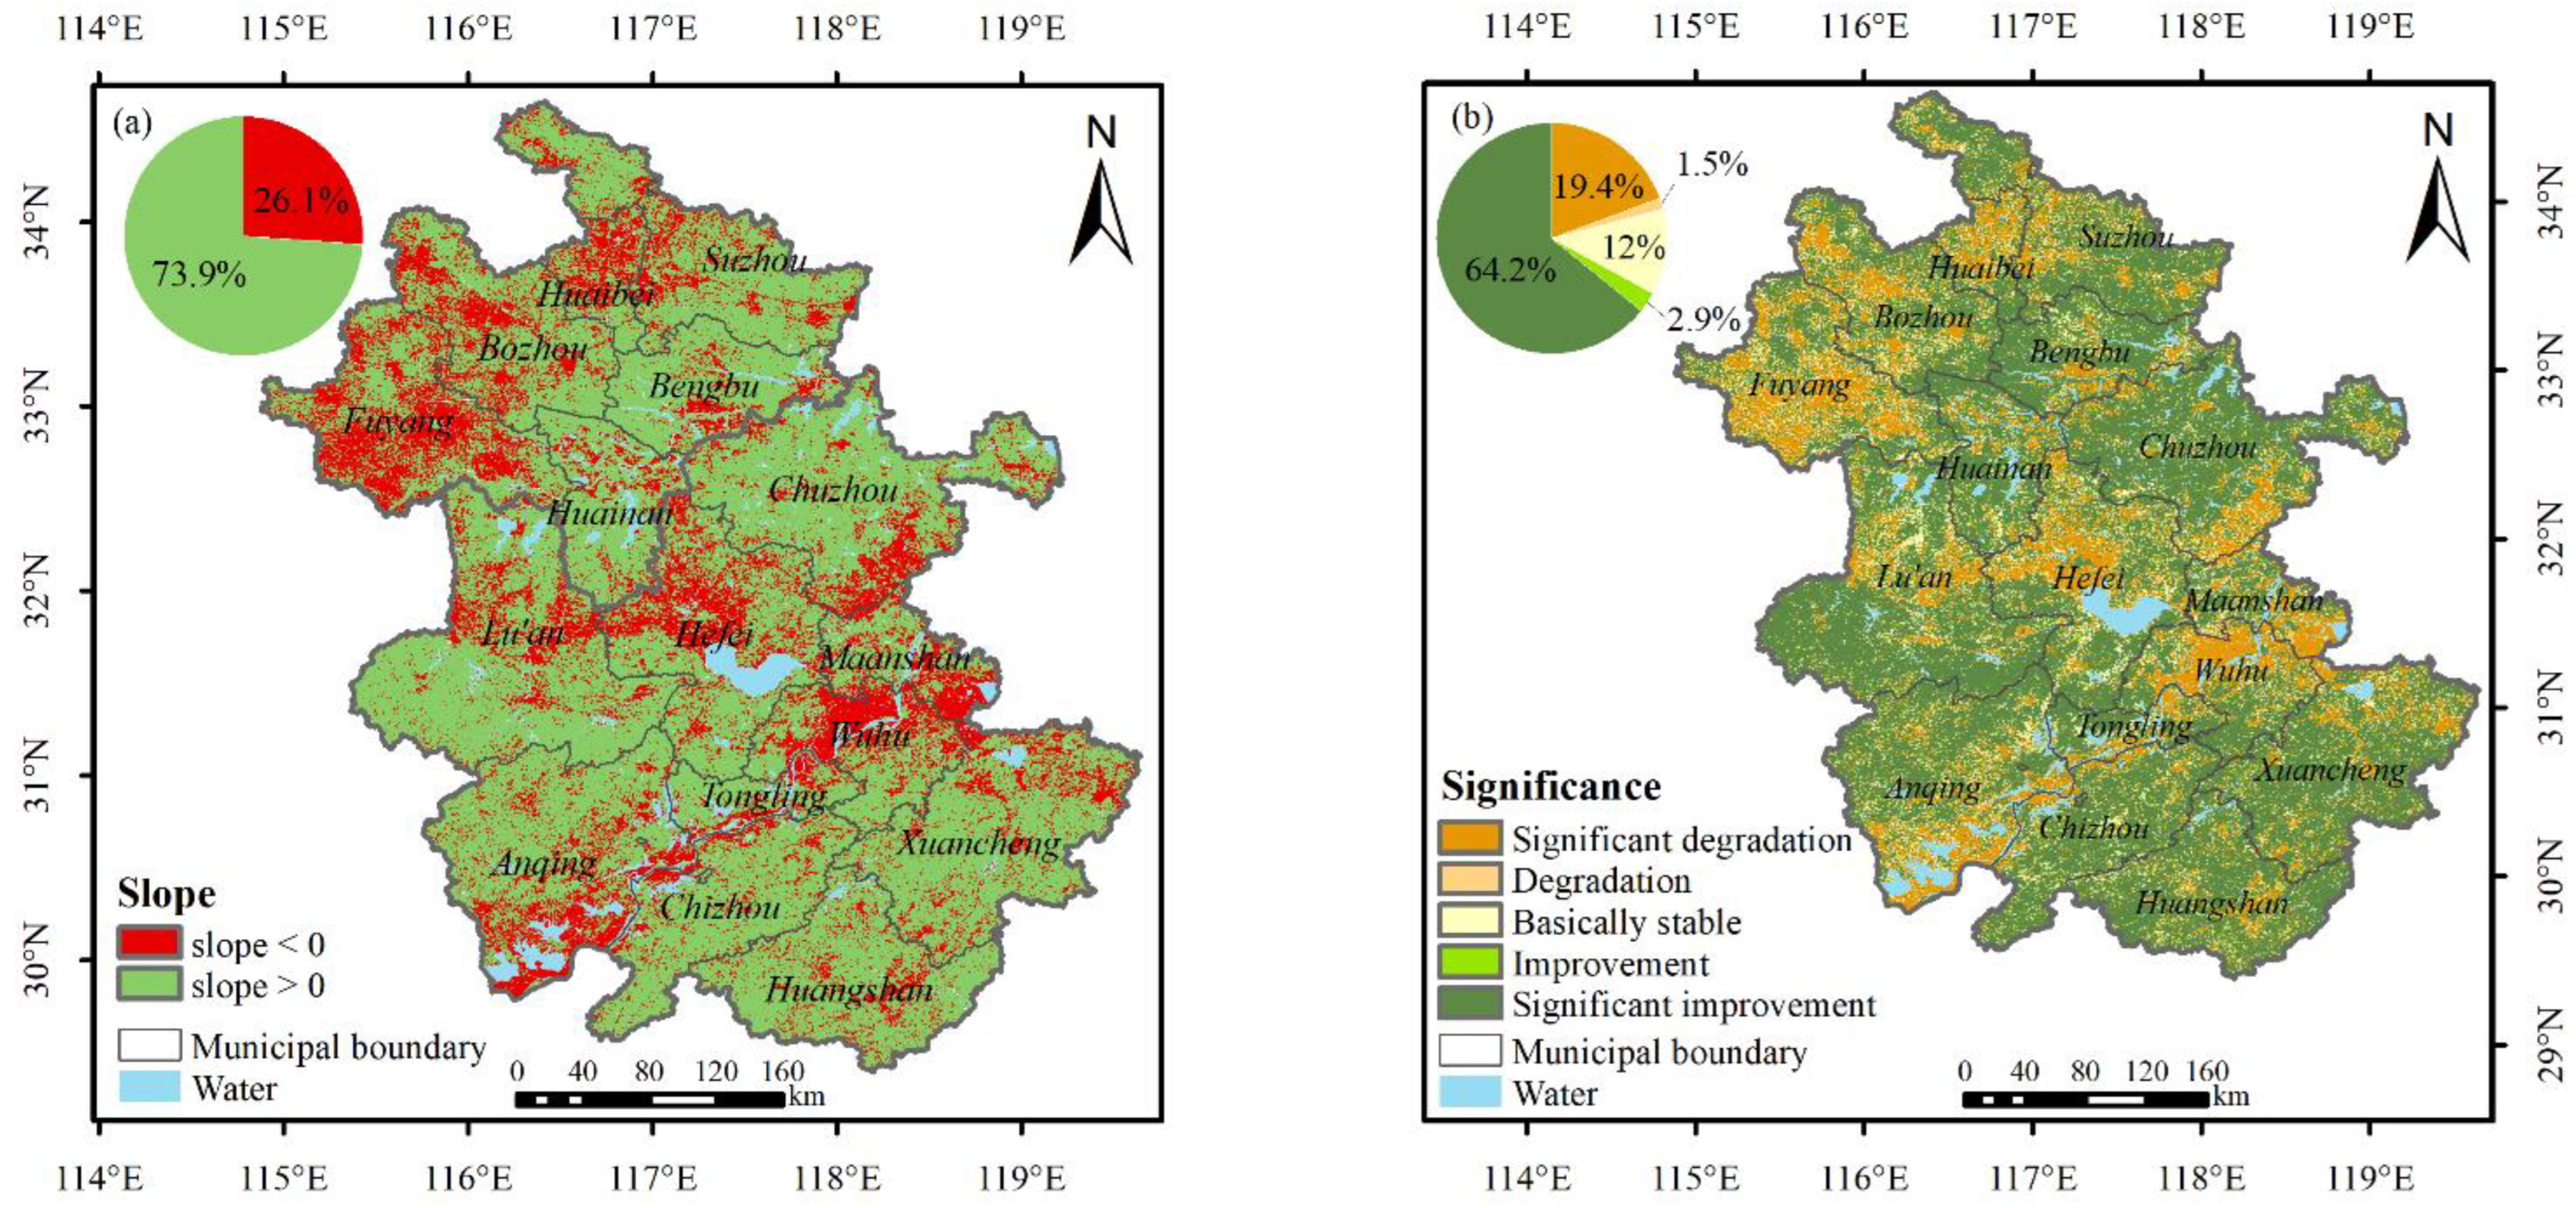
3.1.3. Spatial Trend in EVI
3.1.4. Stability of EVI Variations
3.1.5. Sustainability of EVI Variations
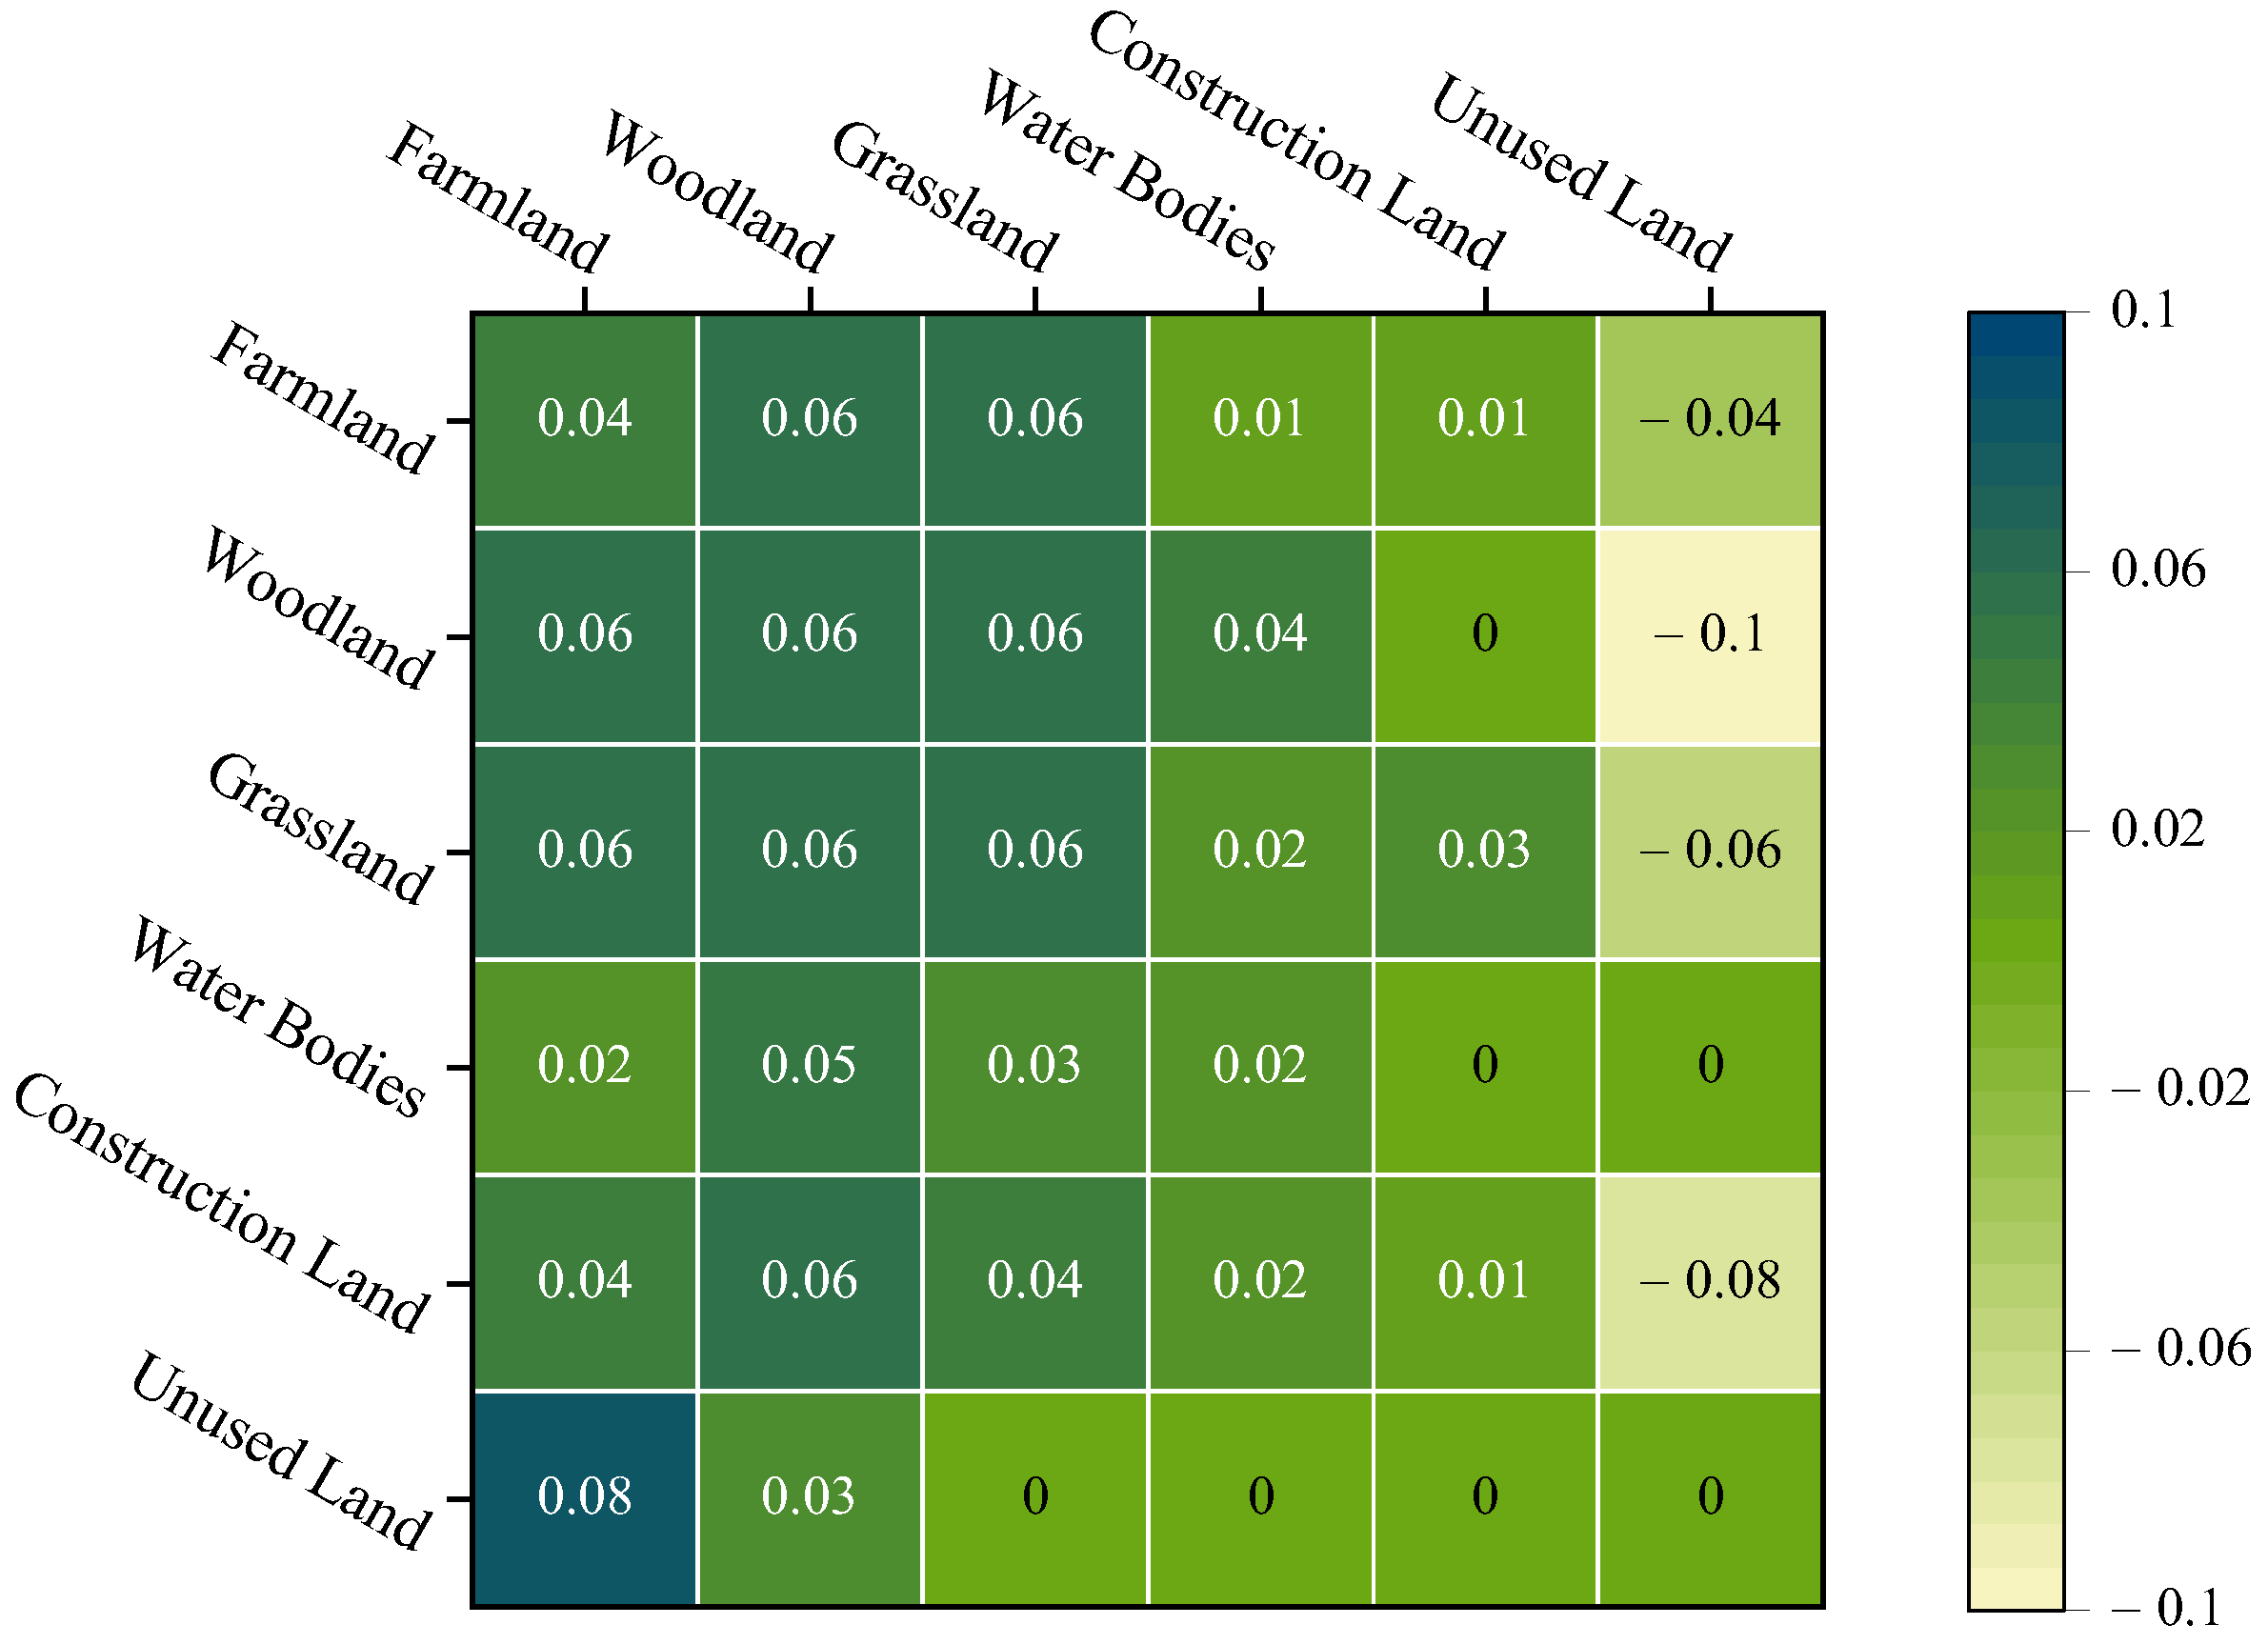
3.2. Superposition of EVI Variation and Land-Use Change in Anhui Province
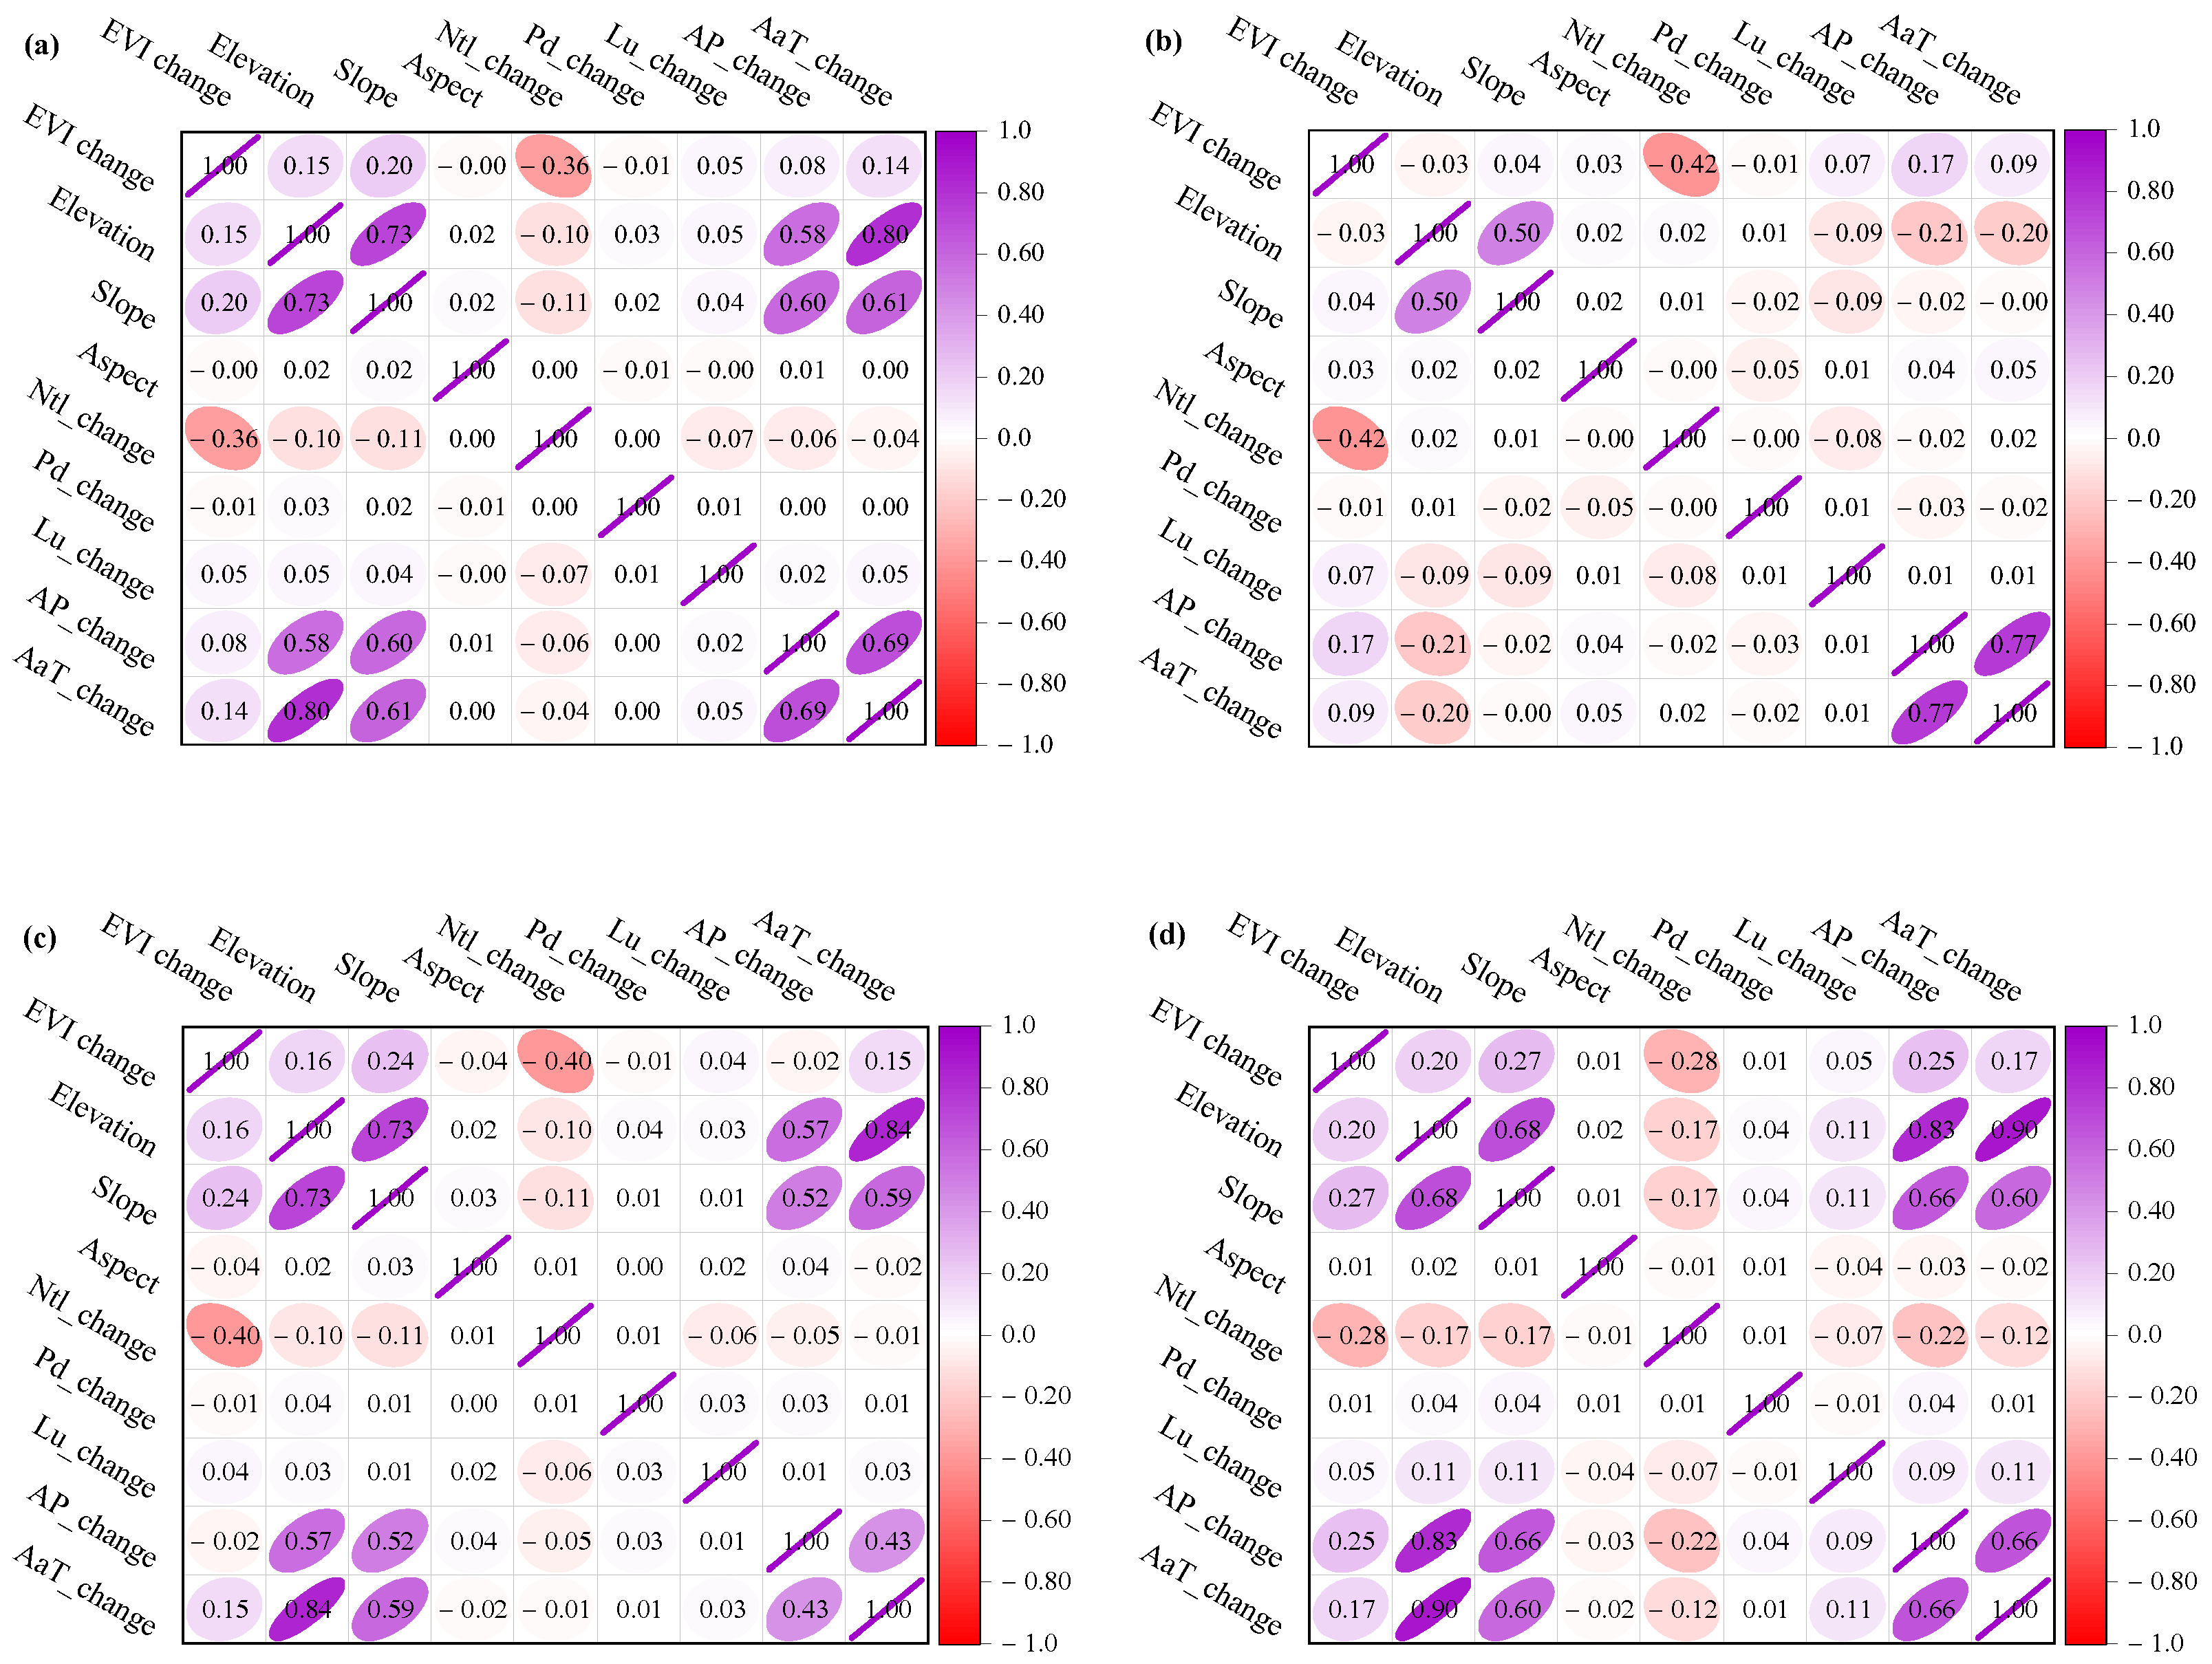
3.3. SEM of EVI Variation in Anhui Province
3.4. SEM of EVI Variations in Northern, Central and Southern Anhui
4. Discussion
4.1. Spatial and Temporal Variations in the EVI
4.2. Drivers of EVI Variation
4.2.1. Topographic Factors
4.2.2. Climate Factors
4.2.3. Human Activity Factors
4.3. Advantages of SEM
4.4. Limitations of This Study
5. Conclusions
- (1)
- Temporally, the EVI of Anhui Province showed a trend of a fluctuating increase at a rate of 0.0181·10a−1 between 2000 and 2020.
- (2)
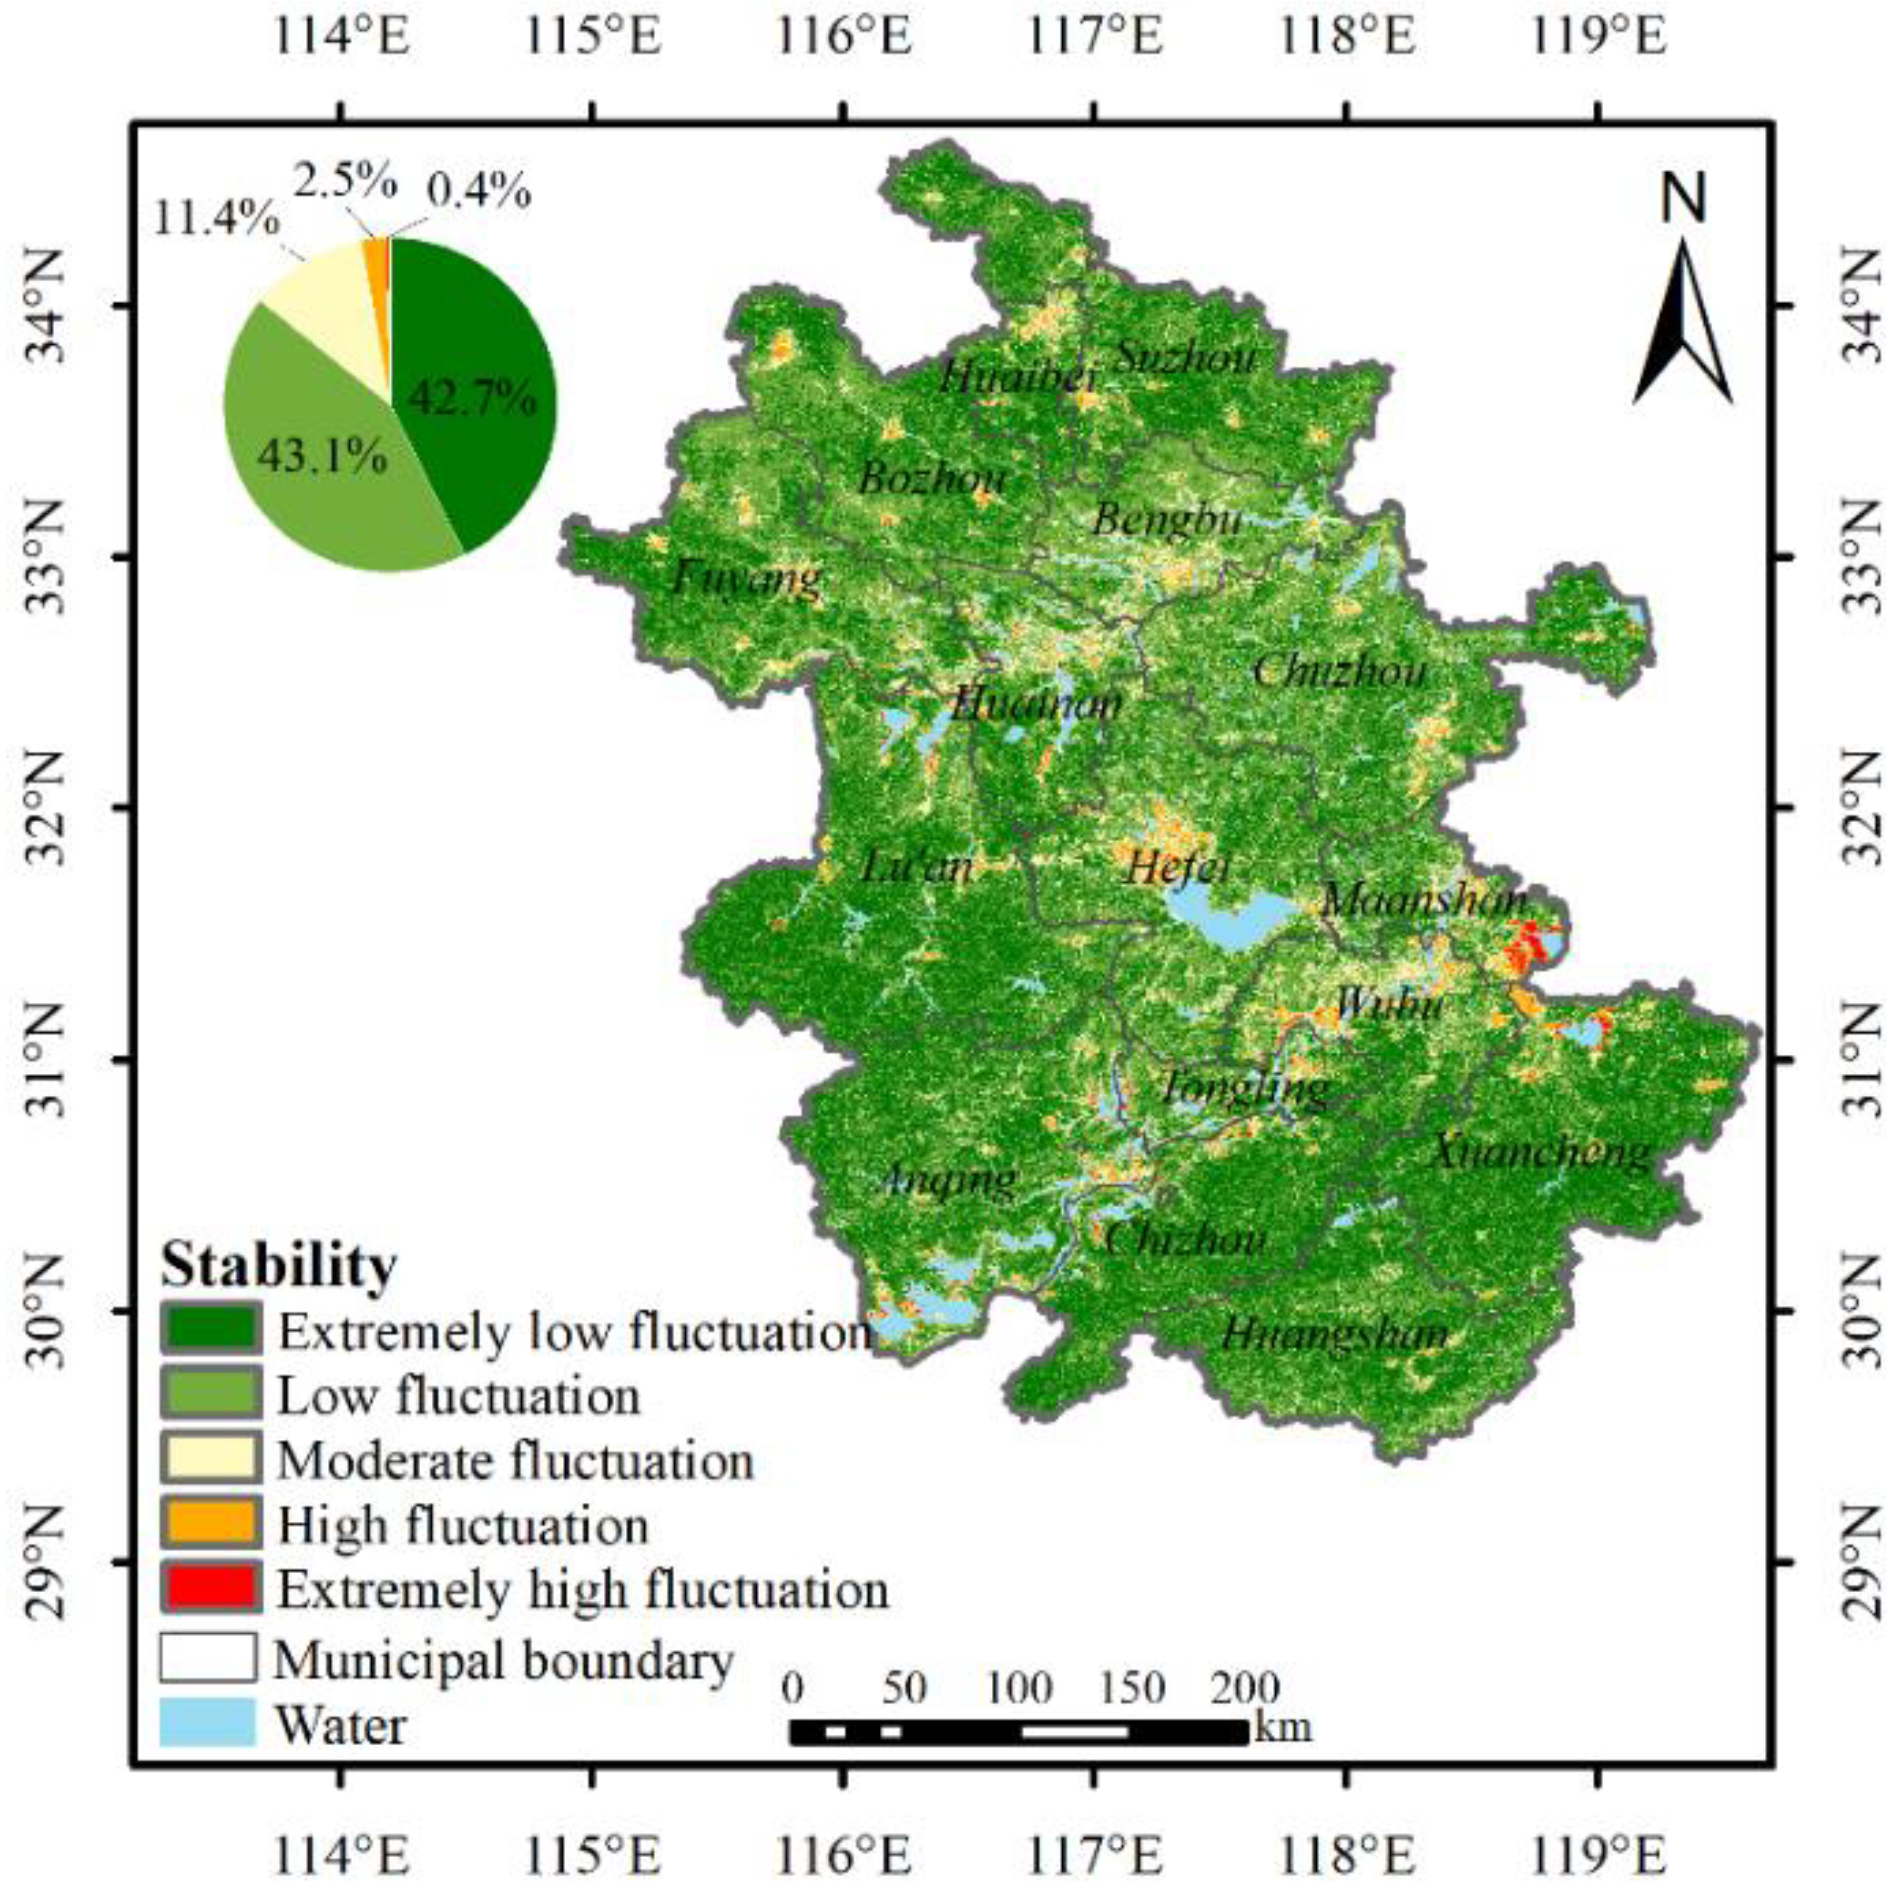
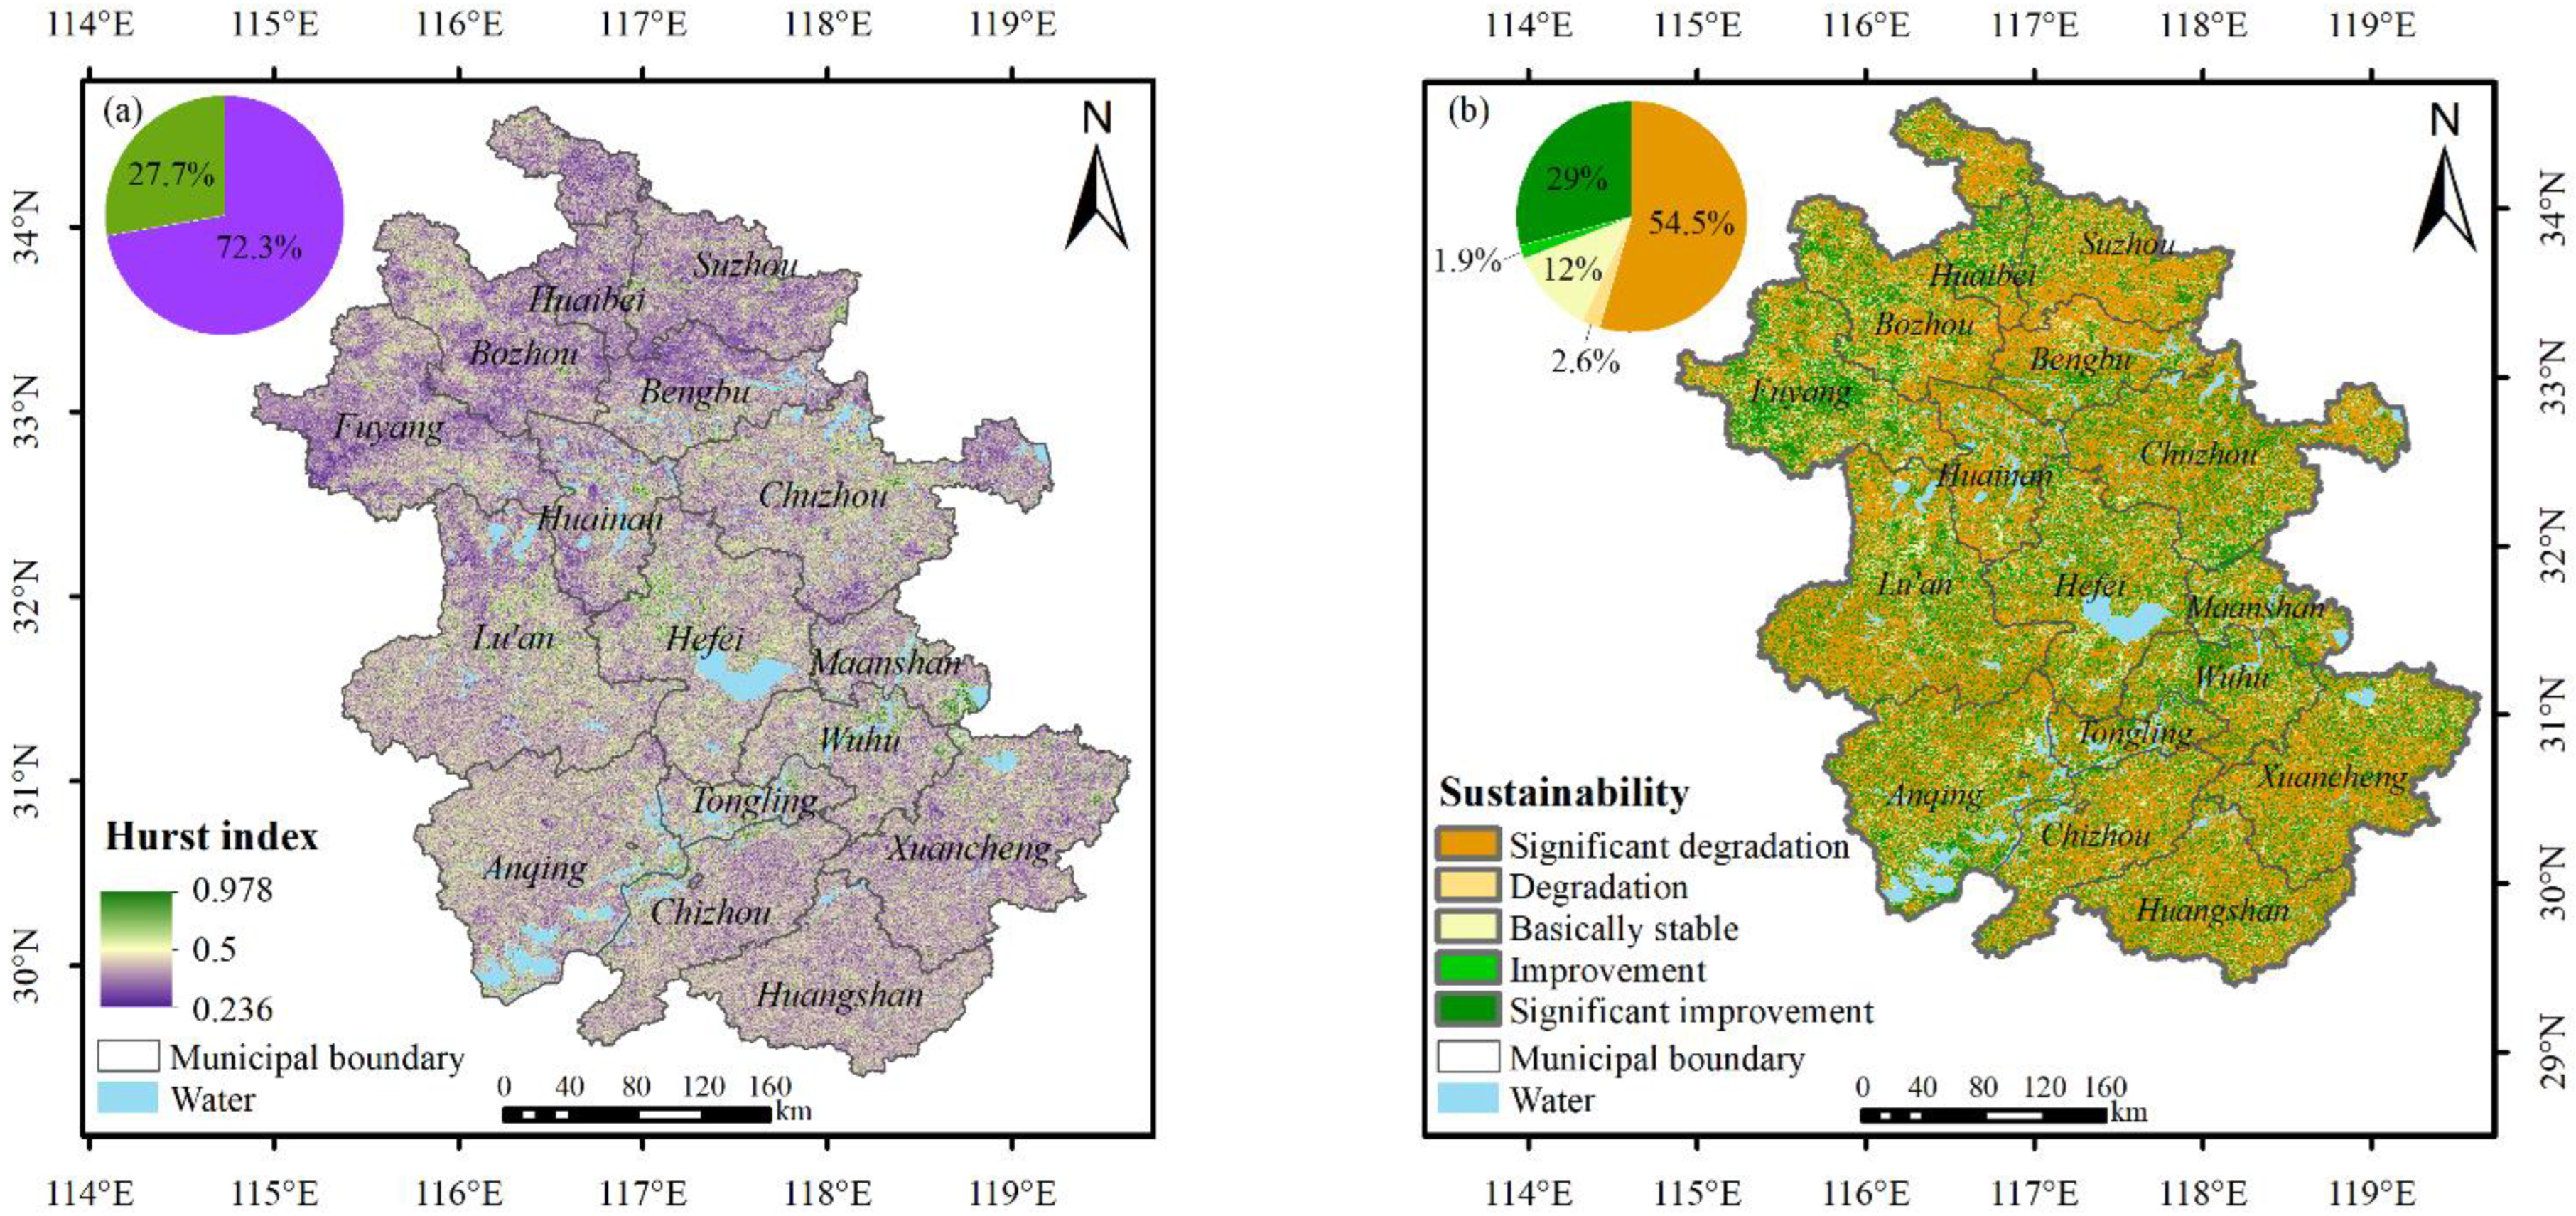
- The EVI in Anhui Province showed a spatial distribution pattern of being high in the north and south and low in the middle. The spatial trend in EVI was dominated by improvement, with 64.2% of the regions having significant improvements in EVI. The fluctuation in EVI variation in most regions of the province was extremely low and low. High fluctuations occurred in urban areas. After 2020, the EVI is likely to decrease, so the government should strengthen relevant vegetation greening and protection measures.
- (3)
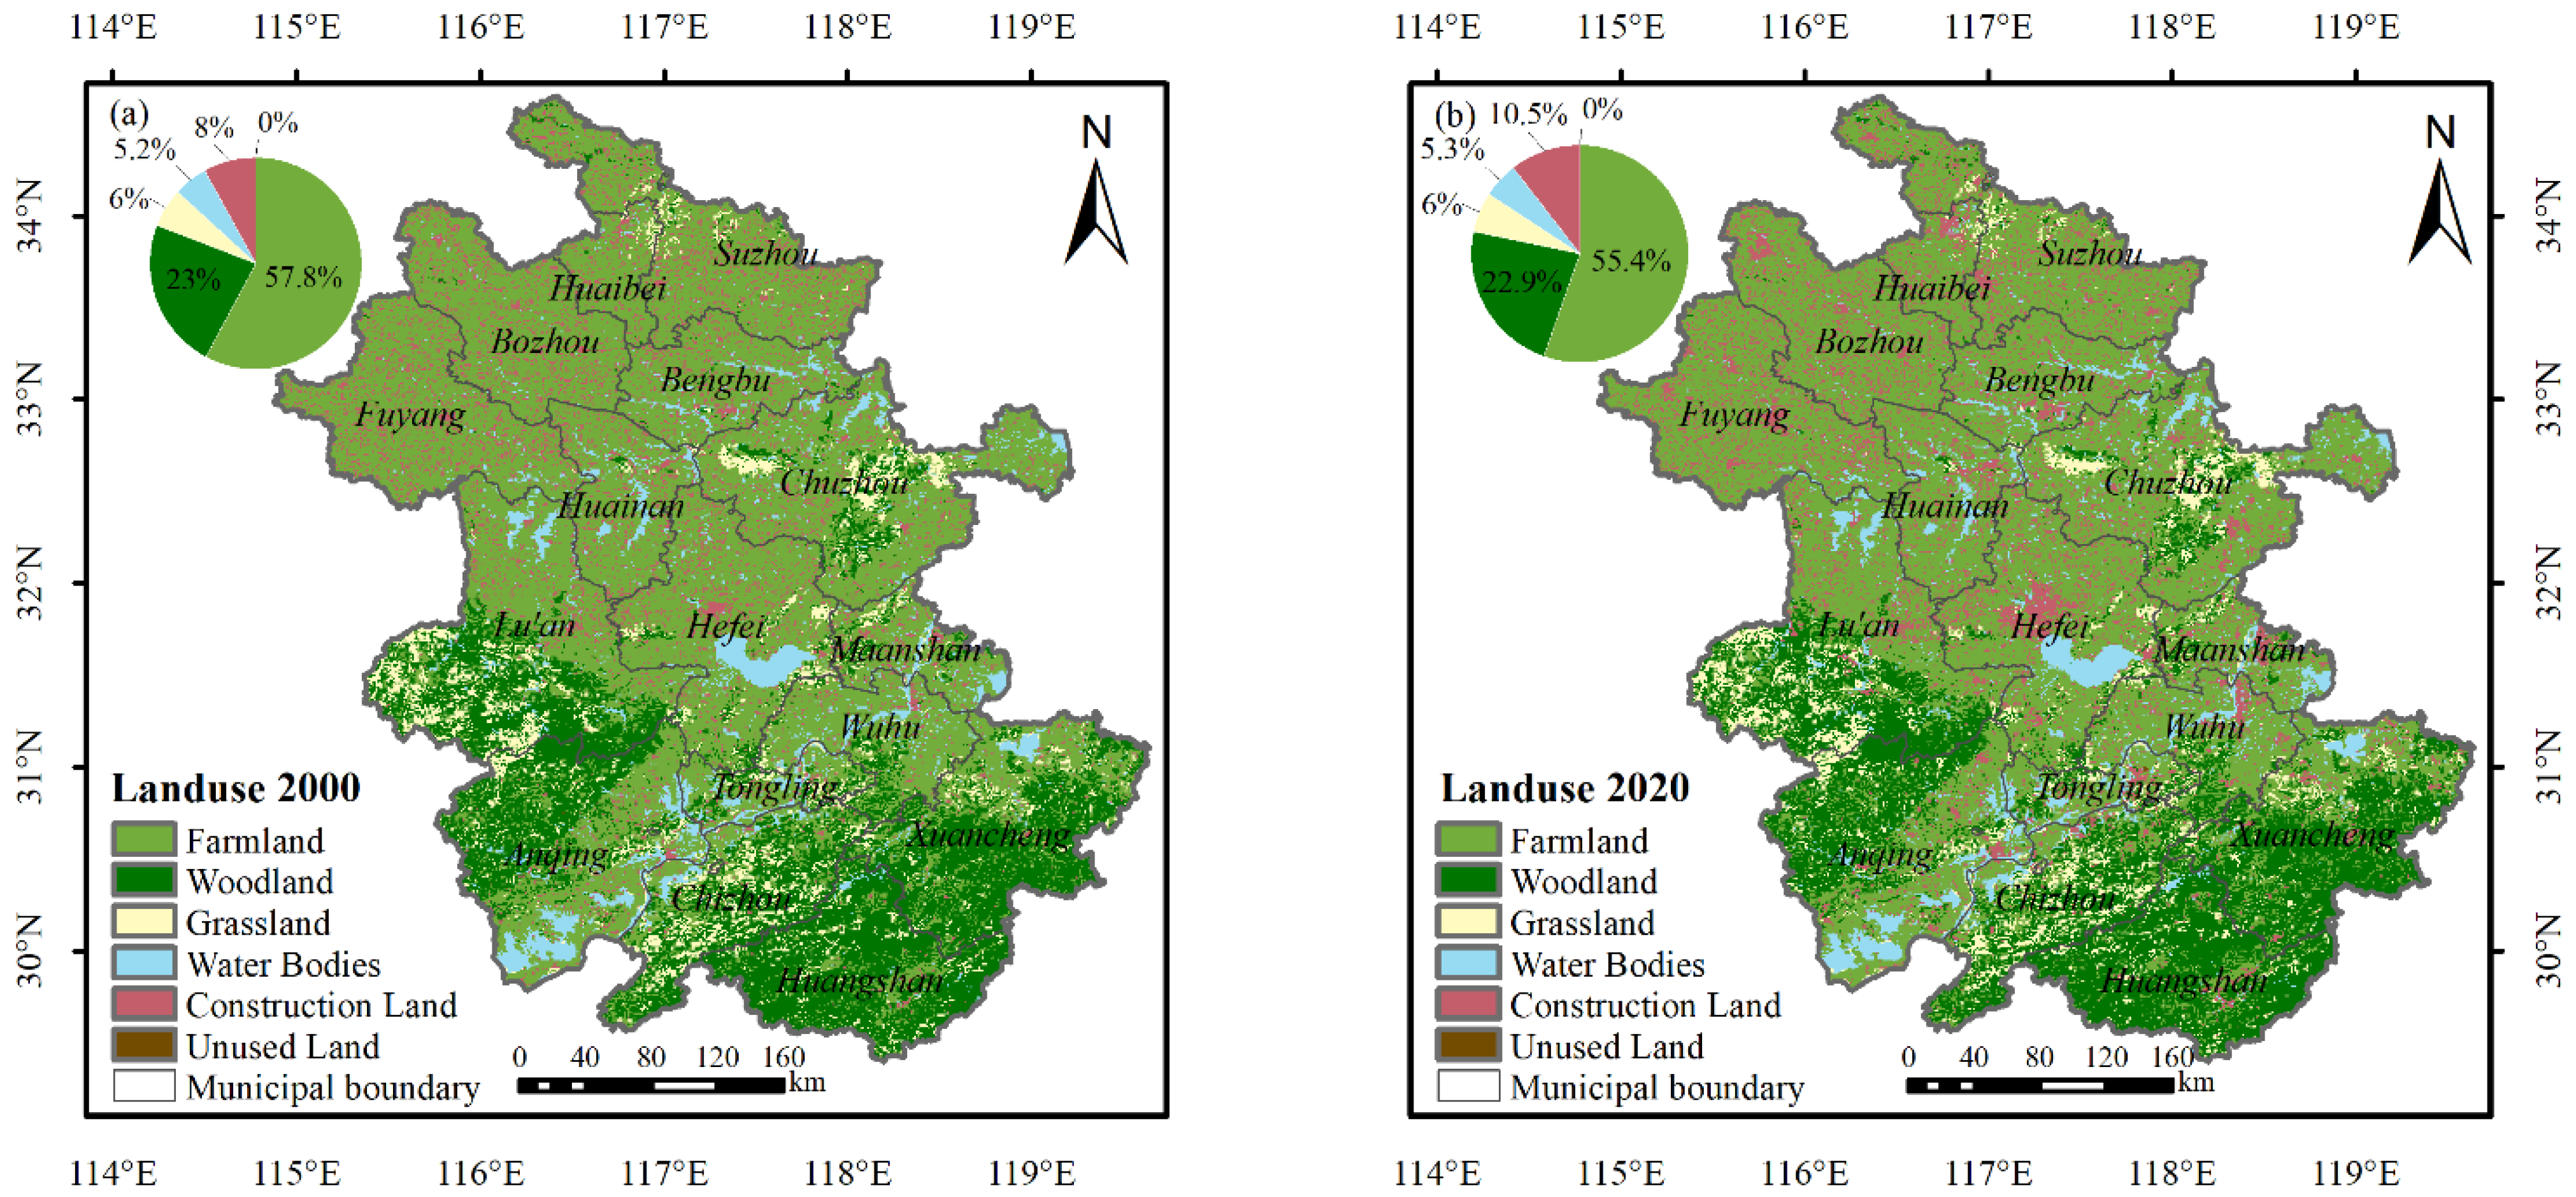
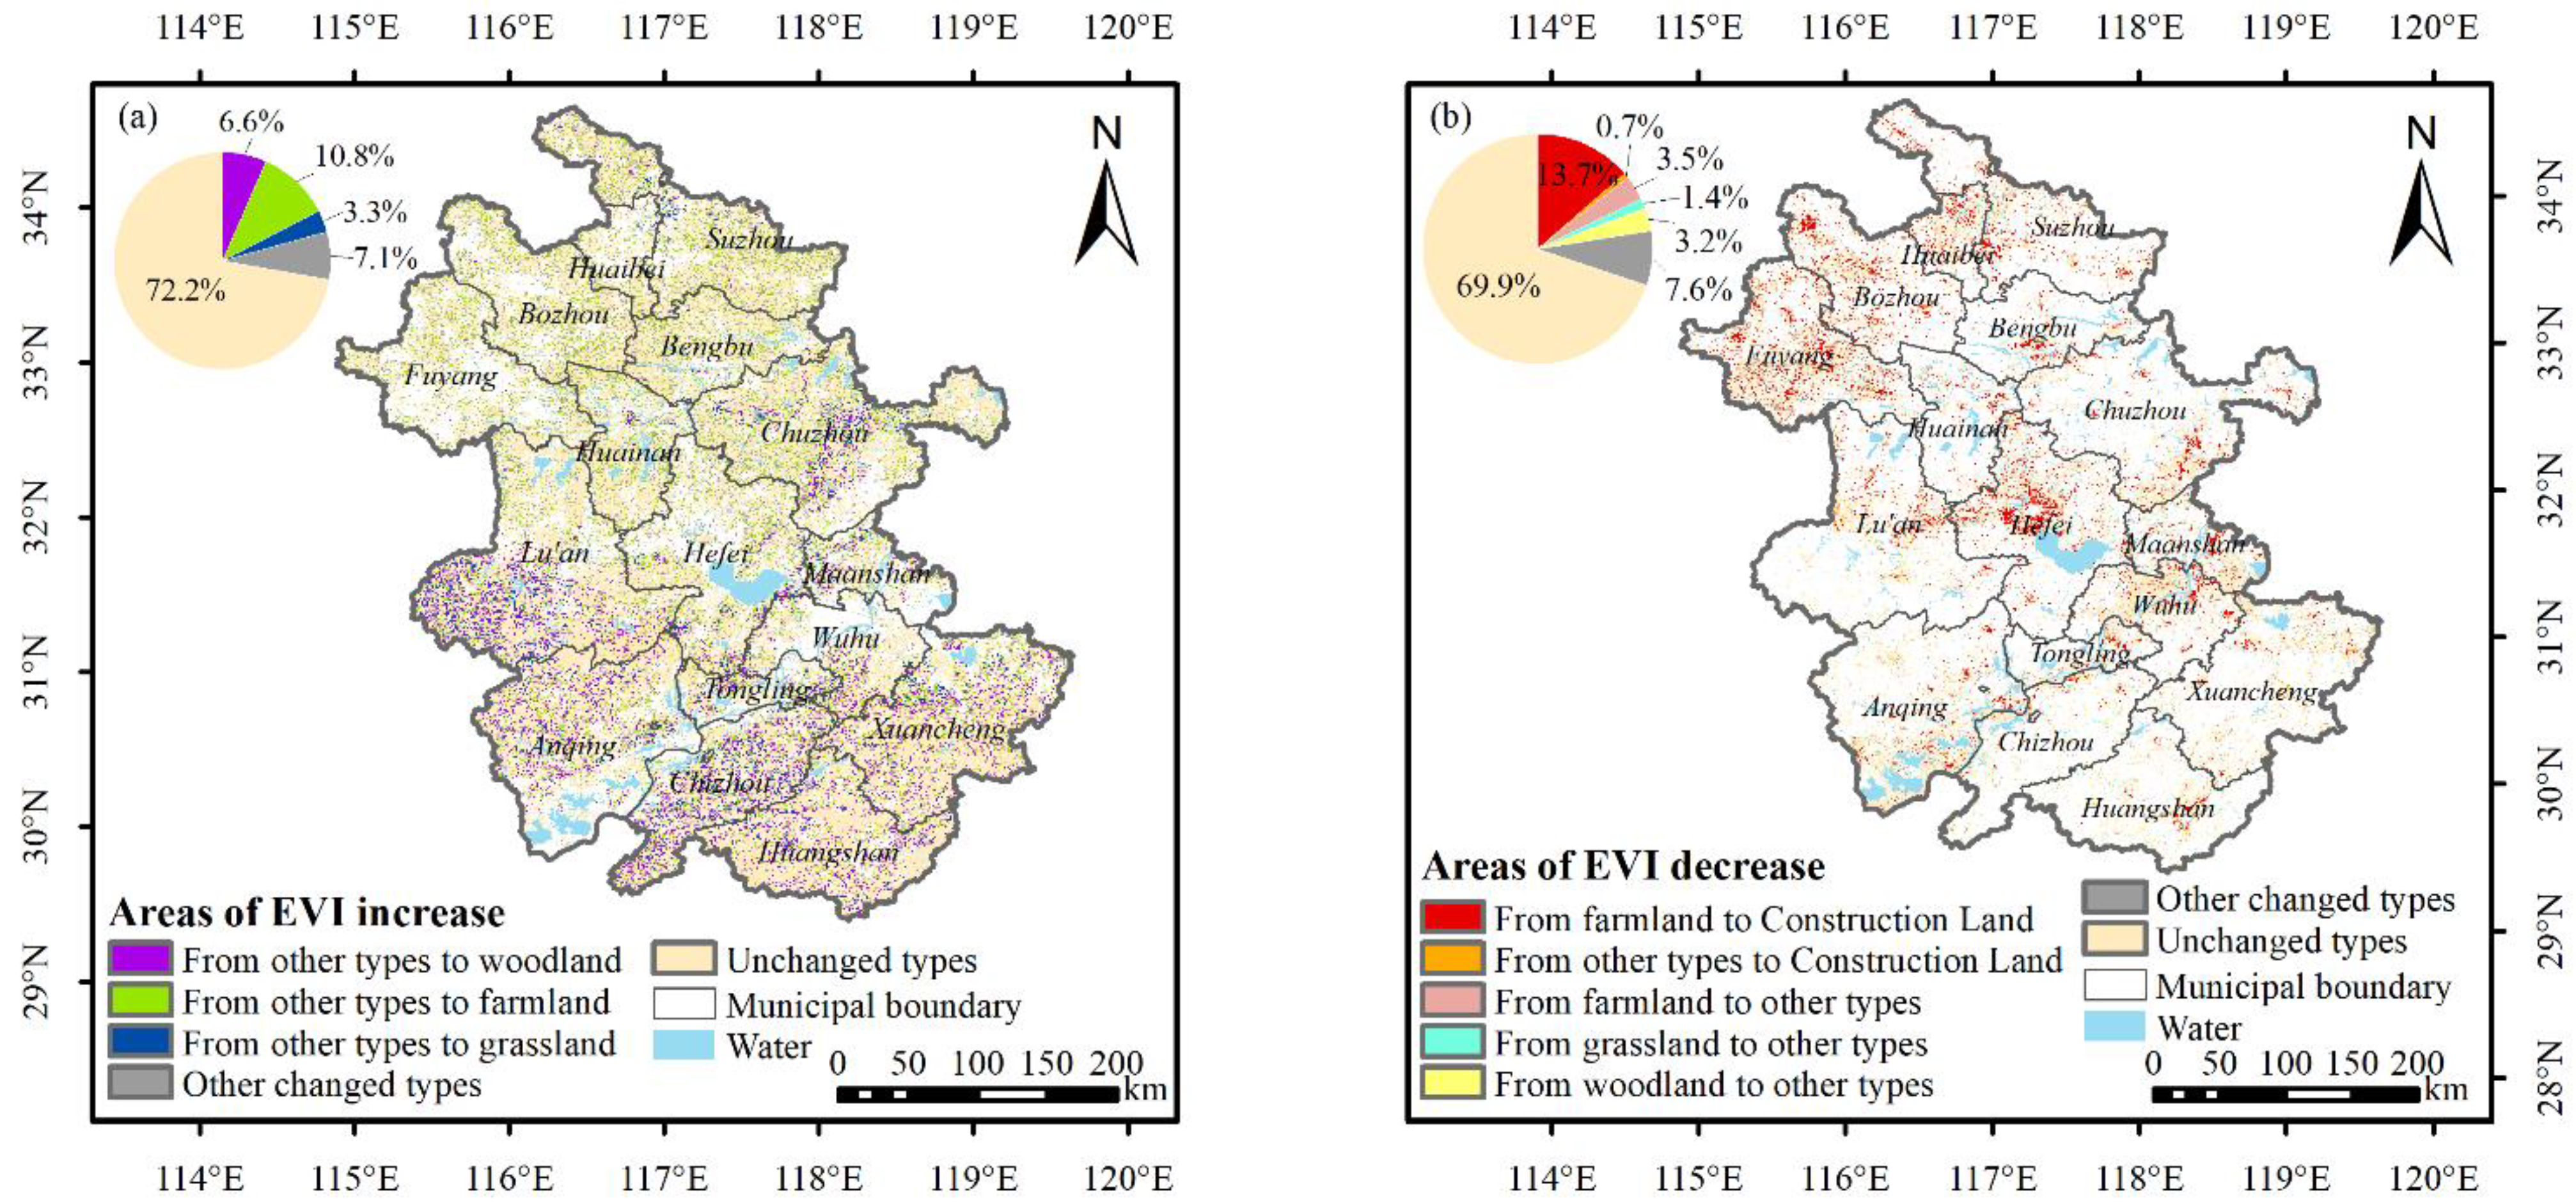
- Among the areas where EVI increased, 10.8% of the areas was transferred from “other” land use to farmland, mainly in the northern and central Anhui plain areas. Some 6.6% were transferred from “other” land use to woodland, mainly in the mountainous area of central and southern Anhui. Among the regions with reduced EVI, 13.7% was transferred from farmland to construction land, mainly in Hefei, Fuyang, Bozhou, Huaibei, and the Wanjiang River urban belt. Therefore, the government needs to pay special attention to the coordinated development of accelerated urbanization and ecological environmental protection.
- (4)
- The SEM showed that human activity changes (mainly nighttime light change) were the main cause of EVI decreases in Anhui Province. Except for northern Anhui, central and southern Anhui were affected by the complexity of the topography. In addition, the EVI variations in Anhui Province were less influenced by annual average temperature change, and the influence of annual precipitation change showed that northern and central Anhui were higher than southern Anhui.
Author Contributions
Funding
Data Availability Statement
Acknowledgments
Conflicts of Interest
References
- Guan, J.; Yao, J.; Li, M.; Zheng, J. Assessing the Spatiotemporal Evolution of Anthropogenic Impacts on Remotely Sensed Vegetation Dynamics in Xinjiang, China. Remote Sens. 2021, 13, 4651. [Google Scholar] [CrossRef]
- Fan, D.; Ni, L.; Jiang, X.; Fang, S.; Wu, H.; Zhang, X. Spatiotemporal analysis of vegetation changes along the belt and road initiative region from 1982 to 2015. IEEE Access 2020, 8, 122579–122588. [Google Scholar] [CrossRef]
- Liu, S.; Huang, S.; Xie, Y.; Wang, H.; Huang, Q.; Leng, G.; Li, P.; Wang, L. Spatial-temporal changes in vegetation cover in a typical semi-humid and semi-arid region in China: Changing patterns, causes and implications. Ecol. Indic. 2019, 98, 462–475. [Google Scholar] [CrossRef]
- Liu, C.; Li, W.; Wang, W.; Zhou, H.; Liang, T.; Hou, F.; Xu, J.; Xue, P. Quantitative spatial analysis of vegetation dynamics and potential driving factors in a typical alpine region on the northeastern Tibetan Plateau using the Google Earth Engine. Catena 2021, 206, 105500. [Google Scholar] [CrossRef]
- Yang, K.; Sun, W.; Luo, Y.; Zhao, L. Impact of urban expansion on vegetation: The case of China (2000–2018). J. Environ. Manag. 2021, 291, 112598. [Google Scholar] [CrossRef]
- Jiang, M.; He, Y.; Song, C.; Pan, Y.; Qiu, T.; Tian, S. Disaggregating climatic and anthropogenic influences on vegetation changes in Beijing-Tianjin-Hebei region of China. Sci. Total Environ. 2021, 786, 147574. [Google Scholar] [CrossRef]
- Kang, Y.; Guo, E.; Wang, Y.; Bao, Y.; Bao, Y.; Mandula, N. Monitoring Vegetation Change and Its Potential Drivers in Inner Mongolia from 2000 to 2019. Remote Sens. 2021, 13, 3357. [Google Scholar] [CrossRef]
- Feng, D.; Fu, M.; Sun, Y.; Bao, W.; Zhang, M.; Zhang, Y.; Wu, J. How Large-Scale Anthropogenic Activities Influence Vegetation Cover Change in China? A Review. Forests 2021, 12, 320. [Google Scholar] [CrossRef]
- Ali, S.; Tong, D.; Xu, Z.; Henchiri, M.; Wilson, K.; Siqi, S.; Zhang, J. Characterization of drought monitoring events through MODIS and TRMM-based DSI and TVDI over South Asia during 2001–2017. Environ. Sci. Pollut. Res. 2021, 28, 21085–21100. [Google Scholar] [CrossRef]
- Liu, Q.; Zhang, J.; Zhang, H.; Yao, F.; Bai, Y.; Zhang, S.; Meng, X.; Liu, Q. Evaluating the performance of eight drought indices for capturing soil moisture dynamics in various vegetation regions over China. Sci. Total Environ. 2021, 789, 147803. [Google Scholar] [CrossRef]
- Ren, Y.; Liu, J.; Liu, S.; Wang, Z.; Liu, T.; Shalamzari, M.J. Effects of Climate Change on Vegetation Growth in the Yellow River Basin from 2000 to 2019. Remote Sens. 2022, 14, 687. [Google Scholar] [CrossRef]
- Shi, S.; Wang, P.; Zhang, Y.; Yu, J. Cumulative and time-lag effects of the main climate factors on natural vegetation across Siberia. Ecol. Indic. 2021, 133, 108446. [Google Scholar] [CrossRef]
- Li, J.; Peng, S.; Li, Z. Detecting and attributing vegetation changes on China’s Loess Plateau. Agric. For. Meteorol. 2017, 247, 260–270. [Google Scholar] [CrossRef]
- Diao, C.; Liu, Y.; Zhao, L.; Zhuo, G.; Zhang, Y. Regional-scale vegetation-climate interactions on the Qinghai-Tibet Plateau. Ecol. Inform. 2021, 65, 101413. [Google Scholar] [CrossRef]
- Huete, A.; Didan, K.; Miura, T.; Rodriguez, E.P.; Gao, X.; Ferreira, L.G. Overview of the radiometric and biophysical performance of the MODIS vegetation indices. Sci. Total Environ. 2002, 83, 195–213. [Google Scholar] [CrossRef]
- Liu, H.; Li, X.; Mao, F.; Zhang, M.; Zhu, D.; He, S.; Huang, Z.; Du, H. Spatiotemporal evolution of fractional vegetation cover and its response to climate change based on MODIS data in the subtropical region of China. Remote Sens. 2021, 13, 913. [Google Scholar] [CrossRef]
- Liu, H.; Liu, F.; Yuan, H.; Zheng, L.; Zhang, Y. Assessing the relative role of climate and human activities on vegetation cover changes in the up–down stream of Danjiangkou, China. J. Plant Ecol. 2022, 15, 180–195. [Google Scholar] [CrossRef]
- Jiang, W.; Niu, Z.; Wang, L.; Yao, R.; Gui, X.; Xiang, F.; Ji, Y. Impacts of Drought and Climatic Factors on Vegetation Dynamics in the Yellow River Basin and Yangtze River Basin, China. Remote Sens. 2022, 14, 930. [Google Scholar] [CrossRef]
- Liu, Z.; Liu, Y.; Li, Y. Anthropogenic contributions dominate trends of vegetation cover change over the farming-pastoral ecotone of northern China. Ecol. Indic. 2018, 95, 370–378. [Google Scholar] [CrossRef]
- Xue, L.; Kappas, M.; Wyss, D.; Wang, C.; Putzenlechner, B.; Thi, N.P.; Chen, J. Assessment of climate change and human activities on vegetation development in Northeast China. Sensors 2022, 22, 2509. [Google Scholar] [CrossRef]
- Deng, X.; Hu, S.; Zhan, C. Attribution of vegetation coverage change to climate change and human activities based on the geographic detectors in the Yellow River Basin, China. Environ. Sci. Pollut. Res. 2022, 29, 44693–44708. [Google Scholar] [CrossRef] [PubMed]
- Wang, G.; Peng, W. Quantifying spatiotemporal dynamics of vegetation and its differentiation mechanism based on geographical detector. Environ. Sci. Pollut. Res. 2022, 29, 32016–32031. [Google Scholar] [CrossRef] [PubMed]
- Leroux, L.; Bégué, A.; Seen, D.L.; Jolivot, A.; Kayitakire, F. Driving forces of recent vegetation changes in the Sahel: Lessons learned from regional and local level analyses. Sci. Total Environ. 2017, 191, 38–54. [Google Scholar] [CrossRef]
- Bafitlhile, T.M.; Liu, Y. Temperature contributes more than precipitation to the greening of the Tibetan Plateau during 1982–2019. Theor. Appl. Climatol. 2022, 147, 1471–1488. [Google Scholar] [CrossRef]
- Xue, J.; Wang, Y.; Teng, H.; Wang, N.; Li, D.; Peng, J.; Biswas, A.; Shi, Z. Dynamics of Vegetation Greenness and Its Response to Climate Change in Xinjiang over the Past Two Decades. Remote Sens. 2021, 13, 4063. [Google Scholar] [CrossRef]
- Na, R.; Na, L.; Du, H.; He, H.S.; Shan, Y.; Zong, S.; Huang, L.; Yang, Y.; Wu, Z. Vegetation Greenness Variations and Response to Climate Change in the Arid and Semi-Arid Transition Zone of the Mongo-Lian Plateau during 1982–2015. Remote Sens. 2021, 13, 4066. [Google Scholar] [CrossRef]
- Tang, Z.; Ma, J.; Peng, H.; Wang, S.; Wei, J. Spatiotemporal changes of vegetation and their responses to temperature and precipitation in upper Shiyang river basin. Adv. Space Res. 2017, 60, 969–979. [Google Scholar] [CrossRef]
- Liu, Y.; Tian, J.; Liu, R.; Ding, L. Influences of Climate Change and Human Activities on NDVI Changes in China. Remote Sens. 2021, 13, 4326. [Google Scholar] [CrossRef]
- Shi, S.; Yu, J.; Wang, F.; Wang, P.; Zhang, Y.; Jin, K. Quantitative contributions of climate change and human activities to vegetation changes over multiple time scales on the Loess Plateau. Sci. Total Environ. 2021, 755, 142419. [Google Scholar] [CrossRef] [PubMed]
- Zhang, Y.; He, Y.; Li, Y.; Jia, L. Spatiotemporal variation and driving forces of NDVI from 1982 to 2015 in the Qinba Mountains, China. Environ. Sci. Pollut. Res. 2022, 29, 52277–52288. [Google Scholar] [CrossRef]
- Zhang, M.; Du, H.; Zhou, G.; Mao, F.; Li, X.; Zhou, L.; Zhu, D.; Xu, Y.; Huang, Z. Spatiotemporal Patterns and Driving Force of Urbanization and Its Impact on Urban Ecology. Remote Sens. 2022, 14, 1160. [Google Scholar] [CrossRef]
- Yang, W.; Zhao, Y.; Wang, Q.; Guan, B. Climate, CO2, and Anthropogenic Drivers of Accelerated Vegetation Greening in the Haihe River Basin. Remote Sens. 2022, 14, 268. [Google Scholar] [CrossRef]
- Xiong, Y.; Li, Y.; Xiong, S.; Wu, G.; Deng, O. Multi-scale spatial correlation between vegetation index and terrain attributes in a small watershed of the upper Minjiang River. Ecol. Indic. 2021, 126, 107610. [Google Scholar] [CrossRef]
- Wang, J.; Sun, H.; Xiong, J.; He, D.; Cheng, W.; Ye, C.; Yong, Z.; Huang, X. Dynamics and drivers of vegetation phenology in three-river headwaters region based on the Google Earth engine. Remote Sens. 2021, 13, 2528. [Google Scholar] [CrossRef]
- Hou, D.; Al-Tabbaa, A.; Chen, H.; Mamic, I. Factor analysis and structural equation modelling of sustainable behaviour in contaminated land remediation. J. Clean. Prod. 2014, 84, 439–449. [Google Scholar] [CrossRef]
- Li, Z.; Han, X.; Lin, X.; Lu, X. Quantitative analysis of landscape efficacy based on structural equation modelling: Empirical evidence from new Chinese style commercial streets. Alex. Eng. J. 2021, 60, 261–271. [Google Scholar] [CrossRef]
- Pearl, J. The causal mediation formula—A guide to the assessment of pathways and mechanisms. Prev. Sci. 2012, 13, 426–436. [Google Scholar] [CrossRef]
- Liu, C.; Zhang, F.; Wang, X.; Chan, N.W.; Rahman, H.A.; Yang, S.; Tan, M.L. Assessing the factors influencing water quality using environment water quality index and partial least squares structural equation model in the Ebinur Lake Watershed, Xinjiang, China. Environ. Sci. Pollut. Res. 2022, 29, 29033–29048. [Google Scholar] [CrossRef]
- Urbach, N.; Ahlemann, F. Structural equation modeling in information systems research using partial least squares. J. Inf. Technol. Theory Appl. 2010, 11, 5–40. [Google Scholar]
- Shao, W.; Wang, Q.; Guan, Q.; Luo, H.; Ma, Y.; Zhang, J. Distribution of soil available nutrients and their response to environmental factors based on path analysis model in arid and semi-arid area of northwest China. Sci. Total Environ. 2022, 827, 154254. [Google Scholar] [CrossRef]
- Hao, J.; Xu, G.; Luo, L.; Zhang, Z.; Yang, H.; Li, H. Quantifying the relative contribution of natural and human factors to vegetation coverage variation in coastal wetlands in China. Catena 2020, 188, 104429. [Google Scholar] [CrossRef]
- Yang, H.; Hu, D.; Xu, H.; Zhong, X. Assessing the spatiotemporal variation of NPP and its response to driving factors in Anhui province, China. Environ. Sci. Pollut. Res. 2020, 27, 14915–14932. [Google Scholar] [CrossRef]
- Yao, Z.; Wu, D.; Chu, R.; Yao, Y.; He, B.; Huang, Y. Dynamic change of vegetation coverage and its response to topography in Anhui Province. Bull. Soil Water Conserv. 2021, 41, 283–290. [Google Scholar]
- Chen, Z.; Yu, B.; Yang, C.; Zhou, Y.; Yao, S.; Qian, X.; Wang, C.; Wu, B.; Wu, J. An extended time series (2000–2018) of global NPP-VIIRS-like nighttime light data from a cross-sensor calibration. Earth Syst. Sci. Data 2021, 13, 889–906. [Google Scholar] [CrossRef]
- Ma, B.; Wang, S.; Mupenzi, C.; Li, H.; Ma, J.; Li, Z. Quantitative contributions of climate change and human activities to vegetation changes in the Upper White Nile River. Remote Sens. 2021, 13, 3648. [Google Scholar] [CrossRef]
- Gu, Z.; Duan, X.; Shi, Y.; Li, Y.; Xi, P. Spatiotemporal variation in vegetation coverage and its response to climatic factors in the Red River Basin, China. Ecol. Indic. 2018, 93, 54–64. [Google Scholar] [CrossRef]
- Hong, S.; Kim, S. Comparisons of multilevel modeling and structural equation modeling approaches to actor–partner interdependence model. Psychol. Rep. 2019, 122, 558–574. [Google Scholar] [CrossRef]
- Zheng, H.; Miao, C.; Li, X.; Kong, D.; Gou, J.; Wu, J.; Zhang, S. Effects of vegetation changes and multiple environmental factors on evapotranspiration across China over the past 34 years. Earth’s Future 2022, 10, e2021EF002564. [Google Scholar] [CrossRef]
- Peng, W.; Kuang, T.; Tao, S. Quantifying influences of natural factors on vegetation NDVI changes based on geographical detector in Sichuan, western China. J. Clean. Prod. 2019, 233, 353–367. [Google Scholar] [CrossRef]
- Zhang, Y.; Xu, G.; Li, P.; Li, Z.; Wang, Y.; Wang, B.; Jia, L.; Cheng, Y.; Zhang, J.; Zhuang, S.; et al. Vegetation change and its relationship with climate factors and elevation on the Tibetan plateau. Int. J. Environ. Res. Public Health 2019, 16, 4709. [Google Scholar] [CrossRef]
- Gao, S.; Dong, G.; Jiang, X.; Nie, T.; Yin, H.; Guo, X. Quantification of Natural and Anthropogenic Driving Forces of Vegetation Changes in the Three-River Headwater Region during 1982–2015 Based on Geographical Detector Model. Remote Sens. 2021, 13, 4175. [Google Scholar] [CrossRef]
- Yi, Y.; Wang, B.; Shi, M.; Meng, Z.; Zhang, C. Variation in Vegetation and Its Driving Force in the Middle Reaches of the Yangtze River in China. Water 2021, 13, 2036. [Google Scholar] [CrossRef]
- Sun, R.; Chen, S.; Su, H. Climate Dynamics of the Spatiotemporal Changes of Vegetation NDVI in Northern China from 1982 to 2015. Remote Sens. 2021, 13, 187. [Google Scholar] [CrossRef]
- Liu, Q.; Liu, L.; Zhang, Y.; Wang, Z.; Wu, J.; Li, L.; Li, S.; Paudel, B. Identification of impact factors for differentiated patterns of NDVI change in the headwater source region of Brahmaputra and Indus, Southwestern Tibetan Plateau. Ecol. Indic. 2021, 125, 107604. [Google Scholar] [CrossRef]
- Chen, J.; Yan, F.; Lu, Q. Spatiotemporal variation of vegetation on the Qinghai–Tibet Plateau and the influence of climatic factors and human activities on vegetation trend (2000–2019). Remote Sens. 2020, 12, 3150. [Google Scholar] [CrossRef]
- Feng, X.; Fu, B.; Piao, S.; Wang, S.; Ciais, P.; Zeng, Z.; Lü, Y.; Zeng, Y.; Li, Y.; Jiang, X.; et al. Revegetation in China’s Loess Plateau is approaching sustainable water resource limits. Nat. Clim. Chang. 2016, 6, 1019–1022. [Google Scholar] [CrossRef]
- Deng, W.; Yuan, X.; Liu, H.; Zhang, Y.; Li, B. Influence of regional climate change on vegetation cover in the middle and lower Yangtze River basin. Res. Environ. Sci. 2014, 27, 1032–1042. [Google Scholar]
- Díaz, S.; Pascual, U.; Stenseke, M.; Stenseke, M.; Martín-López, B.; Watson, R.T.; Molnár, Z.; Hill, R.; Chan, K.M.A.; Baste, I.A.; et al. Assessing nature’s contributions to people. Science 2018, 359, 270–272. [Google Scholar] [CrossRef]
- Zhang, X.; Huang, X. Human disturbance caused stronger influences on global vegetation change than climate change. PeerJ 2019, 7, e7763. [Google Scholar] [CrossRef]
- He, X.; Yu, Y.; Cui, Z.; He, T. Climate Change and Ecological Projects Jointly Promote Vegetation Restoration in Three-River Source Region of China. Chin. Geogr. Sci. 2021, 31, 1108–1122. [Google Scholar] [CrossRef]
- Yuan, J.; Xu, Y.; Xiang, J.; Wu, L.; Wang, D. Spatiotemporal variation of vegetation coverage and its associated influence factor analysis in the Yangtze River Delta, eastern China. Environ. Sci. Pollut. Res. 2019, 26, 32866–32879. [Google Scholar] [CrossRef] [PubMed]
- Qu, S.; Wang, L.; Lin, A.; Yu, D.; Yuan, M.; Li, C. Distinguishing the impacts of climate change and anthropogenic factors on vegetation dynamics in the Yangtze River Basin, China. Ecol. Indic. 2020, 108, 105724. [Google Scholar] [CrossRef]
- Qu, S.; Wang, L.; Lin, A.; Zhu, H.; Yuan, M. What drives the vegetation restoration in Yangtze River basin, China: Climate change or anthropogenic factors? Ecol. Indic. 2018, 90, 438–450. [Google Scholar] [CrossRef]
- Hao, C.; Wu, S.; Xu, C. Comparison of some vegetation indices in seasonal information. Chin. Geogr. Sci. 2008, 18, 242–248. [Google Scholar] [CrossRef]
- Cai, S.; Song, X.; Hu, R.; Guo, D. Ecosystem-Dependent Responses of Vegetation Coverage on the Tibetan Plateau to Climate Factors and Their Lag Periods. ISPRS Int. J. Geoinf. 2021, 10, 394. [Google Scholar] [CrossRef]
- Tang, W.; Liu, S.; Kang, P.; Peng, X.; Li, Y.; Guo, R.; Jia, J.; Liu, M.; Zhu, L. Quantifying the lagged effects of climate factors on vegetation growth in 32 major cities of China. Ecol. Indic. 2021, 132, 108290. [Google Scholar] [CrossRef]



| Dataset | Temporal /Spatial Resolution | Period | Data Sources | |
|---|---|---|---|---|
| EVI | 16 d/250 m | 2000–2020 | MOD13Q1.006 Terra Vegetation Indices 16-Day Global 250 m (https://earthengine.google.com, accessed on 26 January 2022) | |
| Topographic factors | Elevation | 30 m | 2000 | SRTM DEM (https://earthexplorer.usgs.gov, accessed on 26 January 2022) |
| Slope | 30 m | 2000 | Derived from SRTM DEM | |
| Aspect | ||||
| Human activity factors | Populationdensity | 1 km | 2000–2020 | World population density map (https://www.worldpop.org, accessed on 26 January 2022) |
| Nighttime light | 500 m | 2000–2018 | An extended time series (2000–2018) of global NPP-VIIRS-like nighttime light data (https://doi.org/10.7910/DVN/YGIVCD accessed on 26 January 2022) | |
| Land use | 1 km | 2000/2020 | Anhui land-use datasets (http://www.resdc.cn, accessed on 26 January 2022) | |
| Climate factors | Annual average temperature | Monthly /1 km | 2000–2020 | Daily surface climate data for China (V3.0) (http://data.cma.cn, accessed on 26 January 2022) |
| Annual precipitation | Monthly /1 km | 2000–2020 | Daily surface climate data for China (V3.0) (http://data.cma.cn, accessed on 26 January 2022) | |
| Significance | 0 < H < 0.5 | H = 0.5 | 0.5 < H < 1 |
|---|---|---|---|
| Significant degradation | Significant improvement | Uncertain | Significant degradation |
| Degradation | Improvement | Degradation | |
| Basically stable | Basically stable | Basically stable | |
| Improvement | Degradation | Improvement | |
| Significant improvement | Significant degradation | Significant improvement |
| 2000 | 2020 | |||||
|---|---|---|---|---|---|---|
| [0,0.2] | [0.2,0.4] | [0.4,0.6] | [0.6,0.8] | [0.8,1] | Total | |
| [0,0.2] | 117.31 (0.09%) | 270.88 (0.20%) | 48.13 (0.03%) | 11.5 (0.01%) | 1 (~0.00%) | 448.82 (0.33%) |
| [0.2,0.4] | 166 (0.12%) | 1785.38 (1.33%) | 1982.44 (1.47%) | 328.38 (0.24%) | 16.25 (0.01%) | 4278.45 (3.17%) |
| [0.4,0.6] | 201 (0.15%) | 3774.13 (2.80%) | 33,035.88 (24.52%) | 35,755.25 (26.54%) | 1820.88 (1.35%) | 74,587.14 (55.36%) |
| [0.6,0.8] | 70.5 (0.05%) | 1097.75 (0.81%) | 9495.13 (7.05%) | 38,039.44 (28.23%) | 5529.44 (4.11%) | 54,232.26 (40.25%) |
| [0.8,1] | 4.44 (~0.00%) | 32.13 (0.02%) | 212.38 (0.16%) | 774 (0.58%) | 172.31 (0.13%) | 1195.26 (0.89%) |
| Total | 559.25 (0.41%) | 6960.27 (5.16%) | 44,773.96 (33.23%) | 74,908.57 (55.60%) | 7539.88 (5.60%) | 134,741.93 (100%) |
| 2000 | 2020 | ||||||
|---|---|---|---|---|---|---|---|
| Farmland | Woodland | Grassland | Waterbodies | Construction Land | Unused Land | Total | |
| Farmland | 61,135 (43.76%) | 5062 (3.62%) | 1233 (0.88%) | 2189 (1.57%) | 11,191 (8.01%) | 18 (0.01%) | 80,828 (57.85%) |
| Woodland | 4878 (3.49%) | 24,193 (17.32%) | 2350 (1.68%) | 249 (0.18%) | 441 (0.32%) | 2 (~0.00%) | 32,113 (22.99%) |
| Grassland | 1238 (0.89%) | 2306 (1.65%) | 4478 (3.21%) | 123 (0.09%) | 173 (0.12%) | 3 (~0.00%) | 8321 (5.96%) |
| Waterbodies | 2030 (1.45%) | 225 (0.16%) | 147 (0.11%) | 4537 (3.25%) | 306 (0.22%) | 0 (0.00%) | 7245 (5.19%) |
| Construction land | 8085 (5.79%) | 209 (0.15%) | 100 (0.07%) | 252 (0.18%) | 2546 (1.82%) | 2 (~0.00%) | 11,194 (8.01%) |
| Unused land | 3 (~0.00%) | 2 (~0.00%) | 0 (0.00%) | 0 (0.00%) | 0 (0.00%) | 0 (0.00%) | 5 (~0.00%) |
| Total | 77,369 (55.38%) | 31,997 (22.90%) | 8308 (5.95%) | 7350 (5.27%) | 14657 (10.49%) | 25 (0.01%) | 139,706 (100%) |
| Fitting Optimization Index | Adaptation Standard | Evaluation Values for Each Region | ||
|---|---|---|---|---|
| Northern Anhui | Central Anhui | Southern Anhui | ||
| CFI | >0.90 | 1.00 | 0.98 | 0.99 |
| GFI | >0.90 | 1.00 | 0.99 | 0.99 |
| IFI | >0.90 | 1.00 | 0.98 | 0.99 |
| RMSEA | <0.08 | 0.01 | 0.07 | 0.06 |
| SRMR | <0.05 | 0.01 | 0.02 | 0.03 |
| Driving Factors | Northern Anhui | Central Anhui | Southern Anhui |
|---|---|---|---|
| Topography | 0 | 0.22 | 0.27 |
| AaT_change | −0.06 | 0.05 | −0.08 |
| AP_change | 0.21 | −0.26 | 0.04 |
| Human activity change | −0.62 | −0.49 | −0.60 |
Publisher’s Note: MDPI stays neutral with regard to jurisdictional claims in published maps and institutional affiliations. |
© 2022 by the authors. Licensee MDPI, Basel, Switzerland. This article is an open access article distributed under the terms and conditions of the Creative Commons Attribution (CC BY) license (https://creativecommons.org/licenses/by/4.0/).
Share and Cite
Gu, Z.; Zhang, Z.; Yang, J.; Wang, L. Quantifying the Influences of Driving Factors on Vegetation EVI Changes Using Structural Equation Model: A Case Study in Anhui Province, China. Remote Sens. 2022, 14, 4203. https://doi.org/10.3390/rs14174203
Gu Z, Zhang Z, Yang J, Wang L. Quantifying the Influences of Driving Factors on Vegetation EVI Changes Using Structural Equation Model: A Case Study in Anhui Province, China. Remote Sensing. 2022; 14(17):4203. https://doi.org/10.3390/rs14174203
Chicago/Turabian StyleGu, Zhengnan, Zhen Zhang, Junhua Yang, and Leilei Wang. 2022. "Quantifying the Influences of Driving Factors on Vegetation EVI Changes Using Structural Equation Model: A Case Study in Anhui Province, China" Remote Sensing 14, no. 17: 4203. https://doi.org/10.3390/rs14174203
APA StyleGu, Z., Zhang, Z., Yang, J., & Wang, L. (2022). Quantifying the Influences of Driving Factors on Vegetation EVI Changes Using Structural Equation Model: A Case Study in Anhui Province, China. Remote Sensing, 14(17), 4203. https://doi.org/10.3390/rs14174203


