Abstract
Extreme rainfall induced by landfalling typhoon (ERLTC) can cause destructive natural disasters throughout China. Cloud properties in ERLTC are not yet well understood and parameterized, which limits the forecast accuracy of ERLTC to some extent. The 99th percentile intensity of daily rainfall associated with LTC is objectively defined as ERLTC and using the CloudSat tropical cyclone (CSTC) dataset from 2006 to 2018, cloud macro- and microphysical characteristics are statistically investigated. Results show that the proportion of single-layer (double-layered) clouds increases (decreases) significantly on the occurrence day of ERLTC. In the TC inner core region, the proportion of deep convective cloud at 2–10 km is the highest, reaching 50%. In the TC envelop region, deep convective cloud at the height of 3–8 km and cirrus at the height of 12–14 km account for the highest proportions. For the TC outer region, cirrus around 13 km has the highest proportion. During the ERLTC period, the ice-water content is mainly distributed in 5–18 km, and is mostly distributed in the TC inner core, followed by the envelop region. A large number of smaller ice particles are gathering in the upper troposphere at 13–18 km, while a small number of larger ones is gathering in the middle levels around 8–10 km. These results are useful for evaluating the ERLTC simulations and are expected to provide new forecasting factors for ERLTC in cloud macro- and microphysical perspectives.
1. Introduction
Most of the typhoon lifetime is over the ocean surface, so satellite data is a powerful tool for monitoring and studying typhoons. In the early and mid-1970s, visible and infrared satellite images played an important role in the operational estimation of typhoon location and intensity, which became a milestone in the development of typhoon operational forecasting and research [1]. In recent years, satellite data has been successfully assimilated into numerical models, substantially improving the forecast accuracy of typhoon track and intensity [2,3]. Extreme rainfall induced by landfalling tropical cyclones (ERLTC) can cause catastrophic flooding and severe disasters [4]. Improving the quantitative precipitation estimation and forecasting of ERLTC depends on an in-depth understanding of its multi-scale formation and enhancement mechanism. Therefore, the study of ERLTC is of great scientific significance to the disaster prevention and mitigation.
Factors influencing TC rainfall are summarized by Brennan (2019) [5] as TC movement, storm size, storm track, diurnal cycle, topography, moisture, interaction with other meteorological features (troughs, fronts, jets), and extratropical transition. For the ERLTC, previous studies mainly focused on the basic climatology features and its contribution to the total extreme precipitation [6,7,8], attributions to climate change [9,10], large-scale circulation anomalies [11,12], interaction with other synoptic-scale weather systems [13,14,15,16], the impact of the topography and underlying surface [17], the forward translational speed, and structural changes [18]. Comparatively, there have been few studies on cloud microphysical processes of TC related extreme precipitation so far [19]. With the continuous development of satellite technology, satellite based precipitation products are widely used in detecting extreme precipitation [20] and long-term trends [21]. The cloud profiler radar (CPR) onboard the CloudSat satellite launched in 2006 can not only detect the vertical profile features from thin clouds to deep convective clouds, but also retrieve the macro- and microphysical properties of clouds [22], which is very beneficial to studying the evolution characteristics of the typhoon cloud system [23].
In recent years, much progress has been made in applying CloudSat satellite data on typhoon research. Zhao and Zhou [24] used CloudSat data to analyze the development and evolution of Typhoon Ewiniar (2006) and its choud macro- and micro- structural characteristics. They revealed that the ice water content and ice particle number concentration are helpful to the analysis of typhoon precipitation. Yan et al. [25] further analyzed the cloud, precipitation and thermal structural characteristics of hurricanes in the Atlantic Ocean. Their results showed that the occurrence probability of deep convective cloud kept the largest. By contrast, those of the cumulus and nimbostratus were always the smallest in each radial ring. Han et al. [26] analyzed the tropical cyclones in the eastern Pacific and obtained similar conclusions. Tourville et al. [27] used CloudSat data to analyze the effect of vertical wind shear on the structure, echo pattern, and precipitation distribution of typhoons. Based on multiple typhoon cases, Shi et al. [28] further gave typical thresholds for cloud microphysical parameters of the typhoon eyewall and surrounding spiral cloud belts. Gao and Fang [29] pointed out that typhoon cloud systems with different intensities are dominated by single-layer clouds, and the high value area of ice water content is located below the high value area of ice particle number concentration. It is indicated that small ice particles are carried high by strong convective activity, while large ice particles are concentrated in the lower part of the cloud system. Recently, Wu and Soden [30] and Wu et al. [31] used the CloudSat data in 2006–2015 to show that the ice water content near the typhoon center is closely related to the typhoon intensification rate. Yan et al. [32] used 11 years of CloudSat data to analyze the asymmetric structure of the typhoon cloud system in the Northwest Pacific and its cloud radiative effect (CRE). Wu et al. [33] further pointed out that the CRE plays a vital role in typhoon genesis. Overall, these studies have greatly improved our understanding on clouds in typhoon.
In summary, although the research using CloudSat data in typhoons has been carried out, most of them focus on the TC genesis, TC intensity change, the evolution of typhoon structure and the overshooting cloud top [34,35], or focus on some typhoon cases without extreme rainfall. The research on the vertical structure and microphysical characteristics of the cloud system during the ERLTC period based on long time series of CloudSat data has not been carried out yet. Therefore, in this study the vertical structure of the ERLTC, especially the macro- and microphysical characteristics of clouds during the ERLTC are analyzed from the perspectives of different times (before or after the extreme rainfall) and different radial distances to the typhoon center. This study can help to understand the formation mechanisms of ERLTC from the cloud physical perspective and give the key parameters in the cloud microphysical parameterization scheme of typhoon numerical models based on the observations. At the same time, this study is also expected to provide new cloud physical forecasting factors for the operational typhoon precipitation forecast.
The remainder of this paper is organized as follows. Section 2 briefly introduces the data and methods. The evolutions of TC warm core, radar reflectivity, and cloud macro- and microphysical characteristics during the ERLTC period is described in Section 3. Results comparison with previous studies and its implications are discussed in Section 4. Section 5 makes a short summary of this study.
2. Data and Methods
The CloudSat Tropical Cyclone (CSTC) dataset is used to document the signatures of ERLTC, which is derived from CloudSat cloud profiling radar (CPR) intercepts of global TCs passing within 1000 km of their centers [27]. It combines CloudSat observations with A-TRAIN data from MODIS, AMSR-E model data, the auxiliary CloudSat 2B products, and TC best track information. The CloudSat satellite flies in a close sun-synchronous near polar orbit at approximately 705 km above the Earth’s surface, and the CPR onboard it is a 94 GHz radar which can measure the clouds and precipitation particles among the atmospheric column with a 1.4 km across-track and 2.5 km along-track radar footprint. The primary datasets used for this study are CS_2D_TC, ECMWF-AUX,2B-GEOPROF, 2B-CLDCLASS,2B-GEOPROF-LIDAR, and 2B-CWC-RO (Table 1). More detailed description of the CSTC dataset can be found online (http://www.cloudsat.cira.colostate.edu/data-products/level-2b, accessed on 23 June 2022).

Table 1.
Products description of CSTC dataset used in this study.
The TC precipitation dataset is obtained using the objective synoptic analysis technique (OSAT) developed by Ren et al. (2007) [36]. The basic idea of OSAT is to decompose the daily precipitation into several independent rain bands and individual precipitation at each stations. According to the distances of rain band and single stations relative to the TC center, the TC precipitation is further identified. The 99th percentile of daily precipitation at a single station on typhoon days is defined as the ERLTC threshold of that station following our previous study [37]. For convenience, the area from 0 km to 200 km away from the typhoon center is referred as the TC inner core region, the area from 200 km to 500 km is the TC envelop region, and the area from 500 km to 900 km is the TC outer region. The following text focuses on analyzing the TC structure and cloud evolution characteristics on the two days before the extreme rainfall (−2d), one day before the extreme rainfall (−1d), on the extreme rainfall day (0d), and one day after the extreme rainfall (+1d), which are referred to as the ERLTC period. Pairing the observation time of each profile in the CloudSat Tropical Cyclone (CSTC) dataset with the occurrence time of the ERLTC sample, the CSTC profile data corresponding to −2d, −1d, 0d, and +1d of the ERLTC are obtained. Then, the composited fields from the CSTC dataset in each day were calculated and analyzed. In order to ensure the independence of the statistical samples, the CSTC data with duplicates in these four days are excluded. The location of TC center during the extreme rainfall period (24 hours in total) is obtained by averaging the best track data every 6 hours provided by the Shanghai Typhoon Institute of China Meteorological Administration (CMA-STI).
Statistic results show that there were 132 typhoons which have brought extreme rainfall to China from 2006 to 2018, with an average of 10.2 ERLTC per year. The track and intensity categories are shown in Figure 1. It can be seen that there is a high frequency area of typhoon activity near Taiwan Island and Hainan Island, corresponding to the northwestward-moving and the westward moving track of typhoon, respectively (Figure 1a). The difference is that the intensity of the typhoons near Taiwan Island is generally stronger than that near Hainan Island. Further analysis of the location of TC centers during the occurrence of extreme rainfall shows that most TC centers are located in the near shore and continental regions of China in 20°N–30°N and 105°E–125°E, few TC centers in the area north of 30°N and east of 125°E, and fewer TC centers can penetrate deep into the inland region (Figure 1a). In terms of the intensity (Figure 1b), TD has the highest percentage (36.6%), followed by the TS (26.9%). The SupTY has the lowest percentage (4.6%). Statistically speaking, this is in line with our common knowledge that TC weakens during the landfalling. It also corresponds well with the climatic state when TC center locates in the near shore and continental regions in China (Figure 1a).

Figure 1.
Tracks (a) and frequency of each category (b) of tropical cyclones causing extreme rainfall during the time period 2006–2018. TD, tropical depression; TS, tropical storm; STS, severe tropical storm; TY, typhoon; STY, strong typhoon; SupTY, super typhoon.
3. Results
3.1. Basic Charaacteristics during the ERLTC Period
3.1.1. The Occurrence Location of Extreme Precipitation
According to the statistics, there are 2039 ERLTC samples affecting China during 2006–2018. Figure 2a shows the geographic location and rainfall amount of each ERLTC event. It can be seen that the ERLTC not only occurs in Taiwan Island, Hainan Island, and coastal areas of China, but also occurs in inland provinces such as Yunnan, Sichuan, Henan, Shanxi, and Inner Mongolia. For the amount of extreme rainfall, on average, there is the largest precipitation in Taiwan Island with more than 500 mm, followed by Hainan Island, South China and the southeast coast, and inland provinces. Particularly, there exist remarkable spatial variations over mainland China. For some inland provinces, such as Henan and Hebei, there also exist ERLTC of more than 250 mm, and the Heilongjiang province in Northeast China can experience an ERLTC of more than 100 mm.
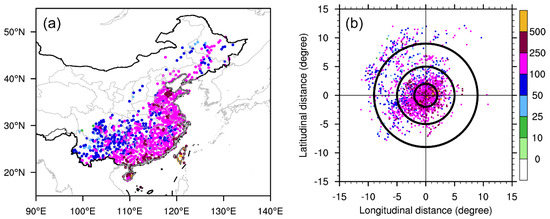
Figure 2.
Spatial distribution of the ERLTC intensity (mm day−1) affecting China 2006–2018 (a) and locations of extreme rainfall relative to the tropical cyclone centers (b). The coordinate origin in (b) represents the average location of the tropical cyclone center during the extreme rainfall. The X direction stands for the longitude (positive represents the east and negative represents the west) and the Y direction stands for the latitude (positive represents the north and negative represents the south). The circles denote the distances of 2°, 5°, and 9° to the tropical cyclone center.
Figure 2b further shows the locations of extreme rainfall relative to the TC centers. The extreme rainfall with a larger magnitude is more concentrated in the typhoon inner core, especially the extreme rainfall exceeding 250 mm, which rarely occurs in the typhoon outer region. The specific analysis shows that 41.5% of the samples appear within 2° distance from the typhoon center, which is the inner core of the typhoon. A total of 36.5% appear in the range of 2°–5° distance from the typhoon center, which is the typhoon envelop region. A total of 19.8% appear in the range of 5°–9° from the typhoon center, which is the typhoon outer region. The remaining 2.2% of the samples occur 9° away from the typhoon center. This is obviously related to the intensity of TC; the closer to the TC center is, the stronger convection and heavier precipitation is in general. The spatial distribution of the samples shows that the extreme rainfall events appear most on the northwest side of the typhoon and least on the southeast side, which is closely related to the northwestward moving and westward-moving track of TCs (Figure 1) and consistent with the summary of Meng et al. (2019) [38]. For a more detailed climatic analysis of ERLTC over China, please refer to our previous study [37]. It is worth noting that the ERLTC samples were limited by the rain gauge data used in this study, which means rainfall data were missing over the ocean. Thus, the unevenly spatial distribution pattern is related to the data used to some extent.
3.1.2. Warm Core Structure
The TC temperature anomalies before and after the extreme rainfall are calculated using the ECMWF-AUX data to show the evolution characteristics of the TC warm core during the ERLTC period. It can be seen from Figure 3 that in the four days before and after the extreme rainfall occurred, there maintain a warm core around the height of 10 km, and a cold anomaly in the typhoon boundary layer close to the underlying surface. This temperature anomalies pattern has also been verified by the global positioning system (GPS) radio occultation (RO) observations [39] and Fengyun-3D (FY-3D) microwave temperature sounder-2 (MWTS-2) observations [40]. The intensity and extent of the warm core and cold anomaly have evolved obviously in the four days.

Figure 3.
Vertical distribution of temperature anomaly (Unit: °C) at radial distance from the center of TC at different stages of two days before (a), one day before (b), on the day (c), and one day after (d) the extreme rainfall occurred. The horizontal coordinate indicates the distance from the TC center and the vertical coordinate is the height.
Two days before the extreme rainfall (Figure 3a), the strongest part of the warm core is located at the height of 7–12 km near the typhoon center. One day before the extreme rainfall (Figure 3b), the warm core near the typhoon center is slightly shrank in the vertical direction but it stretches substantially in the horizontal direction. At the same time, the intensity of the warm core is obviously strengthened. On the occurrence day of extreme rainfall (Figure 3c), the intensity and extent of the TC warm core decrease significantly, but the intensity and extent of the cold anomaly below 2 km in the TC inner core increase. It is suggested that the intensity of typhoons is weakened on the extreme rainfall occurrence day. Moreover, it can be found that one day after the extreme rainfall (Figure 3d), the TC warm core is enhanced again, which may be related to the release of strong latent heat accompanying the extreme rainfall occurred as we have revealed in a case study [41].
3.1.3. Radar Reflectivity
Based on the 2B-GEOPROF data, Figure 4 shows the evolution of the height-radial vertical profile of radar reflectivity before and after the extreme rainfall. On average, the radar reflectivity reaches the strongest one day before the extreme rainfall, and the enhancement is most obvious in the TC inner core (Figure 4b), which is consistent with the variation trend of the TC warm core previously mentioned (Figure 3). This reflects that the convection develops vigorously, and there is a large accumulation of ice particles in the upper troposphere before the ERLTC occurred. Further analysis of the evolution of radar reflectivity at different heights shows that on the extreme rainfall day (Figure 4c), the radar reflectivity above 5 km height significantly decreases compared to the day before extreme rainfall (Figure 4b), indicating a large consumption of the super cooled water droplets and ice crystal particles. However, the radar reflectivity below 5 km increases, especially in the boundary layer below 3 km, which corresponds well with the abundant liquid water substances and the formation of ERLTC.

Figure 4.
Vertical distribution of radar reflectivity (Unit: dbz) at radial distance from the center of TC at different stages of two days before (a), one day before (b), on the day (c), and one day after (d) the extreme rainfall occurred. The horizontal coordinate indicates the distance from the TC center and the vertical coordinate is the height.
To explore this issue in depth, Figure 5 shows the occurrence probability of different grades of radar reflectivity at different heights and different regions of the TC during the ERLTC period, which can further validate the conclusion drawn above. For the TC inner core region (Figure 5a–d), compared with the previous day of extreme rainfall, the radar reflectivity above 5 km significantly decreases on the occurrence day of extreme rainfall, while the radar reflectivity at and below 5 km increases. For the TC envelop region (Figure 5e–h), the radar reflectivity of the whole layer on the extreme rainfall day is increased compared with two days before. For the TC outer region (Figure 5i–l), the radar reflectivity of the whole layer on the day of extreme rainfall is decreased compared with that before the extreme rainfall. In general, compared with the radar reflectivity before the occurrence of extreme rainfall, the radar reflectivity in the TC outer region on the extreme rainfall day is decreased, while that of the TC envelop region is increased. The situation in the TC inner core is relatively complex, and the radar reflectivity decreases (increases) above (below) 5 km.

Figure 5.
Distribution of occurrence probability from radar reflectivity in the TC inner core region (a-d), envelop region (e–h), and outer region (i–l) at different stages of two days before (a,e,i), one day before (b,f,j), on the day (c,g,k), and one day after (d,h,l) the extreme rainfall occurred. (Shaded, Unit: %).
3.2. Cloud Macro-Physical Characteristics
The cloud macro-physical evolution characteristics are analyzed during the ERLTC period from three aspects: number of cloud layers, cloud base height and thickness, and the cloud classification.
3.2.1. Number of Cloud Layers
Using the 2B-GEOPROF-LIDAR product, the distribution of cloud layer numbers which is derived from a hydrometeor mask algorithm described by Marchand et al. (2008) [42] in different TC regions before and after the extreme rainfall is given (Figure 6). Since the occurrence probability of clouds with five or more layers is less than 5%, Figure 6 only shows the cases with 1–4 cloud layers. As can be seen, in the four days during the ERLTC period, on average, single cloud-layer accounts for the largest proportion, followed by double-layer clouds. The sum of the two accounts for more than 80%. The 3-layer clouds account for no more than 20%, and 4-layer clouds less than 10%. The result is consistent with the conclusion of Gao and Fang [29] that the typhoon cloud systems of different intensities in the Northwest Pacific are dominated by single-layer clouds. However, further comparison can find that there are still some differences between this study and their conclusions. Before and after the occurrence of extreme rainfall (Figure 6a,b,d), the average proportion of single-layer clouds does not exceed 50% in this study, and for double-layer clouds it is larger than 40%. In Gao and Fang [29], the average proportion of single-layer clouds is more than 70%, and for double-layer clouds it is about 30%. It can be seen from Figure 6 that the proportion of single-layer (double-layer) clouds increases (decreases) substantially on the extreme rainfall day compared with two days before and one day after the extreme rainfall. This feature is most obvious in the TC envelop region, where single-layer clouds account for up to 70%, while the minimum proportion of double-layer clouds is about 20%. At the same time, the proportions of 3- and 4-layer clouds decrease significantly on the extreme rainfall day.
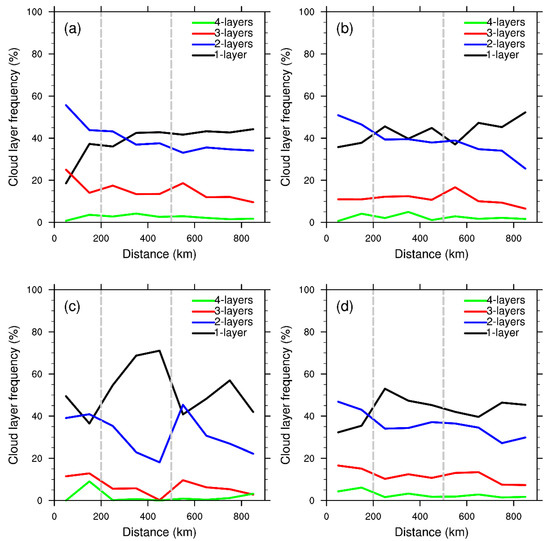
Figure 6.
Average frequencies (Unit: %)of 1–4-layer clouds at radial distance from the center of typhoon at different stages of two days before (a), one day before (b), on the day (c), and one day after (d) the extreme rainfall occurred.
3.2.2. Cloud Thickness
Based on the 2B-GEOPROF-LIDAR data, the cloud thickness and cloud base height in different TC regions during the ERLTC period are analyzed in Figure 7. The comparison of the cloud thickness among clouds with different layers shows that the single-layer cloud is the thickest. The cloud base can reach the underlying surface, and its vertical extension can reach about 15 km (Figure 7a,b), which suggests thick clouds layers associated with deep convection (Luo et al., 2009) [43]. The thickness of multi-layer clouds is the thinnest with most of the vertical extension not exceeding 5 km. However, the variation of its cloud base height is the largest, ranging from 0 to 18 km (Figure 7g–i). The cloud thickness and cloud base height of the double-layer clouds are relatively medium (Figure 7d–f) in the range.

Figure 7.
Distribution of the two-dimensional frequency of cloud base height (Unit: km) and thickness (Unit: km) for single layer cloud (a,b,c), two-layer cloud (d,e,f), and multi-layer cloud (g,h,i) in the TC inner core region (a,d,g), envelop region (b,e,h) and outer region (c,f,i) on the day the ERLTC occurred.
The comparisons of the cloud thickness and cloud base height in different TC regions show that there are more grounded single-layer clouds with a thickness of 15–17 km (Figure 7a), grounded double-layer clouds with a thickness of 6–8 km (Figure 7d), double-layer clouds with a base height of 12–13 km and a thickness of 2–4 km (Figure 7d), and multi-layer clouds with a base height of 12–13 km and a thickness of less than 2 km (Figure 7g) in the TC inner core. For the TC envelop region, grounded single-layer clouds with a thickness of 15–16 km (Figure 7b), grounded double-layer clouds with a thickness of less than 2 km (Figure 7e), double-layer clouds with a base height of 13–16 km and a thickness of 2–5 km, and multi-layer clouds with base height 0–18 km and a thickness of less than 3 km (Figure 7h) appear mostly. For the TC outer region, shallow thin single- and double-layer clouds (Figure 7c,f) and double-layer clouds with a base height of about 15 km and a thickness of less than 3 km (Figure 7f) often occur.
In general, on the ERLTC day, the single-layer clouds are relatively thick (15–17 km) and mostly distributed in TC inner core and envelop region. There are two dominant distribution intervals for the double-layer clouds (grounded clouds with a thickness of 0–10 km and clouds with a height of 12–17 km and a thickness of 1–5 km), which are distributed in all regions of TC. The base height of a multi-layer cloud has a large variation range of 0–17 km, and the thickness is relatively thin (0–4 km). The multi-layer clouds are mostly distributed in the envelop and outer regions of TCs.
3.2.3. Cloud Classification
In order to obtain the distribution characteristics of various types of clouds in ERLTC, the 2B-CLDCLASS is used to calculate the proportions of different cloud types (cirrus, altostratus, altocumulus, stratus, stratocumulus, cumulus, nimbostratus, and deep convective cloud) in the different TC regions (Figure 8). As can be seen, the deep convective cloud has the highest proportion in the inner core and envelop region, which is conducive to the occurrence of extreme rainfall. This is consistent with the results of Yan et al. [25] on Atlantic hurricanes and Han et al. [26] on eastern Pacific typhoons. Meanwhile, it also corresponds to the result that the larger the magnitude of the ERLTC is, the more concentrated it is near the typhoon center.
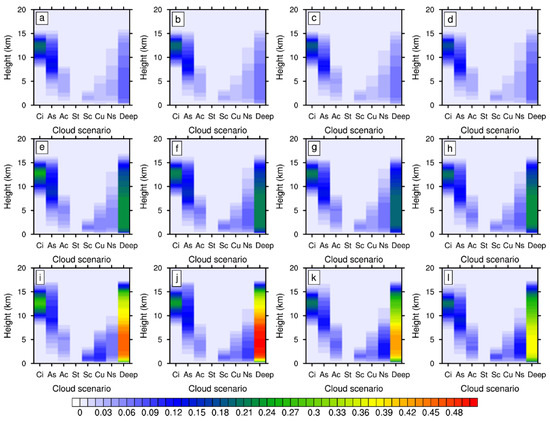
Figure 8.
Occurrence probabilities (Shaded, Unit: %) of different cloud types in the TC outer region (a–d), envelop region (e–h), and inner core region (i–l) at different stages of two days before (a,e,i), one day before (b,f,j), on the day (c,g,k), and one day after (d,h,l) the extreme rainfall occurred. Ci, As, Ac, St, Sc, Cu, Ns, and Deep refer to cirrus, altostratus, altocumulus, stratocumulus, cumulus, nimbostratus, and deep convective clouds, respectively.
The analysis shows that in the TC outer region (Figure 8a–d), the cirrus around 13 km height has the highest proportion, followed by altocumulus at the height of 7–12 km, corresponding well with the weak radar reflectivity (0-5 dbz) at that height (Figure 4). In the envelop region (Figure 8e–h), deep convective cloud at 3–8 km and cirrus at 12–14 km account for the highest proportions, followed by altocumulus at 6–13 km, which further reveals the exact cloud type with a 5-15 dbz radar reflectivity in this region (Figure 4). In the TC inner core (Figure 8i–l), the proportion of deep convective cloud at 2–10 km is the highest (followed by cirrus at 12–14 km), reaching 50%, which is also the cloud with the highest frequency in the typhoons with extreme rainfall, corresponding to the strongest radar echo (10–30 dbz in Figure 4).
The evolution characteristics of various types of clouds during the ERLTC period show that on the day before the extreme rainfall (Figure 8j), the proportions of deep convective cloud, altostratus and nimbostratus in the TC inner core increase significantly, while those of stratocumulus and cumulus decrease. On the occurrence day of extreme rainfall (Figure 8k), the proportions of deep convective cloud and altostratus in the TC inner core decrease significantly compared with the day before the extreme rainfall, while that of nimbus increases remarkably. Similarly, on the occurrence day of extreme rainfall, the proportions of deep convective cloud and high altitude clouds in the envelop region also decrease (Figure 8g). These features further explain the evolution of radar reflectivity (Figure 4 and Figure 5) during the ERLTC period from a perspective of cloud type.
In general, before and after the occurrence of extreme rainfall, the proportions of various types of clouds in the TC outer region do not change much, while there are certain changes in the envelop region, and the largest change is in the inner core. It should be made aware that although the names of the clouds are the same in the 2B-CLDCLASS data and conventional surface observation, the cloud classification methods are not exactly the same.
3.3. Cloud Microphysical Characteristics
A large number of studies have shown that mixed phase clouds play an important role in the extreme rainfall [4,44,45]. Combined with the above analysis, the evolution of the cloud microphysical characteristics during the ERLTC period are analyzed in terms of the ice water content, ice particle number concentration, and ice particle effective radius.
3.3.1. Ice Water Content
It can be seen from Figure 9 that in the four days during the ERLTC period, the ice water content is mainly distributed between 5–18 km, and is mostly distributed in the TC inner core, followed by the envelop region and the outer region. The evolution trend of the ice water content is basically consistent with that of the radar reflectivity above the height of 5 km (Figure 4), and the ice water content in the inner core reaches the largest one day before the extreme rainfall. On the occurrence day of the extreme rainfall (Figure 9c), the ice water content decrease substantially in 8–18 km in the TC inner core and in 8–12 km in the TC envelop region. In addition, before the occurrence of extreme rainfall (Figure 9a,b), some deep convective columns can be found in the TC envelop region. Especially in 12–18 km, there are some areas with high ice water content. On the day of extreme rainfall (Figure 9c), these deep convective columns and the high ice water content in the upper level significantly weakens. Therefore, the decrease of ice water content in the TC inner core and the upper level of TC outer region is a typical feature of ERLTC.
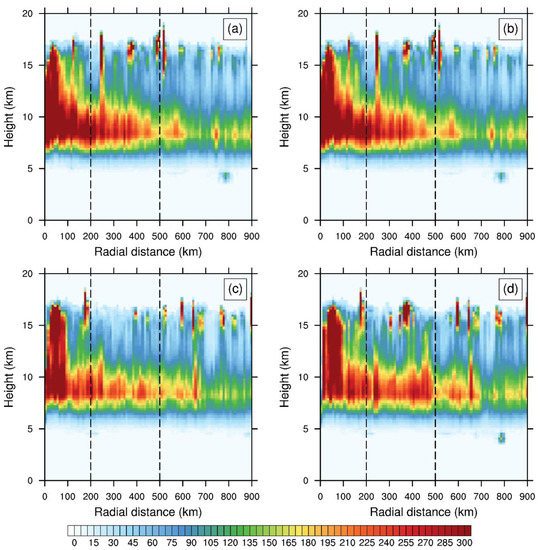
Figure 9.
Vertical distribution of average ice water content (Shaded, Unit: kg m−3) at radial distance from the TC center at different times of two days before (a), one day before (b), on the day (c), and one day after (d) the extreme rainfall occurred. The horizontal coordinate indicates the distance from the TC center and the vertical coordinate is the height.
Figure 10 quantitatively shows the average profiles of ice water content in three different regions (the inner core, the envelop region and the outer region) of TC. It can be seen that the maximum value of ice water content around 8 km in the inner core which decreases from 350 kg m−3 before the extreme rainfall to about 300 kg m−3 on the occurrence day of extreme rainfall. At the same time, the maximum value of ice water content at the same height in the envelop region decreases from 260 kg m−3 before extreme rainfall to about 210 kg m−3 on the occurrence day of extreme rainfall. The average ice water content in the TC outer region does not change much. Figure 10 indicates that compared with two days before the extreme rainfall, on the occurrence day of extreme rainfall there are more obvious changes in the vertical distribution of average ice water content in the inner core above 12 km. Before the extreme rainfall, the average ice water content above 12 km decreases with height, while on the occurrence day of extreme rainfall it increases with height.
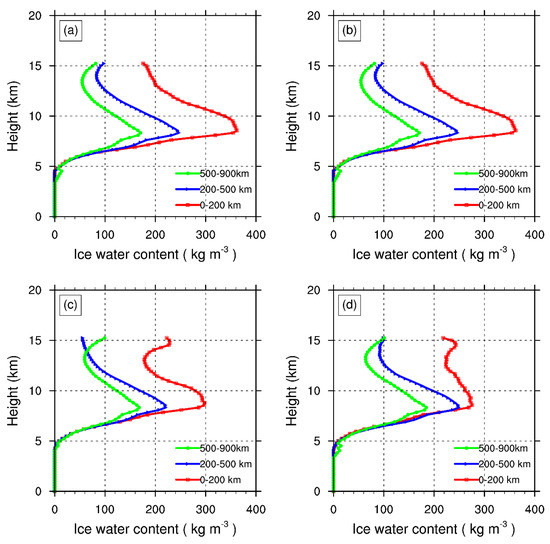
Figure 10.
Vertical distribution of averaged ice water content (Line, Unit: kg m−3) at the TC inner core region (red line), envelop region (blue line), and outer region (green line) at different stages of two days before (a), one day before (b), on the day (c), and one day after (d) the extreme rainfall occurred.
3.3.2. Ice Particle Number Concentration
The analysis of the vertical distributions of average ice particle number concentration during the ERLTC period (Figure 11) shows that a large number of ice particles are gathering in the upper troposphere at 13–18 km in each region defined here. This is because the ice particles can be advected radially outward to the TC outer region before its melting and falling as stratiform precipitation [45]. Compared with two days before the extreme rainfall, on the occurrence day of extreme rainfall the ice particle number concentration in the inner core above 12 km increases significantly, while that in the envelop region at this height decreases.

Figure 11.
Vertical distribution of average ice particle number concentration (Shaded, Unit: L−1) at radial distance from the center of TC at different stages of two days before (a), one day before (b), on the day (c), and one day after (d) the extreme rainfall occurred.
Overall, before and after the extreme rainfall, the ice particle number concentration changed significantly in the upper level, while the change is less in the middle level. It is notable that after the extreme rainfall (Figure 11d) occurred, the ice particle number concentration in each region of TC increases again, which is related to the stage of the typhoon precipitation process. In general, the typhoon precipitation period will not stop immediately after the ERLTC occurred but continue with non-extreme rainfall.
3.3.3. Effective Radius of Ice Particle
Figure 12 shows the vertical distributions of the radial averaged ice particle effective radius during the period of ERLTC. In the four days, the general distribution pattern of the ice particle effective radius is similar, that is, it decreases with height in the vertical direction and decreases with radial distance from the TC center in the horizontal direction. At the same time, the gradient in the vertical direction is much larger than that in the horizontal (radial) direction. Therefore, the ice particle effective radius near the height of 5 km in the TC inner core is the largest.

Figure 12.
Vertical distribution of average ice effective radius (Shaded, Unit: μm) at radial distance from the center of TC at different stages of two days before (a), one day before (b), on the day (c), and one day after (d) the extreme rainfall occurred.
Further analysis of the evolution characteristics of ice particle size and distribution before and after the extreme rainfall shows that compared with two days before the extreme rainfall (Figure 12a,b), the ice particle effective radius in the mid-lower levels at the height of 5–8 km in the TC inner core decreases significantly from 110–130 μm to 90–100 μm. Similarly, the ice particle effective radius at the height of 5–6 km in the envelop region is also significantly reduced from the original 100–120 μm to 90–100 μm. Changes of the ice particle effective radius in the outer region are relatively small. On the occurrence day of extreme rainfall, the ice particle effective radius gets smaller compared with that before the extreme rainfall in the vertical direction. For example, in two days before the extreme rainfall (Figure 12a,b), the 70 μm ice particles are generally distributed above 10 km, while on the occurrence day of extreme rainfall they are all distributed below 10 km (Figure 12c).
Figure 13 further quantitatively presents the vertical distributions of averaged ice particle effective radius in the inner core, envelop, and outer regions of TC. It can be seen that above the height of 5 km, the ice particle effective radii in the three regions of TC all increase with height. The ice particle effective radius in the TC inner core is the largest, followed by the envelop region and the outer region. At the same time, the differences of the ice particle effective radius in these three regions decrease with the height. As shown in Figure 13b, on the previous day of the extreme rainfall, the average ice particle effective radius at the height of 6 km (15 km) in the inner core, envelop region, and outer region of the TC are 114 μm, 105 μm, and 94 μm (48 μm, 46 μm, and 45 μm), respectively.
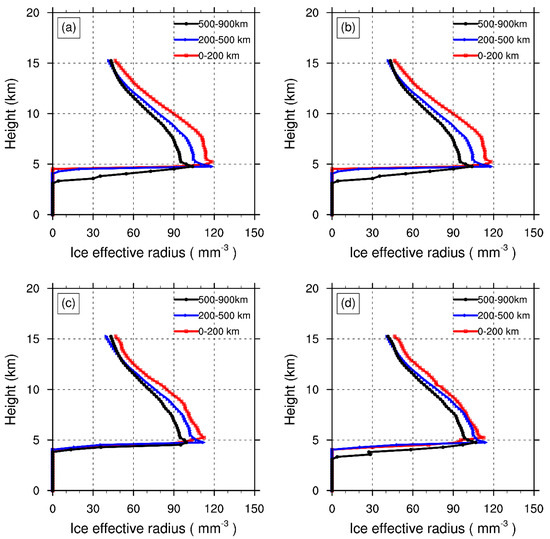
Figure 13.
Vertical distribution of averaged ice effective radius (Line, Unit: μm) at the TC inner core region (red line), envelop region (blue line), and outer region (black line) at different stages of two days before (a), one day before (b), on the day (c), and one day after (d) the extreme rainfall occurred.
4. Discussions
Regarding the results of Gao and Fang [29] as a climatic mean state of typhoon clouds in the Northwest Pacific, then our results reveal that the cloud macro- and microphysical characteristics and its evolution have many distinct features during the ERLTC period. Specifically, before the ERLTC occurred, the proportion of single-layer (double-layer) clouds are less (more) than the climatology [29], respectively. In terms of the cloud type, deep convective cloud has the highest frequency in typhoons with extreme rainfall, followed by cirrus at 12–14 km. This is close to the results reported by Han et al. [26] and Yan et al. [25]. Furthermore, we highlight that the proportions of the CloudSat measured pure ice clouds [46] of deep convective cloud, altostratus, and nimbostratus in the TC inner core increase obviously before the extreme rainfall occurred, corresponding to the strongest radar echo. On this basis, the increase of deep convective cloud, altostratus, and nimbostratus in the TC inner core region might be used as new forecasting factors for ERLTC in the future.
During the ERLTC period, the ice water content is mainly distributed in 5–18 km, and is mostly distributed in the TC inner core, followed by the envelop region. On the other hand, a large number of ice particles are gathering in the upper troposphere (13–18 km) in each region defined here, which reveals that the ice particles can be transported radially outward far from the TC center before its melting and falling [45]. Combined with the distribution pattern of the ice particle effective radius, we can conclude that a large number of smaller ice particles are gathering in the upper troposphere at 13–18 km, while a small number of larger ones is gathering in the middle levels around 8–10 km. These characteristics are useful for validating and improving the cloud microphysical parameterization scheme for ERLTC simulations.
Moreover, the liquid water content and the liquid particle number concentration were also analyzed (Figures omitted) during the ERLTC period. In general, the distribution pattern of the liquid water is less variable in the four days before and after the occurrence of extreme precipitation, maintaining an abundance of liquid water in the lower troposphere. This might be related with the limited detection capability of CloudSat CPR for heavy precipitation. Due to the limitation of the length of this manuscript, we plan to further improve this aspect of the study in conjunction with precipitation radar in our future work.
The CSTC dataset is also limited by its narrow resolution along the satellite orbit and lacks continuous monitoring of ERLTC, therefore, it is necessary to conduct more in-depth research on ERLTC in combination with the geostationary satellite datasets and reanalysis precipitation products [20,21]. This study only focuses on the direct extreme precipitation induced by landfalling typhoons, and does not include the typhoon remote extreme precipitation, such as the extreme rainfall and devastating floods event from 19 to 21 July 2021 in Henan province [47,48]. Therefore, more ERLTC case studies and high-resolution numerical simulations are needed to further elucidate the detailed microphysical processes during the ERLTC period.
5. Conclusions
Based on our 13-yr CSTC data statistics, we focus on the thermal structure, convection evolution of the TCs which have brought extreme rainfall to China. In particular, the cloud macro- and microphysical characteristics and its evolution during the ERLTC period are investigated. From a statistical perspective, the main conclusions are summarized as follows:
- -
- One day before the extreme rainfall occurred, the TC warm core shows the strongest which implies that the TC intensified, thus favors to the water vapor convergence, convection aggregation, and extreme rainfall occurrence [5,26]. On the occurrence day of the ERLTC, the intensity and extent of TC warm core are reduced significantly, which indicates that the intensity of TC is weakened.
- -
- The proportion of single-layer (double-layered) clouds increases (decreases) significantly on the occurrence day of the ERLTC. Moreover, the single-layer clouds are relatively thick (15–17 km) and mostly distributed in the inner core and envelop region. There are two dominant distribution intervals for the double-layer clouds, and they are distributed in all regions of TC. The height of multi-layer cloud base has a large variation range of 0–17 km and a relatively thin thickness of 0–4 km. The multi-layer clouds are mostly distributed in the envelop region and outer region of TC.
- -
- In the TC inner core, the proportion of deep convective cloud can reach 50%. In the envelop region, deep convective cloud at the height of 3–8 km and cirrus at the height of 12–14 km account for the highest proportions. In the TC outer region, cirrus around 13 km has the highest proportion. On the day of extreme rainfall, the proportions of deep convective cloud and altostratus in the TC inner core decrease significantly compared with the day before the extreme rainfall, while that of nimbus increases remarkably.
- -
- The ice water contents in the upper level in the inner core and envelop region decrease significantly on the occurrence day of the ERLTC. The ice particle number concentration in the inner core above the height of 12 km in the upper-level increases obviously, while that in the envelop region at this height decreases. The ice particle effective radii in the mid-lower levels at 5–8 km in the TC inner core and at 5–6 km in the envelop region decrease remarkably.
This study focuses on the vertical structure and macro- and microphysical properties of the cloud system during the ERLTC period based on 13-year CloudSat data. This is a complement work to our previous study [14,15,16,37] on ERLTC. It can help to understand the formation mechanisms of ERLTC from a cloud physical perspective as well as to validate the key parameters in cloud microphysical parameterization scheme for the simulation of typhoon. This study is also expected to provide new forecasting factors for ERLTC.
Author Contributions
Conceptualization, D.Z. and Y.Y.; methodology, Y.L. and H.X.; software, Y.L.; validation, D.Z., L.C. and H.X.; formal analysis, D.Z.; investigation, D.Z.; resources, Y.Y.; data curation, D.Z.; writing—original draft preparation, D.Z.; writing—review and editing, D.Z.; visualization, D.Z.; supervision, L.C.; project administration, Y.L.; funding acquisition, Y.Y. All authors have read and agreed to the published version of the manuscript.
Funding
This work was jointly supported by the National Natural Science Foundation of China (41930972, 42175008 and 42192554), the S&T Development Fund of CAMS (2021KJ031), the National Basic Research Program of China (2015CB452804) and the Open Grants of the State Key Laboratory of Severe Weather (2021LASW-A12 and 2022LASW-B08).
Data Availability Statement
Publicly available datasets were analyzed in this study. The CloudSat (CS) Tropical Cyclone (TC) dataset is obtained from https://adelaide.cira.colostate.edu/tc/ (accessed on 23 June 2022). The best-track data is obtained from http://tcdata.typhoon.org.cn (accessed on 20 June 2022). The precipitation product is downloaded from http://data.cma.cn/ (accessed on 15 June 2022).
Acknowledgments
The authors are grateful to the editor and the anonymous reviewers for their insightful comments in improving the quality of this study. The authors would like to thank NASA, the Cooperative Institute for Research in the Atmosphere of Colorado State University, and Shanghai Typhoon Institute of the China Meteorological Administration for freely providing their high-quality data, respectively.
Conflicts of Interest
The authors declare no conflict of interest.
References
- Velden, C.; Harper, B.; Wells, F.; Beven, J.L.; Zehr, R., II; Olander, T.; Mayfield, M.; Guard, C.; Lander, M.; Edson, R.; et al. The Dvorak Tropical Cyclone Intensity Estimation Technique: A Satellite-Based Method that Has Endured for over 30 Years. Bull. Amer. Meteor. Soc. 2006, 87, 1195–1210. [Google Scholar] [CrossRef]
- Tian, X.; Zou, X. A comprehensive 4D-Var vortex initialization using a nonhydrostatic axisymmetric TC model with convection accounted for. Tellus A Dyn. Meteorol. Oceanogr. 2019, 71, 1653138. [Google Scholar] [CrossRef]
- Zou, X.; Qin, Z.; Zheng, Y. Improved tropical storm forecasts with GOES-13/15 imager radiance assimilation and asymmetric vortex initialization in HWRF. Mon. Wea. Rev. 2015, 143, 2485–2505. [Google Scholar] [CrossRef]
- Duan, Y.; Wan, Q.; Huang, J.; Zhao, K.; Yu, H.; Wang, Y.; Zhao, D.; Feng, J.; Tang, J.; Chen, P.; et al. Landfalling Tropical Cyclone Research Project (LTCRP) in China. Bull. Amer. Meteor. Soc. 2019, 100, ES447–ES472. [Google Scholar] [CrossRef]
- Brennan, M.J. Tropical Cyclone Rainfall. In Proceedings of the 2019 RA-IV Workshop on Hurricane Forecasting and Warning, Miami, FL, USA, 29 April–10 May 2019. [Google Scholar]
- Khouakhi, A.; Villarini, G.; Vecchi, G.A. Contribution of Tropical Cyclones to Rainfall at the Global Scale. J. Clim. 2017, 30, 359–372. [Google Scholar] [CrossRef]
- Chen, F.; Fu, Y. Contribution of tropical cyclone rainfall at categories to total precipitation over the western North Pacific from 1998 to 2007. Sci. China Earth Sci. 2015, 58, 2015–2025. [Google Scholar] [CrossRef]
- Jiang, H.; Zipser, E.J. Contribution of tropical cyclones to the global precipitation from eight seasons of TRMM data: Regional, seasonal, and interannual variations. J. Clim. 2010, 23, 1526–1543. [Google Scholar] [CrossRef]
- Liu, M.F.; Vecchi, G.A.; Smith, J.A.; Knutson, T.R. Causes of large projected increases in hurricane precipitation rates with global warming. npj Clim. Atmos. Sci. 2019, 2, 38. [Google Scholar] [CrossRef]
- Gu, X.H.; Zhang, Q. Statistical Characteristics of Extreme Precipitation Events and Associated Mechanisms, 1st ed.; Science Press: Beijing, China, 2020; pp. 136–170. (In Chinese) [Google Scholar]
- Gao, S.Z.; Meng, Z.Y.; Zhang, F.Q.; Bosart, L.F. Observational analysis of heavy rainfall mechanisms associated with severe Tropical Storm Bilis (2006) after its landfall. Mon. Weather Rev. 2009, 137, 1881–1897. [Google Scholar] [CrossRef]
- Yang, L.; Liu, M.F.; Smith, J.A.; Tian, F.Q. Typhoon Nina and the august 1975 flood over central China. J. Hydrometeorol. 2017, 18, 451–472. [Google Scholar] [CrossRef]
- Cheng, Z.Q.; Lin, L.X.; Sha, T.Y.; Yang, G.J. Analysis of atmosphere stratification in extremely heavy rainfall event associated with severe typhoon Utor. Meteorol. Mon. 2014, 40, 1507–1512. (In Chinese) [Google Scholar]
- Zhao, D.J.; Yu, Y.B.; Chen, L.S. Impact of the Monsoonal Surge on Extreme Rainfall of Landfalling Tropical Cyclones. Adv. Atmos. Sci. 2021, 38, 771–784. [Google Scholar] [CrossRef]
- Zhao, D.J.; Chen, L.S.; Yu, Y.B. Monsoon Surges Enhance Extreme Rainfall by Maintaining the Circulation of Landfalling Tropical Cyclones and Slowing Down Their Movement. Front. Earth Sci. 2021, 9, 717447. [Google Scholar] [CrossRef]
- Zhao, D.J.; Xu, H.X.; Yu, Y.B.; Chen, L.S. Identification of synoptic patterns for extreme rainfall events associated with landfalling typhoons in China during 1960–2020. Adv. Clim. Change Res. 2022; in press. [Google Scholar] [CrossRef]
- Wei, N.; Li, Y. A modeling study of land surface process impacts on inland behavior of Typhoon Rananim (2004). Adv. Atmos. Sci. 2013, 30, 367–381. [Google Scholar] [CrossRef]
- Chien, F.C.; Kuo, H.C. On the extreme rainfall of Typhoon Morakot (2009). J. Geophys. Res. 2011, 116, D05104. [Google Scholar] [CrossRef]
- Zhang, A.; Chen, Y.; Pan, X.; Hu, Y.; Chen, S.; Li, W. Precipitation Microphysics of Tropical Cyclones over Northeast China in 2020. Remote Sens. 2022, 14, 2188. [Google Scholar] [CrossRef]
- Sun, S.; Shi, W.; Zhou, S.; Chai, R.; Chen, H.; Wang, G.; Zhou, Y.; Shen, H. Capacity of satellite-based and reanalysis precipitation products in detecting long-term trends across Mainland China. Remote Sens. 2020, 12, 2902. [Google Scholar] [CrossRef]
- Sun, S.; Wang, J.; Shi, W.; Chai, R.; Wang, G. Capacity of the PERSIANN-CDR Product in Detecting Extreme Precipitation over Huai River Basin, China. Remote Sens. 2021, 13, 1747. [Google Scholar] [CrossRef]
- Delanoë, J.; Hogan, R.J. Combined CloudSat-CALIPSO-MODIS retrievals of the properties of ice clouds. J. Geophys. Res. 2010, 115, D00H29. [Google Scholar] [CrossRef]
- Mitrescu, C.; Miller, S.; Hawkins, J.; L’Ecuyer, T.; Turk, J.; Partain, P.T.; Stephens, G. Near-Real-Time Applications of CloudSat Data. J. Appl. Meteorol. Climatol. 2008, 47, 1982–1994. [Google Scholar] [CrossRef]
- Zhao, S.H.; Zhou, Y.Q. Research on macro-micro structures of typhoon Ewiniar using a variety of satellites. Plateau Meteorol. 2010, 29, 1254–1260. (In Chinese) [Google Scholar]
- Yan, W.; Han, D.; Zhou, X.K.; Liu, H.F.; Tang, C. Analyzing the structure characteristics of tropical cyclones based on CloudSat satellite data. Chin. J. Geophys. 2013, 56, 1809–1824. (In Chinese) [Google Scholar]
- Han, D.; Yan, W.; Ye, J.; Liu, H.F. Analyzing Cloud, Precipitation, and Thermal Structure Characteristics of Typhoons in Eastern Pacific Based on CloudSat Satellite Data. Chin. J. Atmos. Sci. 2013, 37, 691–704. (In Chinese) [Google Scholar]
- Tourville, N.; Stephens, G.; DeMaria, M.; Vane, D. Remote Sensing of Tropical Cyclones: Observations from CloudSat and A-Train Profilers. Bull. Am. Meteorol. Soc. 2015, 96, 609–622. [Google Scholar] [CrossRef]
- Shi, L.H.; Cui, L.L.; Zhao, B.K. Vertical distribution of cloud properties for typhoon eyewall and surrounding spiral cloud bands. J. Trop. Meteorol. 2015, 31, 51–62. (In Chinese) [Google Scholar]
- Gao, Y.; Fang, X. Analyses on vertical structure and microphysical features of typhoon cloud in western pacific based on CloudSat satellite data. Meteorol. Mon. 2018, 44, 597–611. (In Chinese) [Google Scholar]
- Wu, S.N.; Soden, B.J. Signatures of Tropical Cyclone Intensification in Satellite Measurements of Ice and Liquid Water Content. Mon. Weather Rev. 2017, 145, 4081–4091. [Google Scholar] [CrossRef]
- Wu, S.N.; Soden, B.J.; Alaka, G.J. Ice water content as a precursor to tropical cyclone rapid intensification. Geophys. Res. Lett. 2020, 47, e2020GL089669. [Google Scholar] [CrossRef]
- Yan, Y.; Tan, J.; Cui, L. Asymmetry of cloud vertical structures and associated radiative effects in typhoon over the northwest pacific based on CloudSat tropical cyclone dataset. Asia-Pac. J. Atmos. Sci. 2020, 56, 515–532. [Google Scholar] [CrossRef]
- Wu, S.N.; Soden, B.J.; Nolan, D.S. Examining the role of cloud radiative interactions in tropical cyclone development using satellite measurements and WRF simulations. Geophys. Res. Lett. 2021, 48, e2021GL093259. [Google Scholar] [CrossRef]
- Li, H.; Wei, X.; Min, M.; Li, B.; Nong, Z.; Chen, L. A Dataset of Overshooting Cloud Top from 12-Year CloudSat/CALIOP Joint Observations. Remote Sens. 2022, 14, 2417. [Google Scholar] [CrossRef]
- Bedka, K.M.; Dworak, R.; Brunner, J.; Feltz, W. Validation of Satellite-Based Objective Overshooting Cloud-Top Detection Methods Using CloudSat Cloud Profiling Radar Observations. J. Appl. Meteorol. Climatol. 2012, 51, 1811–1822. [Google Scholar] [CrossRef]
- Ren, F.M.; Wang, Y.M.; Wang, X.L.; Li, W.J. Estimating tropical cyclone precipitation from station observations. Adv. Atmos. Sci. 2007, 24, 700–711. [Google Scholar] [CrossRef]
- Li, Y.; Zhao, D.J. Climatology of tropical cyclone extreme rainfall over China from 1960 to 2019. Adv. Atmos. Sci. 2022, 39, 320–332. [Google Scholar] [CrossRef]
- Meng, Z.Y.; Zhang, F.; Luo, D.; Tan, Z.; Fang, J.; Sun, J.; Shen, X.; Zhang, Y.; Wang, S.; Han, W. Review of Chinese atmospheric science research over the past 70 years: Synoptic meteorology. Sci. China Earth Sci. 2019, 62, 1946–1991. [Google Scholar] [CrossRef]
- Yang, S.; Zou, X.; Ray, P.S. Comparison of TC Temperature and Water Vapor Climatologies between the Atlantic and Pacific Oceans from GPS RO Observations. J. Clim. 2018, 31, 8557–8571. [Google Scholar] [CrossRef]
- Niu, Z.; Zou, X.; Huang, W. Typhoon Warm-Core Structures Derived from FY-3D MWTS-2 Observations. Remote Sens. 2021, 13, 3730. [Google Scholar] [CrossRef]
- Zhao, D.J.; Yu, Y.B.; Yin, J.F.; Xu, H.X. Effects of microphysical latent heating on the rapid intensification of Typhoon Hato (2017). J. Meteorol. Res.. 2020, 34, 368–386. [Google Scholar] [CrossRef]
- Marchand, R.; Mace, G.G.; Ackerman, T.; Stephens, G. Hydrometeor Detection Using Cloudsat—An Earth-Orbiting 94-GHz Cloud Radar. J. Atmos. Ocean. Technol. 2008, 25, 519–533. [Google Scholar] [CrossRef]
- Luo, Y.; Zhang, R.; Wang, H. Comparing Occurrences and Vertical Structures of Hydrometeors between Eastern China and the Indian Monsoon Region Using CloudSat/CALIPSO Data. J. Clim. 2009, 22, 1052–1064. [Google Scholar] [CrossRef]
- Zhao, D.J.; Gao, W.H.; Xu, H.X.; Yu, Y.B.; Chen, L.S. A modeling study of cloud physical properties of extreme and non-extreme precipitation in landfalling typhoons over China. Atmos. Res. 2022, 277, 106311. [Google Scholar] [CrossRef]
- Houze, R.A., Jr. Clouds in Tropical Cyclones. Mon. Weather Rev. 2010, 138, 293–344. [Google Scholar] [CrossRef]
- Yang, S.; Zou, X. Lapse rate characteristics in ice clouds inferred from GPS RO and CloudSat observations. Atmos. Res. 2017, 197, 105–112. [Google Scholar] [CrossRef]
- Xu, H.; Duan, Y.; Xu, X. Indirect effects of binary typhoons on an extreme rainfall event in Henan province, China from 19 to 21 July 2021: 1. Ensemble-based analysis. J. Geophys. Res. Atmos. 2022, 127, e2021JD036265. [Google Scholar] [CrossRef]
- Xu, H.; Duan, Y.; Li, Y.; Wang, H. Indirect effects of binary typhoons on an extreme rainfall event in Henan province, China from 19 to 21 July 2021: 2. Numerical study. J. Geophys. Res. Atmos. 2022, 127, e2021JD036083. [Google Scholar] [CrossRef]
Publisher’s Note: MDPI stays neutral with regard to jurisdictional claims in published maps and institutional affiliations. |
© 2022 by the authors. Licensee MDPI, Basel, Switzerland. This article is an open access article distributed under the terms and conditions of the Creative Commons Attribution (CC BY) license (https://creativecommons.org/licenses/by/4.0/).