Article

Three-Dimensional Structure Analysis and Droplet Spectrum Characteristics of Southwest Vortex Precipitation System Based on GPM-DPR

1
College of Atmospheric Sounding, Chengdu University of Information Technology, Chengdu 610225, China
2
Key Open Laboratory of Atmospheric Sounding, China Meteorological Administration, Chengdu 610225, China
3
College of Atmospheric Sciences, Chengdu University of Information Technology, Chengdu 610225, China
*
Author to whom correspondence should be addressed.
Remote Sens. 2022, 14(16), 4063; https://doi.org/10.3390/rs14164063
Submission received: 13 June 2022 / Revised: 10 August 2022 / Accepted: 18 August 2022 / Published: 19 August 2022
(This article belongs to the Special Issue Synergetic Remote Sensing of Clouds and Precipitation)

Abstract

:
This study is the first in the region to use Global Precipitation Mission Dual-Frequency Precipitation Radar (GPM-DPR) and Fengyun-2G (FY-2G) observations to qualitatively and quantitatively study the Southwest Vortex evolution characteristics during the flood season from 2019 to 2021. Furthermore, vertical characteristics of the two main precipitation types in the Southwest Vortex, stratiform and convective, were statistically analyzed at different life stages, including horizontal and vertical distribution of precipitation particles, droplet spectrum characteristics, and vertically layered precipitation contribution. The results showed that: (1) The typical convective precipitation (CP) in the developing and mature stages has strong reflectivity distribution centers in the upper and lower layers, showing characteristics related to terrain. Additionally, the high-level hydrometeor particles are mainly solid precipitation particles, and particles in the lower layers collide and coalesce in the violent vertical motion of the airflow. (2) For the three stages of CP, the reflectivity below melting layer (ML) first showed a rapid weakening trend toward the surface and then remained unchanged, significantly changing its vertical structure. The main rainfall type of the Southwest Vortex system was stratiform precipitation (SP) in the three stages. (3) In the two types of cloud precipitation, the developing stage is generally composed of large and sparse precipitation particles, the mature stage of large and dense precipitation particles, and the dissipating stage of small and sparse precipitation particles. The findings of this study reveal the three-dimensional refined structure and vertical variation characteristics of different life stages of the Southwest Vortex precipitation cloud system and provide important tools and references for improving the accuracy of numerical models and the forecast level of short-term heavy precipitation under complex terrain.

1. Introduction

The Sichuan Basin is located in the transition zone between the monsoon region in Eastern China and the alpine region of the Qinghai-Tibet Plateau (Figure 1). It is surrounded by mountains and has a complex terrain. Owing to the combined influence of the plateau and the humid subtropical monsoon climates, it has become an area of frequent summer rainstorms in China [1,2,3]. Most studies have shown that the precipitation system of the Southwest Low Vortex (also known as the Southwest Vortex) is an important factor causing summer rainstorms in the Sichuan Basin [4,5,6,7]. This system is a meso-α-scale low-pressure eddy system with cyclonic circulation under the interaction of topographic heating on the leeward slope of the eastern Qinghai-Tibet Plateau and atmospheric circulation [8,9,10]. Its precipitation intensity, range, and frequency are second only to typhoons [8], often bringing regional rainstorms and inducing secondary disasters, such as urban waterlogging, landslides, and debris flows, which further leads to floods and rainstorms in the middle and lower reaches of the Yangtze River.
In recent years, a large number of achievements have been made in the determination of statistical characteristics of Southwest Vortex weather (vortex source, origin, moving path), background field analysis of circulation, diagnostic calculation, numerical simulation, and its impact on weather changes [11,12,13,14,15]. However, the uneven distribution of ground observation stations [16], limitations of radar observations under complex terrain [17,18], and the fact that vertical observations are almost absent in the transition region between plateau and basin have led to more research on numerical simulation and diagnostic analysis of limited data in recent years, while further revealing the evolution characteristics, vertical structure, and microphysical characteristics of the Southwest Vortex have not made significant progress. The emergence of the Global Precipitation Mission (GPM) has brought a positive impact on a large-scale refined precipitation observation study. GPM carries two advanced microwave sensors on the core satellite: an active Dual-Frequency Precipitation Radar (DPR) and a multichannel passive microwave radiometer (GPM Microwave Imager, GMI). Compared with the previous generation Tropical Rain Measuring Mission Precipitation Radar (TRMM PR), GPM-DPR provides higher spatial and temporal resolution, greatly improving the estimation capability of micro and solid precipitation in mid-to-high latitudes. Additionally, it provides the three-dimensional structure information of precipitation [19], which further enhances the ability of spaceborne radar to estimate precipitation. Ample research has been conducted using GPM-DPR detection data. In terms of the reliability of its data, Kotsuki et al. (2014) cross-validated the rationality of the DPR product to retrieve rain intensity by comparing it with ground-based radar [20]. Lu and Wei (2017) used GPM data to study the three-dimensional structure of typhoon precipitation and found that the results of DPR and ground-based S-band radar detection of the “Rainbow” typhoon are very similar, proving the reliability of GPM-DPR data for weather system research [21]. Biswas et al. (2018) compared the precipitation products and reflectivity of GPM-DPR with the ground-based dual-polarization radar, and the overall results were better [22]. In terms of characteristics of precipitation structure: Ryu J et al. (2021) used GPM-DPR products to study three types of drop spectrum characteristics of rainstorms and revealed the contribution of diameter concentration parameters to rainstorms [23]. Sun et al. (2020) used GPM-DPR to invert the vertical structure of a typical Meiyu precipitation event and obtained the vertical profile information of reflectivity, rainfall rate, effective radius, and effective concentration [24]. Zhang et al. (2020) used GPM-DPR observations to study the distribution characteristics of raindrop sizes during the East Asian summer monsoon [25]. It can be seen that it is feasible to use advanced GPM-DPR observation data to reveal the important characteristics of the precipitation system.
Part of the current uncertainty in numerical forecasting is due to insufficient understanding of cloud microphysical processes and vertical characteristics within precipitation, resulting in large errors in precipitation estimation. Kobayashi et al. [26] indicated that regional statistical research on vertical climate characteristics of precipitation is necessary to solve this problem. Based on this, this study used the GPM-DPR detection results for the first time to analyze the Southwest Vortex precipitation system at different stages of life and different types of precipitation. Through characteristic analysis of typical cases and statistical research of a large number of cases, the main statistical characteristics of the system were obtained, and its important regular characteristics were revealed. At the same time, the high-resolution three-dimensional precipitation structure and particle-scale distribution data provided by GPM-DPR were used to further demonstrate the three-dimensional refined structure and vertical variation characteristics of the Southwest Vortex precipitation system, thereby improving the accuracy of numerical models, the level of short-term heavy precipitation forecasting, and the prediction and prevention of severe weather in Southwest China.
The paper is organized as follows: Section 2 presents the data and methods used in this study. Section 3 is the analysis of the macro and micro characteristics of the Southwest Vortex precipitation, and the research on the microphysical characteristics. Section 4 is the conclusion and discussion.

2. Data and Methods

2.1. Satellite Observation Data

The satellite data used in this study were produced by 2A.DPR_NS of the GPM version 06 dual-frequency joint inversion. The data period was the 3 year flood season (May–September) from 2019 to 2021, the time resolution of the data was 1.5 h, and the spatial resolution was 5 km. 2A.DPR provides single- and dual-frequency precipitation estimation products from the Ku and Ka radars of DPR. They were obtained from the wide-band (245 km) Ku-band frequencies, the narrow-band (125 km) Ka-band frequencies, and the narrow-swath dual-frequency data. Ka-band has short wavelength and high sensitivity. The field of view of the inner scanning band of Ka and Ku bands is matched, and the matching data is used to derive the dual frequency precipitation products [19]. 2A.DPR data can provide detailed track-by-track precipitation information, including three-dimensional attenuation-corrected precipitation intensity, precipitation reflectivity factor, parameters of the droplet size distribution (DSD), and other variables. This study used 2A.DPR to obtain information such as near-surface precipitation rate, attenuation-corrected reflectivity (Ze in dBZ), melting layer (ML in km) height, precipitation type, echo top height, and DSD parameters.

2.2. Discrimination Method of Southwest Vortex

Mu and Li (2017), summarized the definition of Southwest Vortex in the statistical characteristics of Southwest Vortex in China [27], this definition is used as the standard for screening the Southwest Vortex in this paper. It states that the Southwest Vortex is generated on the leeward slope (99°–109°E, 26°–33°N) of the Qinghai-Tibet Plateau on the isobaric surface of 700 hPa, and the wind direction of three stations is a cyclonic circulation low vortex or continuous two low pressures with closed contours. We selected the precipitation data of the flood season from 2019 to 2021, compared its geopotential height and wind field, and then, according to the definition of the Southwest Vortex, a total of 35 Southwest Vortex precipitation events were found during this period. However, since the GPM core satellite is non-sun-synchronous, it cannot achieve continuous observation of this area. Given this, we matched the time of satellite transit over the Sichuan Basin and the Southwest Vortex precipitation events that occurred within this spatiotemporal extent, in which 27 of the 35 rainfall events were successfully scanned by the GPM satellite (Table 1). The new measured dual-frequency ratio (DFRm) [28,29,30] was used to classify precipitation types, including convective precipitation (CP), stratiform precipitation (SP), and other precipitation. CP and SP [31] are produced by two different microphysical dynamic processes, and their vertical structure reflects the phase state, size, and number concentration of internal precipitation particles [32,33,34]; therefore, this study mainly focused on these two types of precipitation.

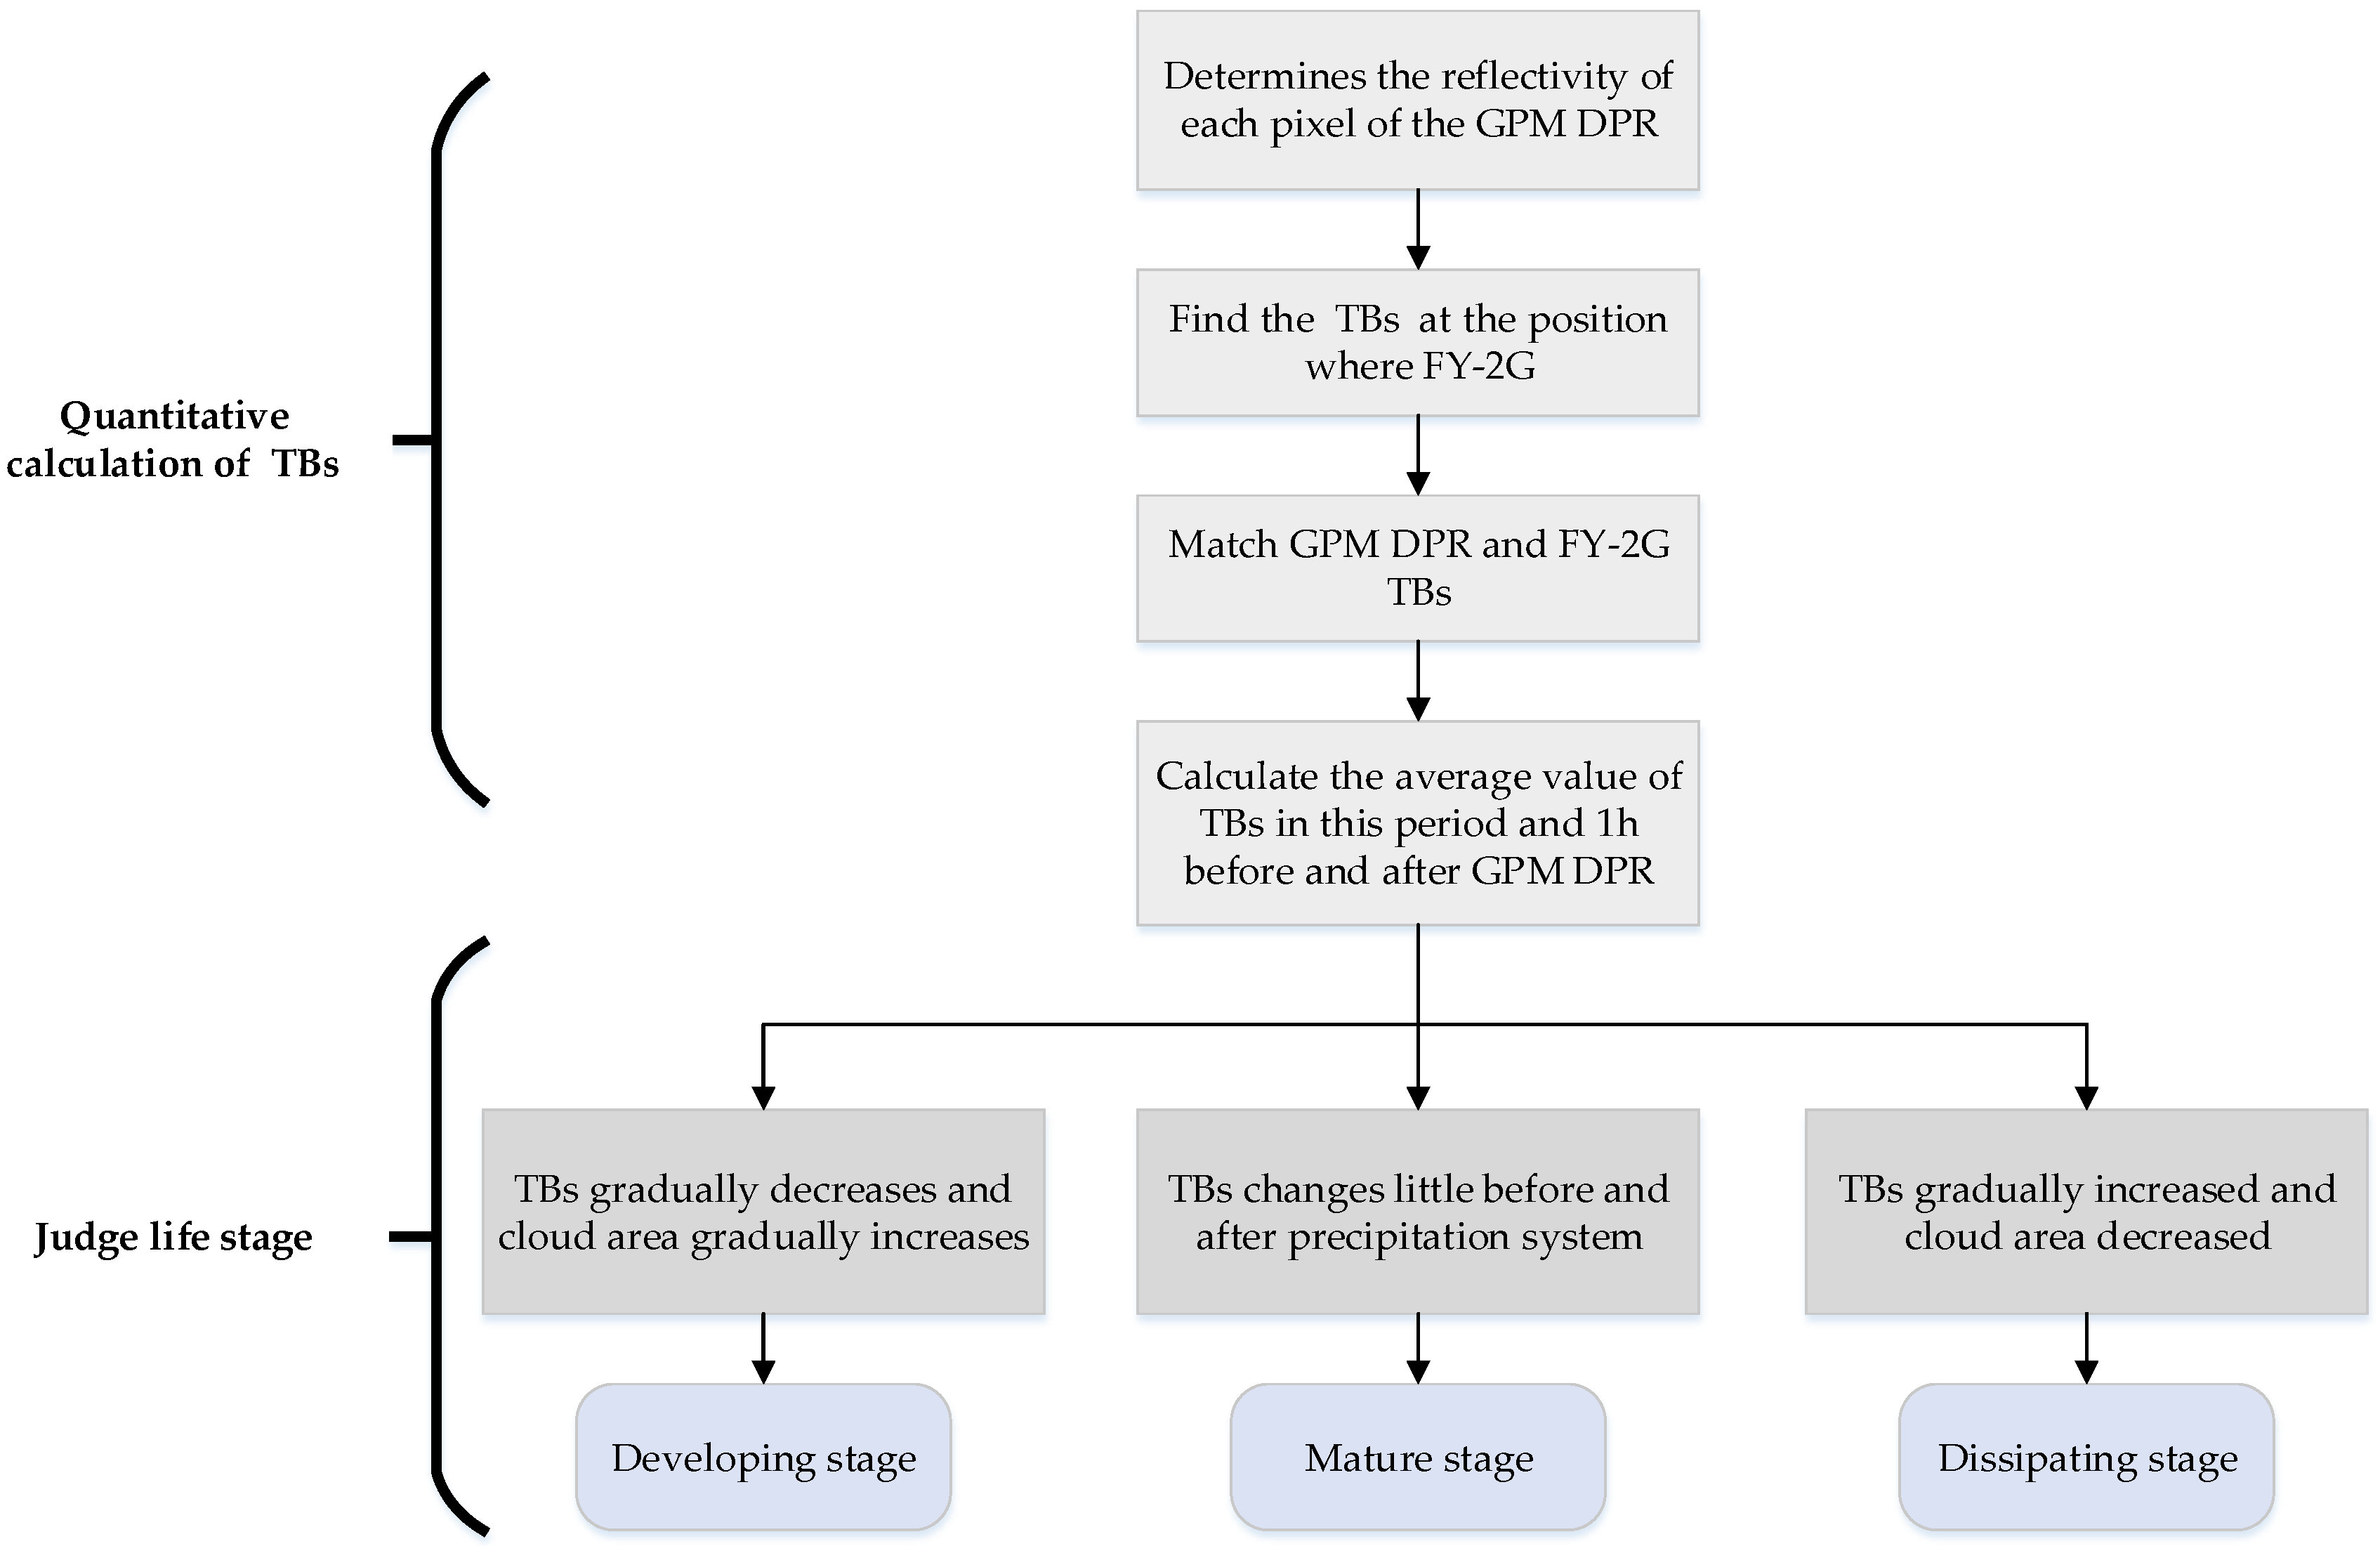
2.3. Classification of Life Stages

Since different life phases of the precipitation system will lead to different precipitation mechanisms, therefore, so we need to determine the life phases of each Southwest Vortex precipitation system. Studies by Byers and Braham (1949) [35] and Robert (1982) [36] showed that the life cycle of a mesoscale convective system (MCS) can be divided into three stages: developing, mature, and dissipating. During the developing stage, the cloud layer brightness temperatures (TBs) gradually decrease, and the cloud layer area gradually increases. Subsequent stages are considered mature, there is little change in precipitation cloud temperature before and after the precipitation system. After that, the TBs of the system cloud gradually increase, and the scale of the system development decreases. This stage is called the dissipating stage. According to this definition, and due to the discontinuity of the GPM microwave Imager TBs, we chose the Fengyun 2G (FY-2G) satellite to determine the life stage of the Southwest Vortex precipitation system detected by the DPR instrument [24]. FY-2G is a geostationary meteorological satellite, and the sub-satellite point is located at the longitude of 105 °E of the equator. The time resolution of TBs products is 1 h, and the spatial resolution is 0.05° × 0.05°. Based on the life cycle classification method of Machado et al. (1998) [37], to enhance the objectivity of the classification, we first took the TBs value of the FY-2G at the location of all reflectivity on GPM-DPR, and compared it with the DPR observation. The obtained pixel points were matched, and then the corresponding period of the GPM satellite observation area and the average value of all TBs 1 h before and after the period were calculated to add a quantitative reference to the classification process, as shown in Figure 2.
Based on this method, we could obtain continuous hourly FY-2G TBs images before and after the Southwest Vortex event scanned by GPM-DPR, thereby identifying different life stages. One of the mature precipitation systems is shown in Figure 3.

2.4. Data Statistical Methods

To effectively reveal the internal structural characteristics of CP and SP in the Southwest Vortex precipitation system, we used the normalized contoured frequency by altitude diagrams (NCFAD) [38,39,40] and the vertical profile of the average reflectivity. Additionally, we used the mean vertical profile of reflectivity (MVPR) line [41,42,43] to reflect the vertical distribution characteristics of two types of precipitation cloud systems. Among them, NCFAD normalizes the number of samples at all height levels. The frequency of occurrence of a certain height level and a certain amount of radar reflectivity accounts for the maximum frequency of radar reflectivity at all height levels, as shown in Equation (1). This method presents the occurrence frequency of the precipitation processes at different heights and different value ranges through two-dimensional graphics [38].
p = F ( n , dBZ ) F m a x ( m , dBZ ) , ( m , n > 0 )
where p represents the normalized proportion of reflectivity values, F represents the frequency of occurrence of reflectivity values, n represents the level per n km, m represents any level, and dBZ represents reflectivity.
MVPR refers to the average value of the reflectivity factor measured by the radar in a specific area by height, as shown in Equation (2). It can be used as a representative profile within the area. The MVPR information can well reveal the content and particle microphysical processes in the precipitation system [43].
x =   dBZ n N n ( n > 0 )
where x represents the average height of each layer, n represents the level per n km, dBZ n represents each reflectivity at each n km level, and N represents the total amount of reflectivity at n km level.

3. Analysis of Results
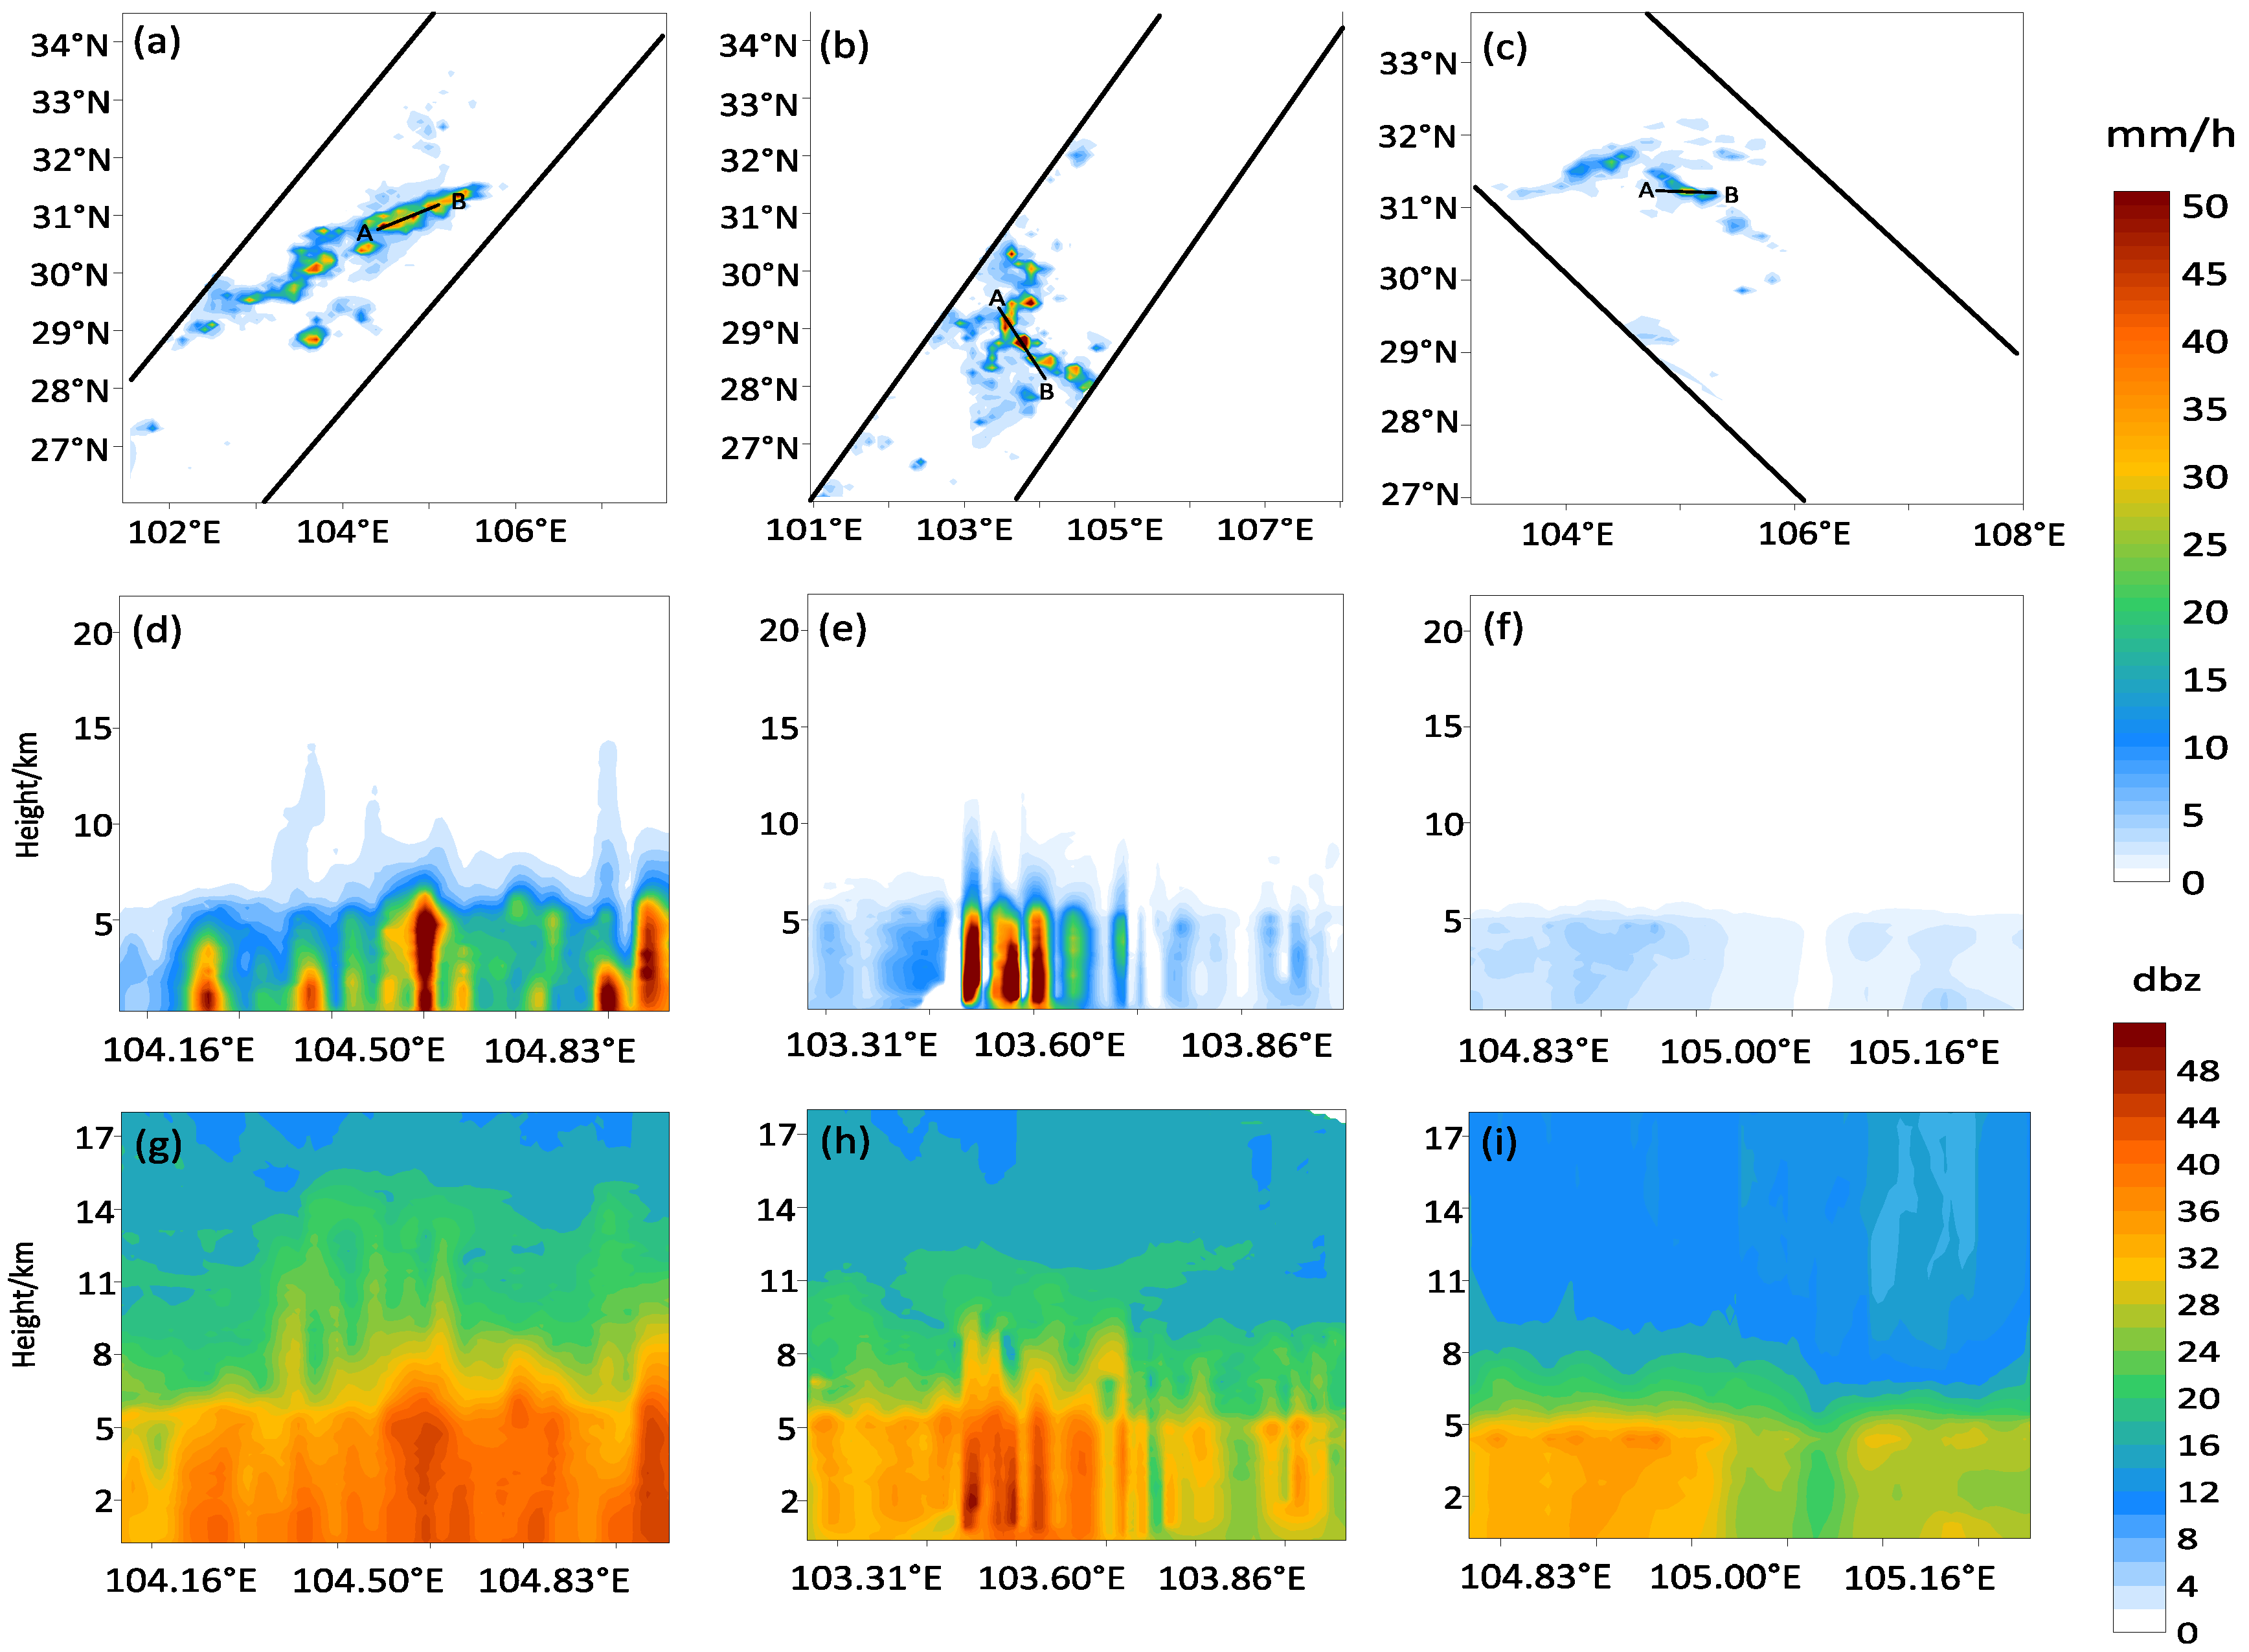
3.1. Case Studies

Before the statistical analysis of the structural properties of the Southwest Vortex precipitation system, we focused on the precipitation structure of three individual cases during the developing, mature, and dissipating stages of the system. These case studies can preliminarily reveal the structural characteristics of this stage and lay a foundation for subsequent statistical research.

3.1.1. Identification of Precipitation Systems

According to the evaluation criteria in Section 2.3, we identified and divided all the precipitation processes that were screened in different life stages and finally selected three cases to show the developing, mature, and dissipating processes of a typical Southwest Vortex system. Figure 4a,e,i shows the distribution of maximum reflectivity for the three life stages of Case 1–3. Case 1 occurred at 17:46 on 11 August 2020. During this, the strong distribution center of maximum reflectivity was mainly located in the southeastern part of Sichuan Province (Figure 4a), and the maximum intensity had reached more than 50 dBZ. The TBs observed in the FY-2G precipitation event (16:00–18:00, 1-h interval) are shown in Figure 4b–d. As shown by the figures, from 16:00 to 18:00 in the corresponding DPR scanning track area, the average TBs gradually decreased, and the area of cloud layers with TBs < 230 K gradually increased, making this the developing stage of the Southwest Vortex. In Case 2, at 12:14 on 30 August 2020, the center of maximum reflectivity was located in the southern part of Sichuan Province (Figure 4e), and the maximum intensity reached more than 50 dBZ, which was not very different from the value of the developing stage. From 11:00 to 13:00, the difference in the area of clouds with TBs < 230 K was small, and the average TBs before and after precipitation did not change much (Figure 4f,h), indicating that the Southwest Vortex precipitation system was in a mature stage at this time. For Case 3, the system occurred at 21:29 on 30 August 2020, and the strong distribution center was located in the northeastern part of Sichuan Province (Figure 4i). From 20:00 to 22:00, the area of clouds with TBs < 230 K gradually decreased and was small (Figure 4j,l), the maximum reflectivity value was the lowest among the three cases, and the distribution area was the smallest. Therefore, Case 3 was defined as the dissipating stage.

3.1.2. Vertical Distribution Characteristics of the Reflectivity Factor

Figure 5 shows the vertical distributions of near-surface rainfall rate and radar reflectivity for the three Southwest Vortex precipitation events. The figure shows that the developing and mature stages were composed of two parts, heavy rain in the central region and the surrounding drizzle, as shown in Figure 5a,b. While the dissipating stage (Case 3) was mainly composed of weak precipitation with a near-surface precipitation rate below 10 mm/h (Figure 5c).
Figure 5. (ac) Near surface precipitation rates of three Southwest Vortex cases at different life stages during 2019–2021. (df) The precipitation system developed (Case 1) (left) at 17:46 on 11 August 2020, and (middle) matured (Case 2) at 12:14 on 30 August 2020. The sub-sum (right) dissipating (Case 3) at 21:29 on 30 August 2020, is the vertical profile of the attenuation-corrected reflectivity for the three stages. (gi) The precipitation rate profiles for the three stages. In (ac), the cross-sections of each stage are shown as solid black lines.
Remotesensing 14 04063 g005
In the developing stage (Case 1), the strong echo center of precipitation was widely distributed, mainly below the height of 6.2 km, which corresponds to the height of the ML in Figure 6a,d. The echo top was up to 15 km, and the maximum precipitation rate and reflectivity were more than 50 dBZ. It can be seen that the particles were subject to a strong updraft when falling at this stage. In the mature stage (Case 2), the strong echo centers of precipitation were maintained below 5.4 km. As the height decreased, the rainfall rate and reflectivity increased gradually, indicating that the raindrops continued to collide and grow during the falling process, increasing the rainfall rate. The highest precipitation rate was above 50 mm/h, and the highest reflectivity was above 50 dBZ, which showed that the convective activity of precipitation particles during this period was strong. As in Case 1, the rainfall rate and reflectivity increased as the altitude decreased. In the dissipating stage (Case 3), the reflectivity echo value was lower than 40 dBZ, the precipitation rate dropped below 10 mm/h, the echo top height was below 10 km and mainly distributed below 5.2 km, and the precipitation particle convection activity was weak.
To understand the vertical structure of the Southwest Vortex precipitation system, NCFAD and the median profile of the reflectivity factor can reveal in detail the microphysical processes of the macroscopic distribution of precipitation clouds and particle evolution (Figure 6). From the perspective of the three stages, the echo top heights of the cloud in the developing stage (left) and mature stage (middle) were similar, both reaching approximately 16 km, while the echo top of the cloud (right) in the dissipating stage was the lowest (only 11 km), which shows that both the developing and mature stages were more active than the dissipating stage of cloud droplet particles. The echo crest heights in the CP region were higher than that in the SP region in the three stages, this indicates that the strong updraft in convective precipitation promotes the intense particle activity, and brings more precipitable ice particles to the upper layer, resulting in higher particle precipitation concentration. As these larger, fast-falling ice particles descend, the associated radar echoes reveal clear vertical cores with maximum reflectivity below the height of the bright band (Figure 5g–i). For all three stages, most convective reflectivity factor values below the bright band were between 35 and 50 dBZ (approximately 10 dBZ higher than SP), indicating that CP particles were more active in falling collisions and coalescing [24,38]. The reflectivity factor of SP was mainly distributed at 18–30 dBZ, and the height was mainly concentrated at 6–10 km, which indicates that SP particles grow rapidly near the ML when they slowly descend from the upper layer, resulting in a bright band effect [38].
Compared with SP, partial differences in the areas of strong distribution of reflectivity factors were observed for CP in the three stages, along with two strong distribution centers in the developing stage (Figure 6d) and the mature stage (Figure 6e). In addition to a distribution center with a reflectivity factor ranging from 35 to 45 dBZ at 4 km, another strong distribution center with a reflectivity factor of 16–25 dBZ appeared in the upper layer. This vertical feature was similar to the frequency distribution of the radar reflectivity factor of solid precipitation clouds in the vertical structure of East Asian continental clouds studied by Yin et al. [38], indicating that the hydrometeor particles in the center of the strong reflectivity distribution in the upper layer may be composed of solid precipitation particles, and for the convection, the precipitation particles grow in the lower layer and then collide and aggregate and move upward in the violent vertical motion. At the same time, it is also considered to be related to the uneven distribution of terrain height in the study area. In CP, as the terrain rises, the height of the center of the reflectivity factor also increases. This conclusion is consistent with that obtained by Zhou et al., in a study of the vertical structure of abrupt heavy rainfall events over southwest China with complex topography [44].
From the median reflectivity profile, the reflectivity factors of the two types of precipitation cloud particles increased monotonically with the decrease of the height from 10 to 6 km, indicating that the ice crystals grew rapidly at this altitude. Among them, the CP cloud (Figure 6d–f) had a larger profile gradient, and the particle swarm in the cloud grew faster. Near the ML, the reflectivity of SP (Figure 6a–c) increased sharply, a bright band representing melted ice, snow precipitation particles, and raindrops. At this time, the particles were dominated by a mixture of ice, snow, and raindrops. Below the bright band, the maximum frequency and the median radar reflectivity in the dissipating stage (Figure 6c) remained almost unchanged, indicating that the cloud particle swarm growth rate was slowed at this level and the particle swarm size concentration did not change much. In addition, the intensity of the reflectivity factor in the developing stage (Figure 6a) and the mature stage (Figure 6b) still tended to increase slightly at 2 km, possibly because the collision and coalescence process of raindrops slightly overwhelmed the evaporation when the lower layer fell to the surface. In the three stages of CP clouds (Figure 6d–f), the intensity of the reflectivity factor below the bright band remained unchanged or slightly increased, indicating that the convective activity, accompanied by strong updrafts, was beneficial to strengthening the lower-level collision-coalescence of raindrops. It should be noted here that the situation below 1 km will not be discussed because the signal attenuation and ground clutter may be affected below 1 km [45].
Based on the results shown in Figure 6, we found that the reflectivity increased slightly below the ML, indicating that the collision and coalescence process of raindrops in the two types of precipitation clouds slightly overwhelmed the evaporation process during the low-level falling process. Figure 7 shows the normalized radar reflectivity distribution of each altitude layer and each quartile. It can be seen that the variation trend of the median reflectivity with height and cloud top height corresponding to each height of the two types of precipitation clouds in the three stages was the same as that of the median reflectivity profile in Figure 6. The reflectivity of the cloud below the height of the bright band had a slightly larger trend in both the developing and mature stages, indicating that the raindrops were coalescing. Furthermore, below the bright band, the extreme value of the mature stage in Figure 7a was larger than that of the other two stages, but the difference was small. As shown in Figure 7b, the developing stage of the lower quartile was larger than that of the other two stages, and the mature stage of the upper quartile was largest. Below the bright band, the median and extreme values of different cloud top heights also indicated that the particle activity was more active in the mature stage than that in the other two stages.

3.2. Statistical Analysis

According to the different stages of all the Southwest Vortex precipitation systems in the 2019–2021 period, the statistical characteristics of different types of precipitation can be seen (Table 2). The contribution of SP to total rainfall was larger than the contribution of CP. SP was the main contributor of total precipitation in all three life stages, the number of samples accounted for 75.8%, 76.2%, and 81.7% of the total samples, and the contribution to the total precipitation reached 55.7%, 59.5%, and 74.2%, respectively, which indicated that the main rainfall type of the Southwest Vortex system was SP, with a large precipitation range, followed by CP. This conclusion is consistent with the precipitation types of the Sichuan Basin based on the TRMM satellite studied by Xiang et al. [46]. In addition, among the three stages, the samples in the stratiform stage accounted for a larger proportion (75.8–81.7%), accounting for 55.7–74.2% of the total rainfall, while the samples in the CP accounted for only 13.2–17.6%%, but the contribution to the total rainfall could reach 25.7–44.3%. In terms of rainfall intensity, the rainfall intensity of CP was greater than that of SP, indicating that strong convective activity was the main factor affecting the precipitation intensity. Of the three stages, the average rainfall results were similar in the developing stage and mature stage, while that of the dissipating stage was the smallest. Based on statistics, the extreme values occurred in CP (the precipitation rates determined in this study were greater than 50 mm/h), and the frequency of extreme value in the developing stage and mature stage was similar; 38 and 36, respectively. The extreme value was typically found in the dissipation stage. However, due to the low frequency of occurrence in each stage, this study does not give special attention to the extreme value.

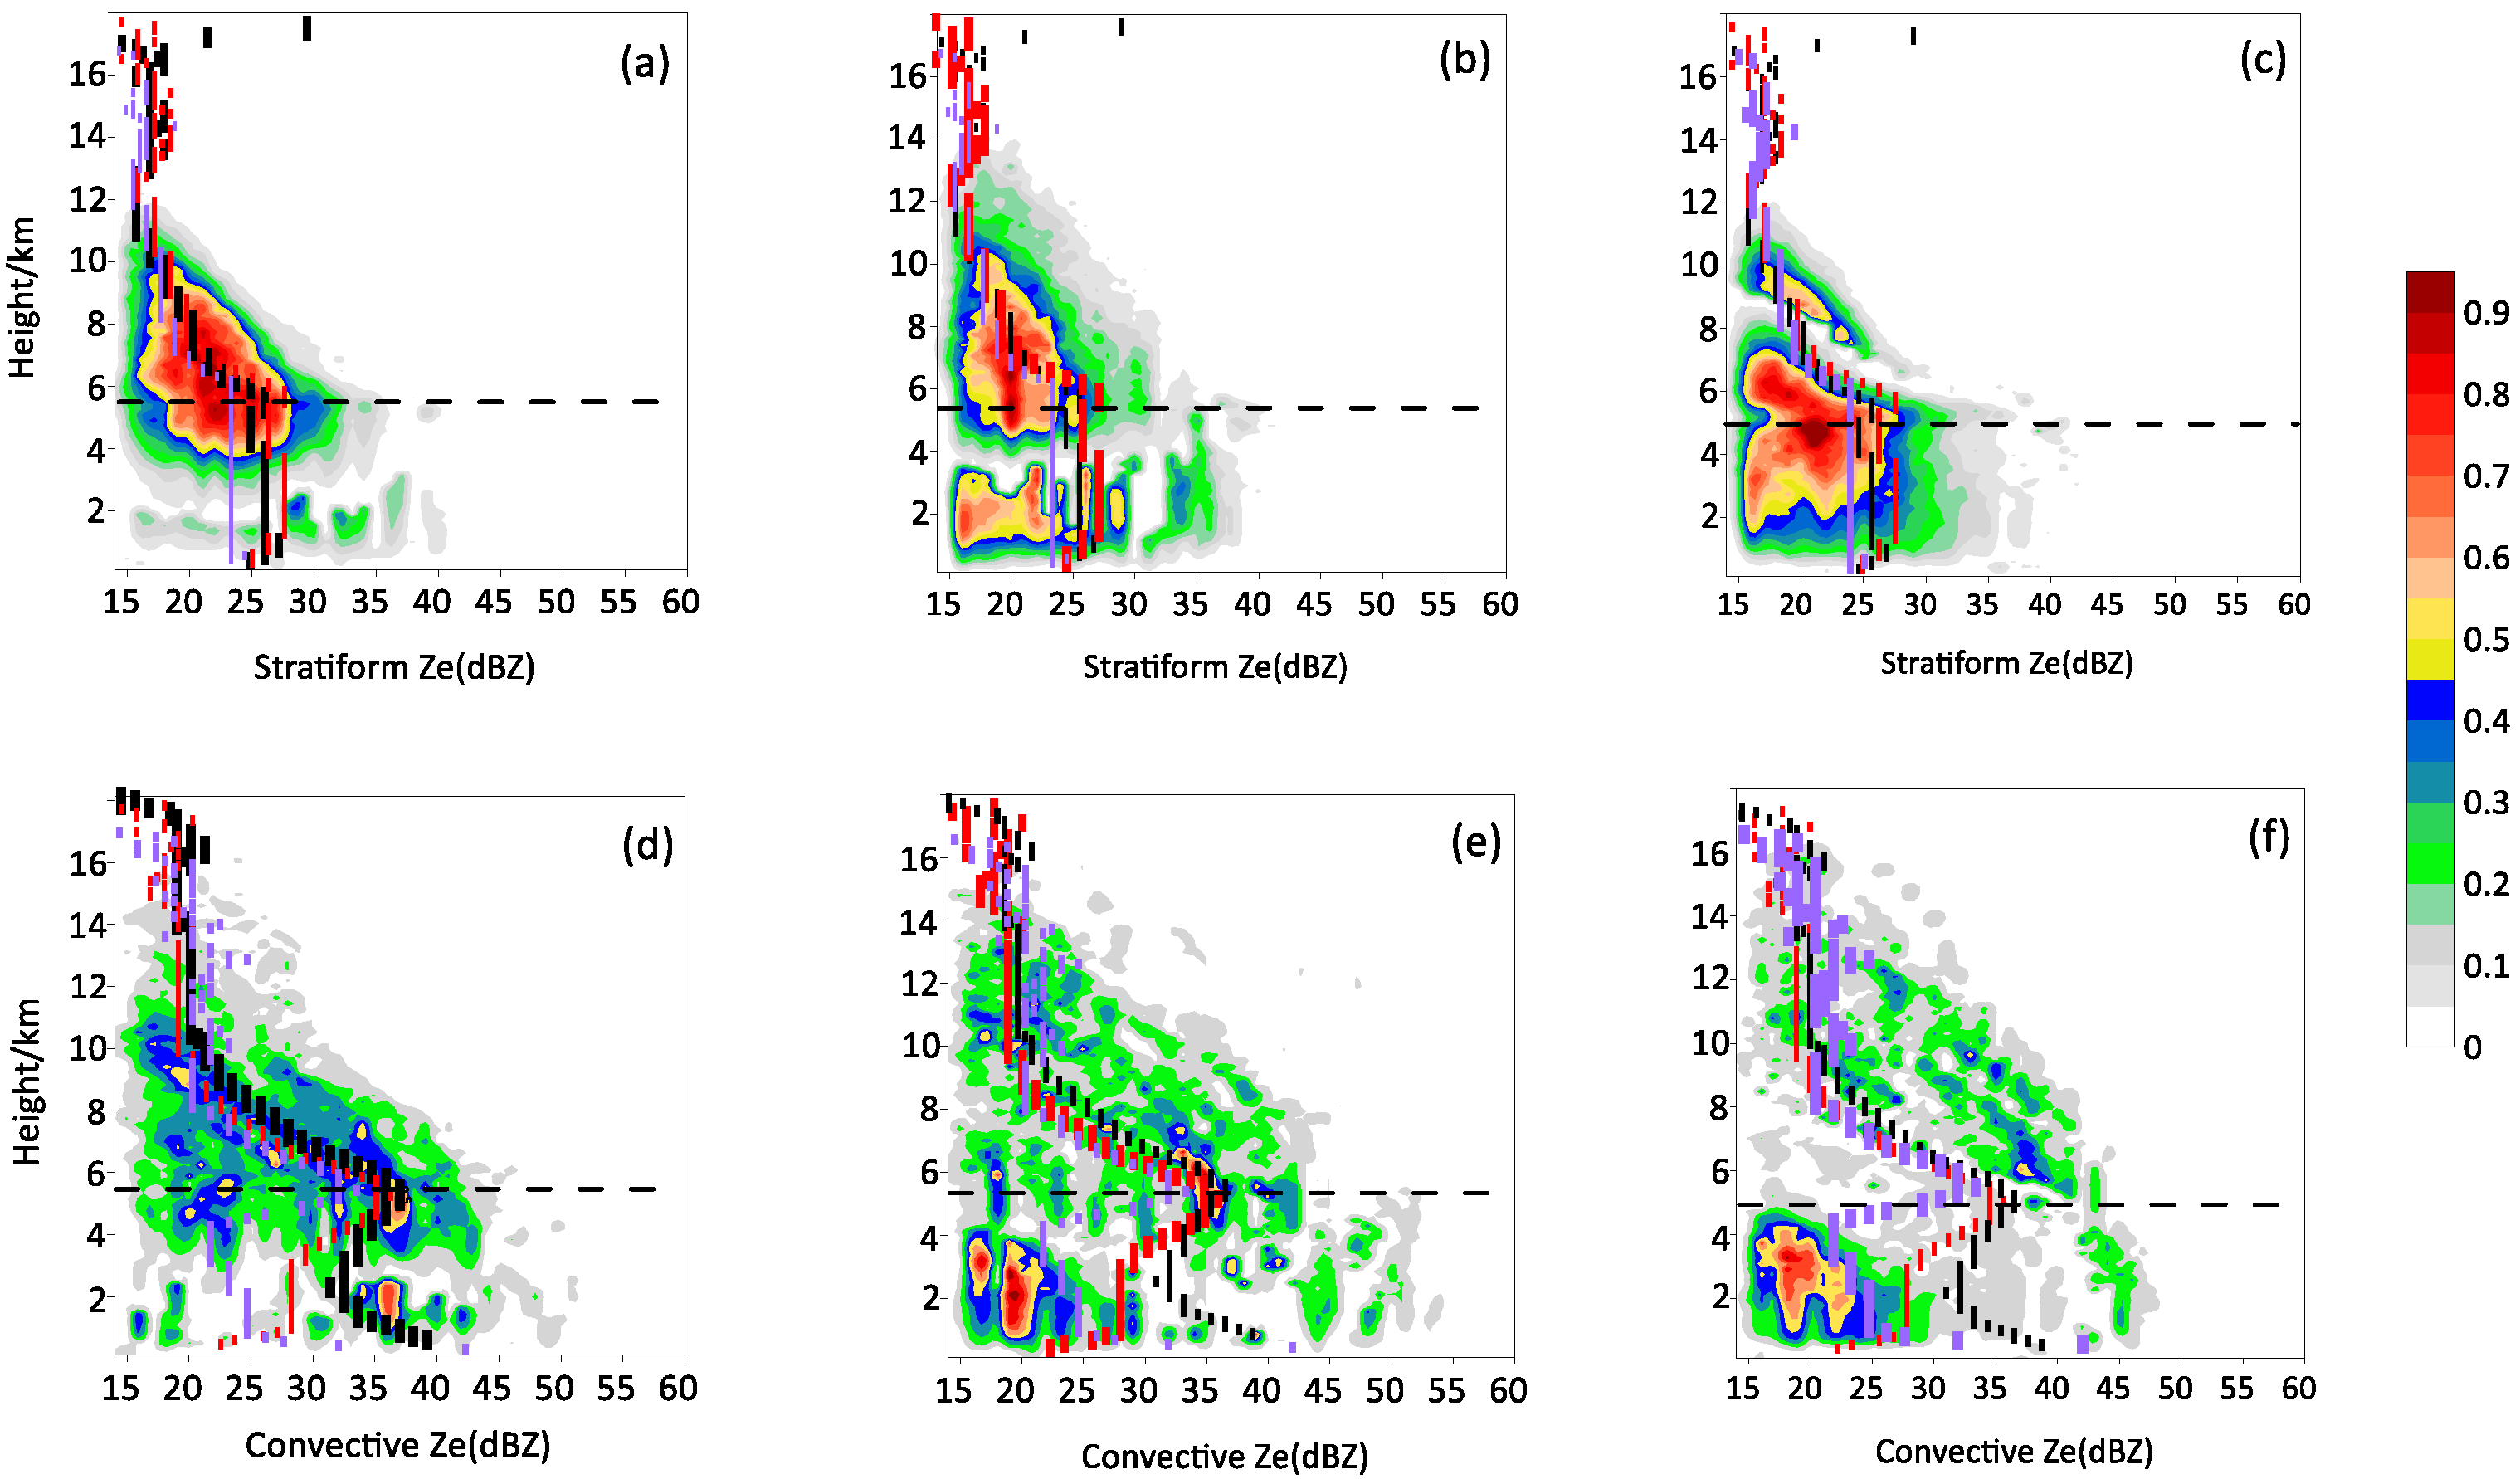
3.2.1. Vertical Distribution Characteristics of Reflectivity and Precipitation Rate

The microphysical process of the precipitation in the study area can be further understood by studying the statistics of the vertical structure characteristics of the reflectivity in the long-term series. The vertical characteristics of composite SP in three stages in Figure 8 are similar to the case study, with clear bright bands, near which radar reflectivity increases sharply. No significant difference was observed in the reflectivity extrema at various heights during the developing and dissipating stages, and the cloud top heights were similar.
Information on the increase or decrease in reflectivity of lower layers with height can help improve surface precipitation estimates [47]. By observing the median reflectivity profile, the trend of the composite SP profile was the same as in the above three cases (Figure 6), so a consistent conclusion was drawn. However, for the three stages of CP, the reflectivity below the bright band first showed a rapid weakening trend toward the surface and then remained unchanged, showing a characteristic related to terrain, significantly changing its vertical structure [42]. It may be the uneven distribution of terrain, the weak CP in the plain was affected by evaporation in the near-surface layer [44]. Alternatively, at the beginning, the cloud particles were evacuated due to the decrease in the vertical velocity of the updraft, and the particle concentration decreased; then, when approaching the ground as the cloud particles had been evacuated, the evacuation rate slowed down and accumulated or stayed at this altitude. This conclusion is slightly different from the study by Cao et al. [34], where the reflectivity below the bright zone on the surface showed a weak growth trend during the developing and mature of the Meiyu season in the middle and lower reaches of the Yangtze River.
Among the three life stages, the developing stage had its largest average precipitation rate among the different altitudes below 6 km (Figure 9a,b), and the average precipitation rate was highest in either SP or CP. The mature stage had the second highest values among the stages. In CP, the average precipitation rate near the ground was as high as approximately 8.2 mm/h, and that in the mature stage was about 6 mm/h. In the reflectivity profile (Figure 8) and average precipitation rate profile above 6 km, the developing stage was similar to the mature stage, because the strong upward flow in the developing stage brought a large amount of water from the lower layer to the upper layer, which intensified convective activities, resulting in a large number of ice particles and water droplets, as in the mature stage [35]. The average precipitation rate of CP was greater than that of SP, which is the same as the calculation result in Table 2. In addition, we found that the two types of rainfall rates increased gradually with decrease in height when they were close to the ground, which is different from the results obtained from the Meiyu system studied by Sun et al. [24], possibly because of the difference in water vapor supply between the Southwest Vortex precipitation system and the Meiyu front precipitation system and the influence of different thermal and dynamic conditions [3]. However, the exact reason for the formation of this phenomenon remains unclear. In the future, it will be necessary to reveal the physical mechanism behind it in greater detail based on data simulation and a variety of observations.

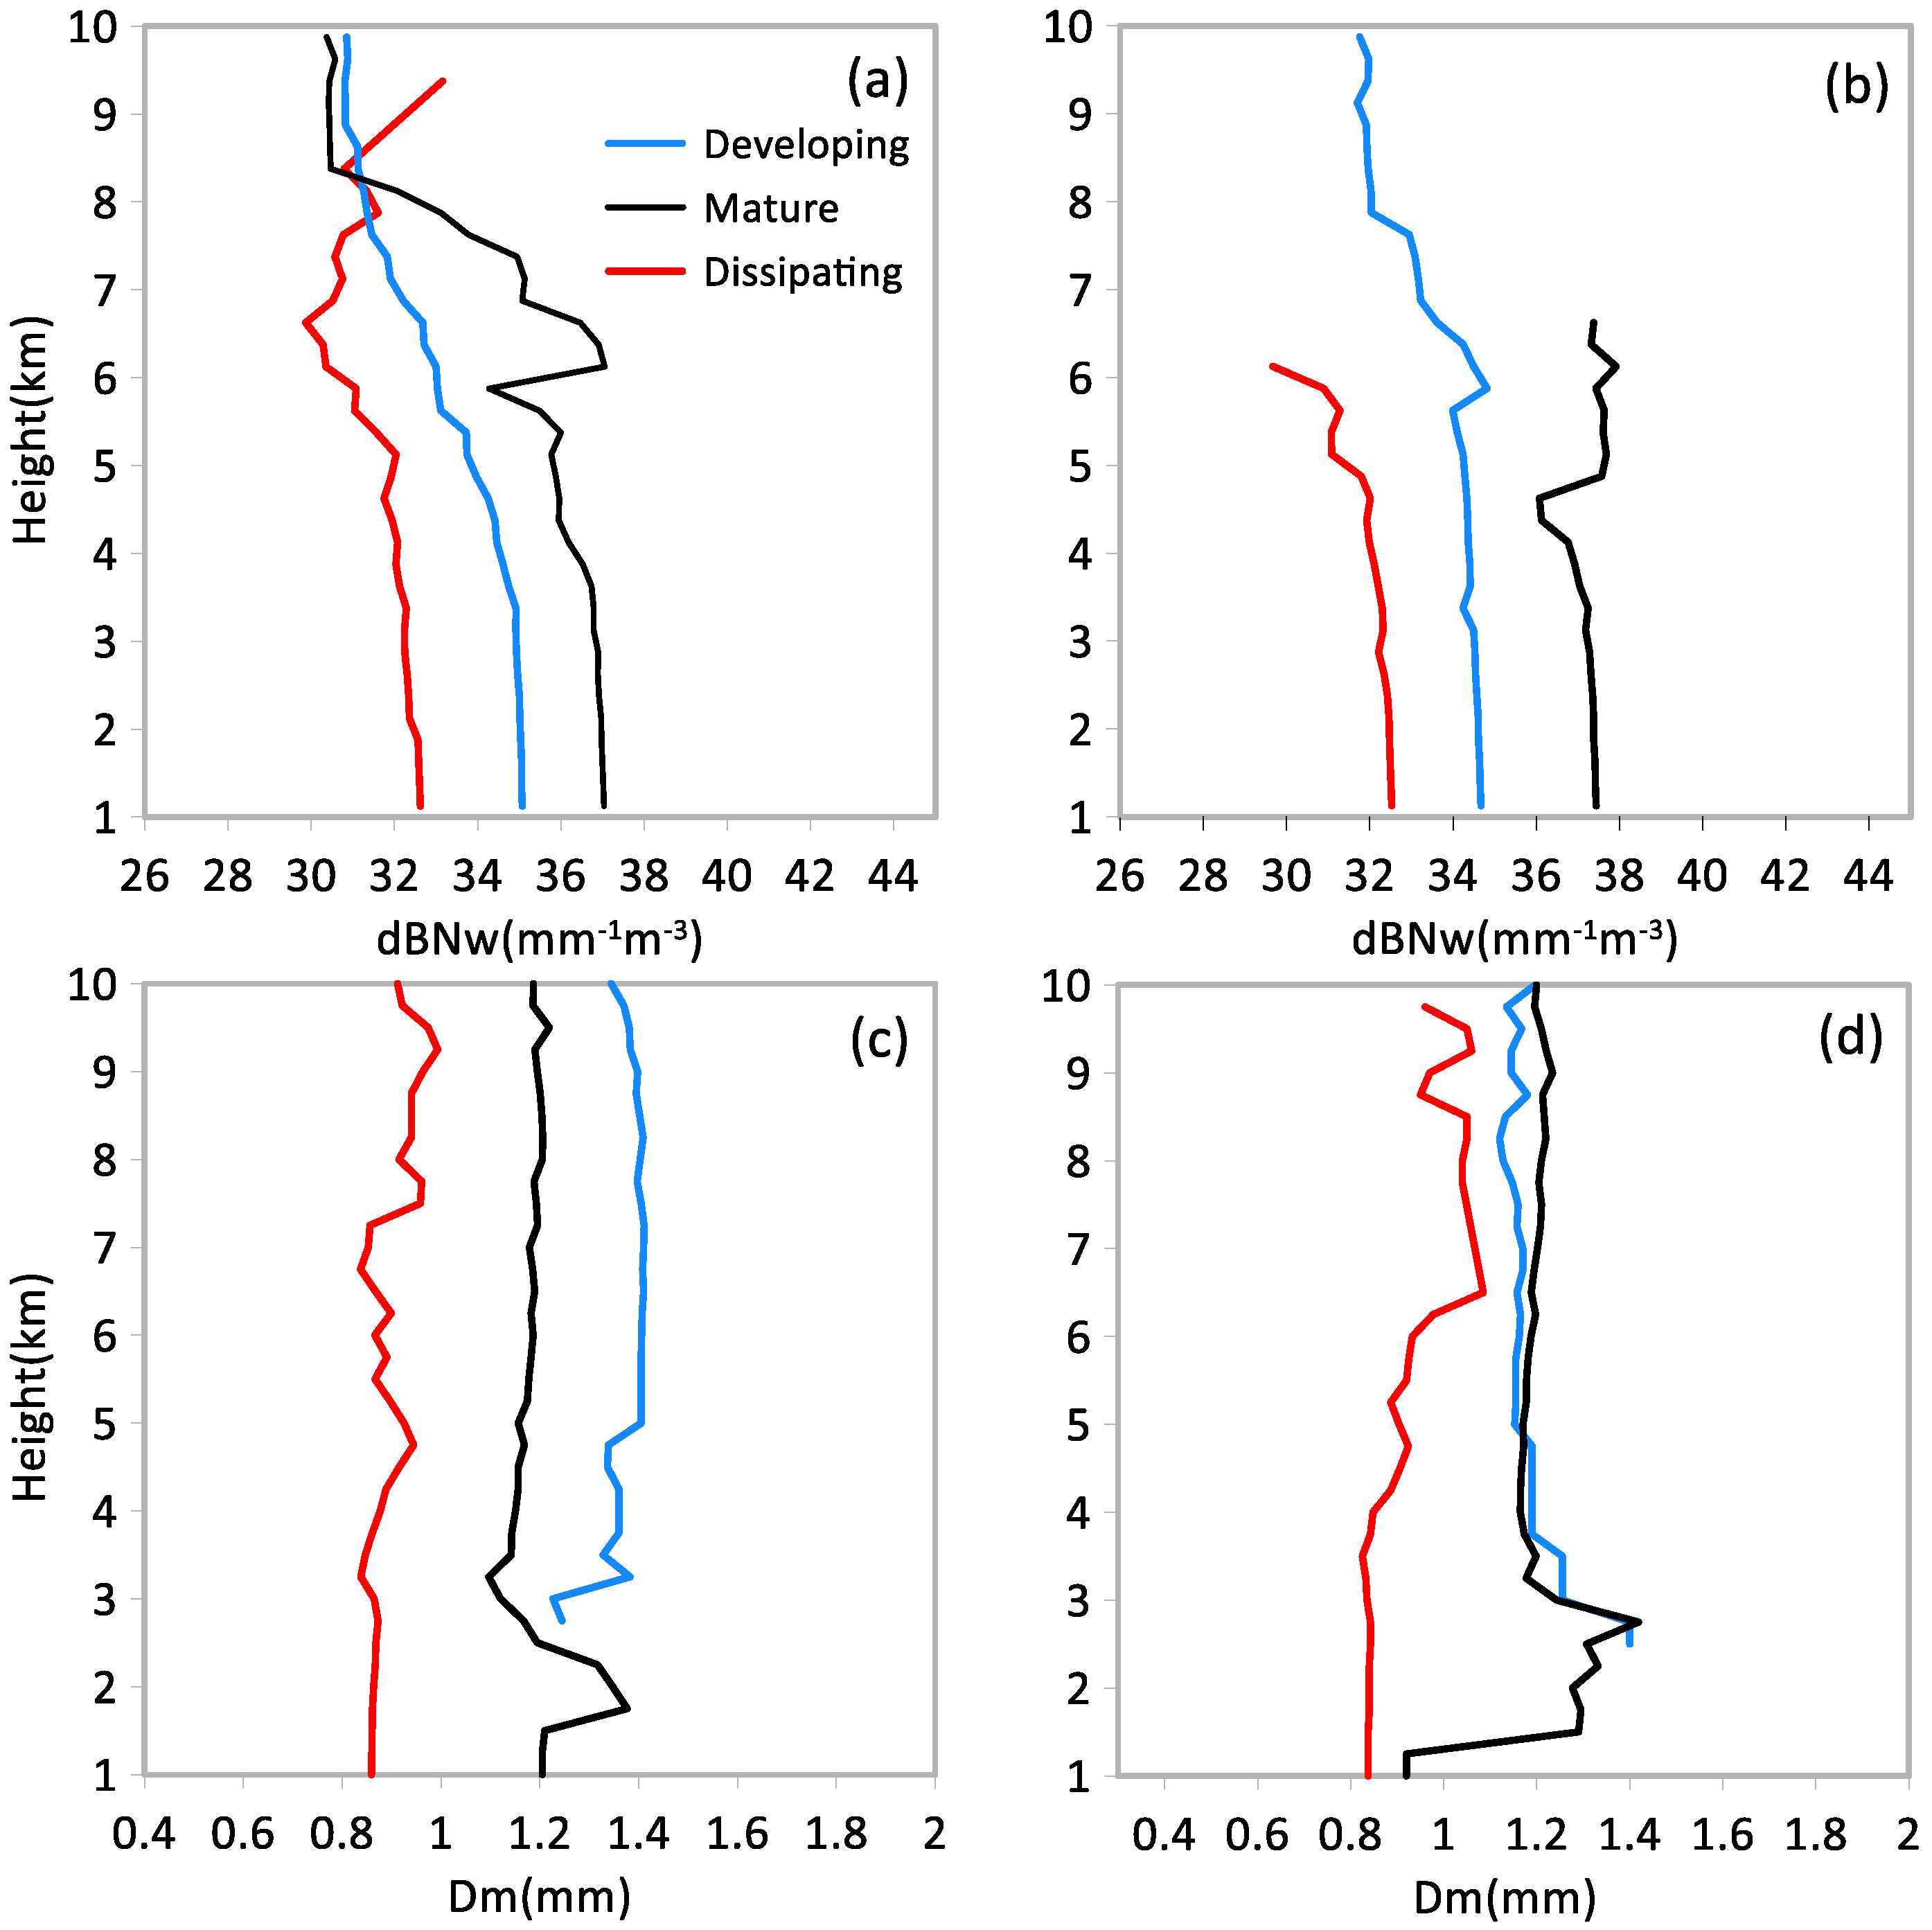
3.2.2. Droplet Size Distribution

In order to deeply understand the microphysical process of precipitation system, it is necessary to study the droplet size information, it is worth noting that DSD parameters provide an excellent opportunity for this [48,49]; the DSD parameters [50,51] of GPM 2A.DPR products include the effective droplet radius (Dm in mm ) and the droplet concentration parameter (Nw in mm 1 / m 3 ). The dB stands for the mathematical operation of 10 log 10 ( ) .
The average Dm and dBNw profiles are shown in Figure 10. For total precipitation, higher dBNw values indicate that raindrops fall to the ground and collide and break. However, due to a large amount of water vapor in the developing and mature stages, after raindrops break, the small raindrops adsorb the strongly rising water vapor, resulting in the Dm in the developing and mature stages being greater than the value in the dissipation stage. For the Dm profile of SP (Figure 10a,c), the dBNw and the Dm value were the lowest in the dissipating stage. Therefore, the mean precipitation rate values for SP in the dissipating stage (Figure 9a) was the smallest.
Compared with SP, CP in the different life stages had a greater impact on Dm and dBNw (Figure 10b,d). dBNw was the largest in the mature stage, and Dm was slightly smaller in the mature stage than in the developing stage; therefore, the CP in the mature stage consisted of large, high-density water droplets. The precipitation rate was typically related to the size of Dm and dBNw, but it was more relevant to Dm. Dm is related to the precipitation mechanism in the life stage; generally, the updraft common in the developing stage leads to a large Dm. [34]. Therefore, a strong updraft in the developing and mature stages carries heavy precipitation particles from the lower layer to the upper layer. The developing stage changed from a large to a sparse particle composition. As the Southwest Vortex system gradually dissipated, the strong upward movement stopped, the particles could no longer grow easily, and dBNw and Dm attained their smallest values in the dissipating stage. Therefore, in the two types of clouds, the dissipating stage of precipitation generally consists of small and sparse precipitation particles.
The results shown in Figure 8, Figure 9 and Figure 10 indicate that for the life stage of the Southwest Vortex precipitation system, the precipitation mechanisms and microphysical processes of CP and SP are different. Among the three life stages, the mature stage had the stronger vertical movement, producing more precipitation particles, with sufficient moisture and fast particle aggregation efficiency. Owing to the strong updraft in the developing stage, the cloud top height in this stage was similar to that in the mature stage, and the structural characteristics were not very different.
For the development and maturity of SP, the changing trend of reflectivity below the height of the ML shows that the strong updraft encountered during the falling process of the lower layer accelerated the collision and coalescence of particles. However, in the dissipating stage, there was less moisture in the lower layer, the effect of evaporation and decomposition processes was increased, and the reflectivity value was almost unchanged. However, in the three stages of CP, the reflectivity below the bright band first showed a rapid weakening trend toward the surface, and then the gradient remained unchanged, which showed the characteristics related to terrain. Alternatively, it may be that cloud particles could have been evacuated due to the reduced vertical velocity of the updraft, and the particle concentration decreased. Then, once the cloud particle swarm had been evacuated when approaching the ground, the evacuation rate slowed down, and accumulated or stayed at this level.

4. Conclusions

Using the GPM-DPR and FY-2G detection data during the flood season from 2019 to 2021, this study makes a statistical analysis of the three-dimensional structure and droplet spectrum characteristics of the Southwest Vortex precipitation system in the Sichuan Basin, and the main conclusions are as follows:
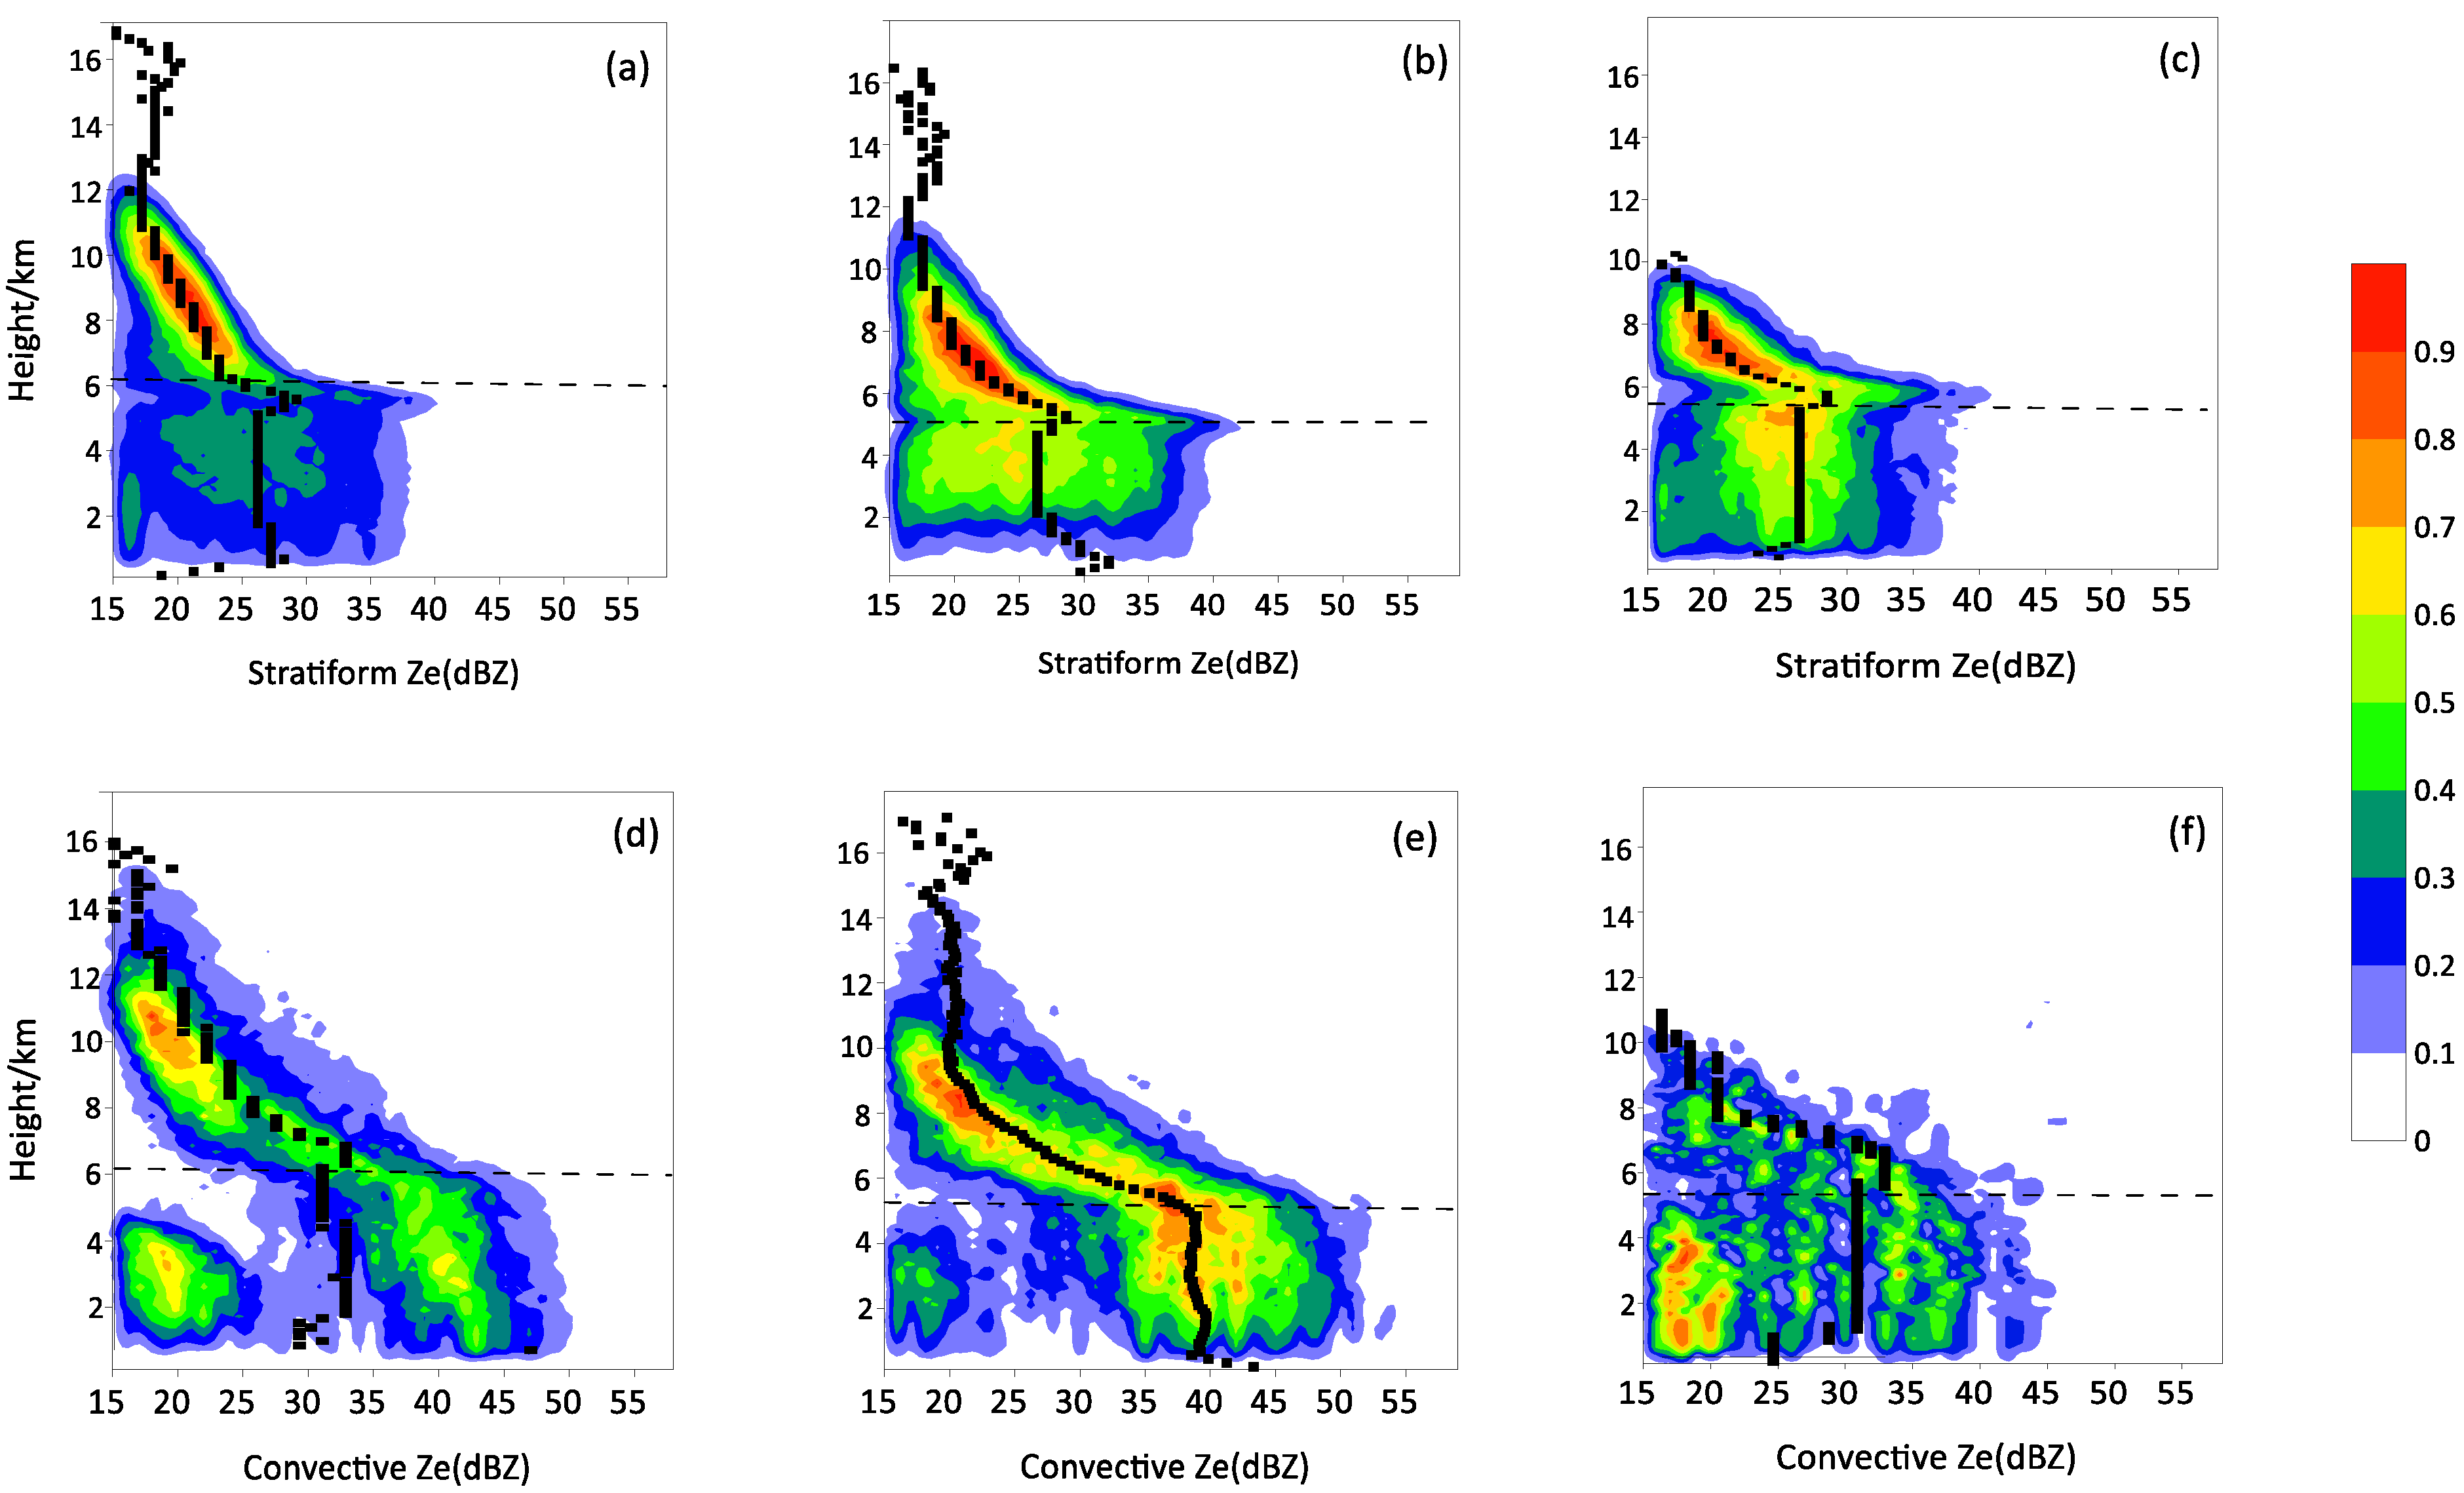
  • From the three selected cases, the SP particles grow rapidly near the ML when they slowly descend from the upper layer and have a bright band effect. The reflectivity increases slightly below the bright band, indicating that the collision and coalescence process of raindrops in the two types of precipitation clouds slightly overwhelms the surface evaporation process during the fall of the lower layer. In the developing and mature stages of CP, there are two strong reflectivity distribution centers at 8–10 and 2–4 km, respectively, showing characteristics related to terrain. The high-level hydrometeor particles are mainly composed of solid precipitation particles, and the low-level hydrometeor particles collide and coalesce in the violent vertical motion of the airflow.
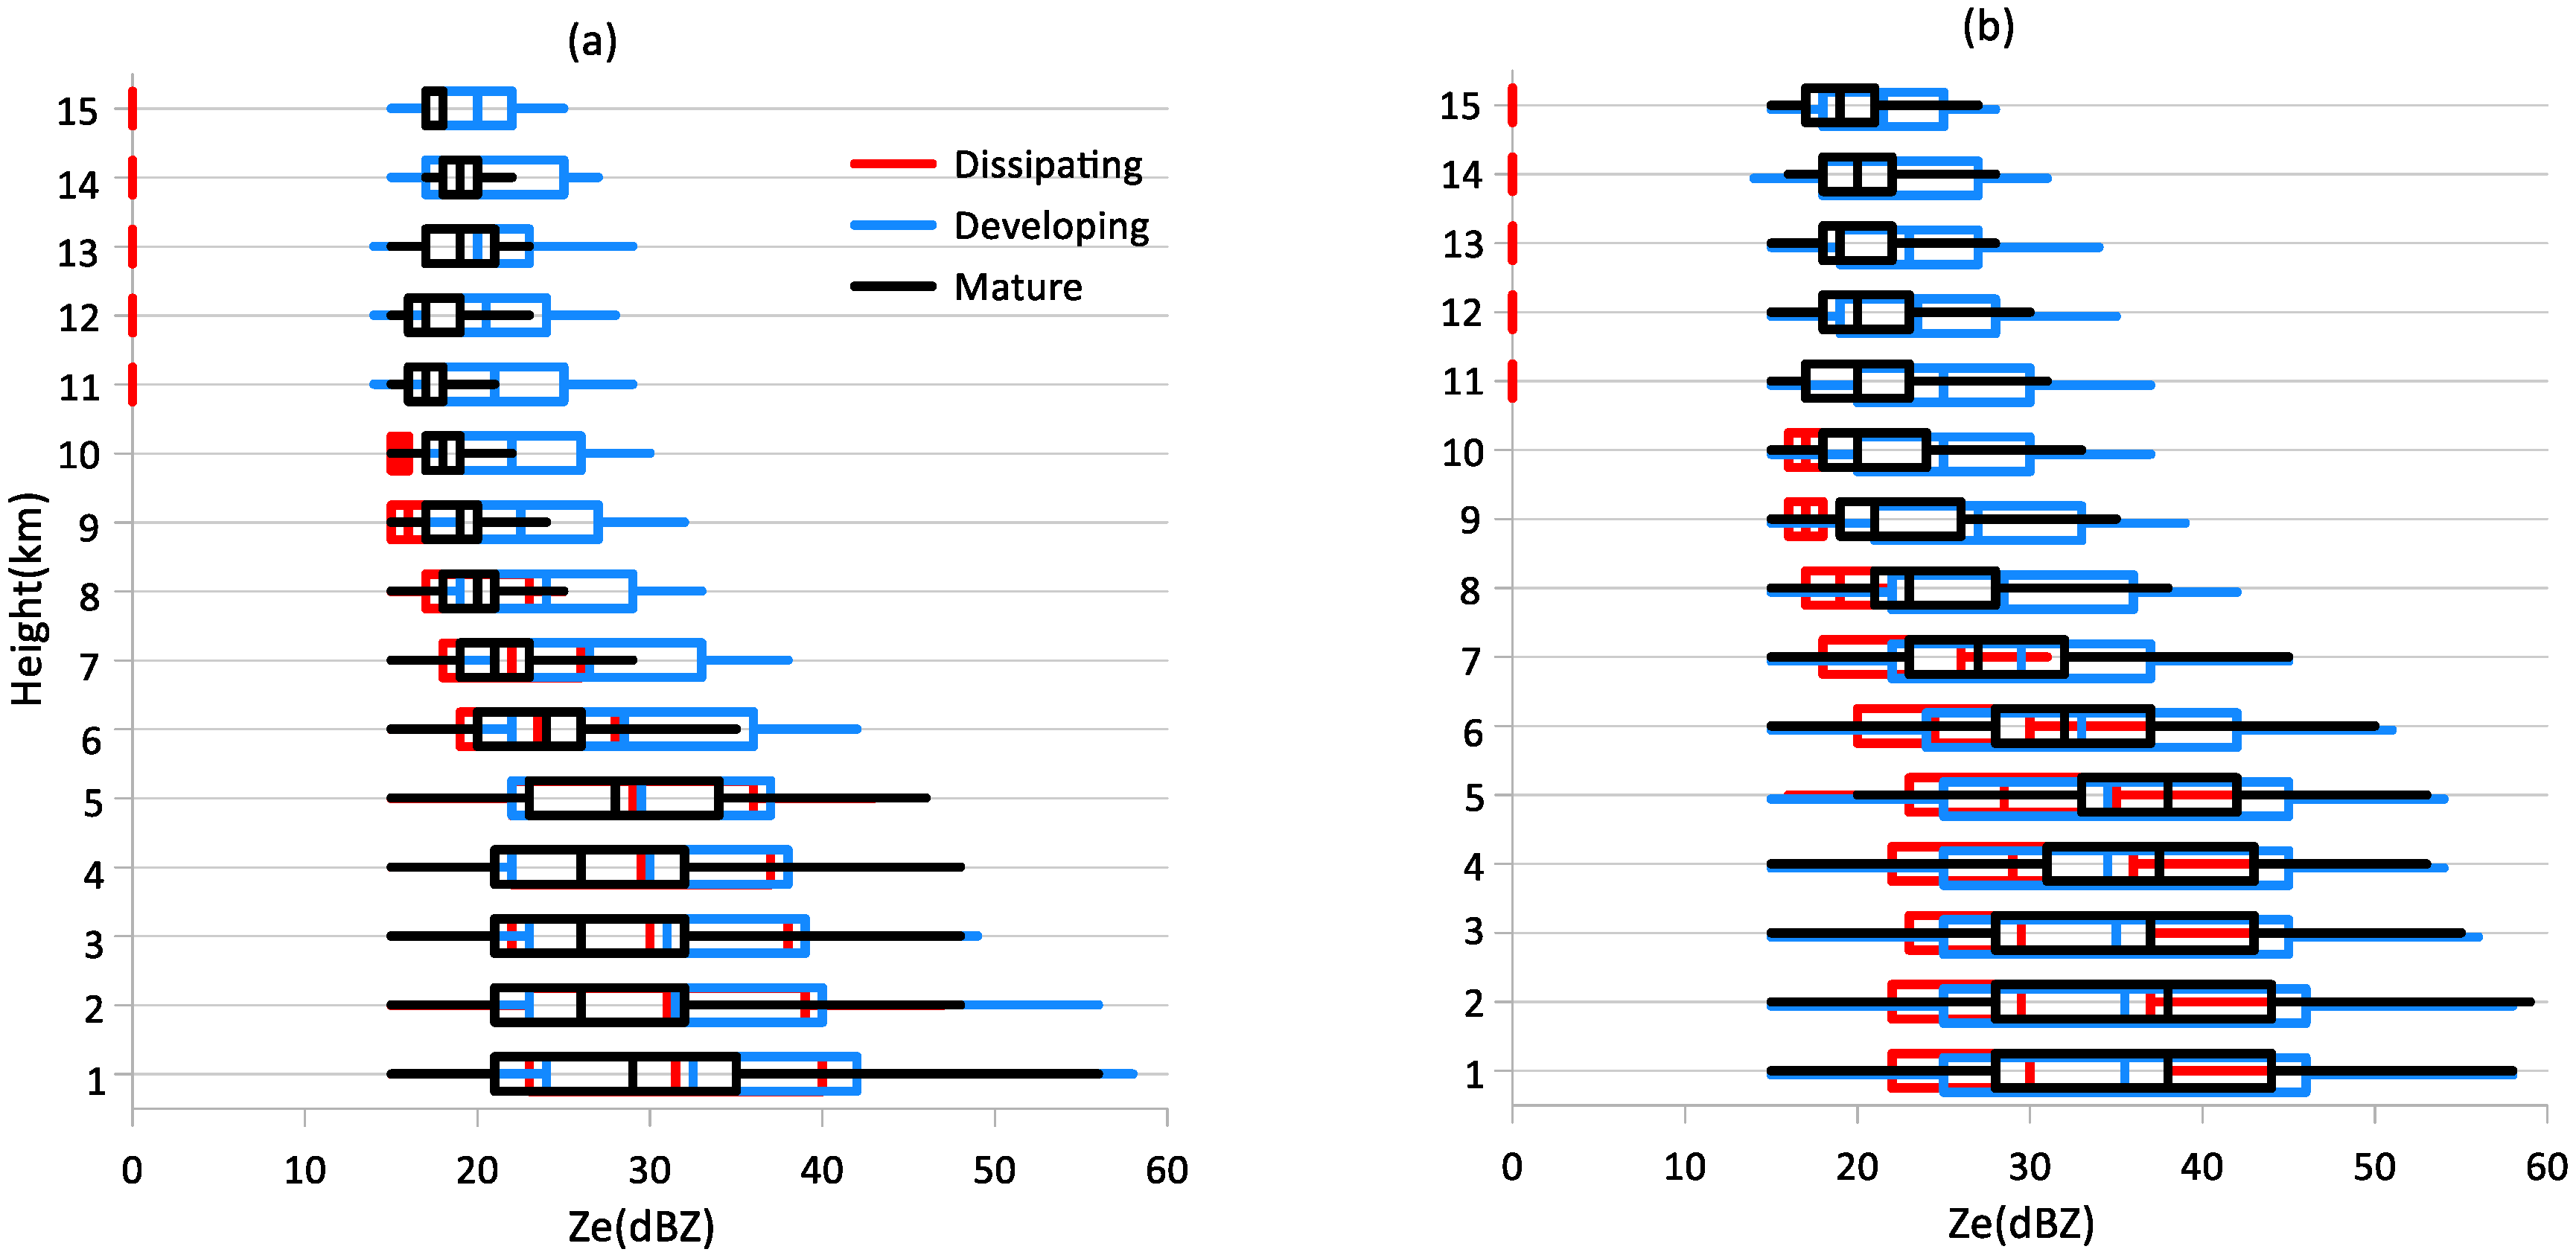
  • In the statistical analysis of the three life stages of the Southwest Vortex precipitation system, the structural characteristics of the developing and mature stages are similar. The primary rainfall type of the Southwest Vortex system is SP, and the SP samples contribute greatly to the total rainfall, with contribution rates of 55.7%, 59.5%, and 74.2%. Compared with CP, the trend of the SP profile is less different from typical cases, but in CP, the reflectivity below the bright band shows a rapid weakening trend toward the surface first and then remains unchanged, which makes its vertical structure change significantly.
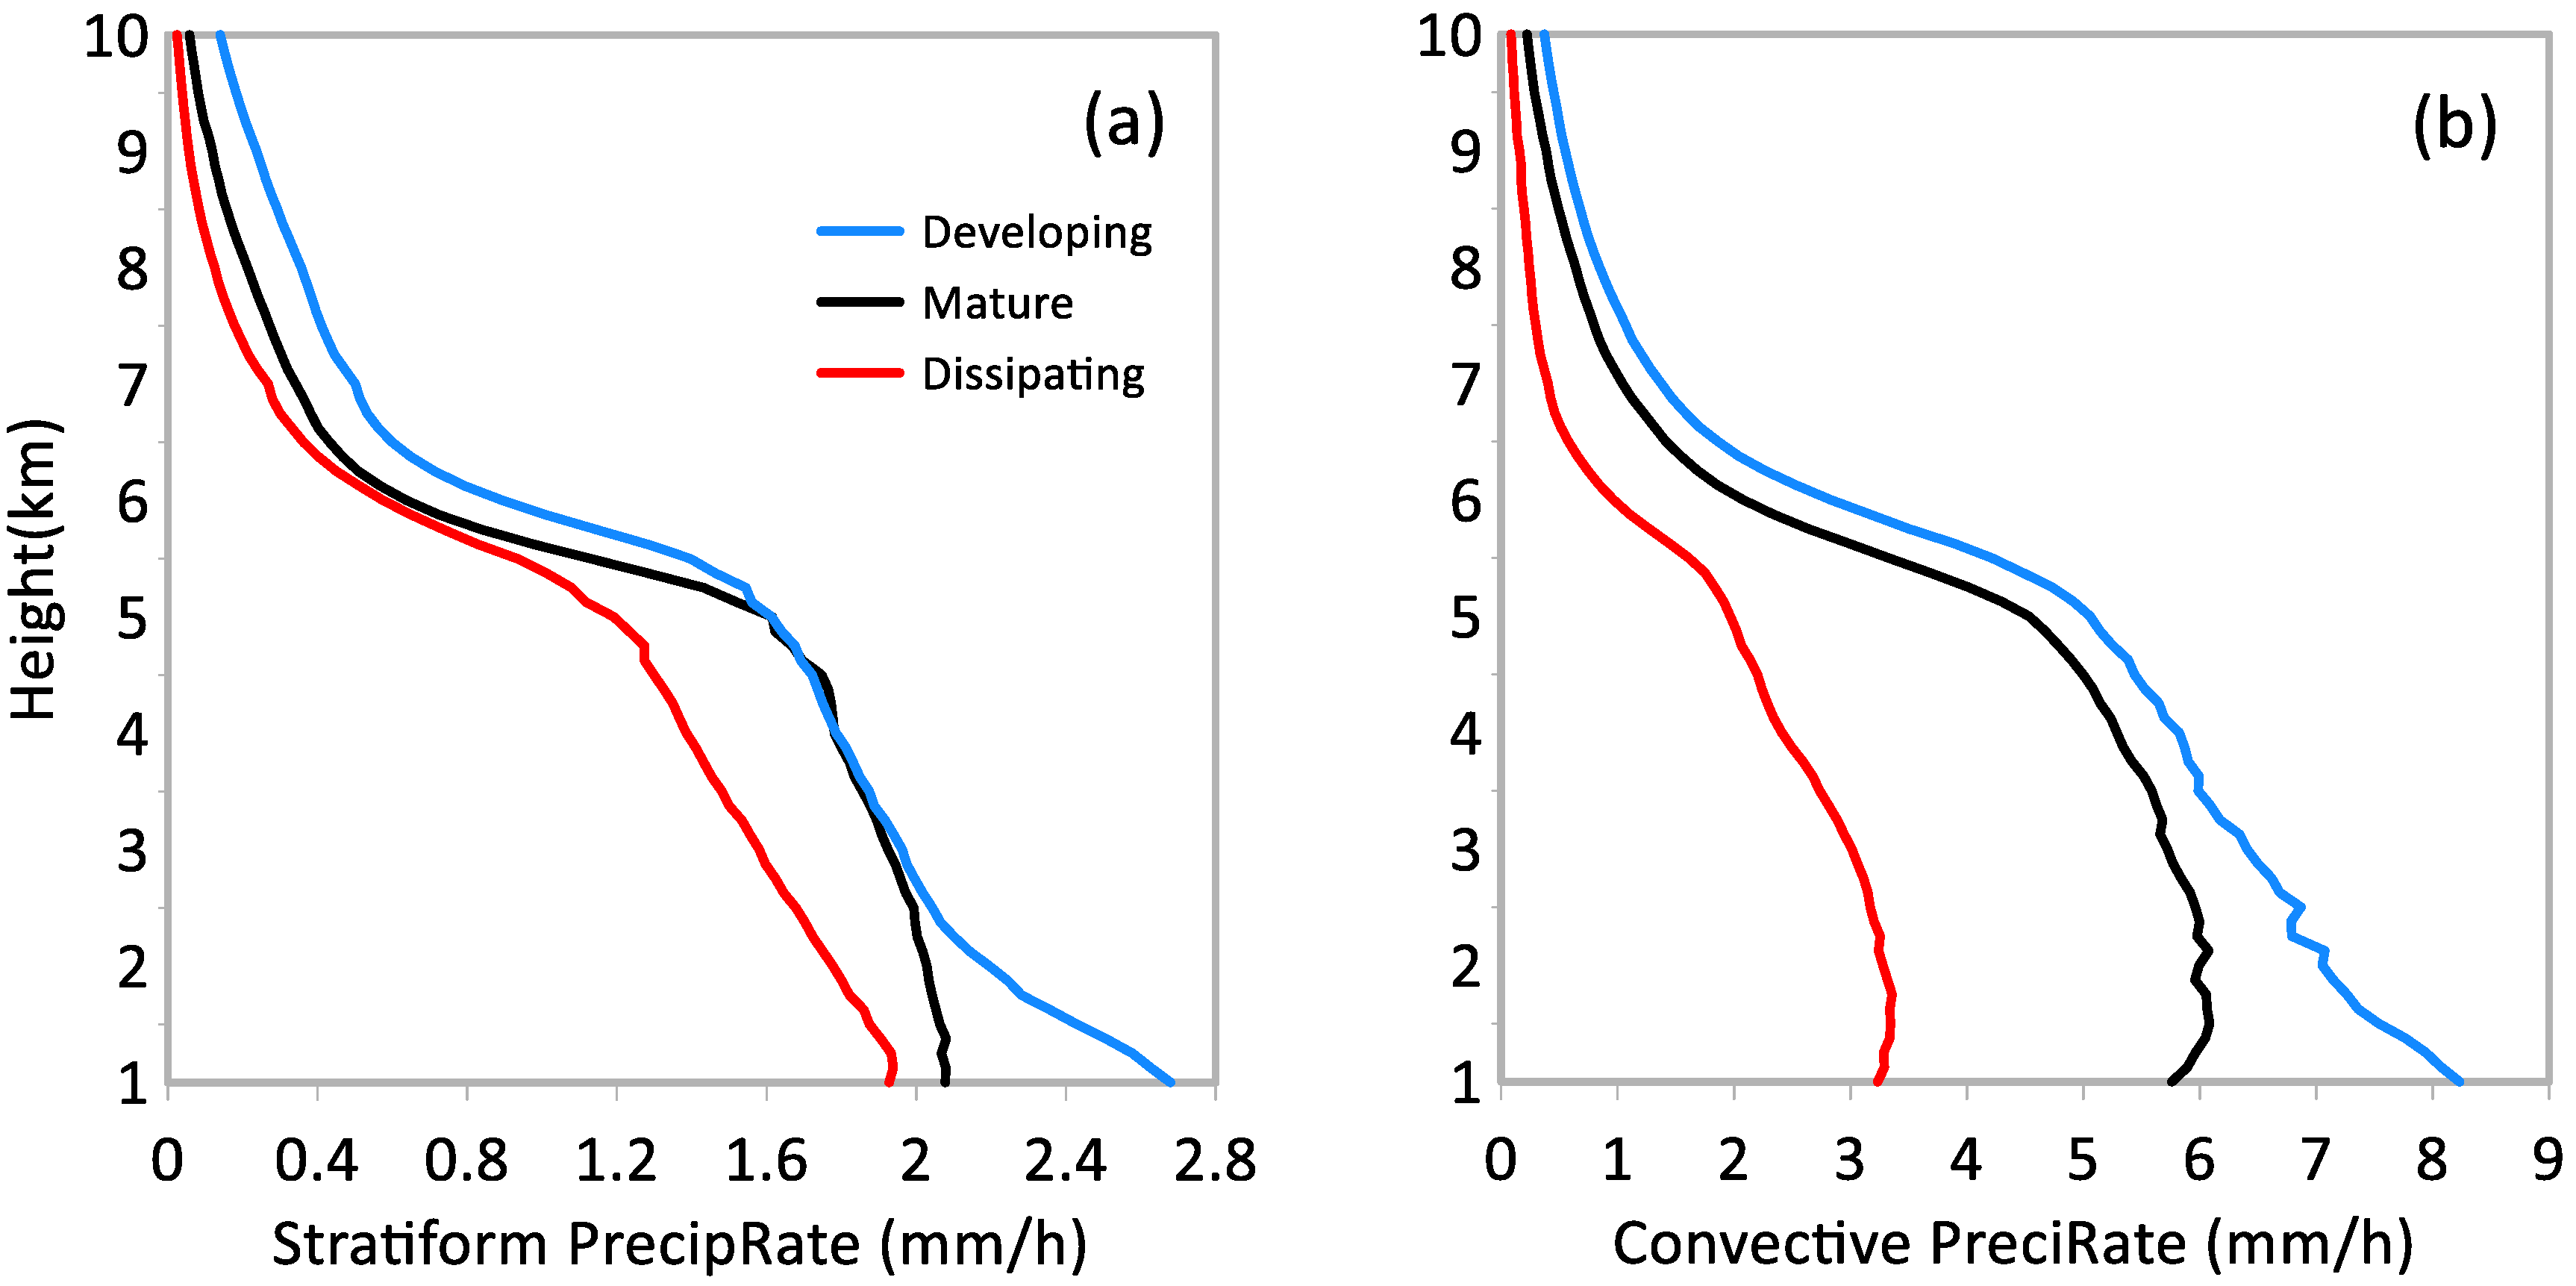
  • The life stage has a more significant impact on the DSD parameters of CP, and the effect of Dm is more important than the effect of dBNw. The Dm of raindrop particles at each height level is largest in the developing and mature stages, and the difference between these is small. The largest Dm leads to the highest precipitation rate in the developing period, while the Dm in the dissipating stage is smaller, so the precipitation rate is also the lowest. The profile of DSD parameters shows that in the two types of cloud precipitation, the developing stage is composed of large and sparse precipitation particles, the mature stage is composed of large and dense precipitation particles, and the dissipating stage is generally composed of small and sparse precipitation particles.
It is worth noting, however, that the height and slope of the profile below the bright band vary by region [52] and season [34], and can significantly impact quantitative precipitation estimates. In this study, some conclusions are different from the typical summer precipitation characteristics in other regions, reflecting the uniqueness of the Southwest Vortex precipitation process in the Sichuan Basin under complex terrain. However, it should be noted that this study is only based on the three-year observation data of GPM-DPR, so the results are not necessarily conclusive, and more observations are needed to verify them in the future. In addition, there is still some uncertainty regarding the DSD parameters that have not been fully matched in space and time with airborne measurement equipment, or other reliable inversion verification that can be used as a reference. In the future, with further development of retrieval and processing of dual-wavelength radar measurement technology [24], the improvement of the DPR identification algorithm will help us to understand the relationship between precipitation stages and precipitation characteristics more comprehensively.

Author Contributions

Conceptualization, H.W., L.T., F.Z. and J.Z.; methodology, H.W., L.T. and Y.L.; software, H.W., L.T. and Y.Y.; formal analysis, H.W., L.T. and X.R.; writing—original draft preparation, L.T.; writing—review and editing, H.W., L.T. and Q.Z.; visualization, H.W., L.T. and J.X. All authors have read and agreed to the published version of the manuscript.

Funding

This work was supported by a Project of the Sichuan Department of Science and Technology (2022YFS0541), the Key Laboratory of Atmospheric Sounding Program of China Meteorological Administration (2021KLAS02M), the National Key R&D Program of China (2018YFC1506104), Special Funds for the Central Government to Guide Local Technological Development (2020ZYD051), and Application Basic Research of Sichuan Department of Science and Technology (2019YJ0316).

Data Availability Statement

Publicly available datasets were analyzed in this study. This data can be found here:(1) The satellite data used in this study were product 2A.DPR_NS of the GPM version 06 dual-frequency joint inversion at https://disc.gsfc.nasa.gov/datasets/GPM_2ADPR_06/summary, accessed on 11 October 2021. (2) Bright temperature products provided by Fengyun-2G at http://satellite.nsmc.org.cn/PortalSite/Data/Satellite.aspx, accessed on 5 January 2022.

Acknowledgments

The authors would like to express their sincere thanks to Sichuan Province Meteorological Observatory for supplying the data used in this manuscript and the reviewers for their constructive comments and editorial suggestions that helped improve the quality of the manuscript considerably.

Conflicts of Interest

The authors declare no conflict of interest.

References

  1. Chen, H.; Sun, L.; Cifelli, R.; Xie, P. Deep learning for bias correction of satellite retrievals of orographic precipitation. IEEE Trans. Geosci. Remote Sens. 2022, 60, 4104611. [Google Scholar] [CrossRef]
  2. Lin, W.; Wen, C.; Wen, Z.; Gang, H. Drought in Southwest China: A review. Atmos. Ocean. Sci. Lett. 2015, 8, 339–344. [Google Scholar]
  3. Wang, H.; Wei, M.; Li, G.; Zhou, S.; Zeng, Q. Analysis of precipitable water vapor from GPS measurements in Chengdu region: Distribution and evolution characteristics in autumn. Adv. Space Res. 2013, 52, 656–667. [Google Scholar] [CrossRef]
  4. Fu, S.; Sun, J.; Zhao, S.; Li, W. The energy budget of a southwest vortex with heavy rainfall over South China. Adv. Atmos. Sci. 2011, 28, 709–724. [Google Scholar] [CrossRef]
  5. Tang, H.; Fu, S.; Sun, J.; Mai, Z.; Jin, S.; Zhang, Y. Investigation of severe precipitation event caused by an eastward-propagating MCS originating from the Tibetan Plateau and a downstream southwest vortex. Chin. J. Atmos. Sci. 2020, 44, 1275–1290. [Google Scholar]
  6. Xiang, S.; Li, Y.; Li, D.; Yang, S. An analysis of heavy precipitation caused by a retracing plateau vortex based on TRMM data. Meteorol. Atmos. Phys. 2013, 122, 33–45. [Google Scholar] [CrossRef]
  7. Yu, S.; Gao, W.; Xiao, D.; Peng, J. Observational facts regarding the joint activities of the southwest vortex and plateau vortex after its departure from the Tibetan Plateau. Adv. Atmos. Sci. 2016, 33, 34–46. [Google Scholar] [CrossRef]
  8. Chen, Y.; Li, Y.; Zhao, T. Cause analysis on eastward movement of Southwest China vortex and its induced heavy rainfall in South China. Adv. Meteorol. 2015, 2015, 481735. [Google Scholar] [CrossRef]
  9. Fu, S.; Zhang, J.; Sun, J.; Shen, X. A fourteen-year climatology of the southwest vortex in summer. Atmos. Ocean. Sci. Lett. 2014, 7, 510–514. [Google Scholar]
  10. Xiang, S.; Li, Y.; Zhai, S.; Peng, J. Comparative analysis of precipitation structures in two Southwest China Vortex events over eastern Sichuan Basin by TRMM. J. Atmos. Sol. Terr. Phys. 2021, 221, 105691. [Google Scholar] [CrossRef]
  11. Chen, Y.; Li, Y. A thermodynamic condition affecting the movement of a southwest China vortex case. Meteorol. Atmos. Phys. 2022, 134, 36. [Google Scholar] [CrossRef]
  12. Gao, D.; Li, Y.; Cheng, X. A numerical study on an extreme rainstorm caused by an abnormal-path coupling vortex with the assimilation of southwest China vortex scientific experiment data. In Proceedings of the AGU Fall Meeting Abstracts, San Francisco, CA, USA, 9–13 December 2019; p. A13R-3092. [Google Scholar]
  13. Kuo, Y.H.; Cheng, L.; Bao, J.W. Numerical simulation of the 1981 Sichuan flood. Part I: Evolution of a mesoscale southwest vortex. Mon. Weather Rev. 1988, 116, 2481–2504. [Google Scholar] [CrossRef]
  14. Li, L.; Zhang, R.; Wen, M. Diagnostic analysis of the evolution mechanism for a vortex over the Tibetan Plateau in June 2008. Adv. Atmos. Sci. 2011, 28, 797–808. [Google Scholar] [CrossRef]
  15. Ma, H.; Ma, X.; Jing, Y.; Wu, G. A Study on the mechanisms accounting for the generation of a southwest vortex that caused a series of severe disasters during the 2020 abnormal Meiyu Season. Atmosphere 2021, 12, 556. [Google Scholar] [CrossRef]
  16. Wang, H.; Wang, L.; He, J.; Ge, F.; Chen, Q.; Tang, S.; Yao, S. Can the GPM IMERG hourly products replicate the variation in precipitation during the wet season over the Sichuan Basin, China? Earth Space Sci. 2020, 7, e2020EA001090. [Google Scholar] [CrossRef]
  17. Wang, H.; Chandrasekar, V.; He, J.; Shi, Z.; Wang, L. Characteristic analysis of the downburst in Greely, Colorado on 30 July 2017 using WPEA method and X-band radar observations. Atmosphere 2018, 9, 348. [Google Scholar] [CrossRef]
  18. Wang, L.; Li, Y.; Xu, X. Characteristic Analysis of dual-polarization weather radar echoes of convective precipitation and snowfall in the Mount Everest Region. Atmosphere 2021, 12, 1671. [Google Scholar] [CrossRef]
  19. Gao, J.; Tang, G.; Hong, Y. Similarities and improvements of GPM dual-frequency precipitation radar (DPR) upon TRMM precipitation radar (PR) in global precipitation rate estimation, type classification and vertical profiling. Remote Sens. 2017, 9, 1142. [Google Scholar] [CrossRef]
  20. Kotsuki, S.; Terasaki, K.; Miyoshi, T. GPM/DPR precipitation compared with a 3.5-km-resolution NICAM simulation. Sola 2014, 10, 204–209. [Google Scholar] [CrossRef]
  21. Lu, M.; Wei, M. GPM Data application in analysis of vertical structure of typhoon ‘Mujigae’ precipitation. Remote Sens. Technol. Appl. 2017, 32, 904–912. [Google Scholar]
  22. Biswas, S.K.; Chandrasekar, V. Cross-validation of observations between the GPM dual-frequency precipitation radar and ground based dual-polarization radars. Remote Sens. 2018, 10, 1773. [Google Scholar] [CrossRef]
  23. Ryu, J.; Song, H.J.; Sohn, B.J.; Liu, C. Global distribution of three types of drop size distribution representing heavy rainfall from GPM/DPR measurements. Geophys. Res. Lett. 2021, 48, e2020GL090871. [Google Scholar] [CrossRef]
  24. Sun, Y.; Dong, X.; Cui, W.; Zhou, Z.; Fu, Z.; Zhou, L.; Deng, Y.; Cui, C. Vertical structures of typical Meiyu precipitation events retrieved from GPM-DPR. J. Geophys. Res. Atmos. 2020, 125, e2019JD031466. [Google Scholar] [CrossRef]
  25. Zhang, Y.; Wu, Z.; Zhang, L.; Xie, Y.; Huang, Y.; Zheng, H. Preliminary study of land–sea microphysics associated with the east asian summer monsoon rainband and its application to GPM DPR. J. Atmos. Ocean. Technol. 2020, 37, 1231–1249. [Google Scholar] [CrossRef]
  26. Kobayashi, K.; Shige, S.; Yamamoto, M.K. Vertical gradient of stratiform radar reflectivity below the bright band from the Tropics to the extratropical latitudes seen by GPM. Q. J. R. Meteorol. Soc. 2018, 144, 165–175. [Google Scholar] [CrossRef]
  27. Mu, D.; Li, Y. Statistical characteristics summary of the Southwest China Vortex. J. Arid Meteorol. 2017, 35, 175. (In Chinese) [Google Scholar]
  28. Li, H.; Moisseev, D. Melting layer attenuation at Ka-and W-bands as derived from multifrequency radar Doppler spectra observations. J. Geophys. Res. Atmos. 2019, 124, 9520–9533. [Google Scholar] [CrossRef]
  29. Le, M.; Chandrasekar, V. Precipitation type classification method for dual-frequency precipitation radar (DPR) onboard the GPM. IEEE Trans. Geosci. Remote Sens. 2012, 51, 1784–1790. [Google Scholar] [CrossRef]
  30. Awaka, J.; Le, M.; Chandrasekar, V.; Yoshida, N.; Higashiuwatoko, T.; Kubota, T.; Iguchi, T. Rain type classification algorithm module for GPM dual-frequency precipitation radar. J. Atmos. Ocean. Technol. 2016, 33, 1887–1898. [Google Scholar] [CrossRef]
  31. Yang, Y.; Chen, X.; Qi, Y. Classification of convective/stratiform echoes in radar reflectivity observations using a fuzzy logic algorithm. J. Geophys. Res. Atmos. 2013, 118, 1896–1905. [Google Scholar] [CrossRef]
  32. Fu, Y.; Cao, A.; Li, T.; Feng, S.; Zheng, Y.; Liu, Y.; Zhang, A. Climatic characteristics of the storm top altitude for the convective and stratiform precipitation in summer Asia based on measurements of the TRMM precipitation radar. Acta Meteor. Sinica 2012, 70, 436–451. [Google Scholar]
  33. Fabry, F.; Zawadzki, I. Long-term radar observations of the melting layer of precipitation and their interpretation. J. Atmos. Sci. 1995, 52, 838–851. [Google Scholar] [CrossRef]
  34. Cao, Q.; Qi, Y. The variability of vertical structure of precipitation in Huaihe River Basin of China: Implications from long-term spaceborne observations with TRMM precipitation radar. Water Resour. Res. 2014, 50, 3690–3705. [Google Scholar] [CrossRef]
  35. Byers, H.R.; Braham, R.R. The Thunderstorm: Report of the Thunderstorm Project; US Government Printing Office: Washington, DC, USA, 1949. [Google Scholar]
  36. Robert, A. Cloud clusters and large-scale vertical motions in the tropics. J. Meteorol. Soc. Jpn. 1982, 60, 396–410. [Google Scholar]
  37. Machado, L.; Rossow, W.; Guedes, R.; Walker, A. Life cycle variations of mesoscale convective systems over the Americas. Mon. Weather Rev. 1998, 126, 1630–1654. [Google Scholar] [CrossRef]
  38. Yin, J.; Wang, D.; Zhai, G.; Zhien, W. A study of cloud vertical profiles from the CloudSat data over the East Asian Continent. Acta Meteor. Sinica 2013, 71, 121–133. [Google Scholar]
  39. Fu, Y.; Lin, Y.; Guo, S.; Wang, Q. Seasonal characteristics of precipitation in 1998 over East Asia as derived from TRMM PR. Adv. Atmos. Sci. 2003, 20, 511–529. [Google Scholar]
  40. Watters, D.; Battaglia, A.; Mroz, K.; Tridon, F. Validation of the GPM version-5 surface rainfall products over Great Britain and Ireland. J. Hydrometeorol. 2018, 19, 1617–1636. [Google Scholar] [CrossRef]
  41. Johnson, R.H.; Rickenbach, T.M.; Rutledge, S.A.; Ciesielski, P.E.; Schubert, W.H. Trimodal characteristics of tropical convection. J. Clim. 1999, 12, 2397–2418. [Google Scholar] [CrossRef]
  42. Seo, E.K. Characteristics of summer rainfall over East Asia as observed by TRMM PR. J. Korean Earth Sci. Soc. 2011, 32, 33–45. [Google Scholar] [CrossRef]
  43. Zhang, J.; Qi, Y. A real-time algorithm for the correction of brightband effects in radar-derived QPE. J. Hydrometeorol. 2010, 11, 1157–1171. [Google Scholar] [CrossRef]
  44. Zhou, L.; Xu, G.; Xiao, Y.; Wan, R.; Wang, J.; Leng, L. Vertical structures of abrupt heavy rainfall events over Southwest China with complex topography detected by dual-frequency precipitation radar of GPM Satellite. Int. J. Climatol. 2022. [Google Scholar] [CrossRef]
  45. Zhang, A.; Fu, Y. The structural characteristics of precipitation cases detected by dual-frequency radar of GPM satellite. Chin. J. Atmos. Sci. 2018, 42, 33–51. [Google Scholar]
  46. Xiang, S.; Li, Y.; Lu, P. Based on TRMM satellite data, the three-dimensional structure characteristics of precipitation in Sichuan Basin are analyzed. Plateau Mt. Meteorol. Res. 2021, 41, 17–23. (In Chinese) [Google Scholar]
  47. Qi, Y.; Zhang, J. Correction of radar QPE errors associated with low and partially observed brightband layers. J. Hydrometeorol. 2013, 14, 1933–1943. [Google Scholar] [CrossRef]
  48. Zhang, A.; Fu, Y.; Chen, Y.; Liu, G.; Zhang, X. Impact of the surface wind flow on precipitation characteristics over the southern Himalayas: GPM observations. Atmo. Res. 2018, 202, 10–22. [Google Scholar] [CrossRef]
  49. Cao, Q.; Zhang, G.; Brandes, E.; Schuur, T.; Ryzhkov, A.; Ikeda, K. Analysis of video disdrometer and polarimetric radar data to characterize rain microphysics in Oklahoma. J. Appl. Meteorol. Climatol. 2008, 47, 2238–2255. [Google Scholar] [CrossRef]
  50. Tokay, A.; Short, D.A. Evidence from tropical raindrop spectra of the origin of rain from stratiform versus convective clouds. J. Appl. Meteorol. Climatol. 1996, 35, 355–371. [Google Scholar] [CrossRef]
  51. Ulbrich, C.W. Natural variations in the analytical form of the raindrop size distribution. J. Clim. Appl. Meteorol. 1983, 22, 1764–1775. [Google Scholar] [CrossRef]
  52. Geerts, B.; Dejene, T. Regional and diurnal variability of the vertical structure of precipitation systems in Africa based on spaceborne radar data. J. Clim. 2005, 18, 893–916. [Google Scholar] [CrossRef]
Figure 1. Location and altitude of the study area. The blue part is the Sichuan Basin.
Remotesensing 14 04063 g001
Figure 2. Flow chart of life stage classification method.
Remotesensing 14 04063 g002
Figure 3. Example of identification of precipitation systems. The example time is 12:14 on 30 August 2020. (a) Rainfall pixel and rainfall type, (b) distribution of maximum reflectivity, and (c) cloud top height as measured by Global Precipitation Mission Dual-Frequency Precipitation Radar (GPM-DPR), (df) the bright temperatures (TBs) of Fengyun 2G (FY-2G) for 1 h before and after the approach to the precipitation system. The diagonal slash of each figure represents the scanning track of the Dual-Frequency Precipitation Radar (DPR). The cross-sections of each stage are shown as solid black lines.
Remotesensing 14 04063 g003
Figure 4. (a,e,i) represent the spatial distribution of the maximum reflectivity measured by GPM-DPR under three selected conditions during the occurrence and development of the Southwest Vortex, on 11 August 2020, 17:46, 30 August 2020, 12:14, and 30 August 2020, 21:29, respectively (bd,fh,jl). Corresponding TBs were observed for FY-2G for 1 h consecutively before and after the onset of precipitation during developing (upper), mature (middle), and dissipating (lower) stages. The diagonal slash of each figure represents the scanning track of the Dual-Frequency Precipitation Radar (DPR). The black solid line A-B is the line along the section in Figure 5.
Remotesensing 14 04063 g004
Figure 6. The Southwest Vortex precipitation system developed (left) (Case 1) at 17:46 on 11 August 2020, (middle) matured (Case 2) at 12:14 on 30 August 2020, and (right) dissipated (Case 3) at 21:29 on 30 August 2020. Normalized contoured frequency by altitude diagrams (NCFAD) of stratiform (ac) and convective (df) reflectivity in stages at 21:29 on 30 August 2020, for dissipation (Case 3). The curved and horizontal dotted lines represent the midline and melting layer (ML) heights, respectively.
Remotesensing 14 04063 g006
Figure 7. The radar reflectivity of three cases at 17:46 on 11 August 2020, 12:14 on 30 August 2020, and 21:29 on 30 August 2020 (Figure 6) of the stratiform (a) and convective (b) square-whisker plots of NCFAD at each altitude layer. The square center represents the 50% percentile value, the lower (25%) and upper (75%) quartiles are the left and right boundaries of the box, and the roots correspond to the 5% and 95% values.
Remotesensing 14 04063 g007
Figure 8. NCFAD of attenuation-corrected reflectivity data for 27 Southwest Vortex precipitation cases during 2019–2021 (summary in Table 2). Three life stages of (ac) SP and (df) CP in the Southwest Vortex precipitation system. The curved dotted lines represent the median line for the current stage, the curved dotted lines of different colors in each figure repeat the position of the median line in the other two stages, with the black lines representing the developing stage, the red lines representing the mature stage, and the purple lines representing the dissipating stage. The black horizontal dotted lines are the ML heights.
Remotesensing 14 04063 g008
Figure 9. The precipitation rate at different life stages of cloud obtained by GPM-DPR product in the flood season (May–September) of 2019–2021. Three life stages of (a) SP and (b) CP in the Southwest Vortex precipitation system.
Remotesensing 14 04063 g009
Figure 10. The overall average profile of the effective droplet radius (Dm) and the droplet concentration parameter (dBNw) of the cloud at different life stages were obtained from the GPM-DPR product during the flood season of 2019–2021. Three life stages of (a,b) SP and (c,d) CP in the Southwest Vortex precipitation system.
Remotesensing 14 04063 g010
Table 1. Occurrence time and influence system of Southwest Vortex.
UTCInfluence System
YearMonthDayHour500 hPa700 hPa850 hPaGround
201971911The low trough between two high pressuresSouthwest VortexLow vortexWeak cold air
201971921The low trough between two high pressuresSouthwest VortexLow vortexWeak cold air
20206267The low trough, with obvious air pressure dropShear line, Southwest VortexLow vortexCold air
202062916Low vortexSouthwest VortexLow vortexDiffusion of cold air
202081117Low trough, the air pressure in front of the trough decreasesSouthwest VortexLow vortexHot and low pressure at night, cold air intrusion during the day
202083012Low vortexSouthwest VortexLow vortexCold air intrusion
202083021Low vortexSouthwest VortexLow vortexCold air intrusion
20209519Low trough, the air pressure in front of the trough decreasesSouthwest VortexLow vortexWarm zone
202161523Westerly low troughShear line and Low VortexShear line and Low vortexCold air
20216168Westerly low troughShear line and Low vortexShear line and Low vortexCold air
202162820Northwest airflow in front of Tibetan high pressureSouthwest vortexLow vortexNo cold air effect
20217916Plateau low troughSouthwest Vortex, Southwest jetLow vortex, the jet streamNo cold air effect
202171415Plateau shear lineSouthwest Vortex, Southwest jetLow vortexHot and low pressure at night, cold air intrusion during the day
20217150Low vortexSouthwest VortexLow vortexCold air
202171514Low vortexSouthwest VortexLow vortexCold air
2021868Plateau shear lineShear lineLow vortexNo cold air effect
20218617Plateau shear lineShear lineLow vortexNo cold air effect
20218165The shear line between two high pressuresSouthwest VortexLow vortexNo cold air effect
202181615The shear line between two high pressuresSouthwest VortexLow vortexNo cold air effect
20218174The shear line between two high pressuresSouthwest VortexLow vortexNo cold air effect
20218223Plateau low troughSouthwest Vortex, Southwest jetLow vortex, the jet streamCold air during the day
202182212Plateau low troughSouthwest Vortex, Southwest jetLow vortex, the jet streamNo cold air effect
2021940Westerly low troughSouthwest Vortex, Southwest jetLow vortexCold air
2021949Westerly low troughSouthwest Vortex, Southwest jetLow vortexCold air
20219423Westerly low trough, edge of line 588Southwest Vortex, Southwest jetLow vortexCold air
2021958Westerly low trough, edge of line 588Southwest Vortex, Southwest jetLow vortexCold air
20219156Westerly low trough, edge of line 588Southwest Vortex, Southwest jetLow vortexNo cold air effect
Table 2. The total number of samples, the number of SP and CP samples, the percentage of SP and CP samples relative to the total sample, their contribution to the total rainfall during the period 2019–2021 contribution, and the average near-surface rainfall rate.
DevelopingMatureDissipating
Number of precipitation systems9108
Total pixel samples15,00014,7739911
Stratiform pixel samples (SP, %)11,367 (75.8%)11,258 (76.2%)8093 (81.7%)
Convective pixel samples (CP, %)2635 (17.6%)2456 (16.6%)1313 (13.2%)
Contribution of SP (%)55.7%59.5%74.2%
Contribution of CP (%)44.3%40.4%25.7%
Average precipitation rate of SP (mm/h)1.94301.94801.4887
Average precipitation rate of CP (mm/h)6.66956.08073.1793
Upper 5.0% CP samples (>50 mm/h)38360
Publisher’s Note: MDPI stays neutral with regard to jurisdictional claims in published maps and institutional affiliations.

