Abstract
The East Australian Current (EAC) is a highly dynamic western boundary current of the South Pacific Gyre. The EAC frequently encroaches shoreward, drives upwelling, changes coastal bio-physical dynamics, and thus exerts significant impacts on coastal marine ecosystems. In this study, with high frequency (HF) radar and mooring data, for the first time accurate daily mapping and tracking of a rapid EAC intrusion event was conducted and the impacts of the EAC intrusion on the shelf water off Coffs Harbor were monitored. The results show that, during the event, the EAC was highly dynamic with a mean daily onshore/offshore movement of ~5 km/day. In addition, we found that the bottom ocean temperature and the surface current speed on the shelf varied linearly with the EAC-to-coast distance. This study thus demonstrates the value of HF remotely sensed data for the ongoing quantitative monitoring of the highly dynamic EAC fluctuations.
1. Introduction
The East Australian Current (EAC) is a highly unstable eddy-current system which intrudes shoreward with multiple frequencies and amplitudes [1,2,3]. Using Himawari-8 SST data, Xie et al. [1] provided a new dataset (with a 6-day temporal resolution) documenting the spatial and temporal variability of the EAC encroachment (upstream (30–32°S): EAC-to-coast distance 37.43 ± 13.24 km, with fluctuation every 60–80 days; downstream (33–35°S): 47.87 ± 28.70 km, with fluctuation every 90–100 days). However, as also shown in [1], except for the dominant frequencies, there are some abrupt fluctuations in the time series of the EAC encroachment from 2015 to 2017. These abrupt fluctuations indicate rapid and significant EAC intrusion events that reflect the nature of the highly dynamic EAC oscillation. Such rapid displacement of the EAC could be caused either separately or jointly by the EAC’s intrinsic meandering (every 10–50 days at ~27°S [4]; every 20–45 days between 30–31°S [5]), the EAC’s frontal eddies (irregularly induced every ~7 days [6,7]), and abrupt EAC separation with eddy shedding (within 6 days [1]). The dynamic nature of this eddy–current system indeed increases the difficulty of accurate mapping and monitoring of the EAC’s shoreward intrusions. To our knowledge, the most recent EAC mapping was conducted on a 6-day basis by Xie et al. [1]. However, tracking the rapid development of an abrupt EAC intrusion event requires observations of higher temporal resolution.
High frequency (HF) radar observation provides an opportunity for tracking rapid EAC intrusion events. In 2012, the Australian Integrated Marine Observing System (IMOS) deployed two phased-array WERA HF radars near Coffs Harbor in New South Wales (NSW) at 30–31°S to provide real-time monitoring of the surface current velocity fields near the coast. With unprecedented spatial (1.5 km) and temporal (every 10 min) resolutions and a maximum range of ~100 km offshore, the HF radar observation has enabled a detailed analysis of the structure and spatio-temporal variability of the EAC jet and the EAC’s frontal eddies and sub-mesoscale eddies off Coffs Harbor (NSW), providing new insights into these highly dynamic EAC systems [5,6,7,8]. However, to our knowledge, no study has been conducted to provide quantitative mapping and accurate tracking of any rapid EAC intrusion event using the HF radar data. Filling this research gap can contribute to the monitoring of the EAC intrusion, the understanding of coastal ocean dynamics (e.g., EAC-driven upwelling), and the management of coastal marine ecosystems off the eastern Australia.
The EAC intrusion has a significant impact on bottom ocean temperature and surface current velocity on the continental shelf [5,9,10]. This study aimed to conduct accurate mapping and tracking of a rapid EAC intrusion event off Coffs Harbor using the HF radar data. The TPI (Topographic Position Index) based quantitative mapping method recently developed by Xie et al. [1] was used here for the mapping of the EAC’s speed signatures using HF radar data. Together with the in situ ocean temperature and current velocity data from an adjacent mooring on the continental shelf, we were able to monitor the impacts of the rapid EAC intrusion on the shelf water.
2. Data and Methods
The HF ocean radar site off Coffs Harbor is located between 30–31°S, near the point where the EAC frequently separates from (and also intrudes towards) the coast (see Figure 1). The radar is a WERA (beam-forming technology) phased-array system with 16-element, operating at a bandwidth of 100 KHz, a frequency of 13.920 MHz, and a maximum range of ~100 km. Within the coverage area of the radar system, surface current speeds are measured at a high frequency every 10 min, with a spatial resolution of 1.5 km. Note that, in this mapping study, an Esri suite of products (e.g., ArcGIS and ArcMap) were used for the mapping and spatial analyses. For the study area, the reference coordinate system World Geodetic System (WGS84) and the projection coordinate system UTM (Universal Transverse Mercator) zone 56S were used.
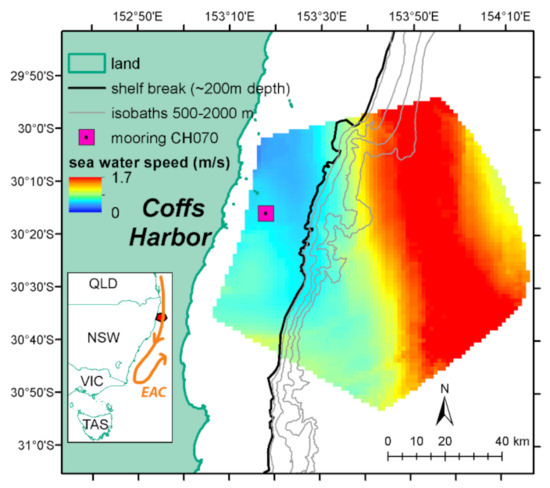
Figure 1.
The bottom left panel depicts the radar coverage (in red) off the north NSW coast. The main figure shows the study area off Coffs Harbor, NSW, Australia, with HF radar observing area and the location of Mooring CH070 on the continental shelf (13 km off the coast). Daily averaged surface current speed for 11 January 2016 is shown by color scale.
According to [1], there was an abrupt and significant EAC intrusion event occurring off Coffs Harbor around mid-January 2016. To investigate this rapid EAC intrusion event, hourly HF radar surface current velocity (u and v, vector components) data for the period between the 11and 22 January 2016 were obtained from the Australian Ocean Data Network (AODN) Portal (https://portal.aodn.org.au/, accessed on 15 October 2020). The following procedures were then applied to perform quantitative mapping of the EAC as in [1]:
- (1)
- Hourly surface current speed was calculated using the equation: .
- (2)
- Daily averaged surface current speed fields were obtained from the hourly data. This helped reduce data gaps and improved the subsequent EAC mapping, considering that we did not expect significant changes of the EAC’s position in such a short time scale.
- (3)
- TPI was calculated from each daily surface current speed field.
- (4)
- Threshold classification of TPI (θ = mean + 0.5 std) was conducted to extract the EAC’s surface speed signatures.
- (5)
- Following vectorization of the EAC’s speed signatures, EAC polygons were produced and the daily EAC-to-coast distance (km) was calculated. To measure the EAC-to-coast distance, meridional sections at 1/6 degree intervals were drawn on the map, then the lengths of the sections located between the coastline and the inshore edge of the EAC were averaged to obtain the distance. One can refer to [1,2] for the detailed illustration of the calculation of the EAC-to-coast distance.
To track changes of the coastal water characteristics on the continental shelf as the EAC rapidly intruded, time series of bottom ocean temperature (~60 m of water depth) and surface current speed (0–15 m of water depth) during the EAC intrusion event (11–22 January 2016) were extracted from the mooring measurements of CH070 off Coffs Harbor (see Figure 1). The measurements were taken with a range of conductivity–temperature–depth (CTD) instruments, temperature loggers, acoustic Doppler current profilers (ADCPs), and single-point current meters. Based on the quality-control method applied by the Australian National Mooring Network, only measurements with a ‘good-quality’ flag were used to calculate the daily mean of bottom ocean temperature and surface current speed. Linear regression analyses were then conducted to model the relationship (fitted using the least squares approach) between the EAC-to-coast distance and the shelf water response in terms of temperature and speed.
Area-averaged SST anomalies were also plotted during the EAC intrusion event to provide additional information on the effect of the EAC encropchment. The SST anomalies were calculated aganist the median SST climatology over a period from 1981 to 2016 using the 0.05° resolution SST Climate Change Initiative (CCI) L4 analysis version 2.1 product [11].
3. Results
The daily averaged surface current speed of the study area from 11–22 January 2016 is shown in Figure 2. The EAC is clearly shown as a prominent oceanographic feature with a higher current speed (>1 m/s) than its surrounding waters. The corresponding TPI surfaces of the daily surface current speed and the maps of the EAC’s speed signatures are shown in Figure 3 and Figure 4, respectively. Overall, the EAC exhibited rapid shoreward intrusion, often with a considerable movement occurring at a daily interval during the event.
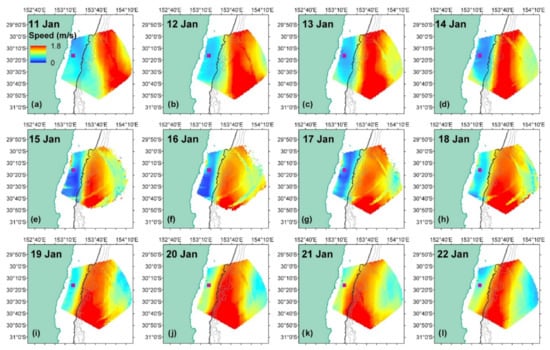
Figure 2.
Daily averaged surface current speed from 11–22 January 2016 (a–l) observed by HF radar. The line and point symbols are as in Figure 1. The black line denotes the shelf break.
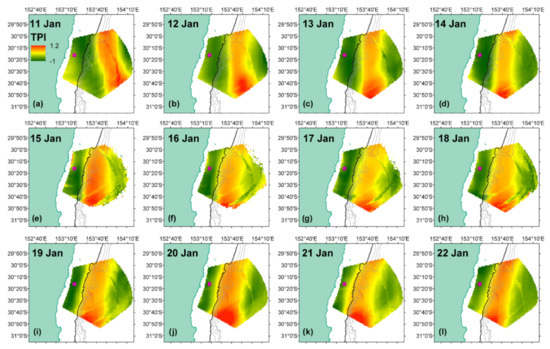
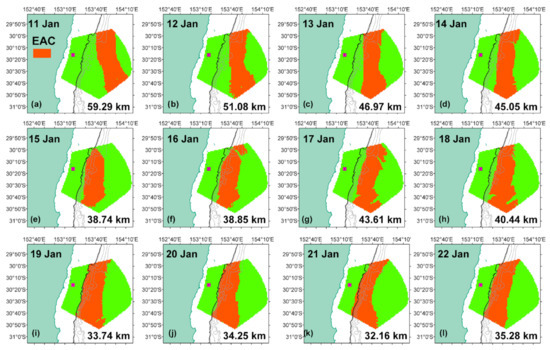
Figure 4.
EAC’s speed signature maps and the corresponding EAC-to-coast distance (km) from 11–22 January 2016 (a–l). The line and point symbols are as in Figure 1. The black line denotes the shelf break.
The EAC’s speed signature maps have enabled direct measurement of the EAC-to-coast distance during the event (Figure 4 and Figure 5a). On 11 January 2016, the EAC was at a relatively large distance (59.3 km) from the coast. From the 11th to 15th, the EAC moved swiftly towards the coast with a daily advance of ~5 km, being ~39 km off the coast on the 15th and the 16th. On the 17th, the EAC slightly retreated offshore (~4 km; distance to coast: 43.6 km). After that we observed another abrupt and significant intrusion towards the coast during the next two days until the 19th when the EAC was firmly aganist the shelf break, with the distance reduced to 33.7 km. From the 19th to the 22nd, the EAC remained very close to the shore and the minimum EAC-to-coast distance (32.2 km) during this event was observed on 21 January (Figure 4k and Figure 5a). Note that on the 21st, the EAC was ~15 km from the CH070 mooring (Figure 4k).
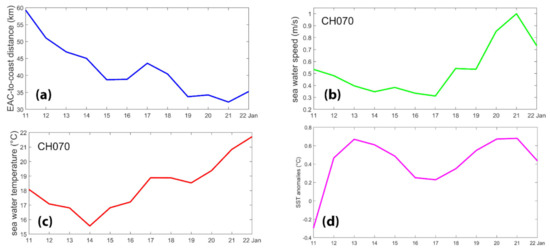
Figure 5.
Time series of (a) EAC-to-coast distance, (b) surface current speed at CH070, (c) bottom ocean temperature at CH070, and (d) SST anomalies (averaged within the radar observing area) during 11–22 January 2016.
Over the continental shelf, at the mooring location, the bottom ocean temperature and the surface current speed changed significantly during the EAC intrusion event (Figure 5b,c). After 14 January when the EAC-to-coast distance was less than 45 km (i.e., the shelf was within the EAC’s range of influence [5]), both the bottom ocean temperature and the surface current speed at CH070 mooring location varied linearly with the EAC’s distance to coast (Figure 5 and Figure 6). Specifically, the temperature varied from ~15 °C on the 14th to ~22 °C on the 22nd and the speed from ~0.3 m/s to ~1 m/s (Figure 5b,c). Correlation analyses (Figure 6) show that the temperature response to the EAC intrusion has a 2-day time lag (Figure 6c), with a coefficient of determination R2 of 0.93 (Pearson’s r = −0.96; Sample size N = 9; p < 0.01); while the speed (current velocity) responded to the EAC intrusion with no lag (R2 = 0.66; Pearson’s r = −0.81; N = 9; p < 0.01) during the event (Figure 6d). In addition, during the intrusion event, positive SST anomalies in the radar area were observed, as demonstrated in Figure 5d.
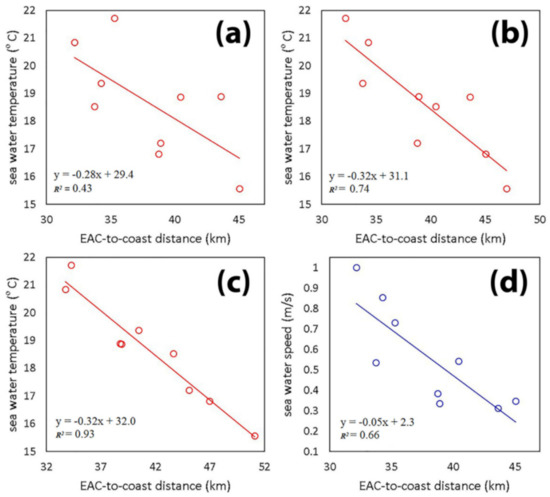
Figure 6.
Linear relationship between the EAC-to-coast distance and bottom ocean temperature (a) no lag, (b) 1-day lag, (c) 2-day lag, and (d) surface current speed (no lag). N = 9 (14–22 January).
4. Concluding Remarks
In this study, we used HF radar data and a TPI-based EAC mapping method [1,2] to provide accurate mapping and tracking of a rapid EAC shoreward intrusion event off Coffs Harbor from 11 to 22 January 2016. The HF radar measurement of the surface current velocity significantly improved the temporal resolution of our EAC mapping and consequently enabled accurate tracking of the EAC intrusion event on a daily basis. The mapping results indicate that during a rapid current intrusion event, the EAC could exhibit considerable onshore/offshore movement on a daily timescale. Importantly, this study suggests that using the combination of high-frequency and high-resolution HF radar remotely sensed data and the novel mapping technique developed by Xie et al. [1,2], we are able to provide ongoing quantitative monitoring of the highly dynamic EAC fluctuations. Consequently, this improved the understanding of high-frequency EAC onshore and offshore movements and their associated oceanographic characteristics such as water temperature and current speed and enhanced our knowledge of the dynamic EAC system, whose underlying driving forces still require further research [1,2,4,5,6,7].
In particular, the EAC intrusion exerts significant impacts on the coastal ocean temperature and surface current speed on the adjacent continental shelf. During the event, as the EAC-to-coast distance reduced from ~45 km (14 January 2016) to ~30 km (22 January 2016), the temperature increased linearly from ~15 °C to ~22 °C with a 2-day lag (R2 = 0.93) and the speed increased from ~0.3 m/s to ~1 m/s with no obvious lag (R2 = 0.66). These EAC driven environmental changes could have significant impacts on the coastal marine ecosystem. For example, the increase in water temperature could result in the increase of growth rates of juvenile commercial fish that reside typically in the upper 250 m ocean waters in the Tasman Sea [12]. On the other hand, on the continental slope where the depth is deeper, the water could be cooler, less saline, and more nutritious, caused by strong upwelling driven by frequent EAC intrusion [9,10]. As a result, these EAC-dominated water types contribute to the spatial distribution of larval and juvenile fish at a relatively fine scale [13]. In addition, the EAC-driven surface current velocity intensification changes the slope–shelf circulations [2,5,9,10] and hence the coastal nutrient dynamics, which ultimately would have wide-ranging and far-reaching ecological ramifications [14].
Author Contributions
Conceptualization, S.X., Y.H. and X.H.W.; methodology, S.X., Y.H. and Z.H.; software, S.X.; validation, S.X., Y.H., Z.H. and X.H.W.; formal analysis, S.X. and Y.H.; investigation, S.X., Y.H. and X.H.W.; resources, Z.H. and X.H.W.; data curation, S.X.; writing—original draft preparation, S.X.; writing—review and editing, Y.H., Z.H. and X.H.W.; visualization, S.X. and Y.H.; supervision, Z.H. and X.H.W.; project administration, S.X. All authors have read and agreed to the published version of the manuscript.
Funding
This research received no external funding.
Data Availability Statement
HF radar and mooring observation data were sourced from Australia’s Integrated Marine Observing System (IMOS); IMOS is enabled by the National Collaborative Research Infrastructure strategy (NCRIS). It is operated by a consortium of institutions as an unincorporated joint venture, with the University of Tasmania as lead agent. The data can be accessed through the Australian Ocean Data Network (AODN) Portal (https://portal.aodn.org.au/, accessed on 15 October 2020).
Acknowledgments
This is publication No. 98 of the Sino-Australian Research Consortium for Coastal Management (SARCCM). Senyang Xie is a previous PhD student at UNSW Canberra. Following graduation, Senyang, as a doctoral research associate was funded by the SARCCM for his research at UNSW Canberra. Portions of Senyang’s PhD thesis (https://doi.org/10.26190/unsworks/22517, accessed on 1 June 2021) are reused in this paper. The contribution from Zhi Huang is published with the permission of the CEO of Geoscience Australia..
Conflicts of Interest
The authors declare no conflict of interest.
References
- Xie, S.; Huang, Z.; Wang, X.H.; Leplastrier, A. Quantitative Mapping of the East Australian Current Encroachment Using Time Series Himawari-8 Sea Surface Temperature Data. J. Geophys. Res. Ocean. 2020, 125, e2019JC015647. [Google Scholar] [CrossRef]
- Xie, S.; Huang, Z.; Wang, X.H. Remotely Sensed Seasonal Shoreward Intrusion of the East Australian Current: Implications for Coastal Ocean Dynamics. Remote Sens. 2021, 13, 854. [Google Scholar] [CrossRef]
- Oke, P.R.; Roughan, M.; Cetina-Heredia, P.; Pilo, G.S.; Ridgway, K.R.; Rykova, T.; Archer, M.R.; Coleman, R.C.; Kerry, C.G.; Rocha, C.; et al. Revisiting the circulation of the East Australian Current: Its path, separation, and eddy field. Prog. Oceanogr. 2019, 176, 102139. [Google Scholar] [CrossRef]
- Sloyan, B.M.; Ridgway, K.R.; Cowley, R. The East Australian Current and property transport at 27 S from 2012 to 2013. J. Phys. Oceanogr. 2016, 46, 993–1008. [Google Scholar] [CrossRef]
- Archer, M.R.; Roughan, M.; Keating, S.R.; Schaeffer, A. On the variability of the East Australian Current: Jet structure, meandering, and influence on shelf circulation. J. Geophys. Res. Ocean. 2017, 122, 8464–8481. [Google Scholar] [CrossRef]
- Roughan, M.; Keating, S.R.; Schaeffer, A.; Cetina-Heredia, P.; Rocha, C.; Griffin, D.; Robertson, R.; Suthers, I.M. A tale of two eddies: The biophysical characteristics of two contrasting cyclonic eddies in the East Australian Current System. J. Geophys. Res. Ocean. 2017, 122, 2494–2518. [Google Scholar] [CrossRef]
- Schaeffer, A.; Gramoulle, A.; Roughan, M.; Mantovanelli, A. Characterizing frontal eddies along the East Australian Current from HF radar observations. J. Geophys. Res. Ocean. 2017, 122, 3964–3980. [Google Scholar] [CrossRef]
- Mantovanelli, A.; Keating, S.; Wyatt, L.R.; Roughan, M.; Schaeffer, A. Lagrangian and Eulerian characterization of two counter-rotating submesoscale eddies in a western boundary current. J. Geophys. Res. Ocean. 2017, 122, 4902–4921. [Google Scholar] [CrossRef]
- Roughan, M.; Middleton, J.H. On the East Australian Current: Variability, encroachment, and upwelling. J. Geophys. Res. Ocean. 2004, 109, C7. [Google Scholar] [CrossRef]
- Schaeffer, A.; Roughan, M.; Morris, B.D. Cross-shelf dynamics in a western boundary current regime: Implications for upwelling. J. Phys. Oceanogr. 2013, 43, 1042–1059. [Google Scholar] [CrossRef]
- Merchant, C.J.; Embury, O. Adjusting for Desert-Dust-Related Biases in a Climate Data Record of Sea Surface Temperature. Remote Sens. 2020, 12, 2554. [Google Scholar] [CrossRef]
- Thresher, R.E.; Koslow, J.A.; Morison, A.K.; Smith, D.C. Depth-mediated reversal of the effects of climate change on long-term growth rates of exploited marine fish. Proc. Natl. Acad. Sci. USA 2007, 104, 7461–7465. [Google Scholar] [CrossRef] [PubMed]
- Syahailatua, A.; Roughan, M.; Suthers, I.M. Characteristic ichthyoplankton taxa in the separation zone of the East Australian Current: Larval assemblages as tracers of coastal mixing. Deep. Sea Res. Part II Top. Stud. Oceanogr. 2011, 58, 678–690. [Google Scholar] [CrossRef]
- Suthers, I.M.; Young, J.W.; Baird, M.E.; Roughan, M.; Everett, J.D.; Brassington, G.B.; Byrnee, M.; Condie, S.A.; Hartog, J.R.; Hassler, C.S. The strengthening East Australian Current, its eddies and biological effects—An introduction and overview. Deep. Sea Res. Part II Top. Stud. Oceanogr. 2011, 58, 538–546. [Google Scholar] [CrossRef]
Publisher’s Note: MDPI stays neutral with regard to jurisdictional claims in published maps and institutional affiliations. |
© 2022 by the authors. Licensee MDPI, Basel, Switzerland. This article is an open access article distributed under the terms and conditions of the Creative Commons Attribution (CC BY) license (https://creativecommons.org/licenses/by/4.0/).