
An Artificial Neural Network for Lightning Prediction Based on Atmospheric Electric Field Observations


Abstract
:1. Introduction
2. Data and Methods
2.1. Data
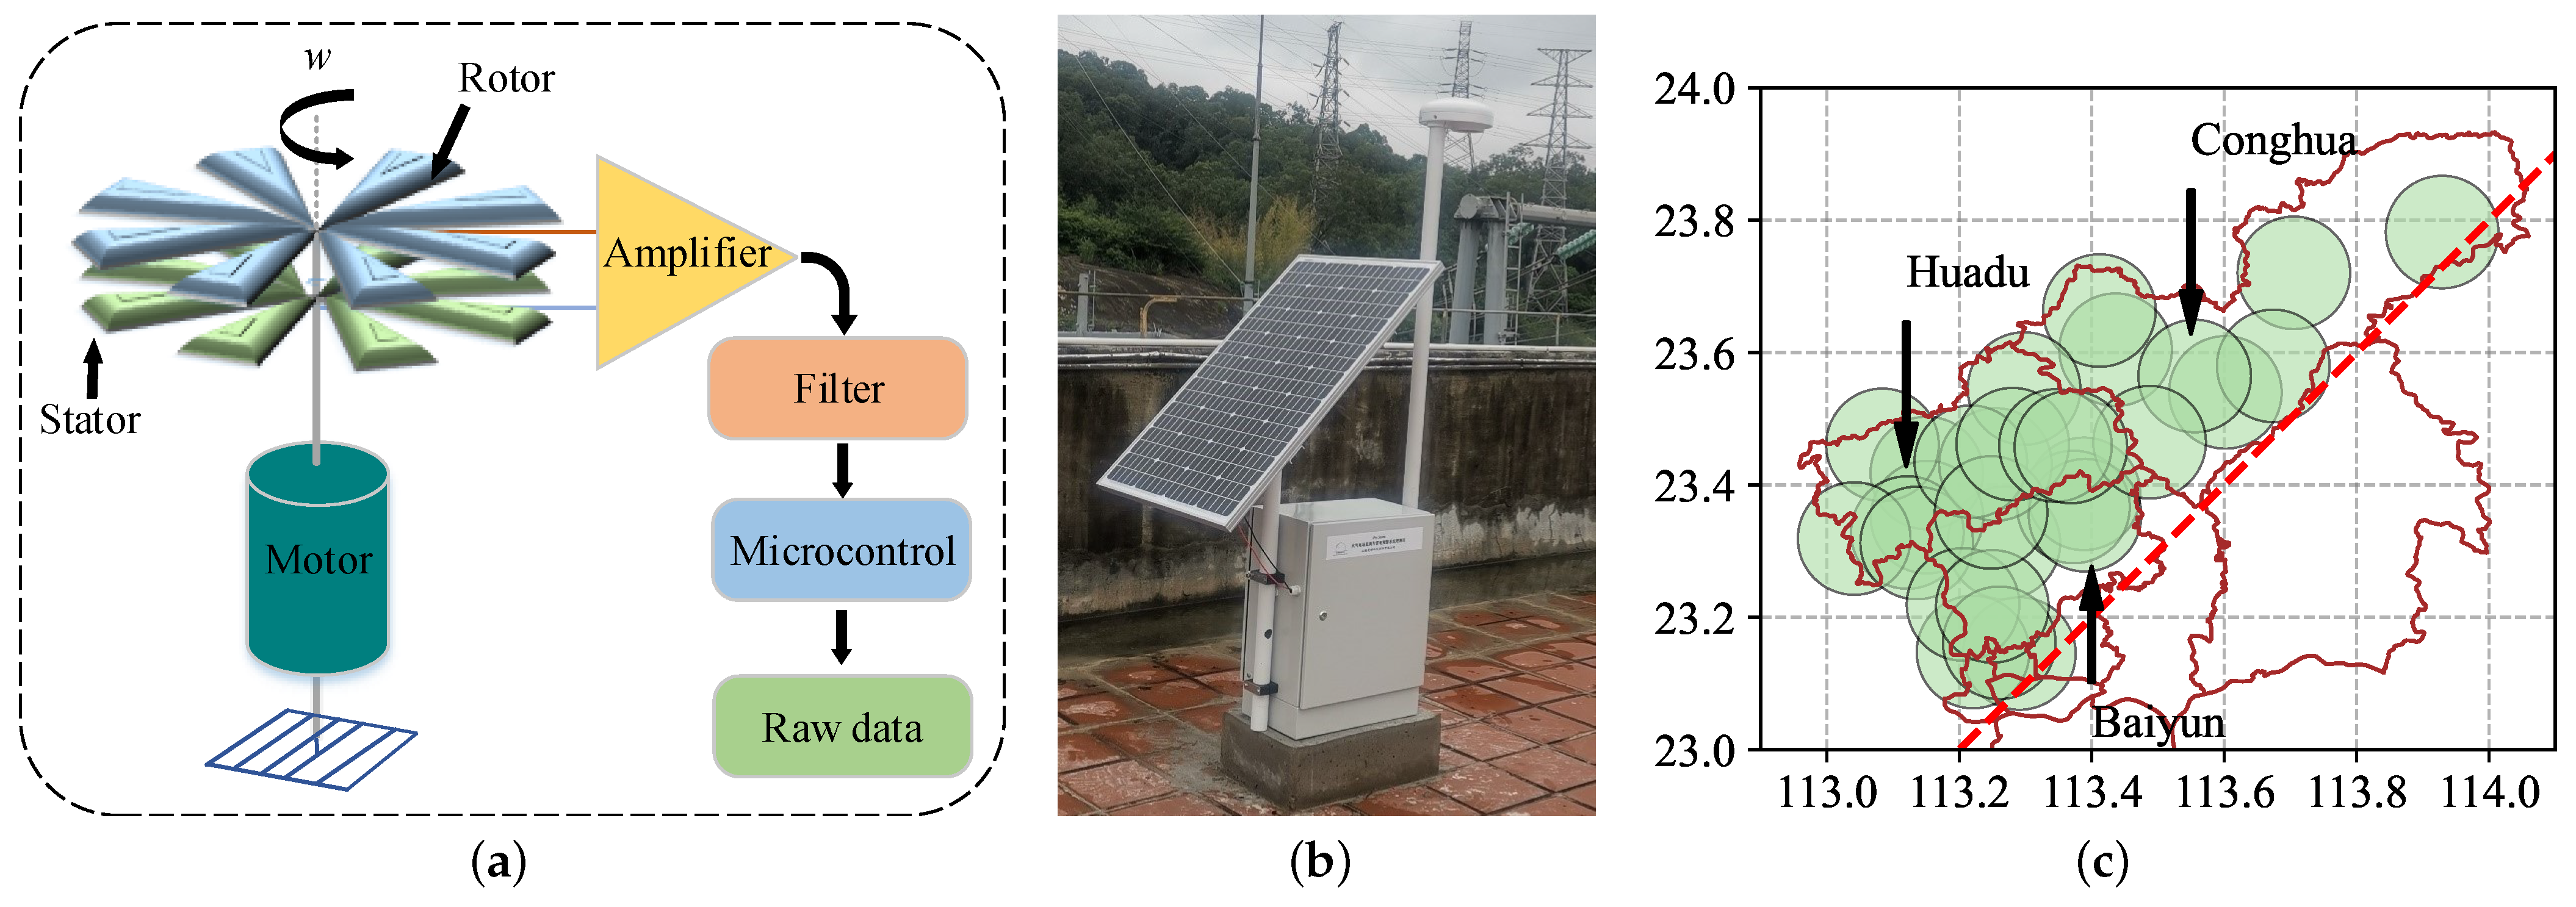
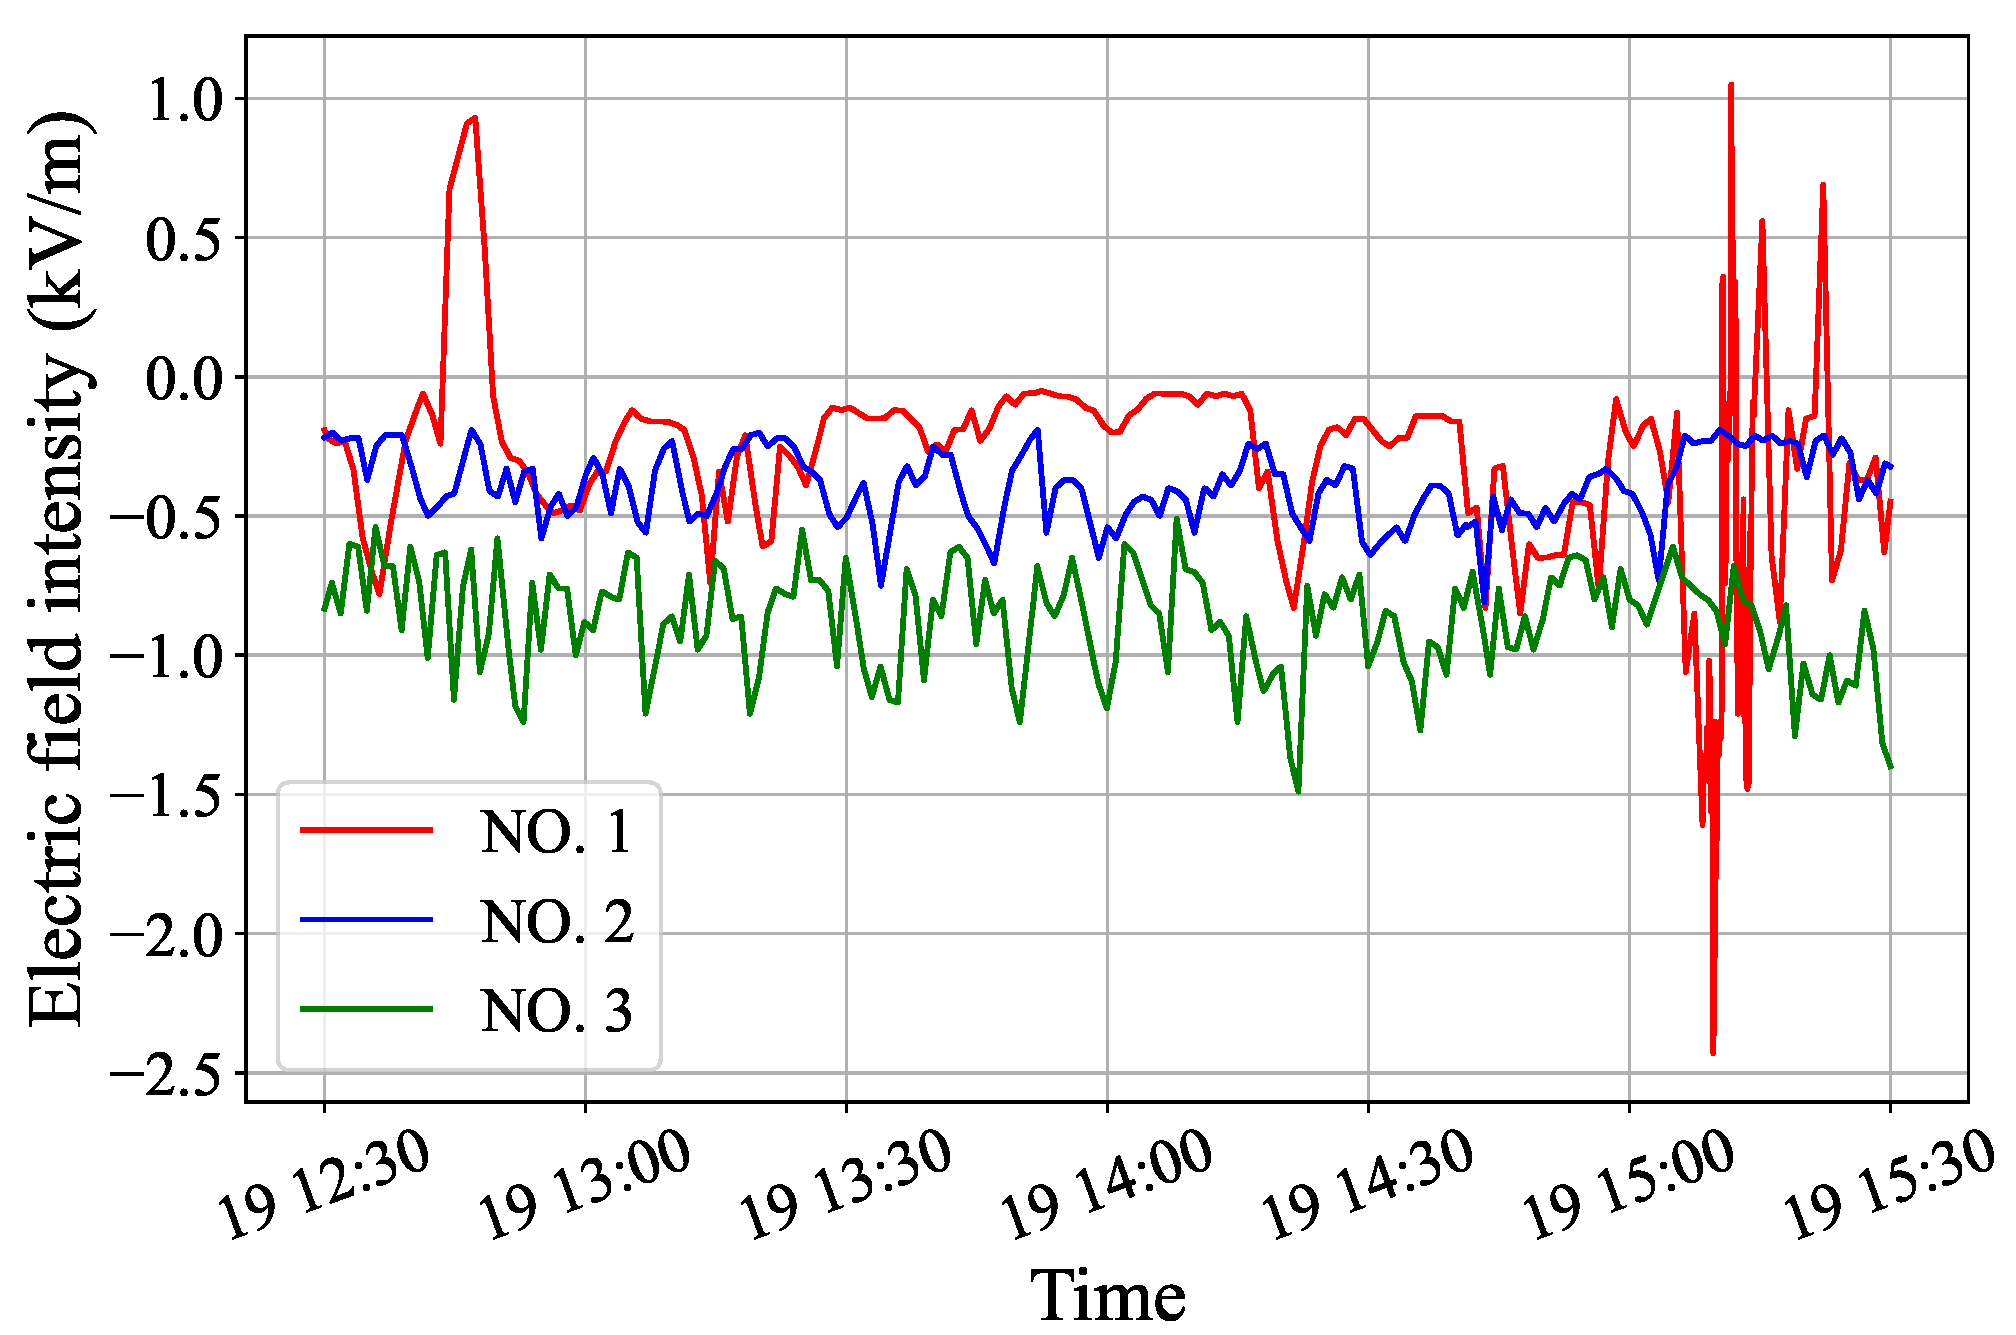
2.1.1. Atmospheric Electric Field Data
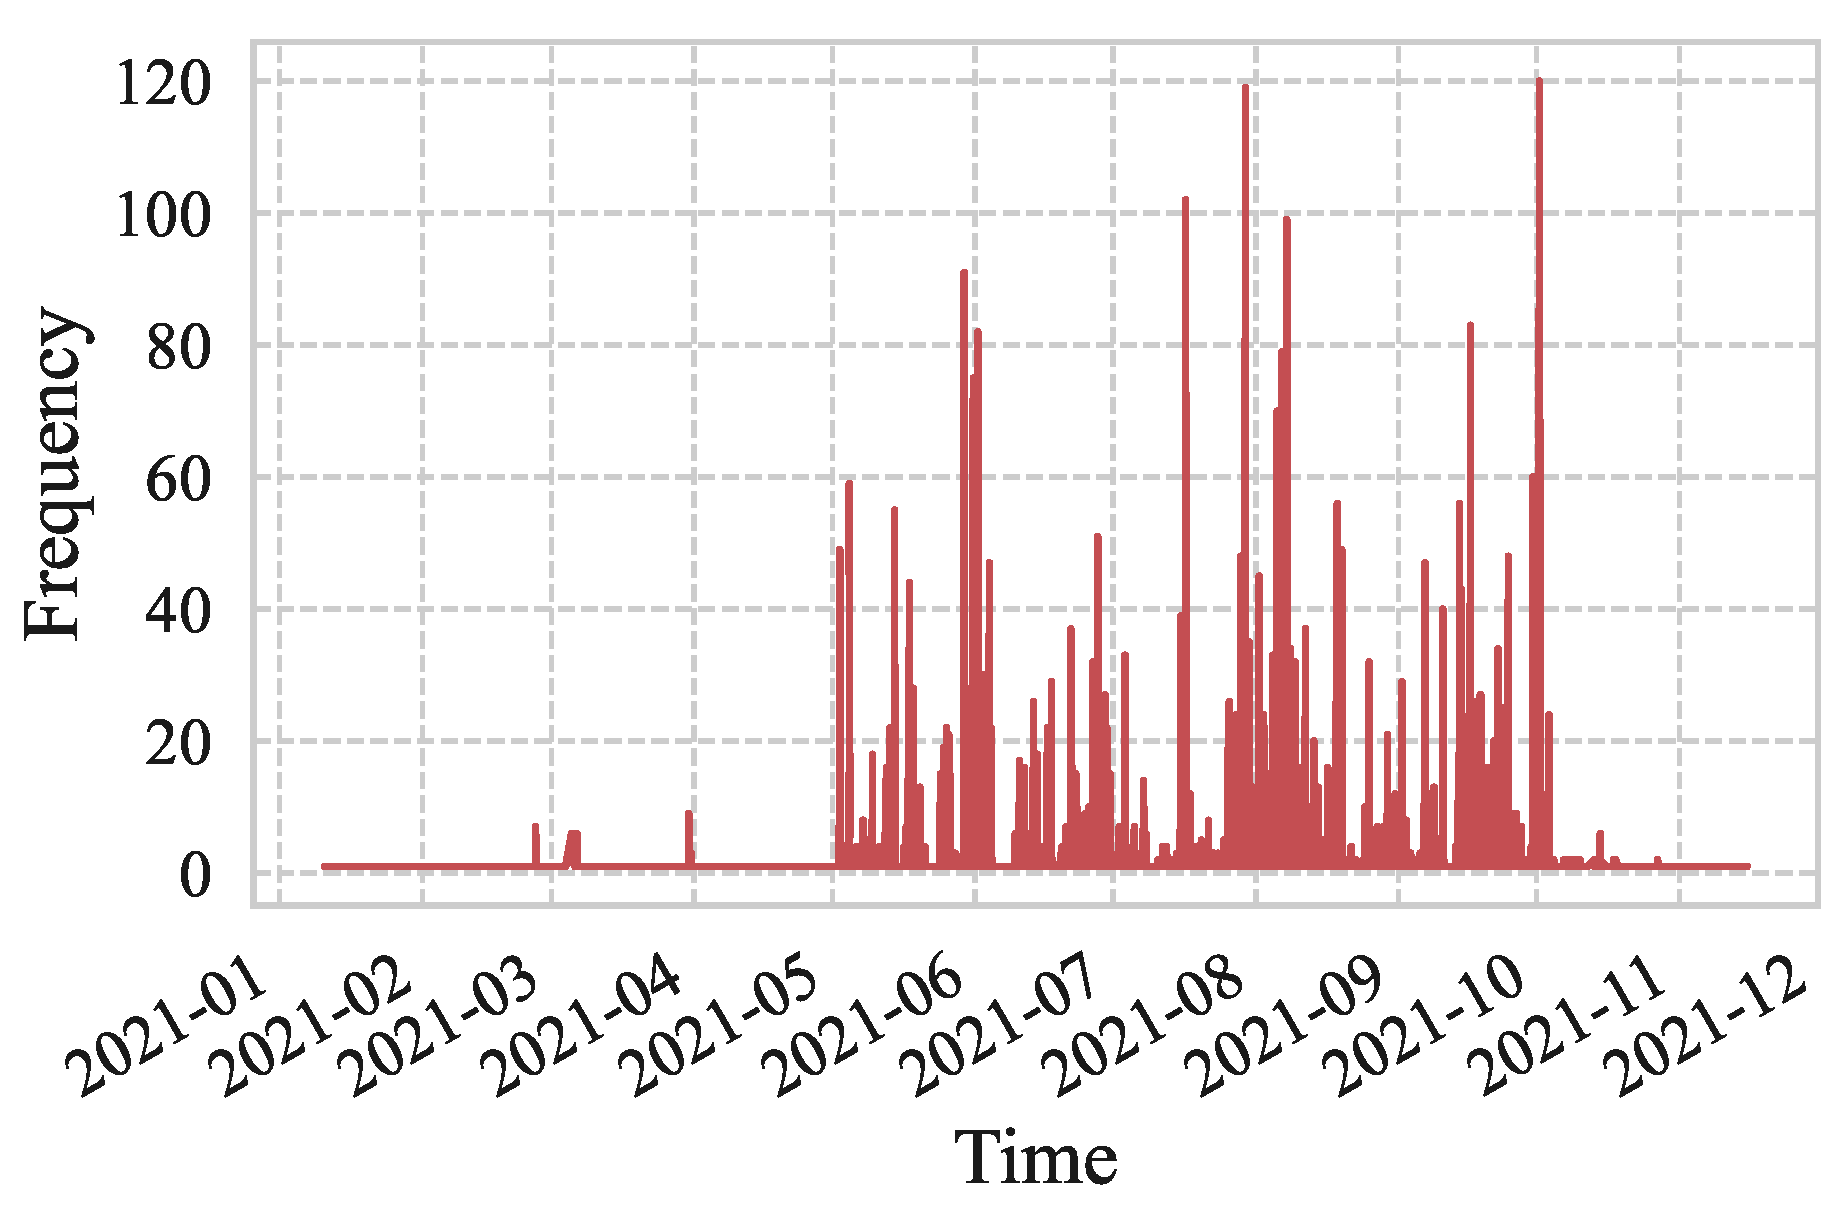
2.1.2. Lightning Location Data
2.1.3. Establishment of Database
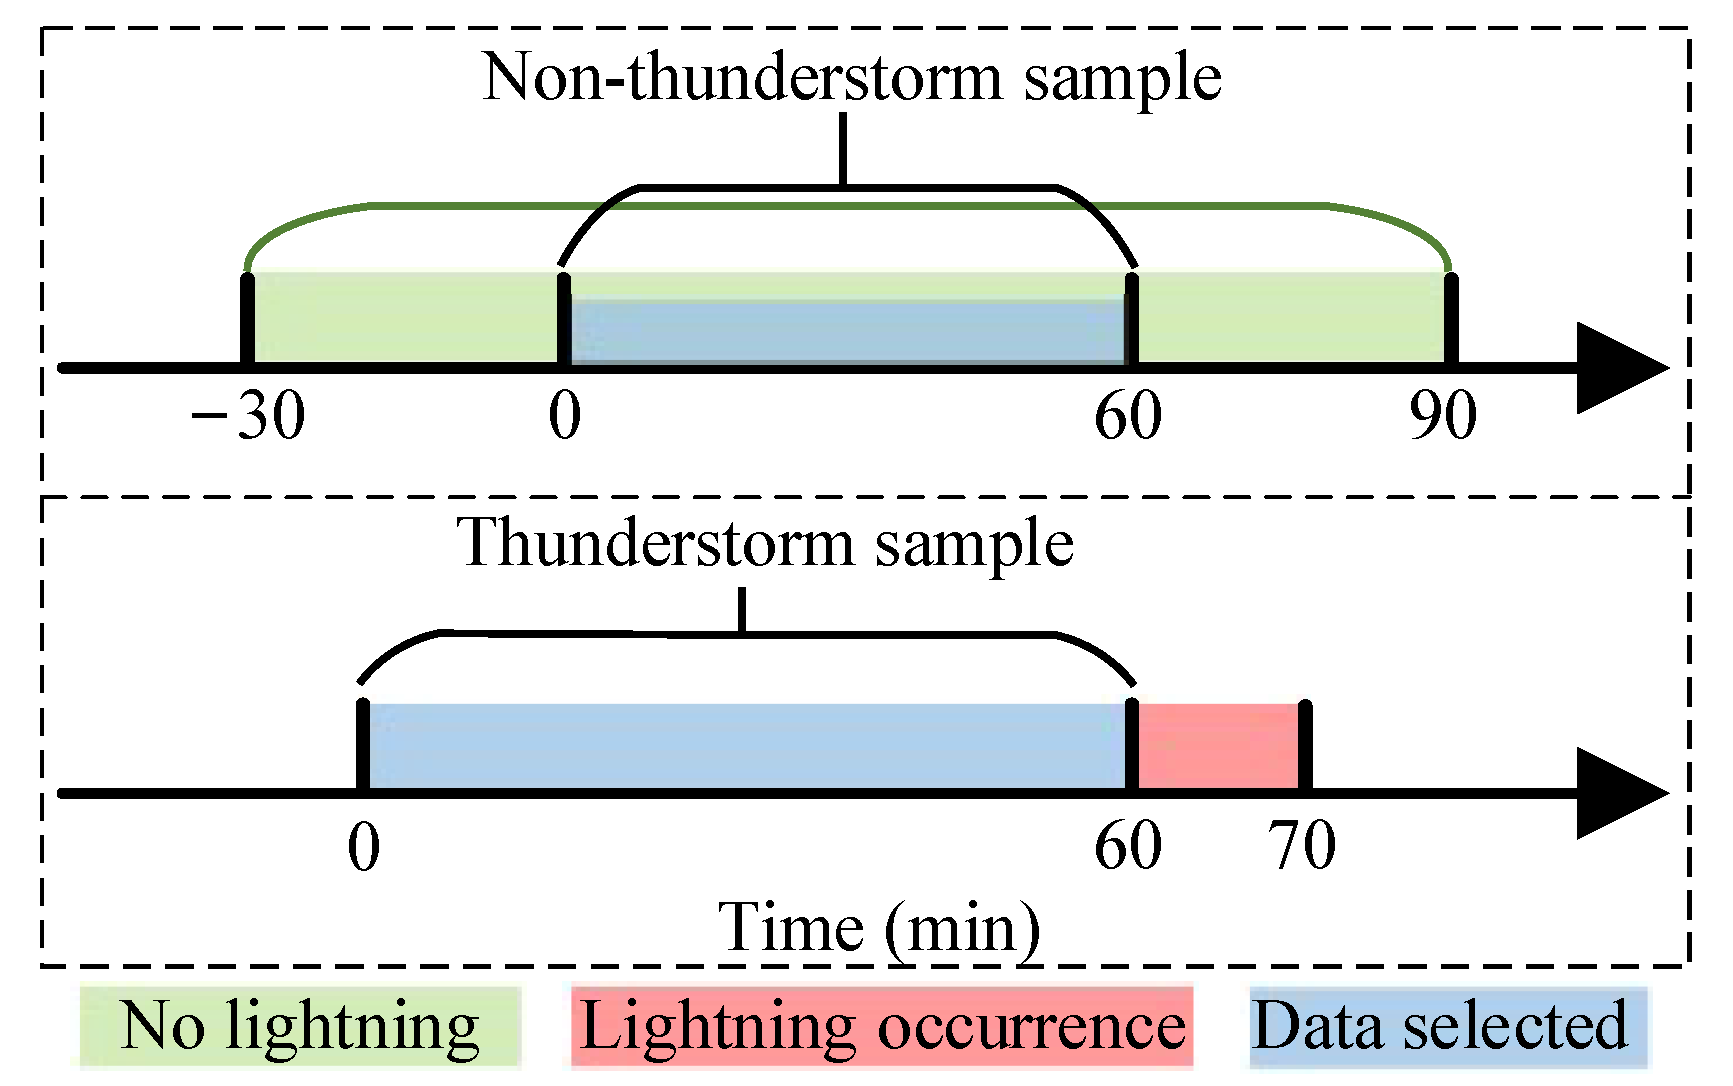
- Thunderstorm samples: if lightning is monitored within a certain one-minute time interval, the EF measurement data of its past one hour are taken out.
- Non-thunderstorm sample: randomly take out the EF measurement data for one hour, if there is no lightning occurring before and after half an hour, it is classified as a non-thunderstorm sample, which contains purely sunny days and rainstorms only (no lightning).
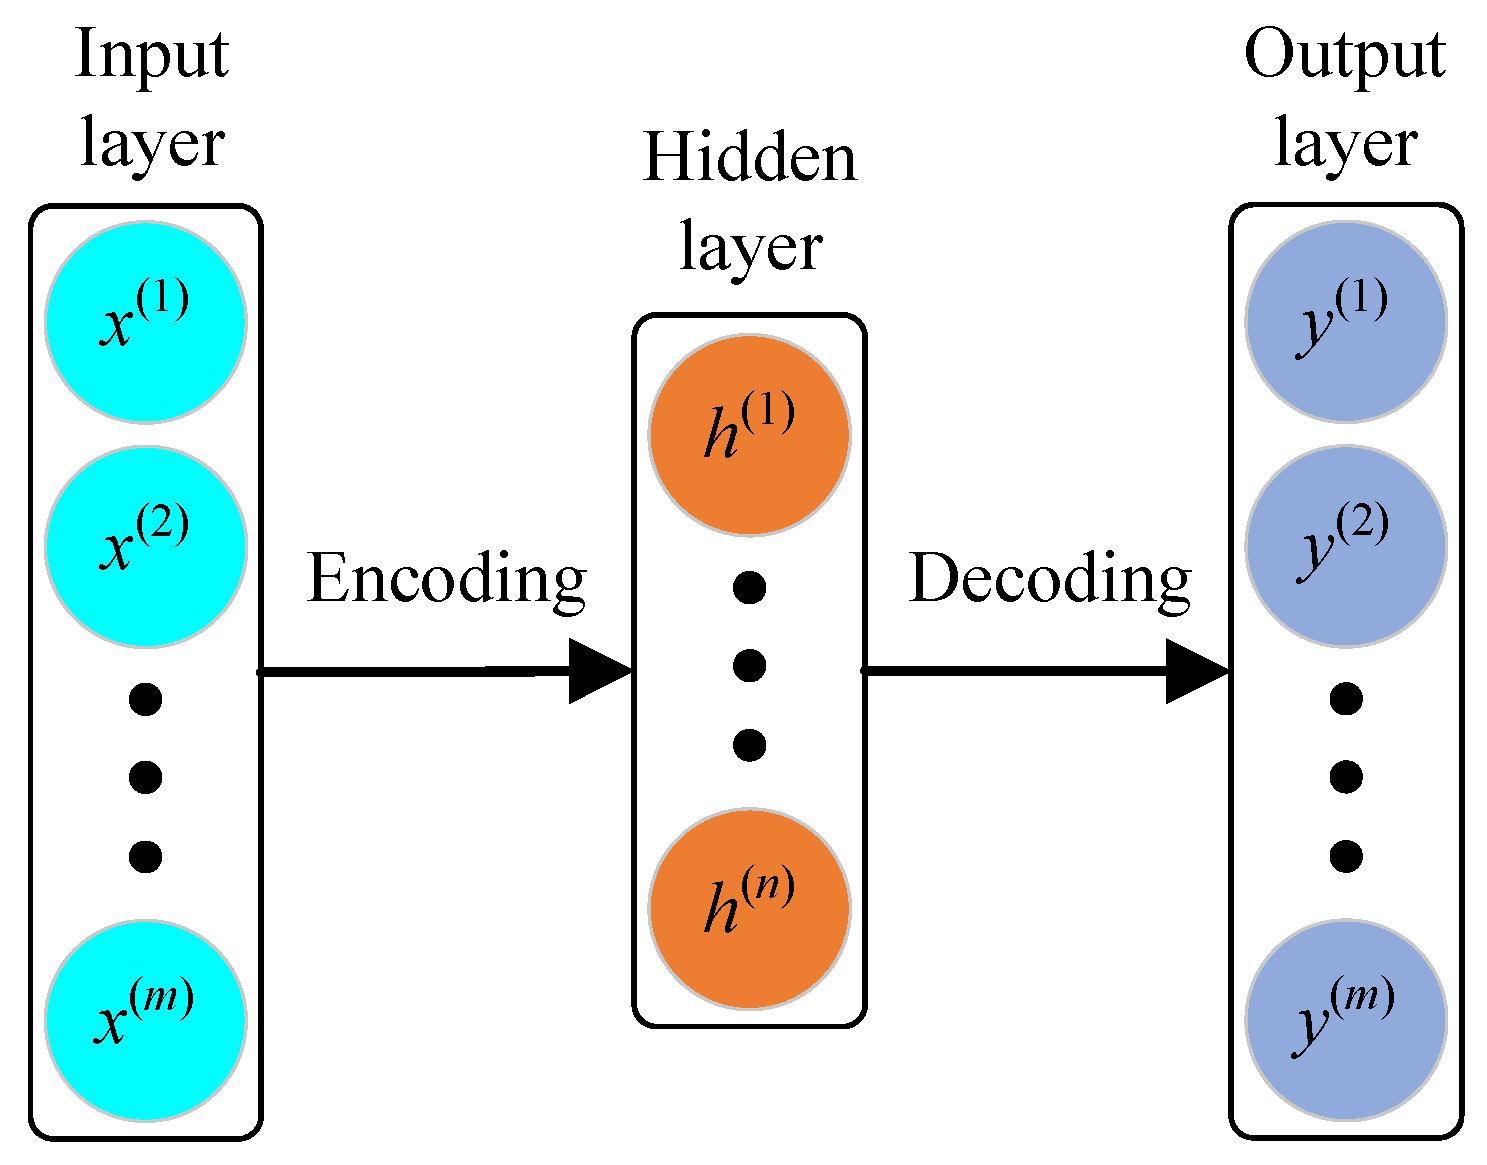
2.2. Feature Extraction and Dimensionality Reduction
2.3. Time Positioning
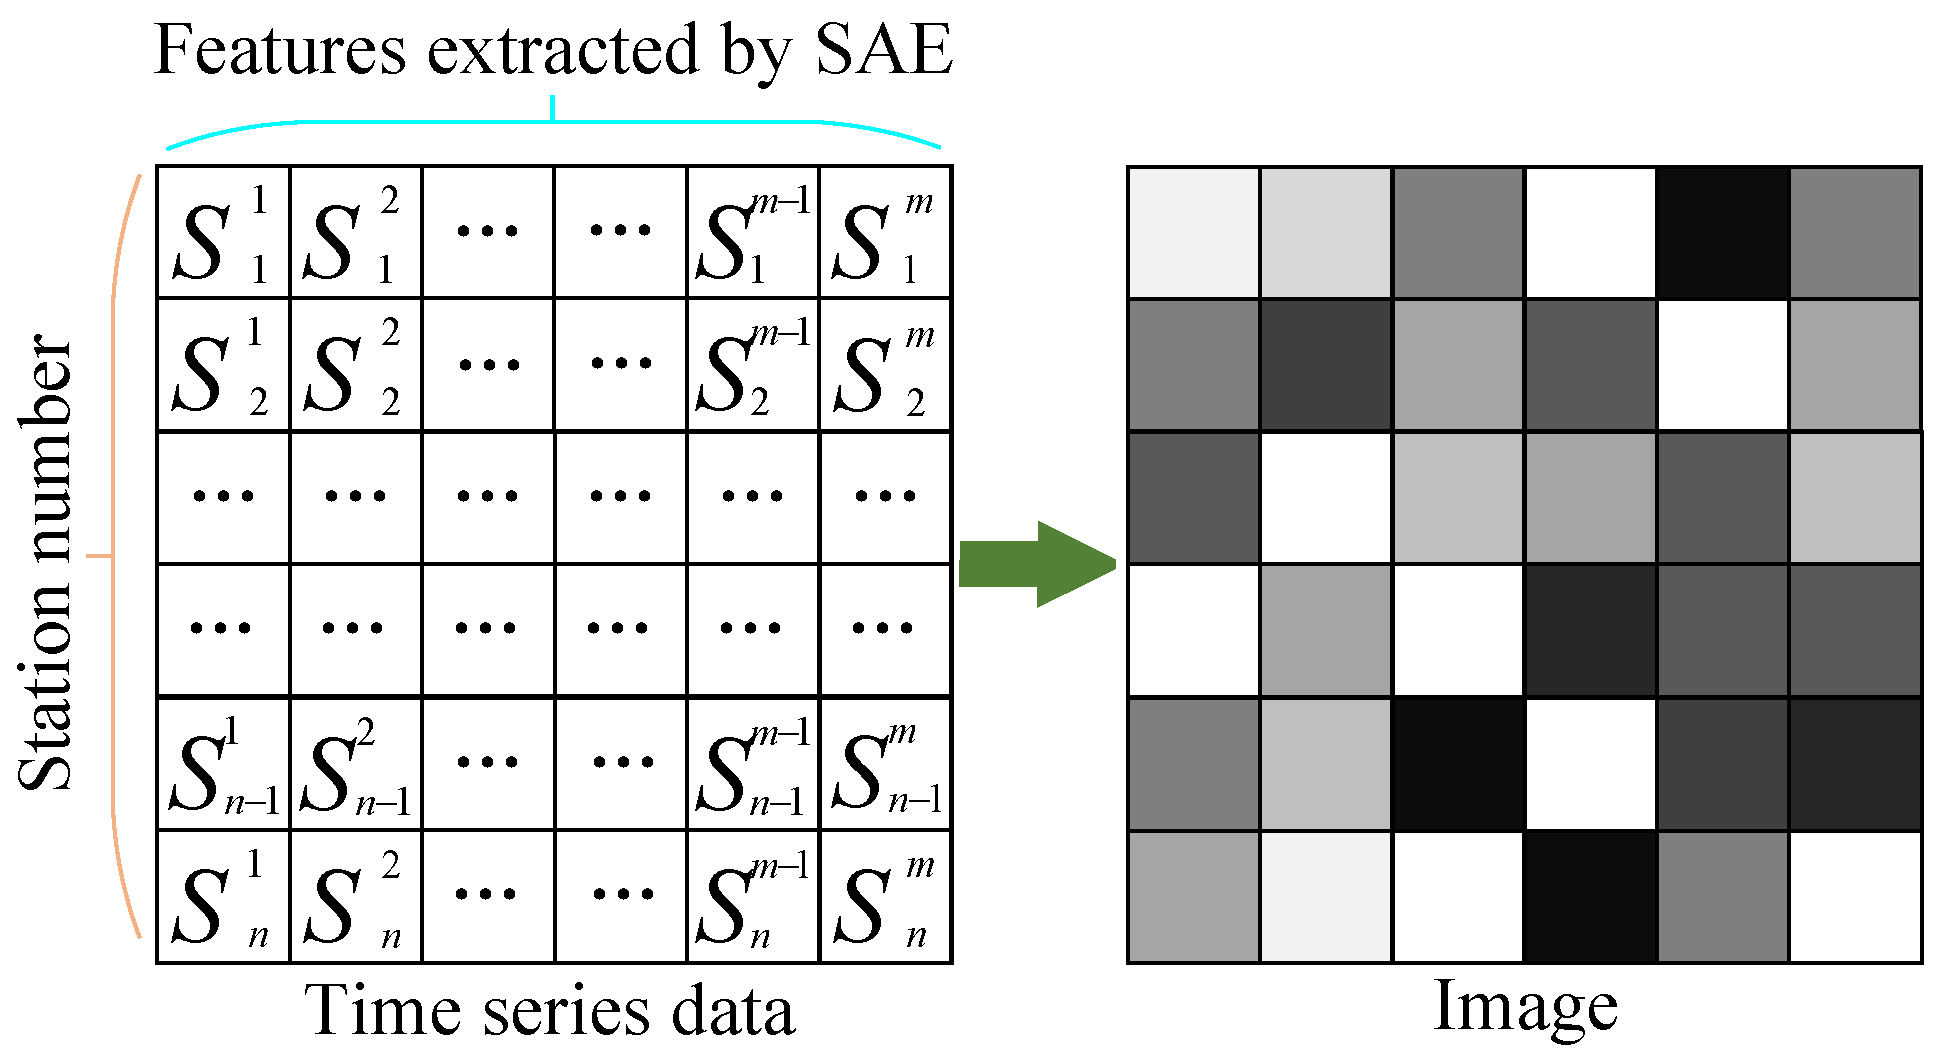
2.3.1. Visualization of Electric Field Data
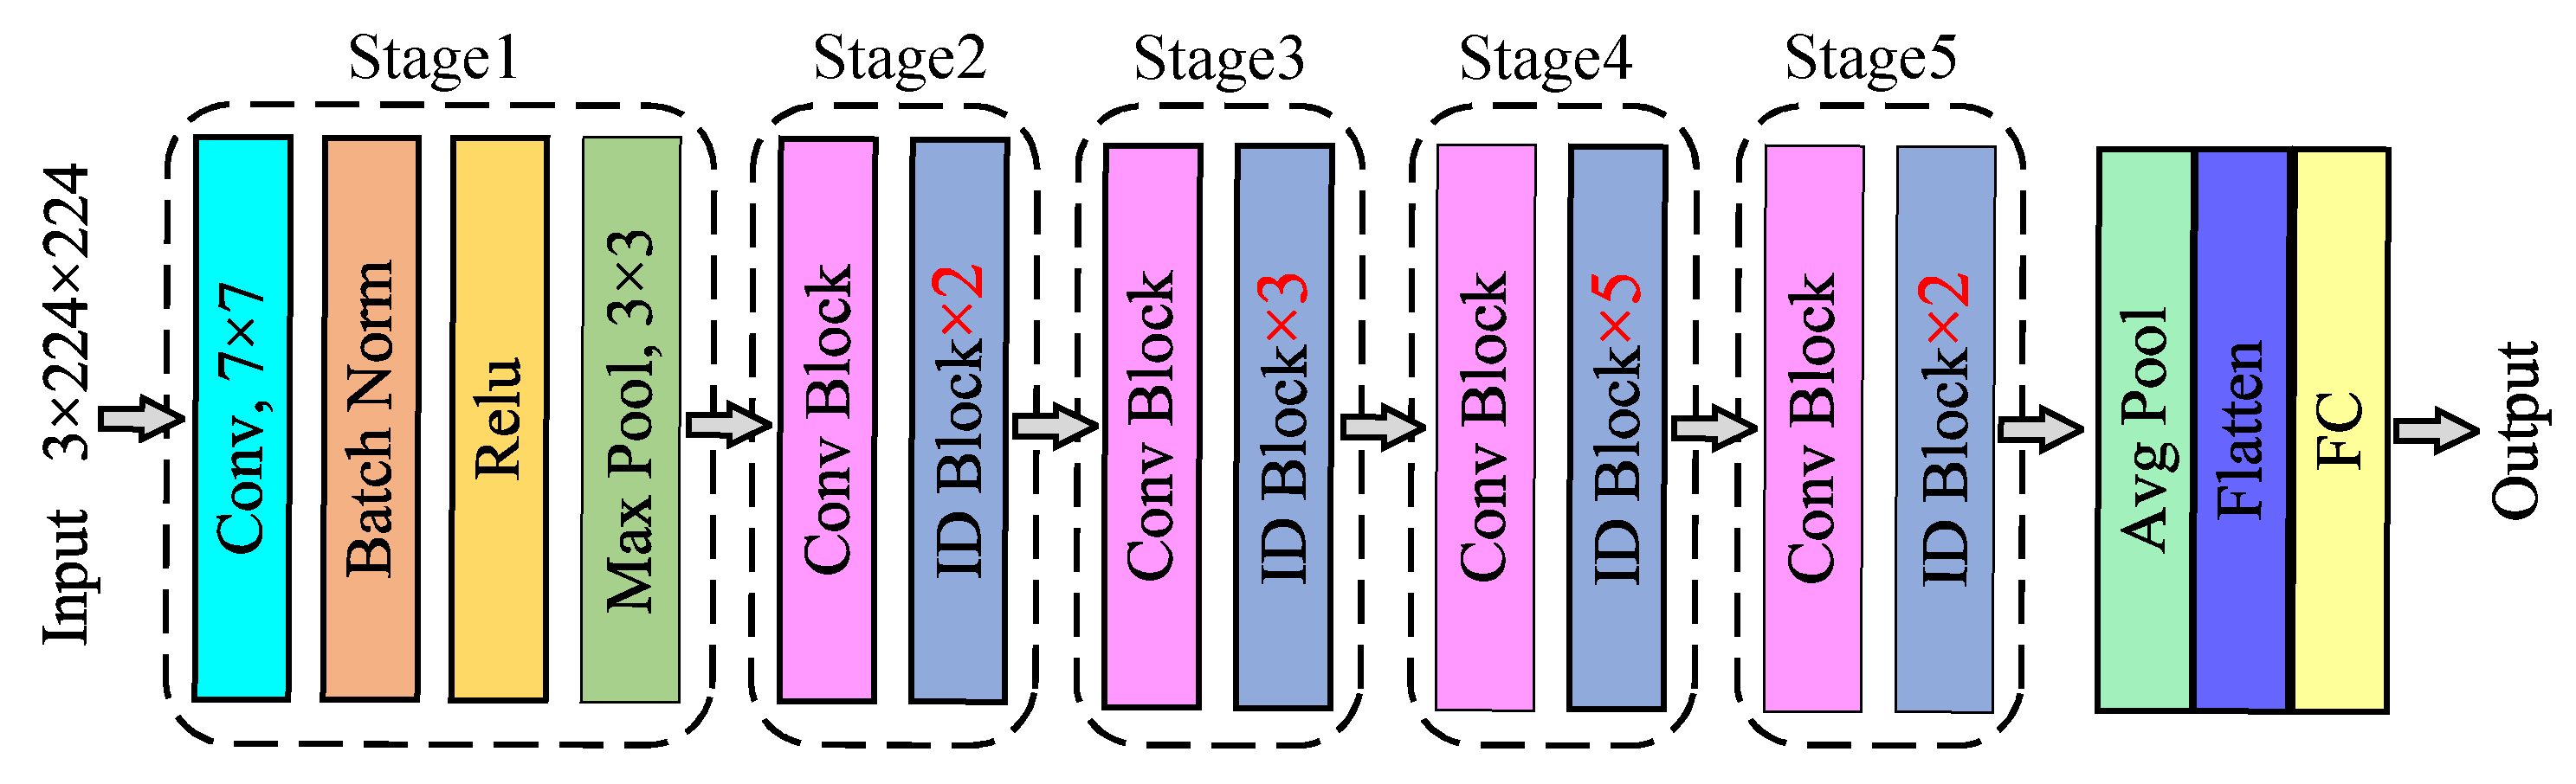
2.3.2. ResNet50 Model Architecture
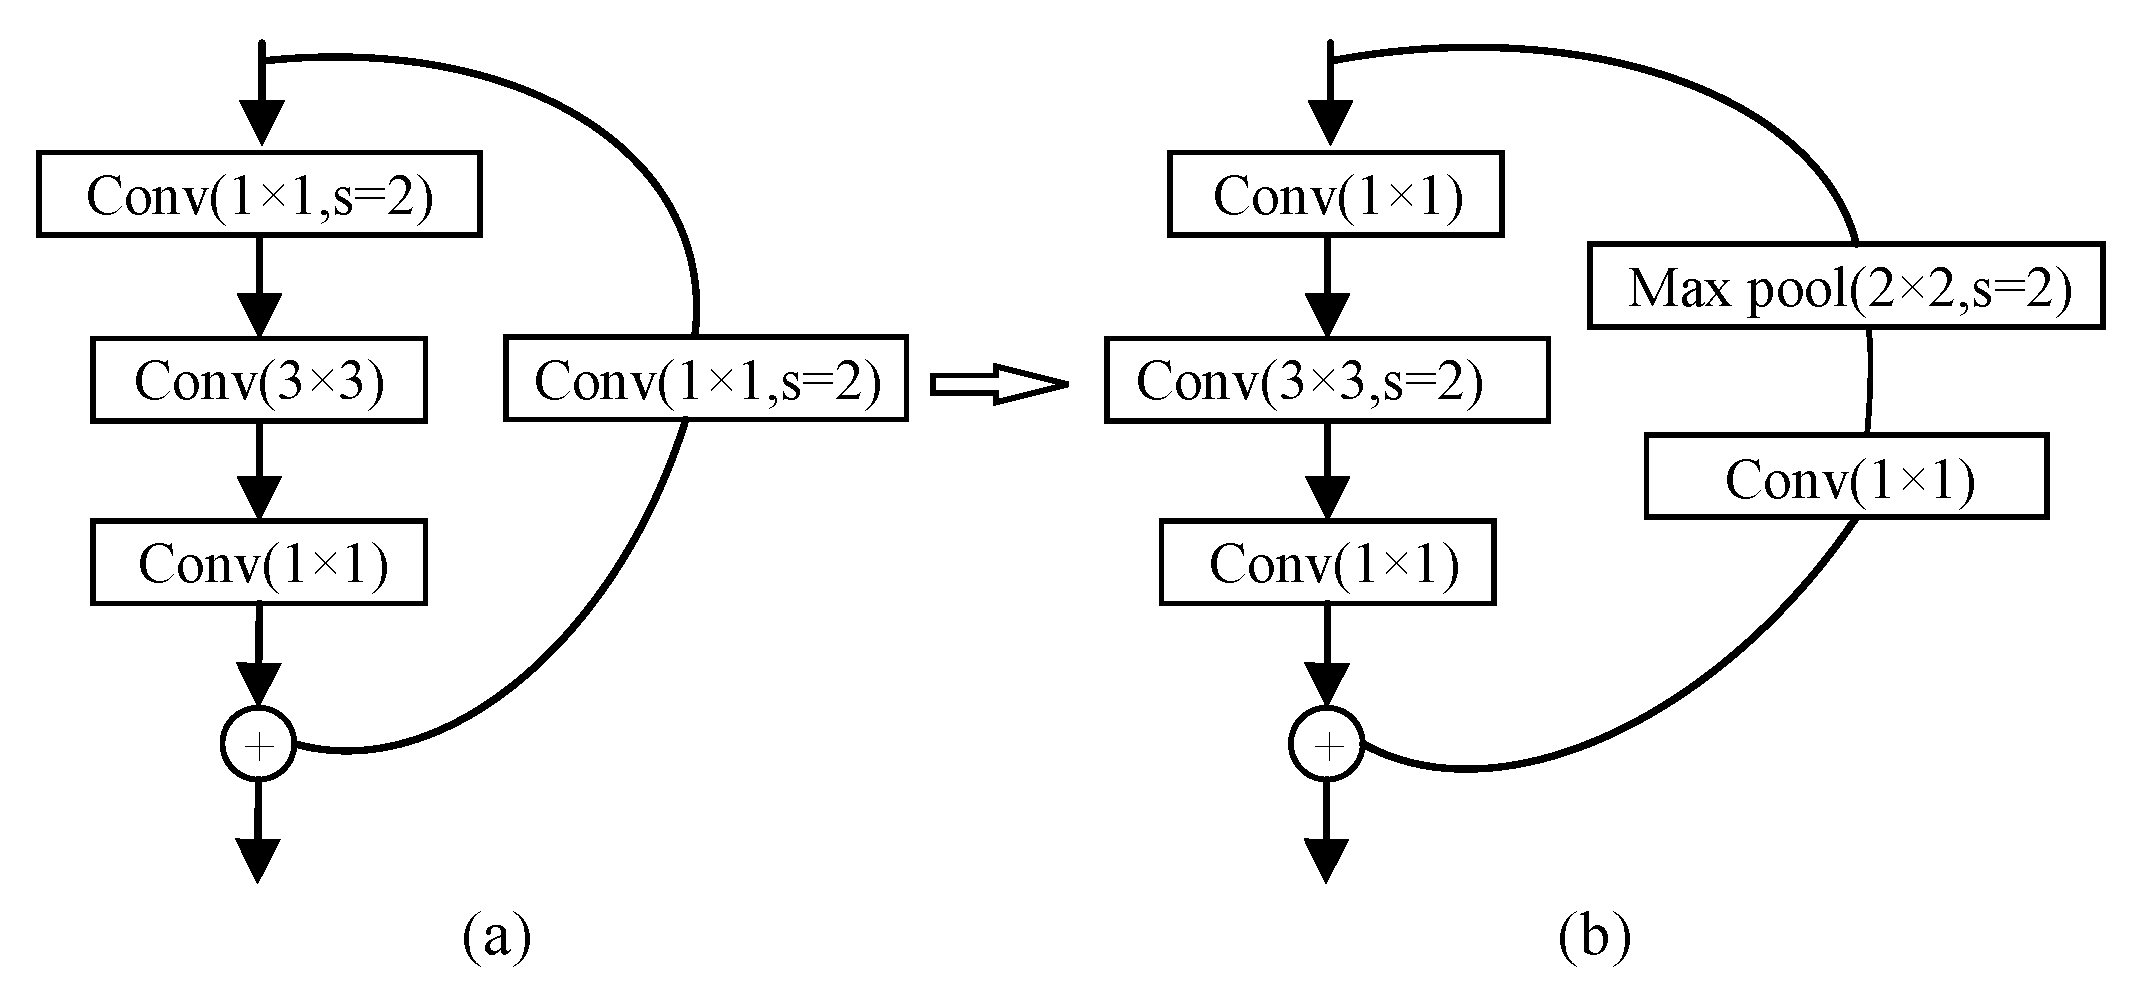
2.3.3. Principle of Residual Block
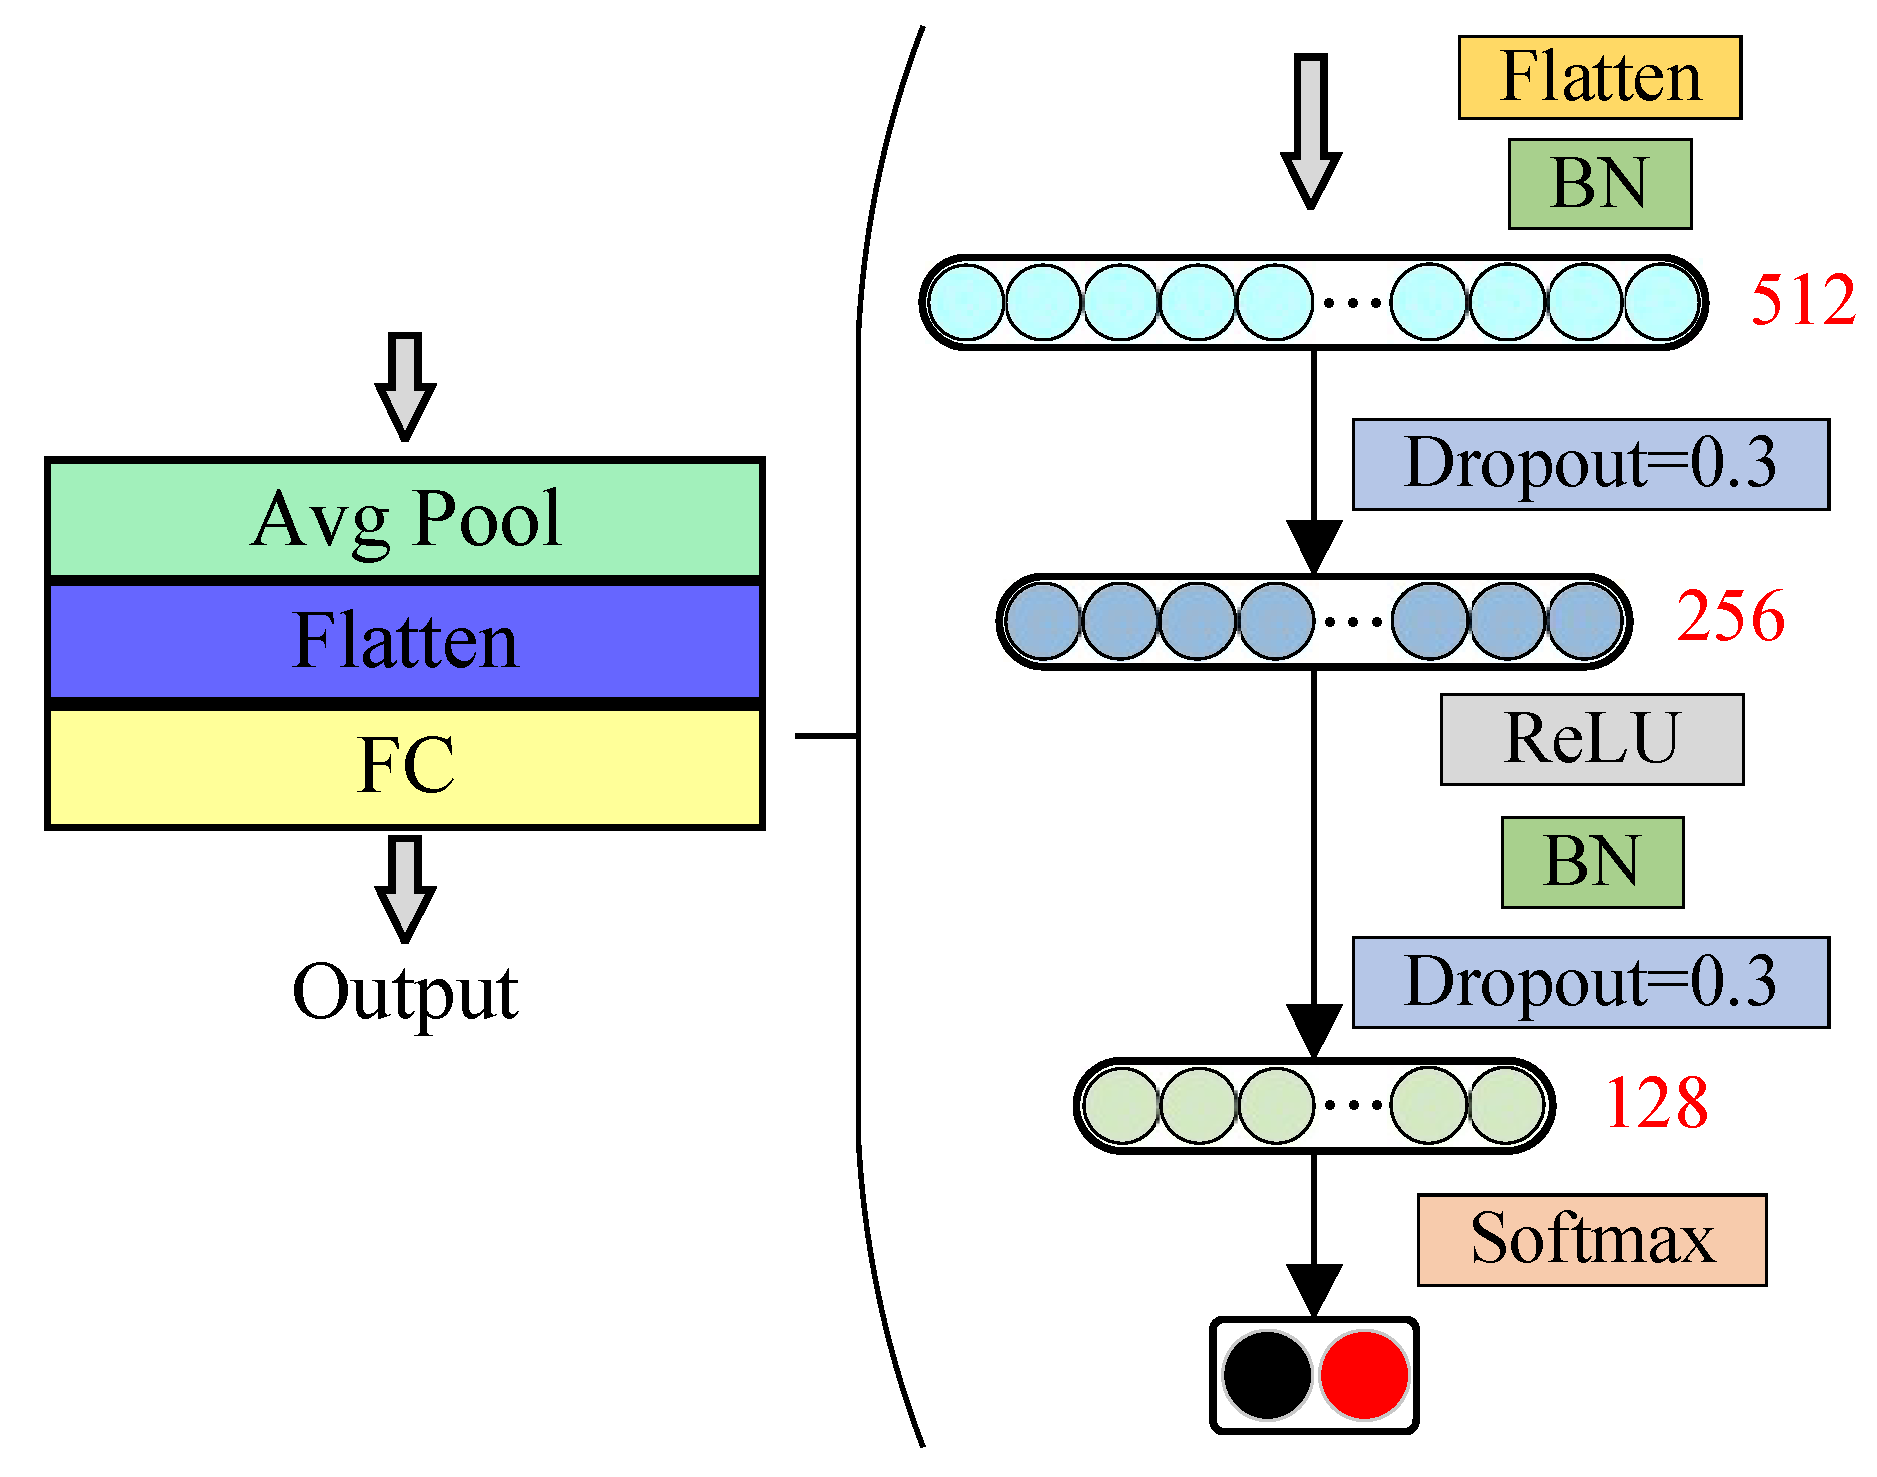
2.3.4. Improved ResNet50 Network
2.4. Spatial Positioning
2.4.1. Spatial Correlation of Lightning
- A single thunderstorm is often accompanied by multiple lightning episodes.
- As shown in the pink rectangle in Figure 11, lightning flashes that occur within a few minutes have obvious spatial correlation characteristics.
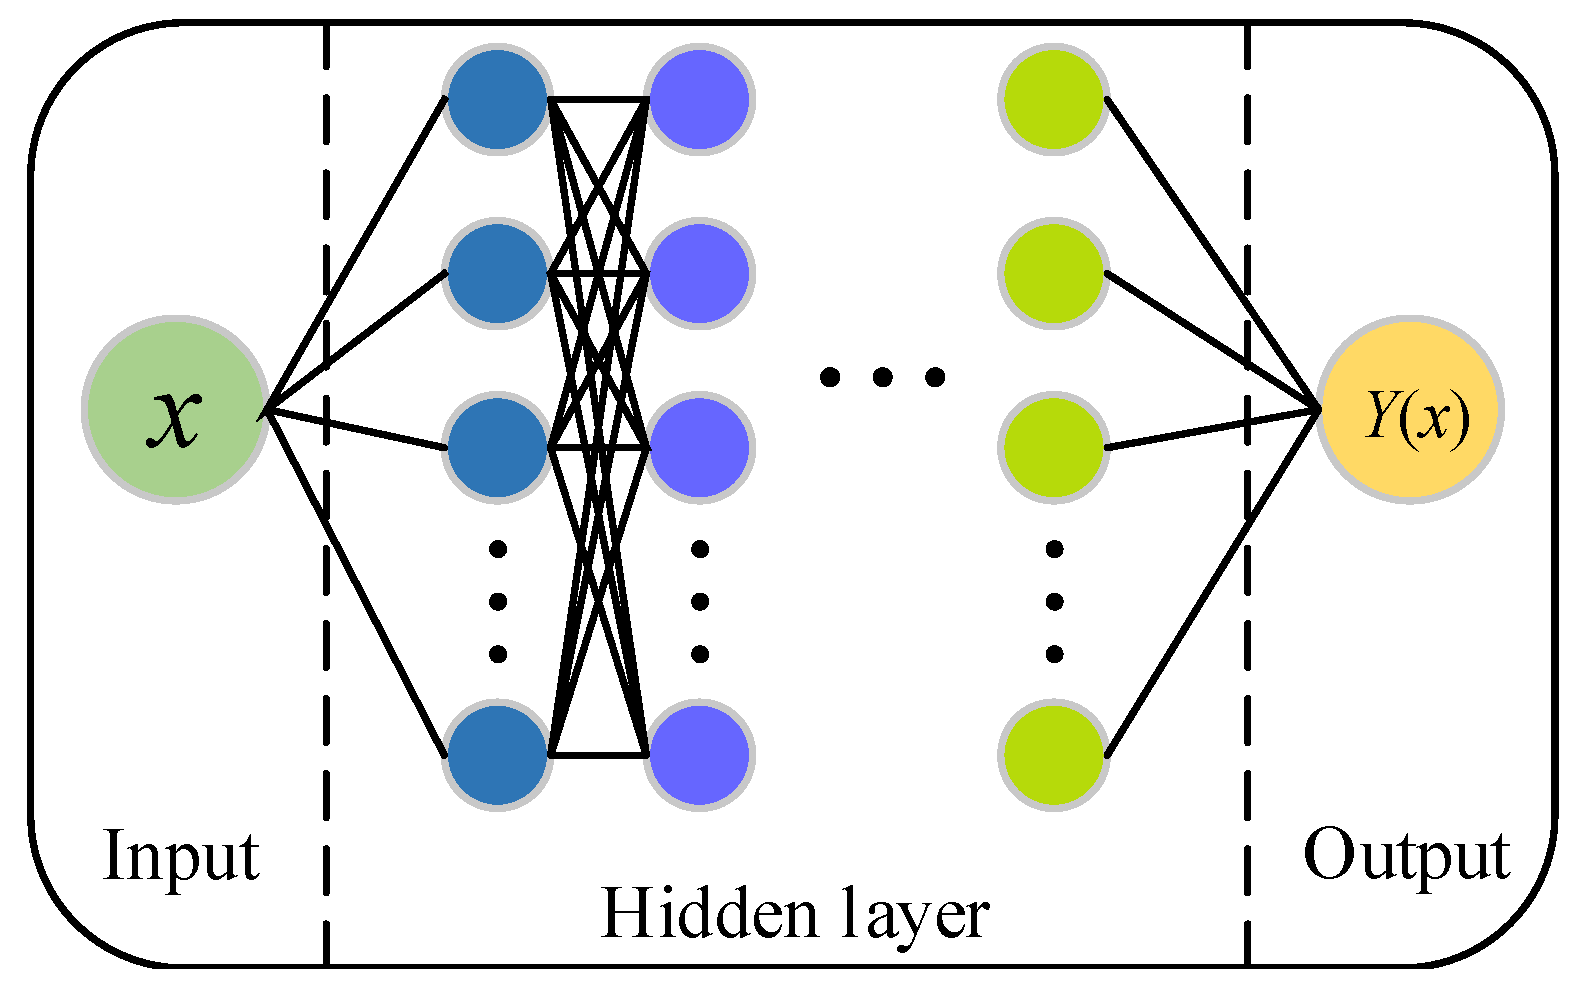
2.4.2. Multilayer Perceptron
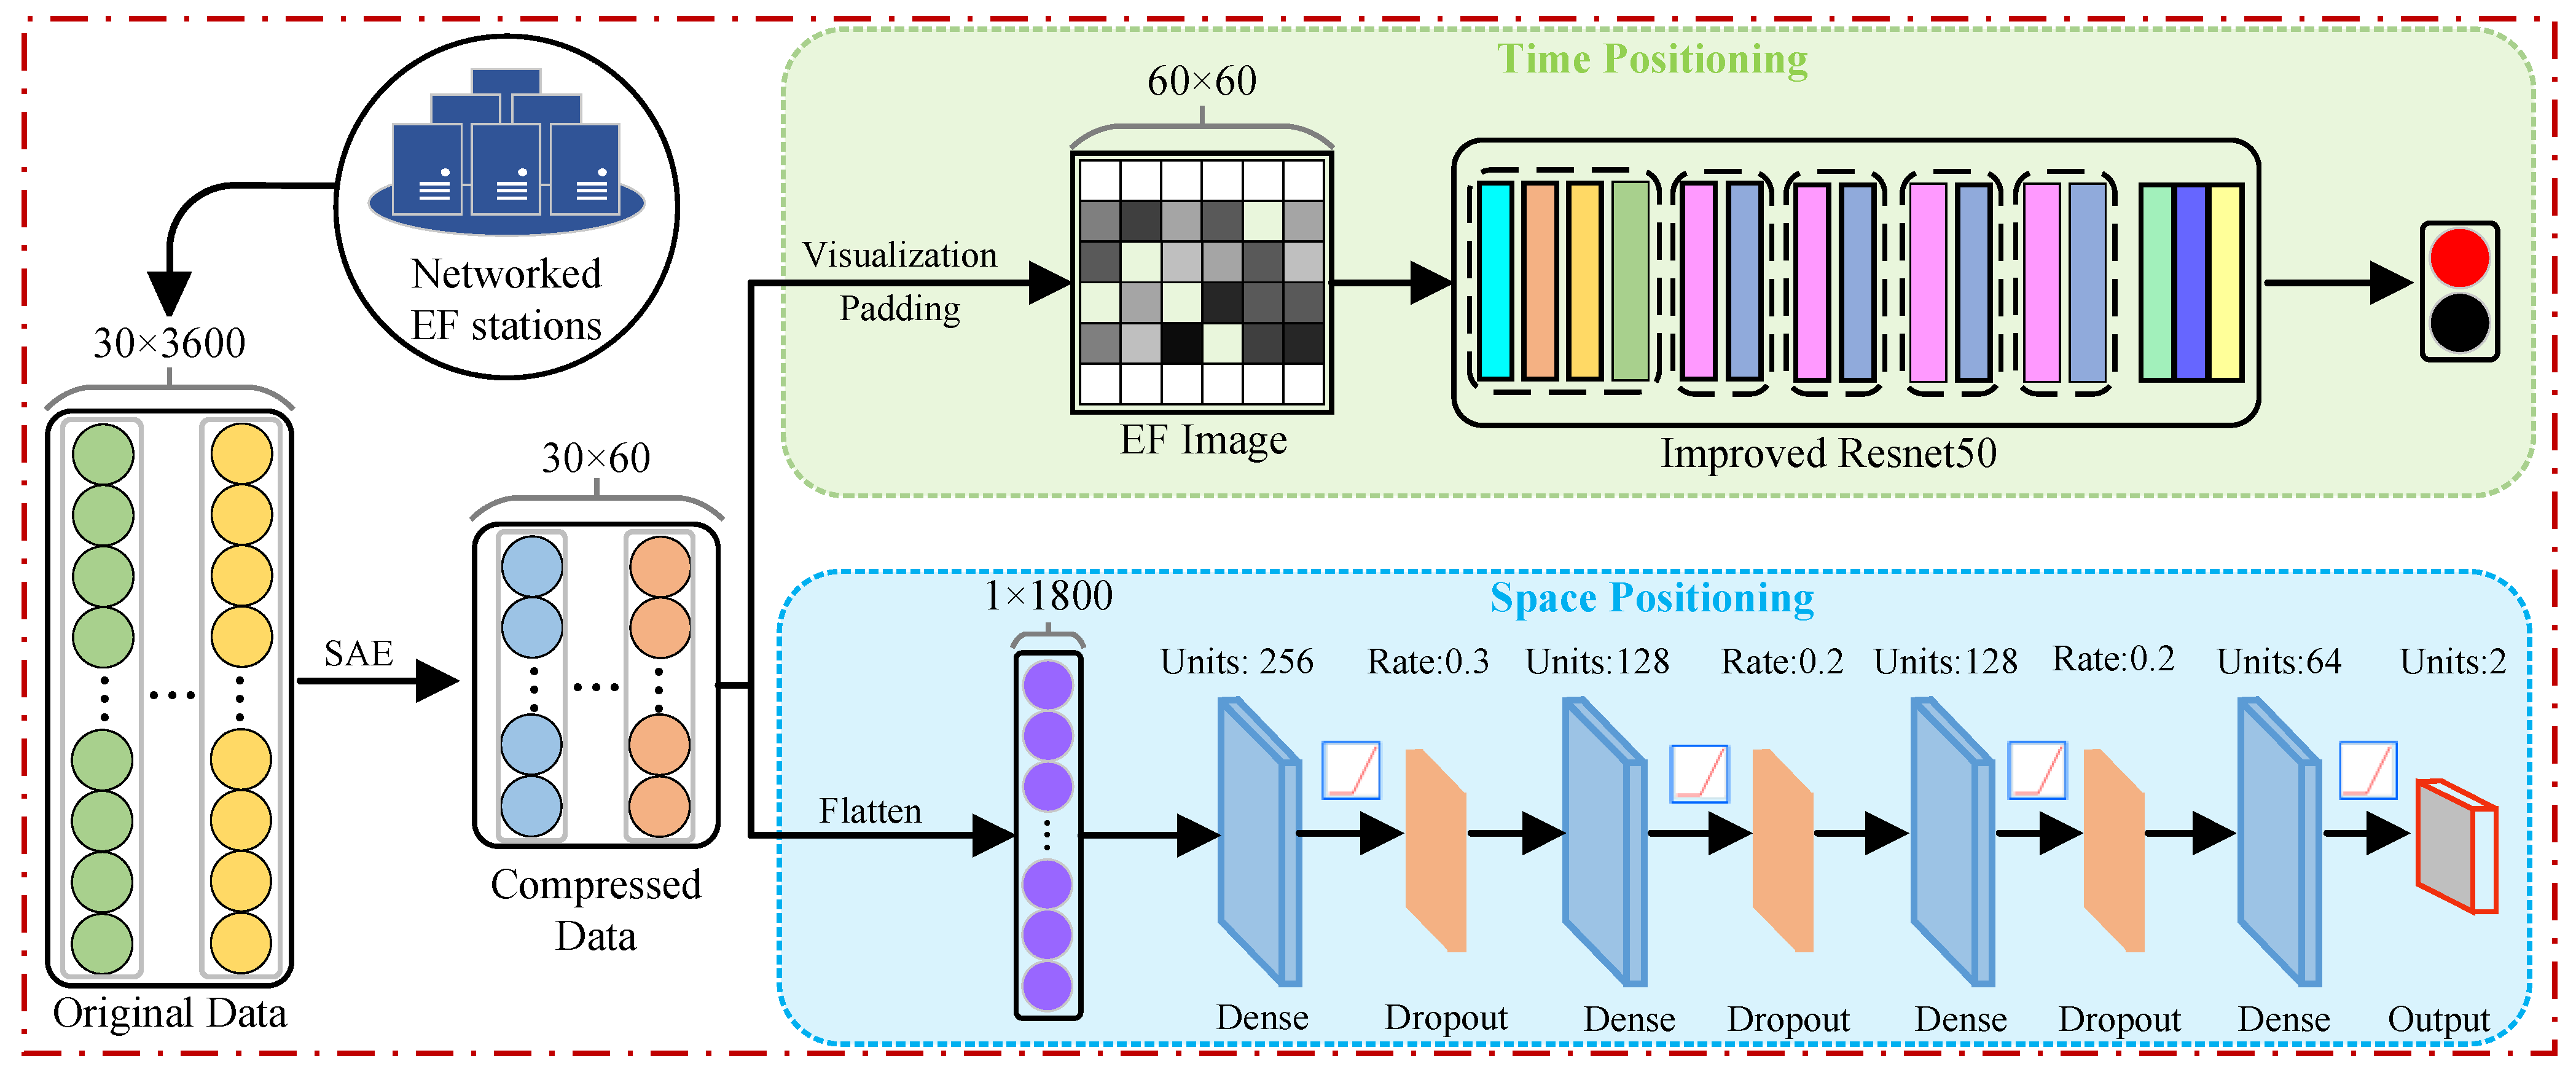
2.5. Overview of the Proposed Algorithm
- Data collected from 30 EF stations and lightning locators are pre-processed.
- The EF measurement data and lightning location data are matched one by one to construct the database of weather samples.
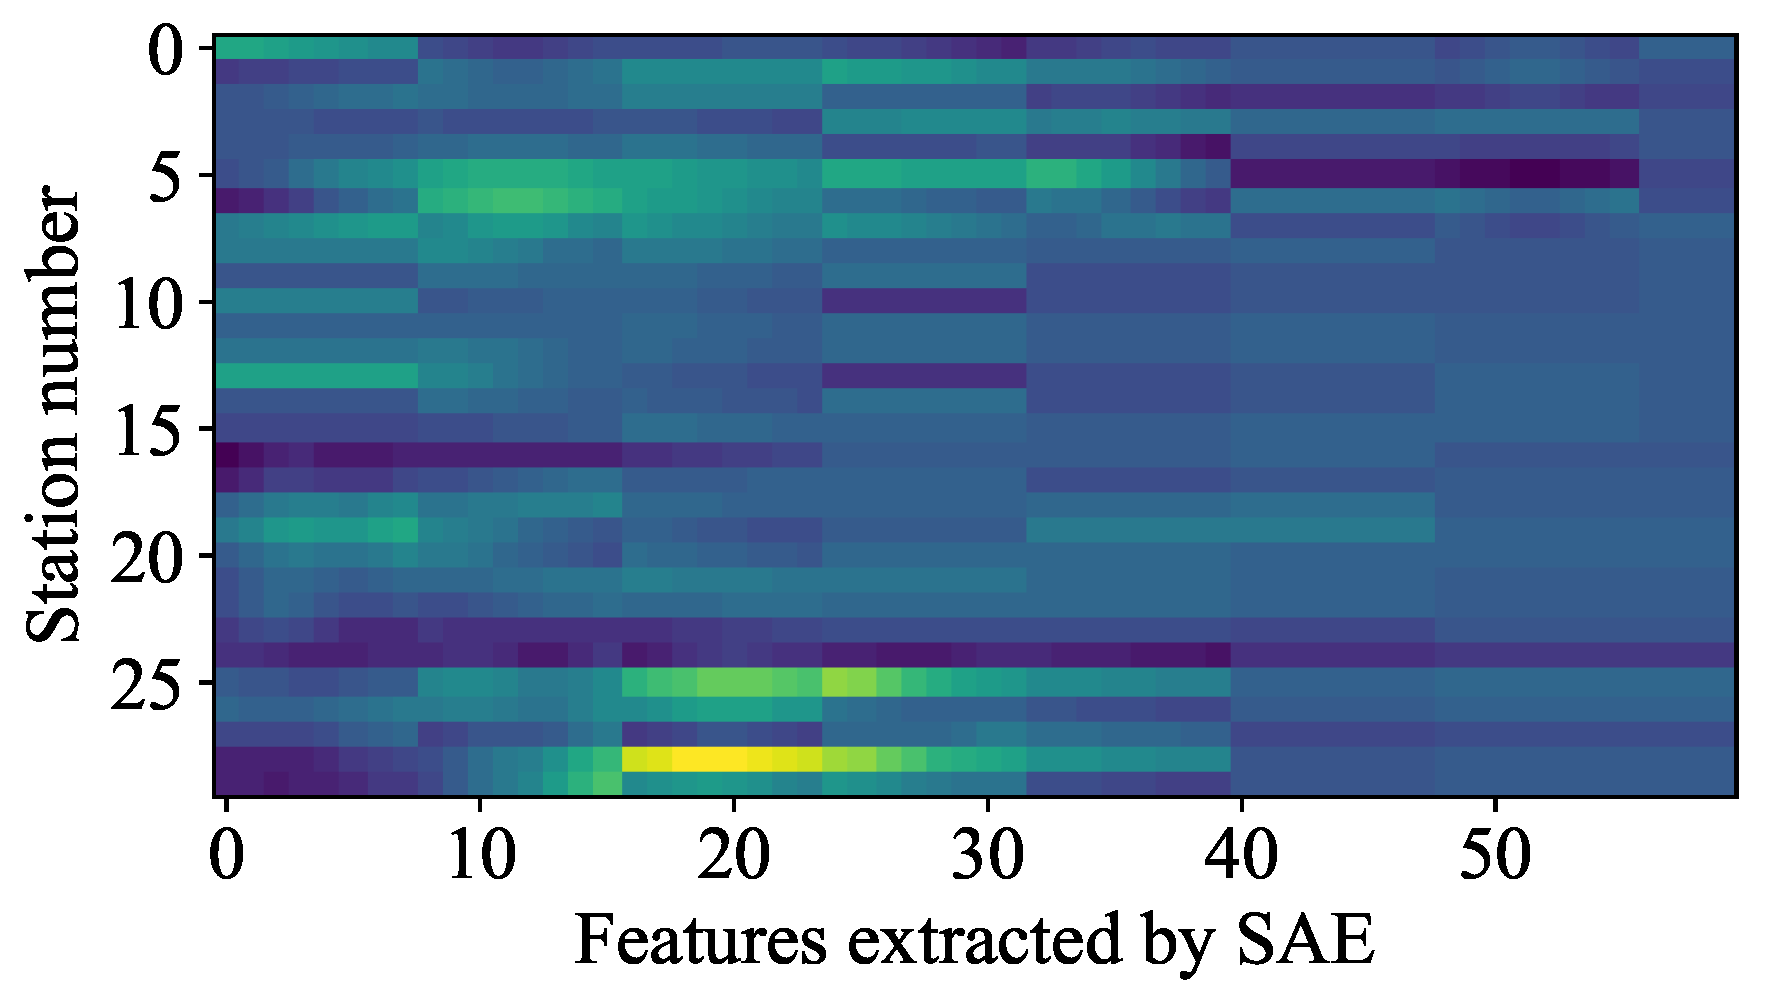
- The characterization of the EF time series is extracted by a SAE.
- EF features extracted in the previous step are transformed into images and determined whether they are thunderstorm weather samples based on the improved ResNet50 network. If yes, the process proceeds to the next step; otherwise, the process is finished.
- Lightning spatial localization is initiated and the latitude and longitude of the lightning occurrence is predicted based on a MLP neural network.
3. Results
3.1. Feature Extraction
3.2. Time Positioning
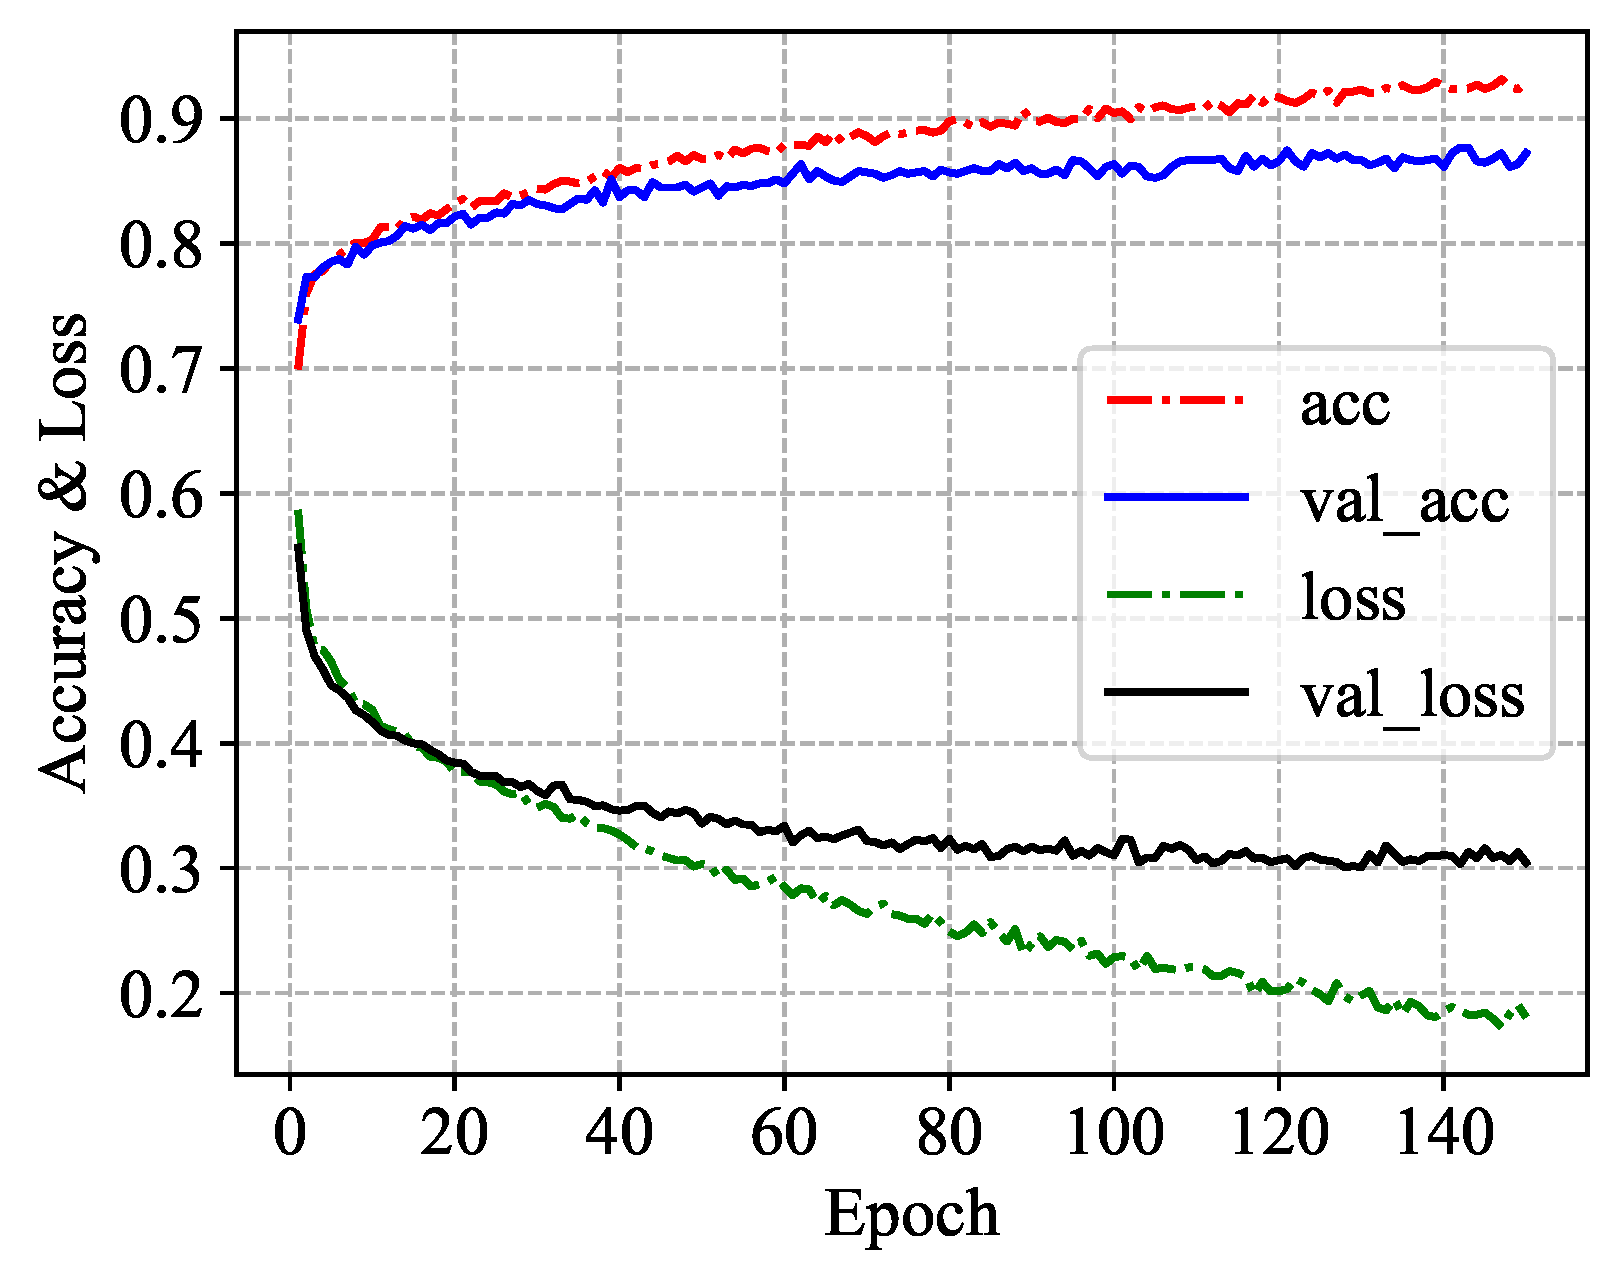
3.2.1. Classification Result
3.2.2. Evaluation for Different Length of Time Series
3.2.3. Evaluation under Data Augmentation
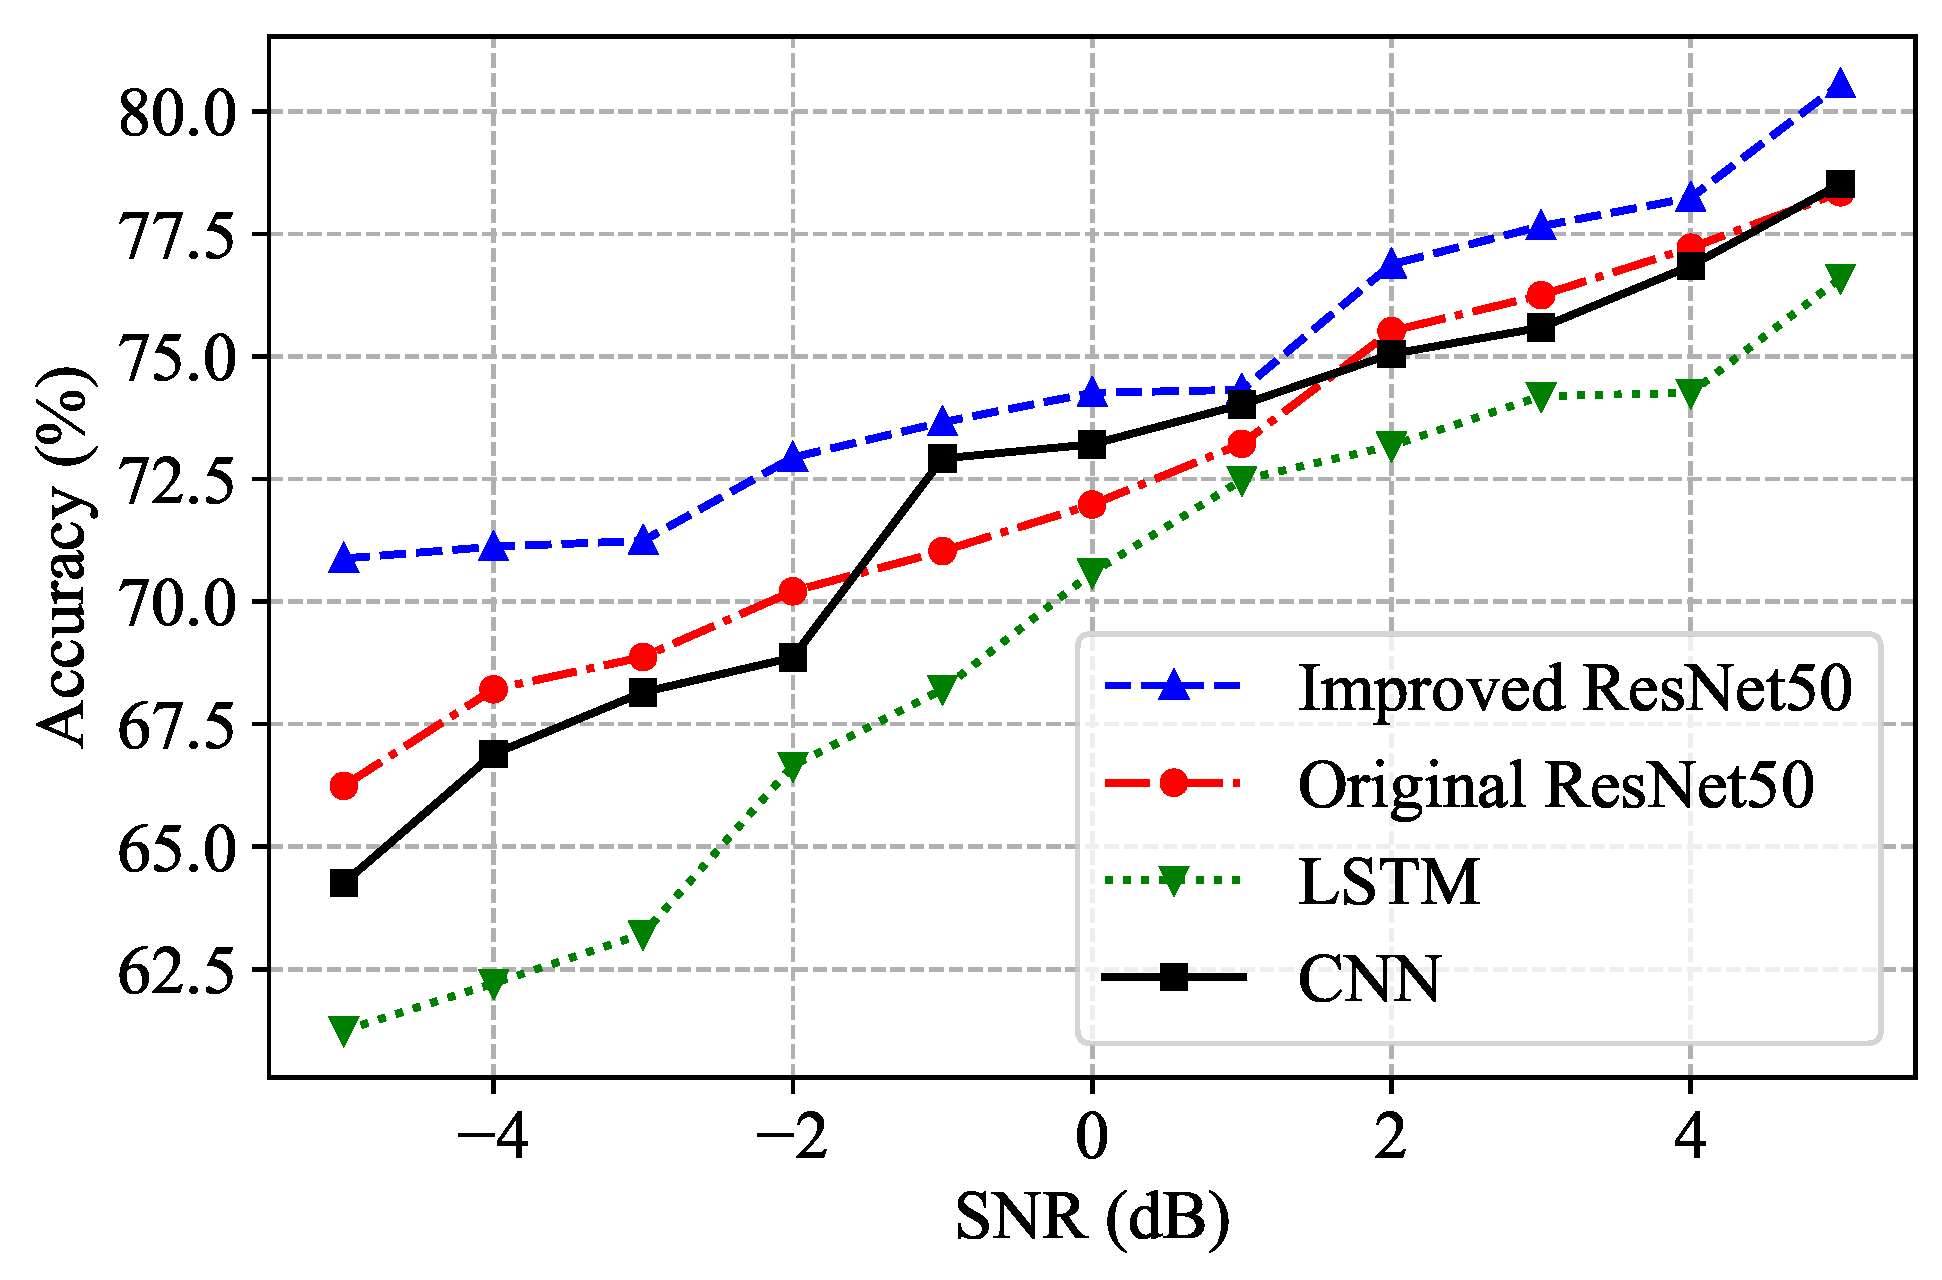
3.2.4. Effect of Noise Interference
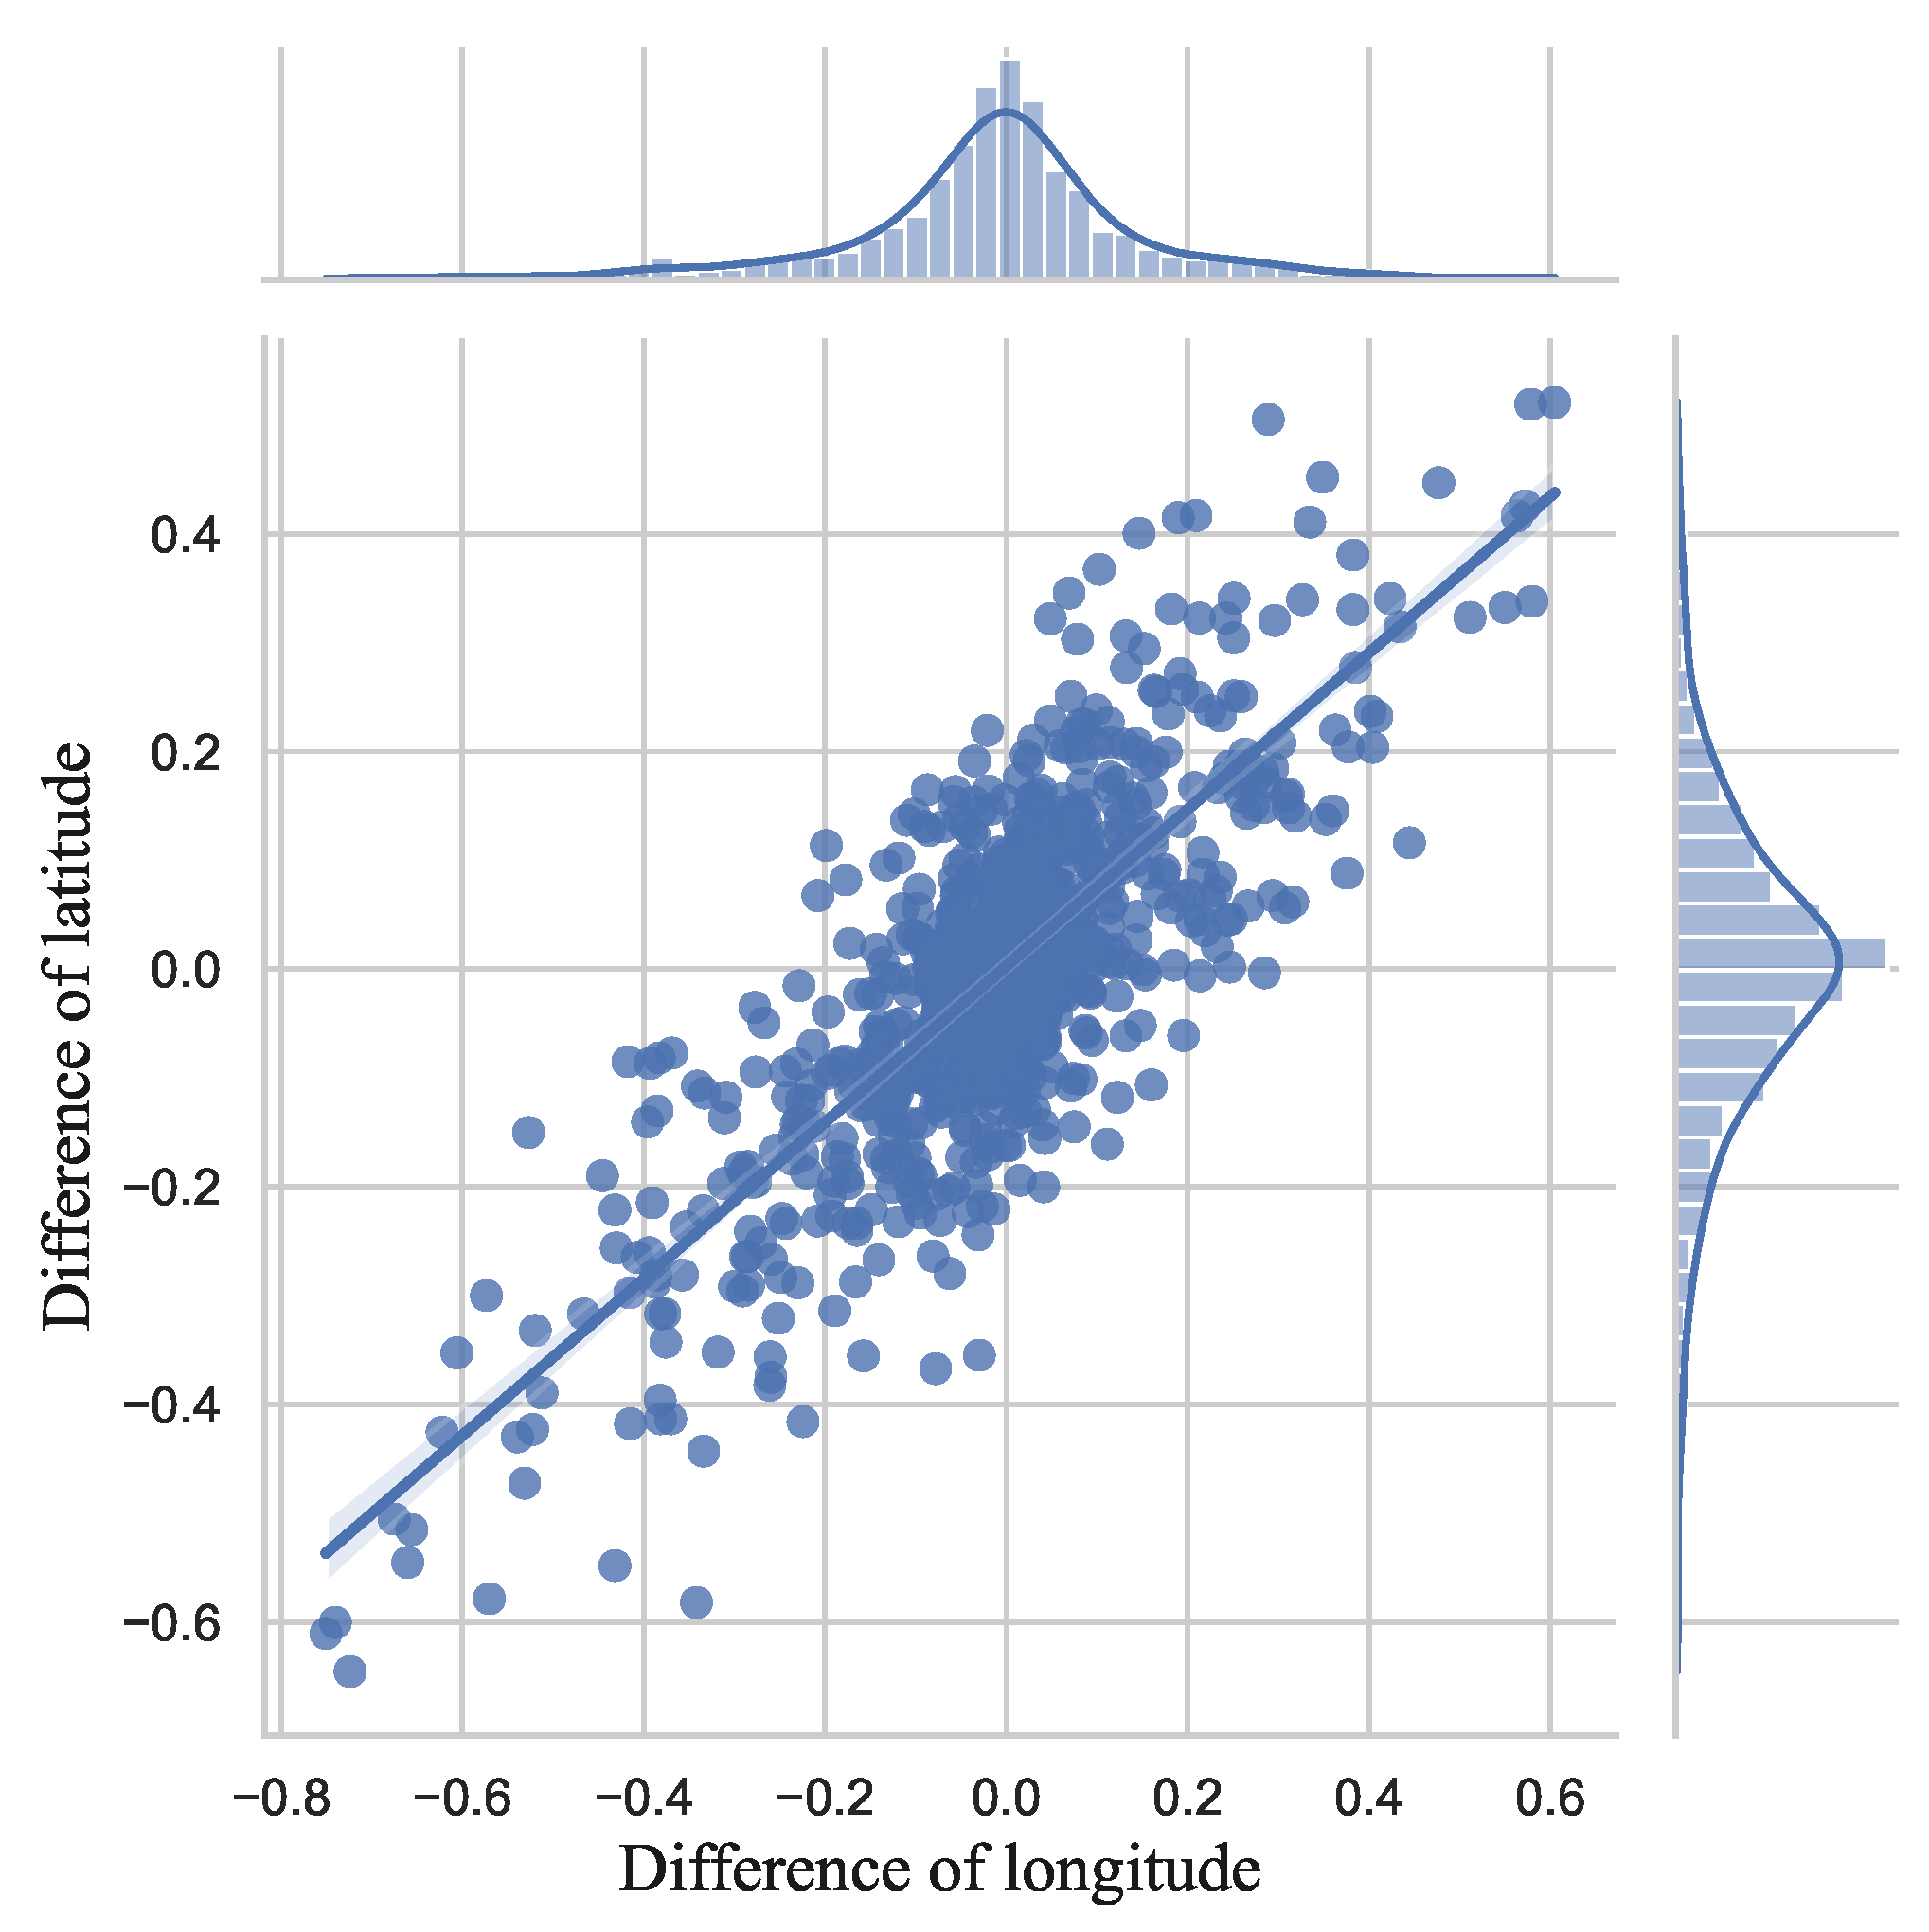
3.3. Spatial Positioning
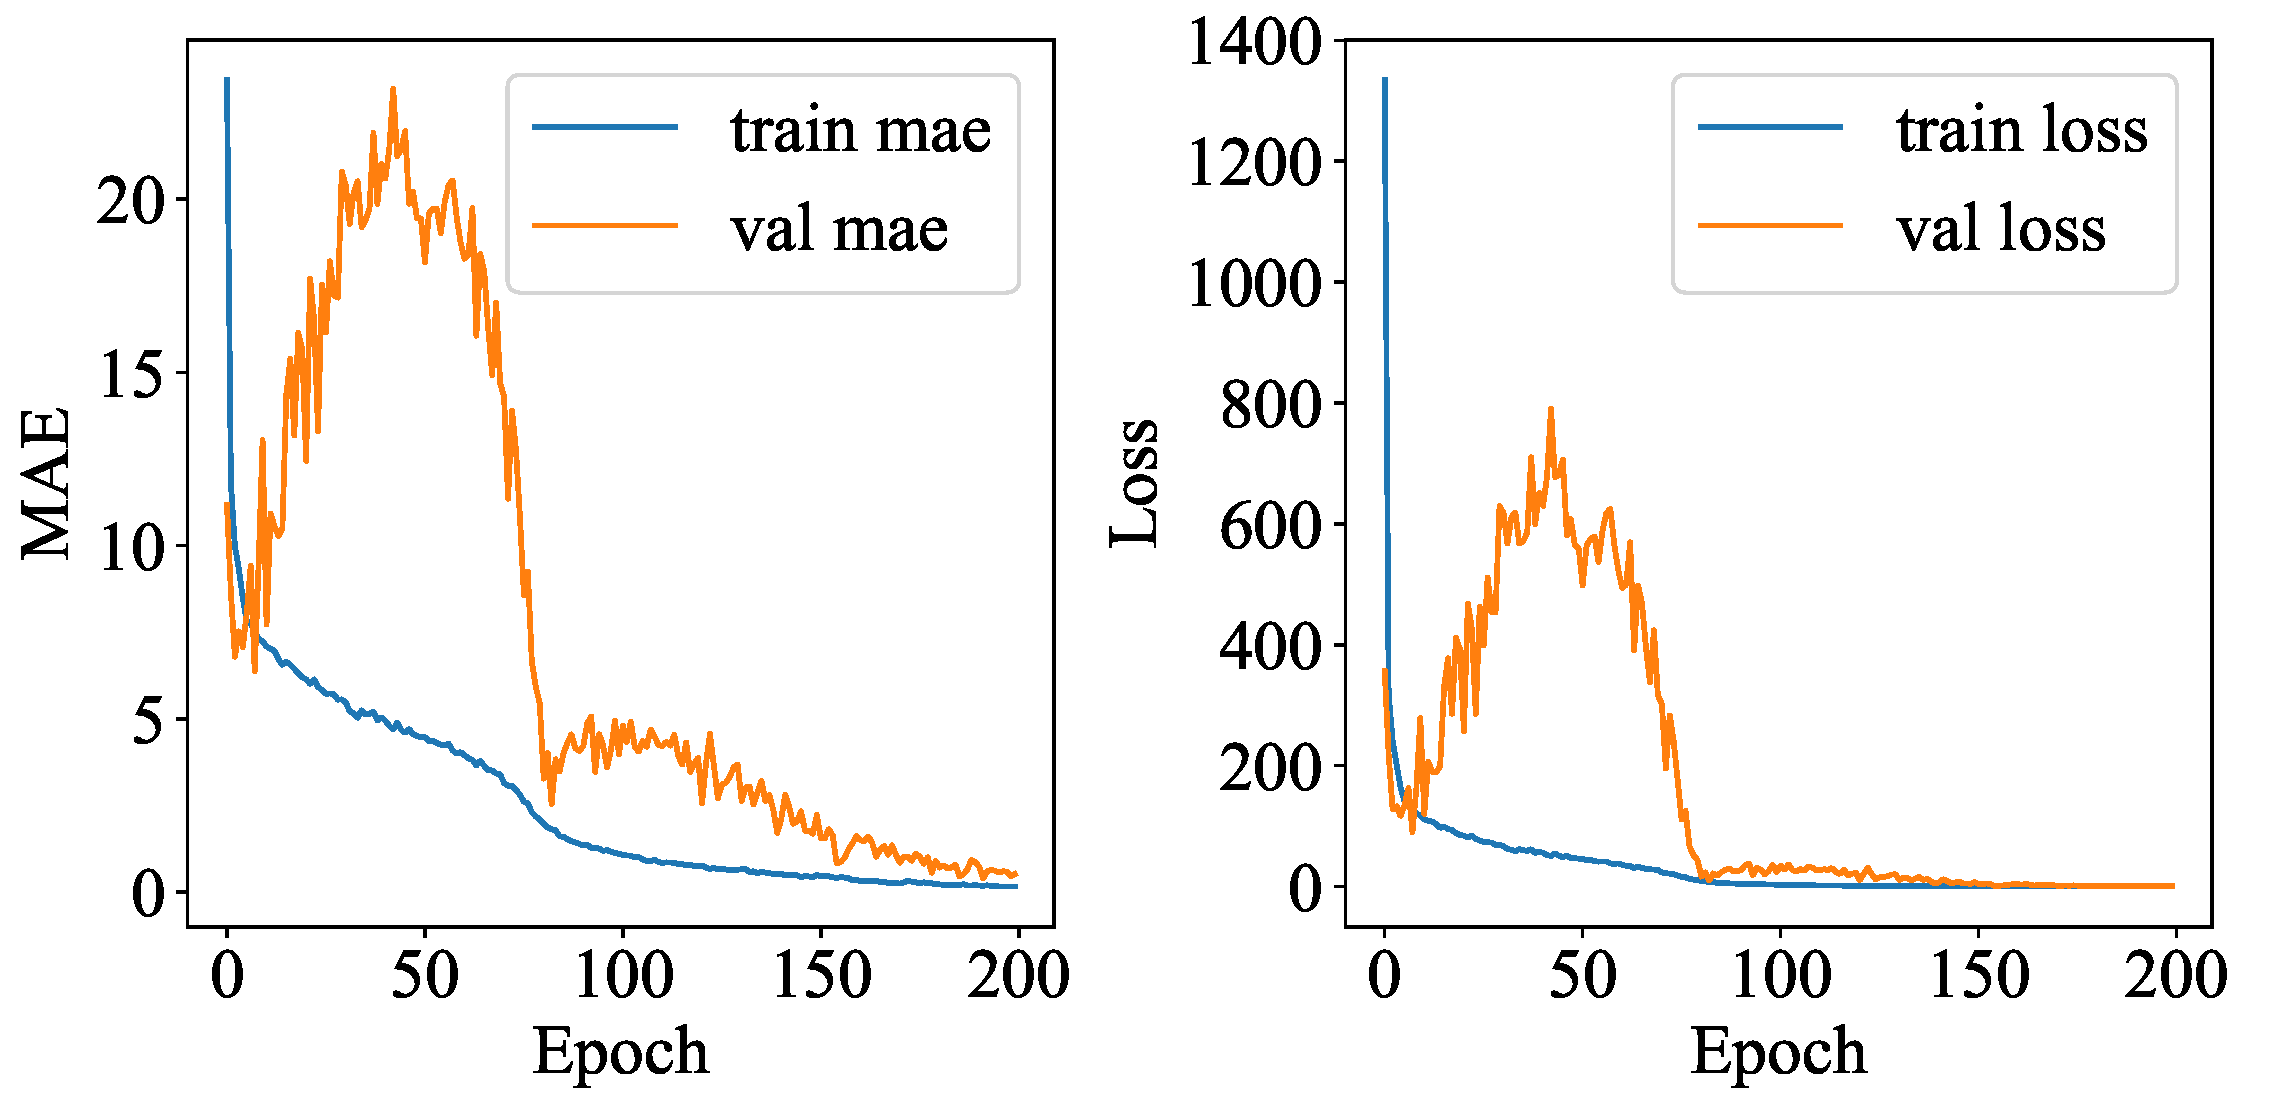
3.3.1. Performance of Lightning Localization
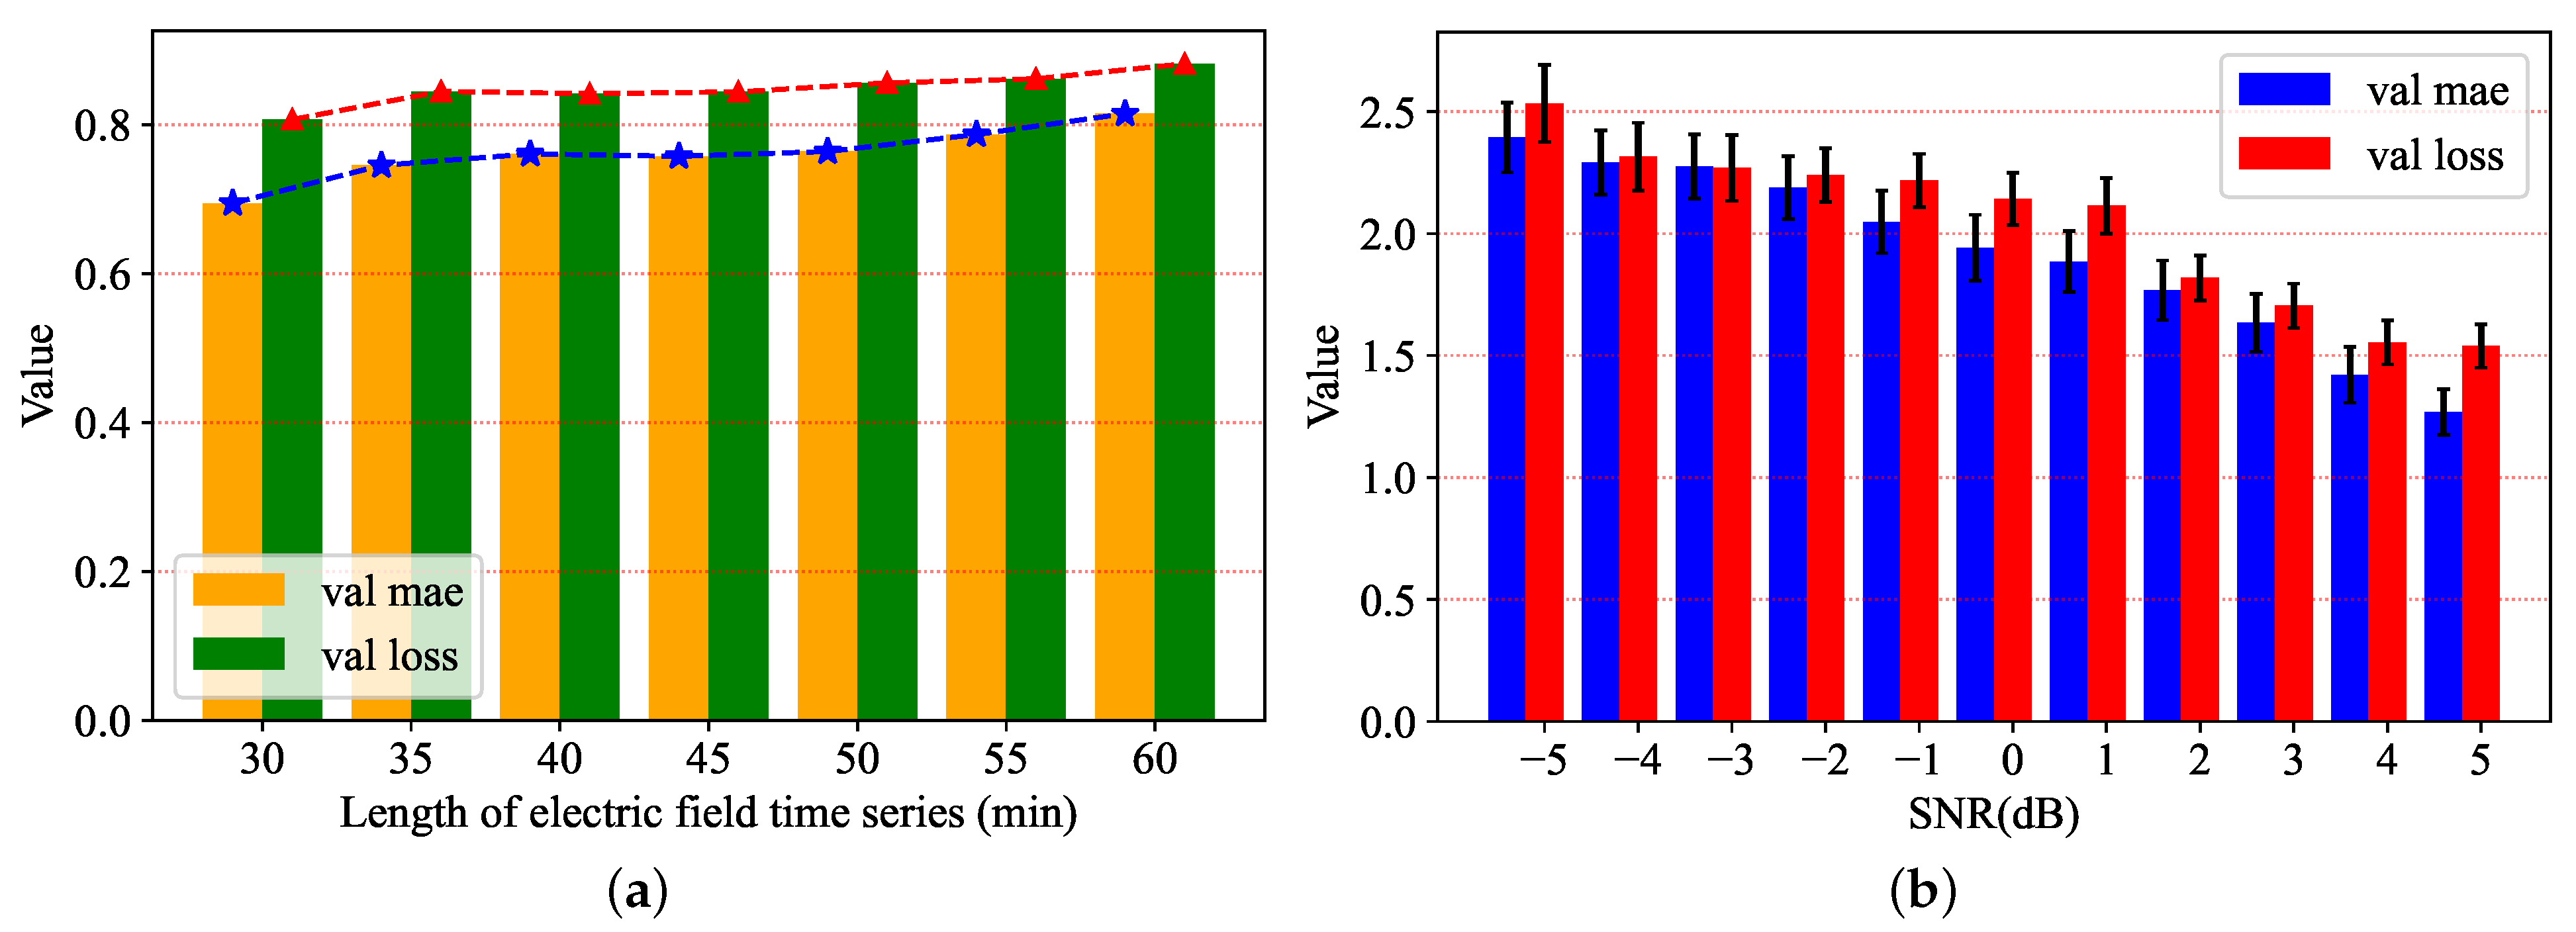
3.3.2. Evaluation for Different Length of Time Series
3.3.3. Effect of Noise Interference
4. Discussion
5. Conclusions
Author Contributions
Funding
Institutional Review Board Statement
Informed Consent Statement
Data Availability Statement
Acknowledgments
Conflicts of Interest
References
- Qie, X.; Liu, D.; Sun, Z. Recent advances in research of lightning meteorology. J. Meteorol. Res. 2014, 28, 983–1002. [Google Scholar] [CrossRef]
- Yu, X.; Zheng, Y. Advances in severe convection research and operation in China. J. Meteorol. Res. 2020, 34, 189–217. [Google Scholar] [CrossRef]
- Ivanova, A. International practices of thunderstorm nowcasting. Russ. Meteorol. Hydrol. 2019, 44, 756–763. [Google Scholar] [CrossRef]
- Bala, K.; Choubey, D.K.; Paul, S. Soft computing and data mining techniques for thunderstorms and lightning prediction: A survey. In Proceedings of the 2017 International conference of Electronics, Communication and Aerospace Technology (ICECA), Coimbatore, India, 20–22 April 2017; Volume 1, pp. 42–46. [Google Scholar]
- Hayward, L.; Whitworth, M.; Pepin, N.; Dorling, S. A comprehensive review of datasets and methodologies employed to produce thunderstorm climatologies. Nat. Hazards Earth Syst. Sci. 2020, 20, 2463–2482. [Google Scholar] [CrossRef]
- Moon, S.H.; Kim, Y.H. Forecasting lightning around the Korean Peninsula by postprocessing ECMWF data using SVMs and undersampling. Atmos. Res. 2020, 243, 105026. [Google Scholar] [CrossRef]
- Mostajabi, A.; Finney, D.L.; Rubinstein, M.; Rachidi, F. Nowcasting lightning occurrence from commonly available meteorological parameters using machine learning techniques. Npj Clim. Atmos. Sci. 2019, 2, 1–15. [Google Scholar] [CrossRef]
- Gharaylou, M.; Pegahfar, N.; Farahani, M.M. Influence of tilting effect on charge structure and lightning flash density in two different convective environments. Meteorol. Appl. 2020, 27, e1957. [Google Scholar] [CrossRef]
- Yang, B.; Gao, X.; Han, Y.; Zhang, Y.; Gao, T. A thunderstorm identification method combining the area of graupel distribution region and weather radar reflectivity. Earth Space Sci. 2020, 7, e2019EA000733. [Google Scholar] [CrossRef]
- Bao, R.; He, Z.; Zhang, Z. Application of lightning spatio-temporal localization method based on deep LSTM and interpolation. Measurement 2022, 189, 110549. [Google Scholar] [CrossRef]
- Zhang, Y.; Li, H.; Wang, Z.; Zhang, W.; Li, J. A preliminary study on time series forecast of fair-weather atmospheric electric field with WT-LSSVM method. J. Electrost. 2015, 75, 85–89. [Google Scholar] [CrossRef]
- Xing, H.; Yang, X.; Zhang, J. Thunderstorm cloud localization algorithm and performance analysis of a three-dimensional atmospheric electric field apparatus. J. Electr. Eng. Technol. 2019, 14, 2487–2495. [Google Scholar] [CrossRef]
- Wang, G.; Kim, W.H.; Kil, G.S.; Park, D.W.; Kim, S.W. An intelligent lightning warning system based on electromagnetic field and neural network. Energies 2019, 12, 1275. [Google Scholar] [CrossRef] [Green Version]
- Adzhieva, A.A.; Shapovalov, V.A.; Mashukov, I.K. Local sensing of atmospheric electric field around Nalchik City. In Proceedings of the Advanced Environmental, Chemical, and Biological Sensing Technologies XIV, Anaheim, CA, USA, 9–10 April 2017; Volume 10215, p. 102150W. [Google Scholar]
- Srivastava, A.; Mishra, M.; Kumar, M. Lightning alarm system using stochastic modelling. Nat. Hazards 2015, 75, 1–11. [Google Scholar] [CrossRef]
- Wang, Y.; Yao, H.; Zhao, S. Auto-encoder based dimensionality reduction. Neurocomputing 2016, 184, 232–242. [Google Scholar] [CrossRef]
- Lange, S.; Riedmiller, M. Deep auto-encoder neural networks in reinforcement learning. In Proceedings of the 2010 International Joint Conference on Neural Networks (IJCNN), Barcelona, Spain, 18–23 July 2010; pp. 1–8. [Google Scholar]
- Song, C.; Liu, F.; Huang, Y.; Wang, L.; Tan, T. Auto-encoder based data clustering. In Proceedings of the Iberoamerican Congress on Pattern Recognition, Havana, Cuba, 20–13 November 2013; pp. 117–124. [Google Scholar]
- Ma, B.J.; Liu, S.; Heidari, A.A. Multi-strategy ensemble binary hunger games search for feature selection. Knowl.-Based Syst. 2022, 248, 108787. [Google Scholar] [CrossRef]
- Ng, A. Sparse autoencoder. CS294A Lect. Notes 2011, 72, 1–19. [Google Scholar]
- Park, J.; Kim, J.k.; Jung, S.; Gil, Y.; Choi, J.I.; Son, H.S. ECG-signal multi-classification model based on squeeze-and-excitation residual neural networks. Appl. Sci. 2020, 10, 6495. [Google Scholar] [CrossRef]
- Wen, L.; Li, X.; Gao, L. A transfer convolutional neural network for fault diagnosis based on ResNet-50. Neural Comput. Appl. 2020, 32, 6111–6124. [Google Scholar] [CrossRef]
- He, K.; Zhang, X.; Ren, S.; Sun, J. Deep residual learning for image recognition. In Proceedings of the IEEE Conference on Computer Vision and Pattern Recognition, Las Vegas, NV, USA, 27–30 June 2016; pp. 770–778. [Google Scholar]
- Ioffe, S.; Szegedy, C. Batch normalization: Accelerating deep network training by reducing internal covariate shift. In Proceedings of the International Conference on Machine Learning, PMLR, Lille, France, 7–9 July 2015; pp. 448–456. [Google Scholar]
- Williams, E.R. CTR Wilson versus GC Simpson: Fifty years of controversy in atmospheric electricity. Atmos. Res. 2009, 91, 259–271. [Google Scholar] [CrossRef]
- Gardner, M.W.; Dorling, S. Artificial neural networks (the multilayer perceptron)—A review of applications in the atmospheric sciences. Atmos. Environ. 1998, 32, 2627–2636. [Google Scholar] [CrossRef]
- Murtagh, F. Multilayer perceptrons for classification and regression. Neurocomputing 1991, 2, 183–197. [Google Scholar] [CrossRef]
- Ma, B.J. Hybrid Adaptive Moth-Flame Optimizer and Opposition-Based Learning for Training Multilayer Perceptrons. In Integrating Meta-Heuristics and Machine Learning for Real-World Optimization Problems; Springer: Berlin/Heidelberg, Germany, 2022; pp. 273–319. [Google Scholar]
- Xu, W.; Zhang, C.; Ji, X.; Xing, H. Inversion of a thunderstorm cloud charging model based on a 3D atmospheric electric field. Appl. Sci. 2018, 8, 2642. [Google Scholar] [CrossRef] [Green Version]
- Wang, Z.H.; Zeng, Q.F.; Guo, F.X.; Xu, D.P.; Wang, H. A study of the electrostatic field networking in three isolated thunderstorms. In Applied Mechanics and Materials; Trans Tech Publ.: Zurich, Switzerland, 2013; Volume 239, pp. 775–784. [Google Scholar]
- Zeng, Q.; Wang, Z.; Guo, F.; Feng, M.; Zhou, S.; Wang, H.; Xu, D. The application of lightning forecasting based on surface electrostatic field observations and radar data. J. Electrost. 2013, 71, 6–13. [Google Scholar] [CrossRef]
- Pakdaman, M.; Naghab, S.S.; Khazanedari, L.; Malbousi, S.; Falamarzi, Y. Lightning prediction using an ensemble learning approach for northeast of Iran. J. Atmos. Sol.-Terr. Phys. 2020, 209, 105417. [Google Scholar] [CrossRef]
- Cai, L.; Hu, Q.; Wang, J.; Zou, X.; Li, Q.; Fan, Y. Characterization of electric field waveforms from triggered lightning at 58 m. J. Electrost. 2021, 109, 103537. [Google Scholar] [CrossRef]
- Zhang, Y.; Yang, S.; Lu, W.; Zheng, D.; Dong, W.; Li, B.; Chen, S.; Zhang, Y.; Chen, L. Experiments of artificially triggered lightning and its application in Conghua, Guangdong, China. Atmos. Res. 2014, 135, 330–343. [Google Scholar] [CrossRef]
- Miller, P.; Ellis, A.W.; Keighton, S. A preliminary assessment of using spatiotemporal lightning patterns for a binary classification of thunderstorm mode. Weather Forecast. 2015, 30, 38–56. [Google Scholar] [CrossRef]
- Mohee, F.M.; Miller, C. Climatology of thunderstorms for North Dakota, 2002–06. J. Appl. Meteorol. Climatol. 2010, 49, 1881–1890. [Google Scholar] [CrossRef]
- Carey, L.D.; Petersen, W.A.; Rutledge, S.A. Evolution of cloud-to-ground lightning and storm structure in the Spencer, South Dakota, tornadic supercell of 30 May 1998. Mon. Weather Rev. 2003, 131, 1811–1831. [Google Scholar] [CrossRef]
- Tessendorf, S.A.; Rutledge, S.A.; Wiens, K.C. Radar and lightning observations of normal and inverted polarity multicellular storms from STEPS. Mon. Weather Rev. 2007, 135, 3682–3706. [Google Scholar] [CrossRef] [Green Version]
- Gauthier, M.L.; Petersen, W.A.; Carey, L.D. Cell mergers and their impact on cloud-to-ground lightning over the Houston area. Atmos. Res. 2010, 96, 626–632. [Google Scholar] [CrossRef] [Green Version]


| Observations | Positive | Negative | |
|---|---|---|---|
| Prediction | Positive | TP | FP |
| Negative | FN | TN | |
| Length | Evaluation Metrics | |||
|---|---|---|---|---|
| Precision | Recall | F1 | Accuracy | |
| 30 | 0.8563 | 0.6945 | 0.7659 | 0.8068 |
| 35 | 0.9007 | 0.7454 | 0.8156 | 0.8447 |
| 40 | 0.8769 | 0.7607 | 0.8146 | 0.8416 |
| 45 | 0.8871 | 0.7575 | 0.8162 | 0.8440 |
| 50 | 0.9084 | 0.7640 | 0.8292 | 0.8561 |
| 55 | 0.8986 | 0.7868 | 0.8386 | 0.8616 |
| 60 | 0.9217 | 0.8147 | 0.8641 | 0.8817 |
| Methods | Evaluation Metrics (%) | |||
|---|---|---|---|---|
| Precision | Recall | Acc | ||
| Without Aug | 92.2 | 81.5 | 86.4 | 88.2 |
| After Aug | 90.8 | 89.8 | 90.3 | 90.4 |
| Original Resnet50 | 86.3 | 88.4 | 87.4 | 87.3 |
| CNN | 85.9 | 87.8 | 86.8 | 86.8 |
| LSTM | 84.3 | 86.2 | 85.3 | 85.2 |
| Ref. [31] | 85.4 | 82.7 | 84.0 | - |
| Ref. [32] | 88.0 | 87.2 | 86.7 | 86.8 |
| Time (min) | Number of Flashes | Case 1 | ||
|---|---|---|---|---|
| Geometric Center | Prediction Point | Distance (km) | ||
| 1 | 2 | (113.37, 23.51) | (113.32, 23.41) | 12.65 |
| 2 | - | - | - | - |
| 3 | 1 | (113.45, 23.69) | (113.45, 23.55) | 16.04 |
| 4 | - | - | - | - |
| 5 | - | - | (113.31, 23.22) | - |
| 6 | 1 | (113.30, 23.18) | - | - |
| 7 | - | - | (113.35, 23.25) | - |
| 8 | - | - | - | - |
| 9 | - | - | - | - |
| 10 | 1 | (113.12, 23.36) | (113.21, 23.41) | 10.76 |
| 11 | 1 | (113, 23.42) | (113.05, 23.38) | 7.34 |
| 12 | 1 | (113.17, 23.34) | (113.11, 23.38) | 7.64 |
| 13 | 1 | (113.05, 23.41) | (113.05, 23.31) | 10.59 |
| 14 | 1 | (113, 23.42) | (113.12, 23.42) | 12.23 |
| 15 | 1 | (113.02, 23.39) | - | - |
| 16 | - | - | (113.05, 23.35) | - |
| 17 | 2 | (113.07, 23.4) | (113.12, 23.34) | 7.98 |
| 18 | - | - | - | - |
| 19 | 2 | (113.03, 23.4) | (113.11, 23.44) | 9.08 |
| 20 | - | - | - | - |
| 21 | 1 | (113.03, 23.4) | (113.12, 23.39) | 9.07 |
| 22 | 2 | (113.3, 23.33) | - | - |
| 23 | 4 | (113.09, 23.37) | (113.06, 23.33) | 5.77 |
| 24 | - | - | - | - |
| 25 | 3 | (113.06, 23.39) | (113.08, 23.35) | 5 |
| 26 | 1 | (113.06, 23.38) | (113.09, 23.32) | 7.88 |
| 27 | 3 | (113.02, 23.41) | (113.11, 23.42) | 9.19 |
| 28 | 5 | (113.08, 23.34) | (113.13, 23.36) | 4.95 |
| 29 | 4 | (113.03, 23.41) | (113.06, 23.43) | 3.52 |
| 30 | 2 | (113.06, 23.39) | (113.09, 23.46) | 8.14 |
| 31 | 10 | (113.14, 23.29) | (113.04, 23.35) | 11.78 |
| Time (min) | Number of Flashes | Case 2 | ||
|---|---|---|---|---|
| Geometric Center | Prediction Point | Distance (km) | ||
| 1 | 2 | (113.52, 23.6) | (113.38, 23.52) | 16.9 |
| 2 | 2 | (113.27, 23.43) | (113.32, 23.43) | 5.14 |
| 3 | 2 | (113.27, 23.42) | (113.26, 23.39) | 3.09 |
| 4 | 7 | (113.24, 23.45) | (113.29, 23.45) | 5 |
| 5 | - | - | (113.35, 23.41) | - |
| 6 | - | - | - | - |
| 7 | 5 | (113.39, 23.36) | (113.36, 23.34) | 3.78 |
| 8 | 4 | (113.23, 23.34) | (113.33, 23.33) | 10.27 |
| 9 | - | - | - | - |
| 10 | 4 | (113.26, 23.31) | (113.30, 23.32) | 4.23 |
| 11 | 6 | (113.24, 23.35) | - | - |
| 12 | 6 | (113.3, 23.36) | (113.32, 23.36) | 1.9 |
| 13 | 2 | (113.27, 23.35) | (113.19, 23.38) | 9.15 |
| 14 | 9 | (113.25, 23.33) | - | - |
| 15 | - | - | - | - |
| 16 | 8 | (113.22, 23.34) | - | - |
| 17 | 5 | (113.25, 23.35) | (113.21, 23.36) | 3.96 |
| 18 | 3 | (113.26, 23.36) | (113.31, 23.36) | 5.52 |
| 19 | 4 | (113.26, 23.36) | (113.22, 23.32) | 5.75 |
| 20 | 2 | (113.25, 23.34) | (113.3, 23.34) | 5.12 |
| 21 | 7 | (113.24, 23.34) | (113.21, 23.4) | 7.38 |
| 22 | - | - | (113.21, 23.5) | - |
| 23 | 6 | (113.21, 23.38) | (113.18, 23.35) | 4.39 |
| 24 | 1 | (113.22, 23.35) | (113.12, 23.38) | 10.58 |
| 25 | 1 | (113.26, 23.27) | - | - |
| 26 | 4 | (113.28, 23.38) | (113.22, 23.46) | 10.6 |
| 27 | 9 | (113.2, 23.34) | (113.26, 23.33) | 6.04 |
| 28 | 17 | (113.22, 23.37) | (113.27, 23.32) | 7.32 |
| 29 | 7 | (113.21, 23.33) | (113.22, 23.29) | 4.33 |
| 30 | 9 | (113.22, 23.35) | - | - |
| 31 | 6 | (113.22, 23.37) | (113.24, 23.42) | 5.83 |
| Time (min) | Number of Flashes | Case 3 | ||
|---|---|---|---|---|
| Geometric Center | Prediction Point | Distance (km) | ||
| 1 | 1 | (113.23, 23.08) | (113.38, 23.26) | 25.03 |
| 2 | 3 | (113.54, 23.48) | (113.62, 23.59) | 14.53 |
| 3 | 8 | (113.56, 23.6) | (113.61, 23.62) | 5.24 |
| 4 | 11 | (113.36, 23.25) | (113.55, 23.52) | 35.69 |
| 5 | 4 | (113.57, 23.63) | (113.61, 23.65) | 4.51 |
| 6 | 14 | (113.65, 23.68) | (113.63, 23.62) | 6.94 |
| 7 | 14 | (113.67, 23.69) | - | - |
| 8 | 15 | (113.69, 23.76) | (113.68, 23.64) | 13.5 |
| 9 | 8 | (113.63, 23.68) | (113.58, 23.72) | 6.47 |
| 10 | 5 | (113.64, 23.68) | - | - |
| 11 | 17 | (113.64, 23.65) | (113.68, 23.72) | 8.72 |
| 12 | 2 | (113.74, 23.75) | (113.72, 23.64) | 12.46 |
| 13 | 16 | (113.66, 23.69) | (113.66, 23.64) | 5.04 |
| 14 | 30 | (113.61, 23.67) | (113.65, 23.62) | 7.4 |
| 15 | 18 | (113.64, 23.68) | - | - |
| 16 | 9 | (113.68, 23.71) | - | - |
| 17 | 14 | (113.64, 23.68) | (113.58, 23.62) | 8.83 |
| 18 | 7 | (113.62, 23.56) | (113.62, 23.6) | 4.24 |
| 19 | 45 | (113.62, 23.64) | - | - |
| 20 | 15 | (113.64, 23.66) | (113.52, 23.58) | 15.65 |
| 21 | 10 | (113.62, 23.61) | - | - |
| 22 | 5 | (113.65, 23.68) | (113.63, 23.62) | 6.94 |
| 23 | 11 | (113.6, 23.61) | (113.64, 23.6) | 4.66 |
| 24 | 15 | (113.63, 23.64) | (113.68, 23.58) | 8.3 |
| 25 | 9 | (113.59, 23.63) | (113.52, 23.56) | 10.4 |
| 26 | 9 | (113.65, 23.65) | (113.61, 23.56) | 10.89 |
| 27 | 16 | (113.66, 23.68) | (113.59, 23.68) | 6.66 |
| 28 | 11 | (113.57, 23.6) | (113.6, 23.59) | 3.57 |
| 29 | 10 | (113.58, 23.62) | - | - |
| 30 | 16 | (113.67, 23.56) | (113.55, 23.66) | 15.99 |
| 31 | 6 | (113.57, 23.57) | (113.61, 23.51) | 7.63 |
Publisher’s Note: MDPI stays neutral with regard to jurisdictional claims in published maps and institutional affiliations. |
© 2022 by the authors. Licensee MDPI, Basel, Switzerland. This article is an open access article distributed under the terms and conditions of the Creative Commons Attribution (CC BY) license (https://creativecommons.org/licenses/by/4.0/).
Share and Cite
Bao, R.; Zhang, Y.; Ma, B.J.; Zhang, Z.; He, Z. An Artificial Neural Network for Lightning Prediction Based on Atmospheric Electric Field Observations. Remote Sens. 2022, 14, 4131. https://doi.org/10.3390/rs14174131
Bao R, Zhang Y, Ma BJ, Zhang Z, He Z. An Artificial Neural Network for Lightning Prediction Based on Atmospheric Electric Field Observations. Remote Sensing. 2022; 14(17):4131. https://doi.org/10.3390/rs14174131
Chicago/Turabian StyleBao, Riyang, Yaping Zhang, Benedict J. Ma, Zhuoyu Zhang, and Zhenghao He. 2022. "An Artificial Neural Network for Lightning Prediction Based on Atmospheric Electric Field Observations" Remote Sensing 14, no. 17: 4131. https://doi.org/10.3390/rs14174131
APA StyleBao, R., Zhang, Y., Ma, B. J., Zhang, Z., & He, Z. (2022). An Artificial Neural Network for Lightning Prediction Based on Atmospheric Electric Field Observations. Remote Sensing, 14(17), 4131. https://doi.org/10.3390/rs14174131