Mapping Two Decades of New York State Forest Aboveground Biomass Change Using Remote Sensing
Abstract
:1. Introduction
2. Study Area and Datasets
2.1. Study Area
2.2. Forest Inventory and Analysis (FIA) Plots
2.3. Remote Sensing Data
2.3.1. Airborne LiDAR
2.3.2. Landsat Imagery
2.4. Climate and Topographic Data
3. Methods
3.1. Airborne LiDAR AGB Raster
- num.trees: The number of trees to aggregate. Values evaluated span 50–5000.
- mtry: Number of variables to split at in each node. The initial grid evaluates using 5–40% of variables at each split (for our current dataset, 3–40); our end model typically uses 40–50% of variables at each split.
- min.node.size: Minimum node size (number of observations in the terminal nodes of each tree).
- Higher values result in less complex trees (which can reduce overfitting with noisy predictors). Our initial grid evaluates values from 1 to 10, while our end model typically uses a value around 6 (with the default for regression being 5).
- replace: Boolean: Take samples with replacement? Tends to be TRUE.
- sample.fraction: What fraction of observations to sample. Our initial grid evaluates values from
- 0.33 to 0.8; this parameter tends towards either 0.2 or 0.8.
- splitrule: Whether to use maximally selected rank statistics (maxstat) or estimated response variances (variance) as a variable selection splitting rule.
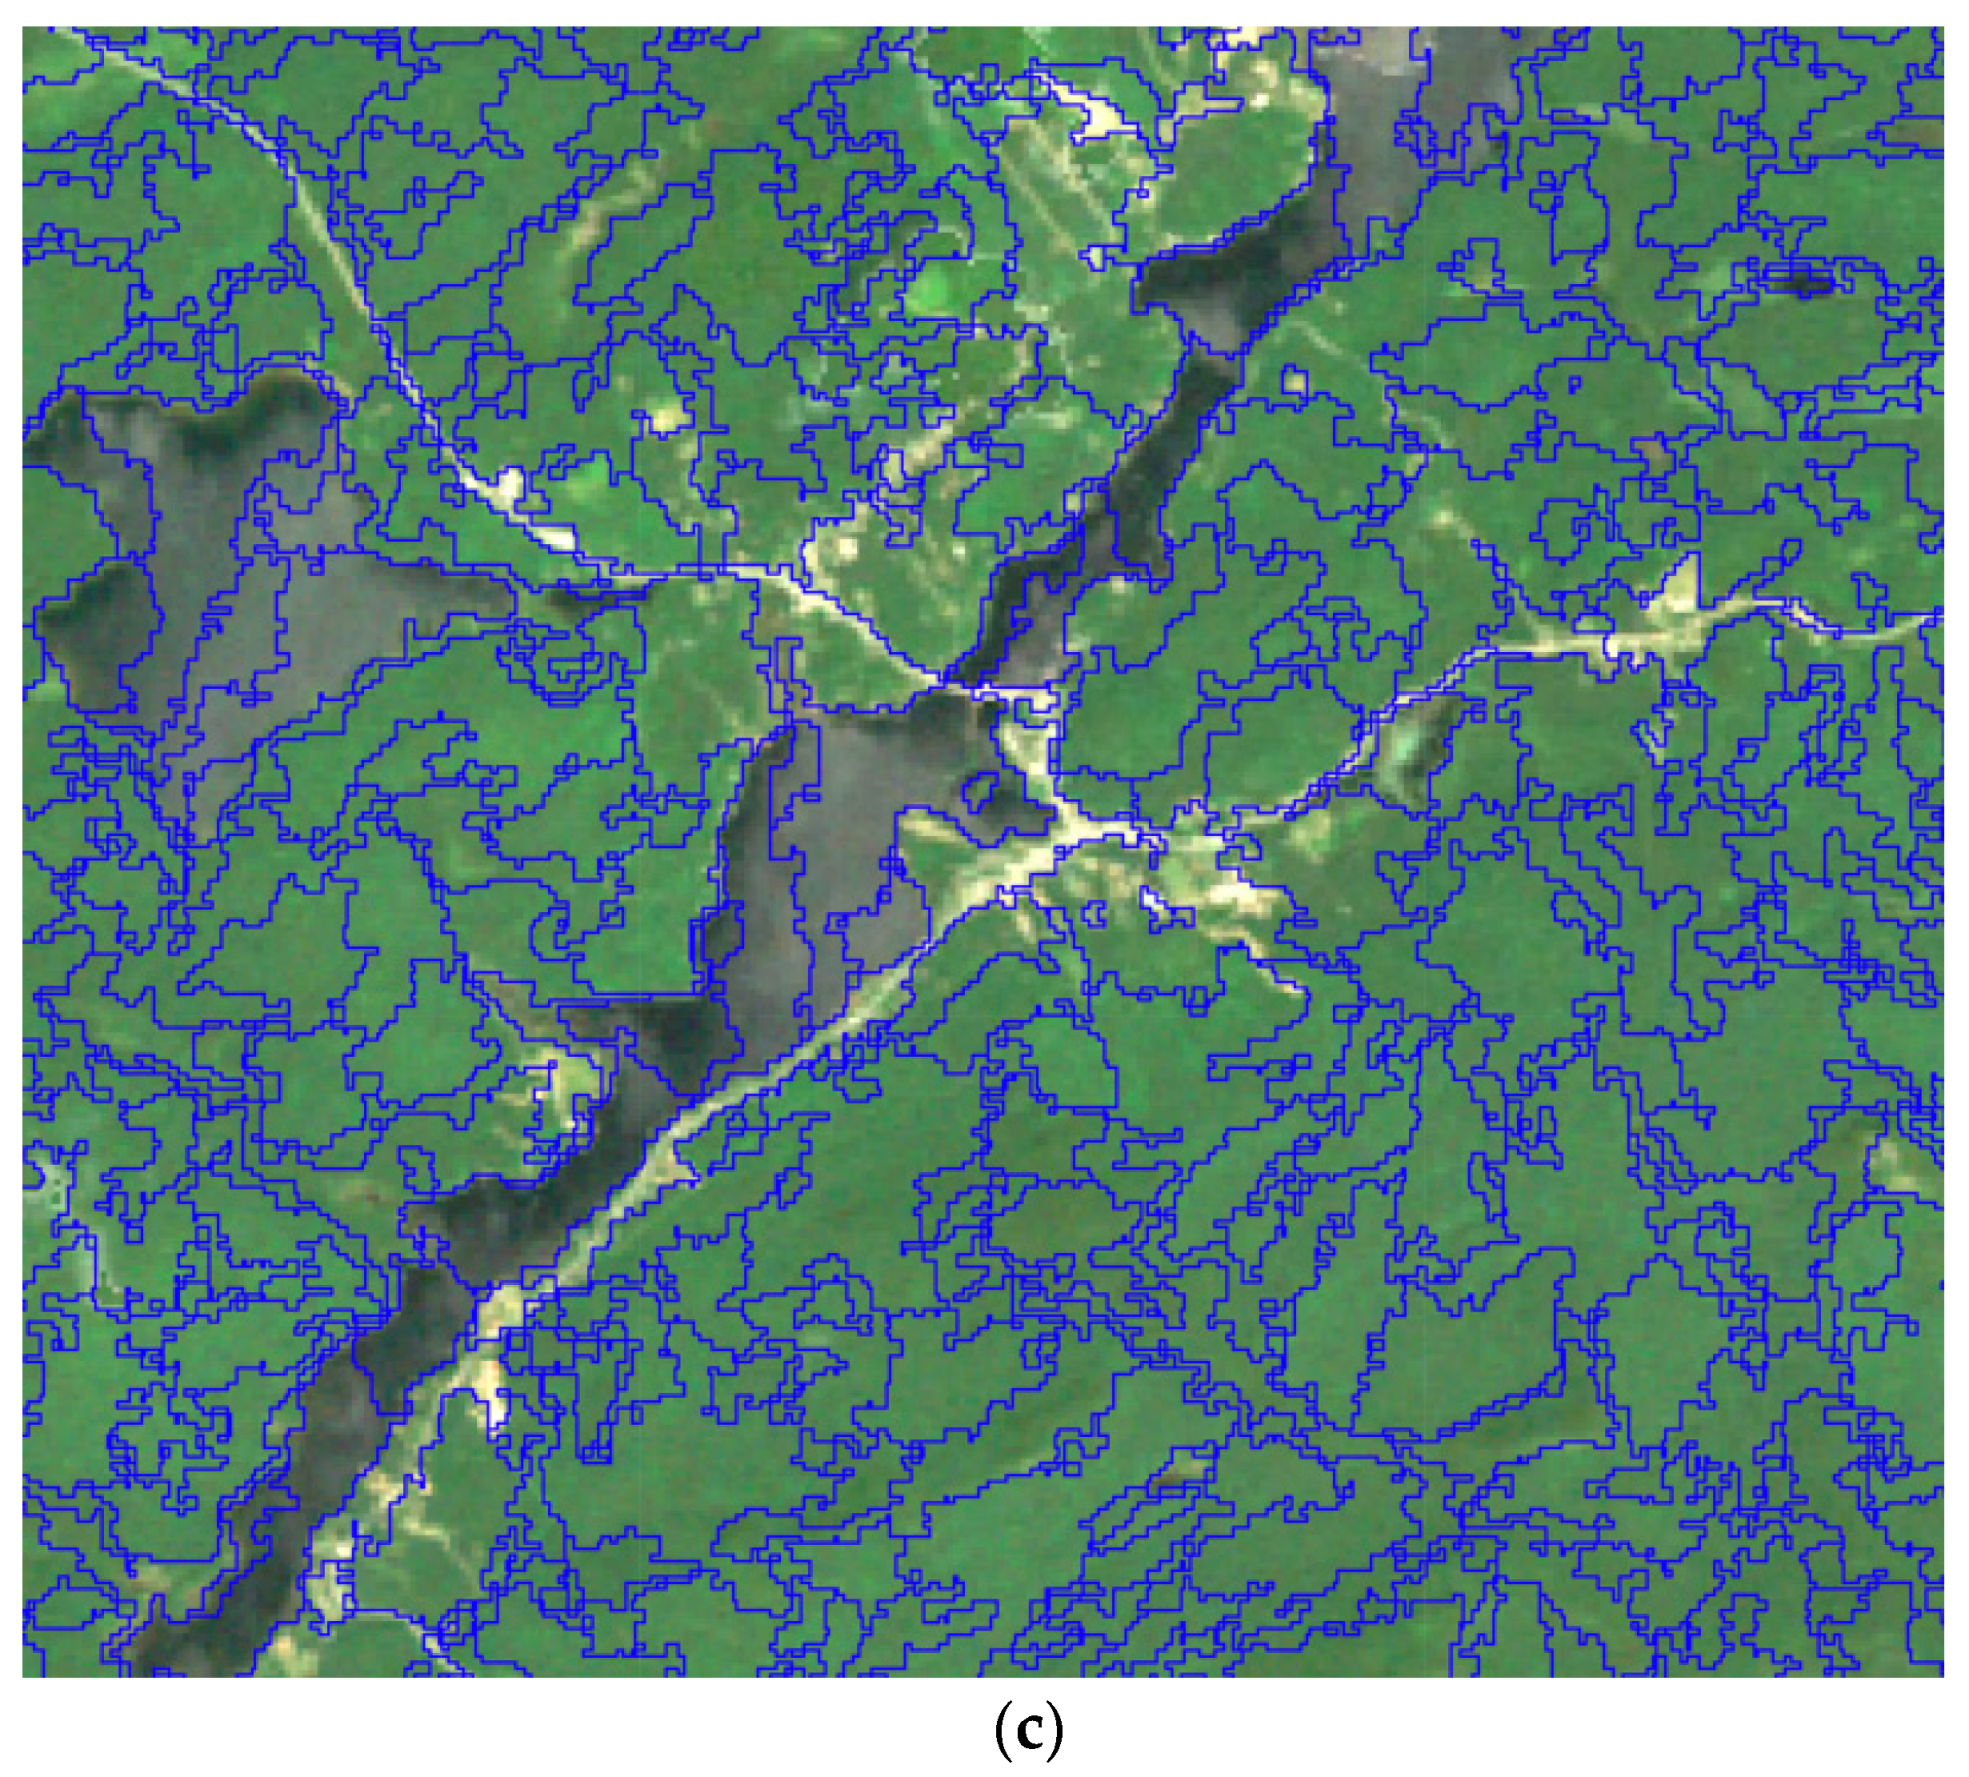
3.2. Object-Based Feature Extraction
3.3. Map Accuracy Assessment Using FIA Plots
4. Results and Discussion
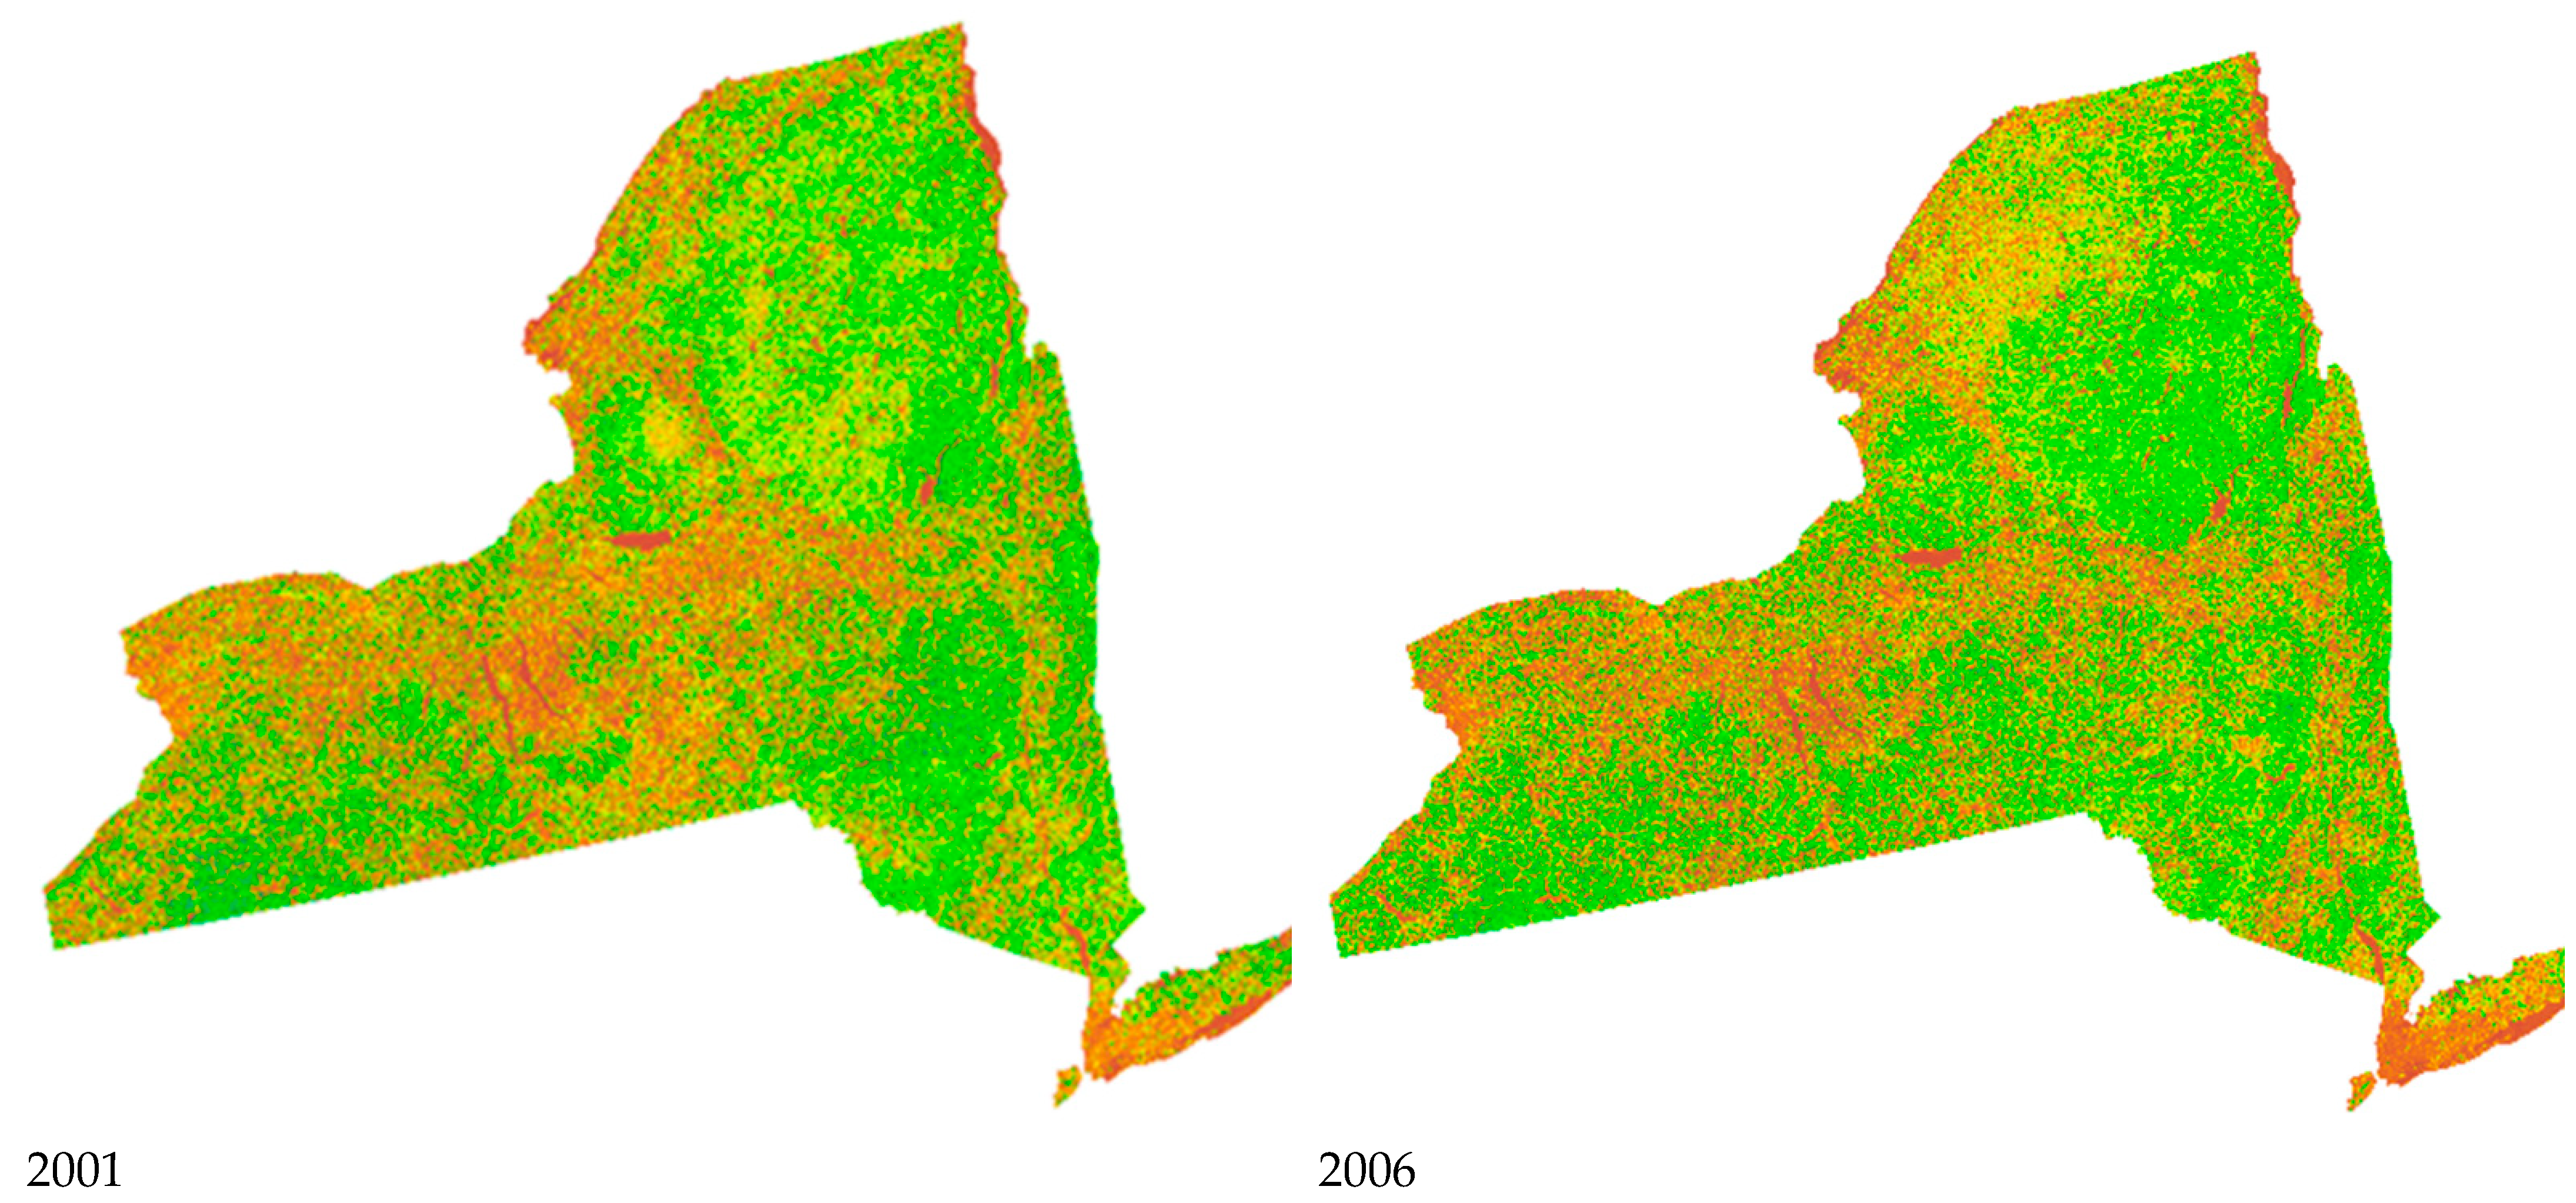
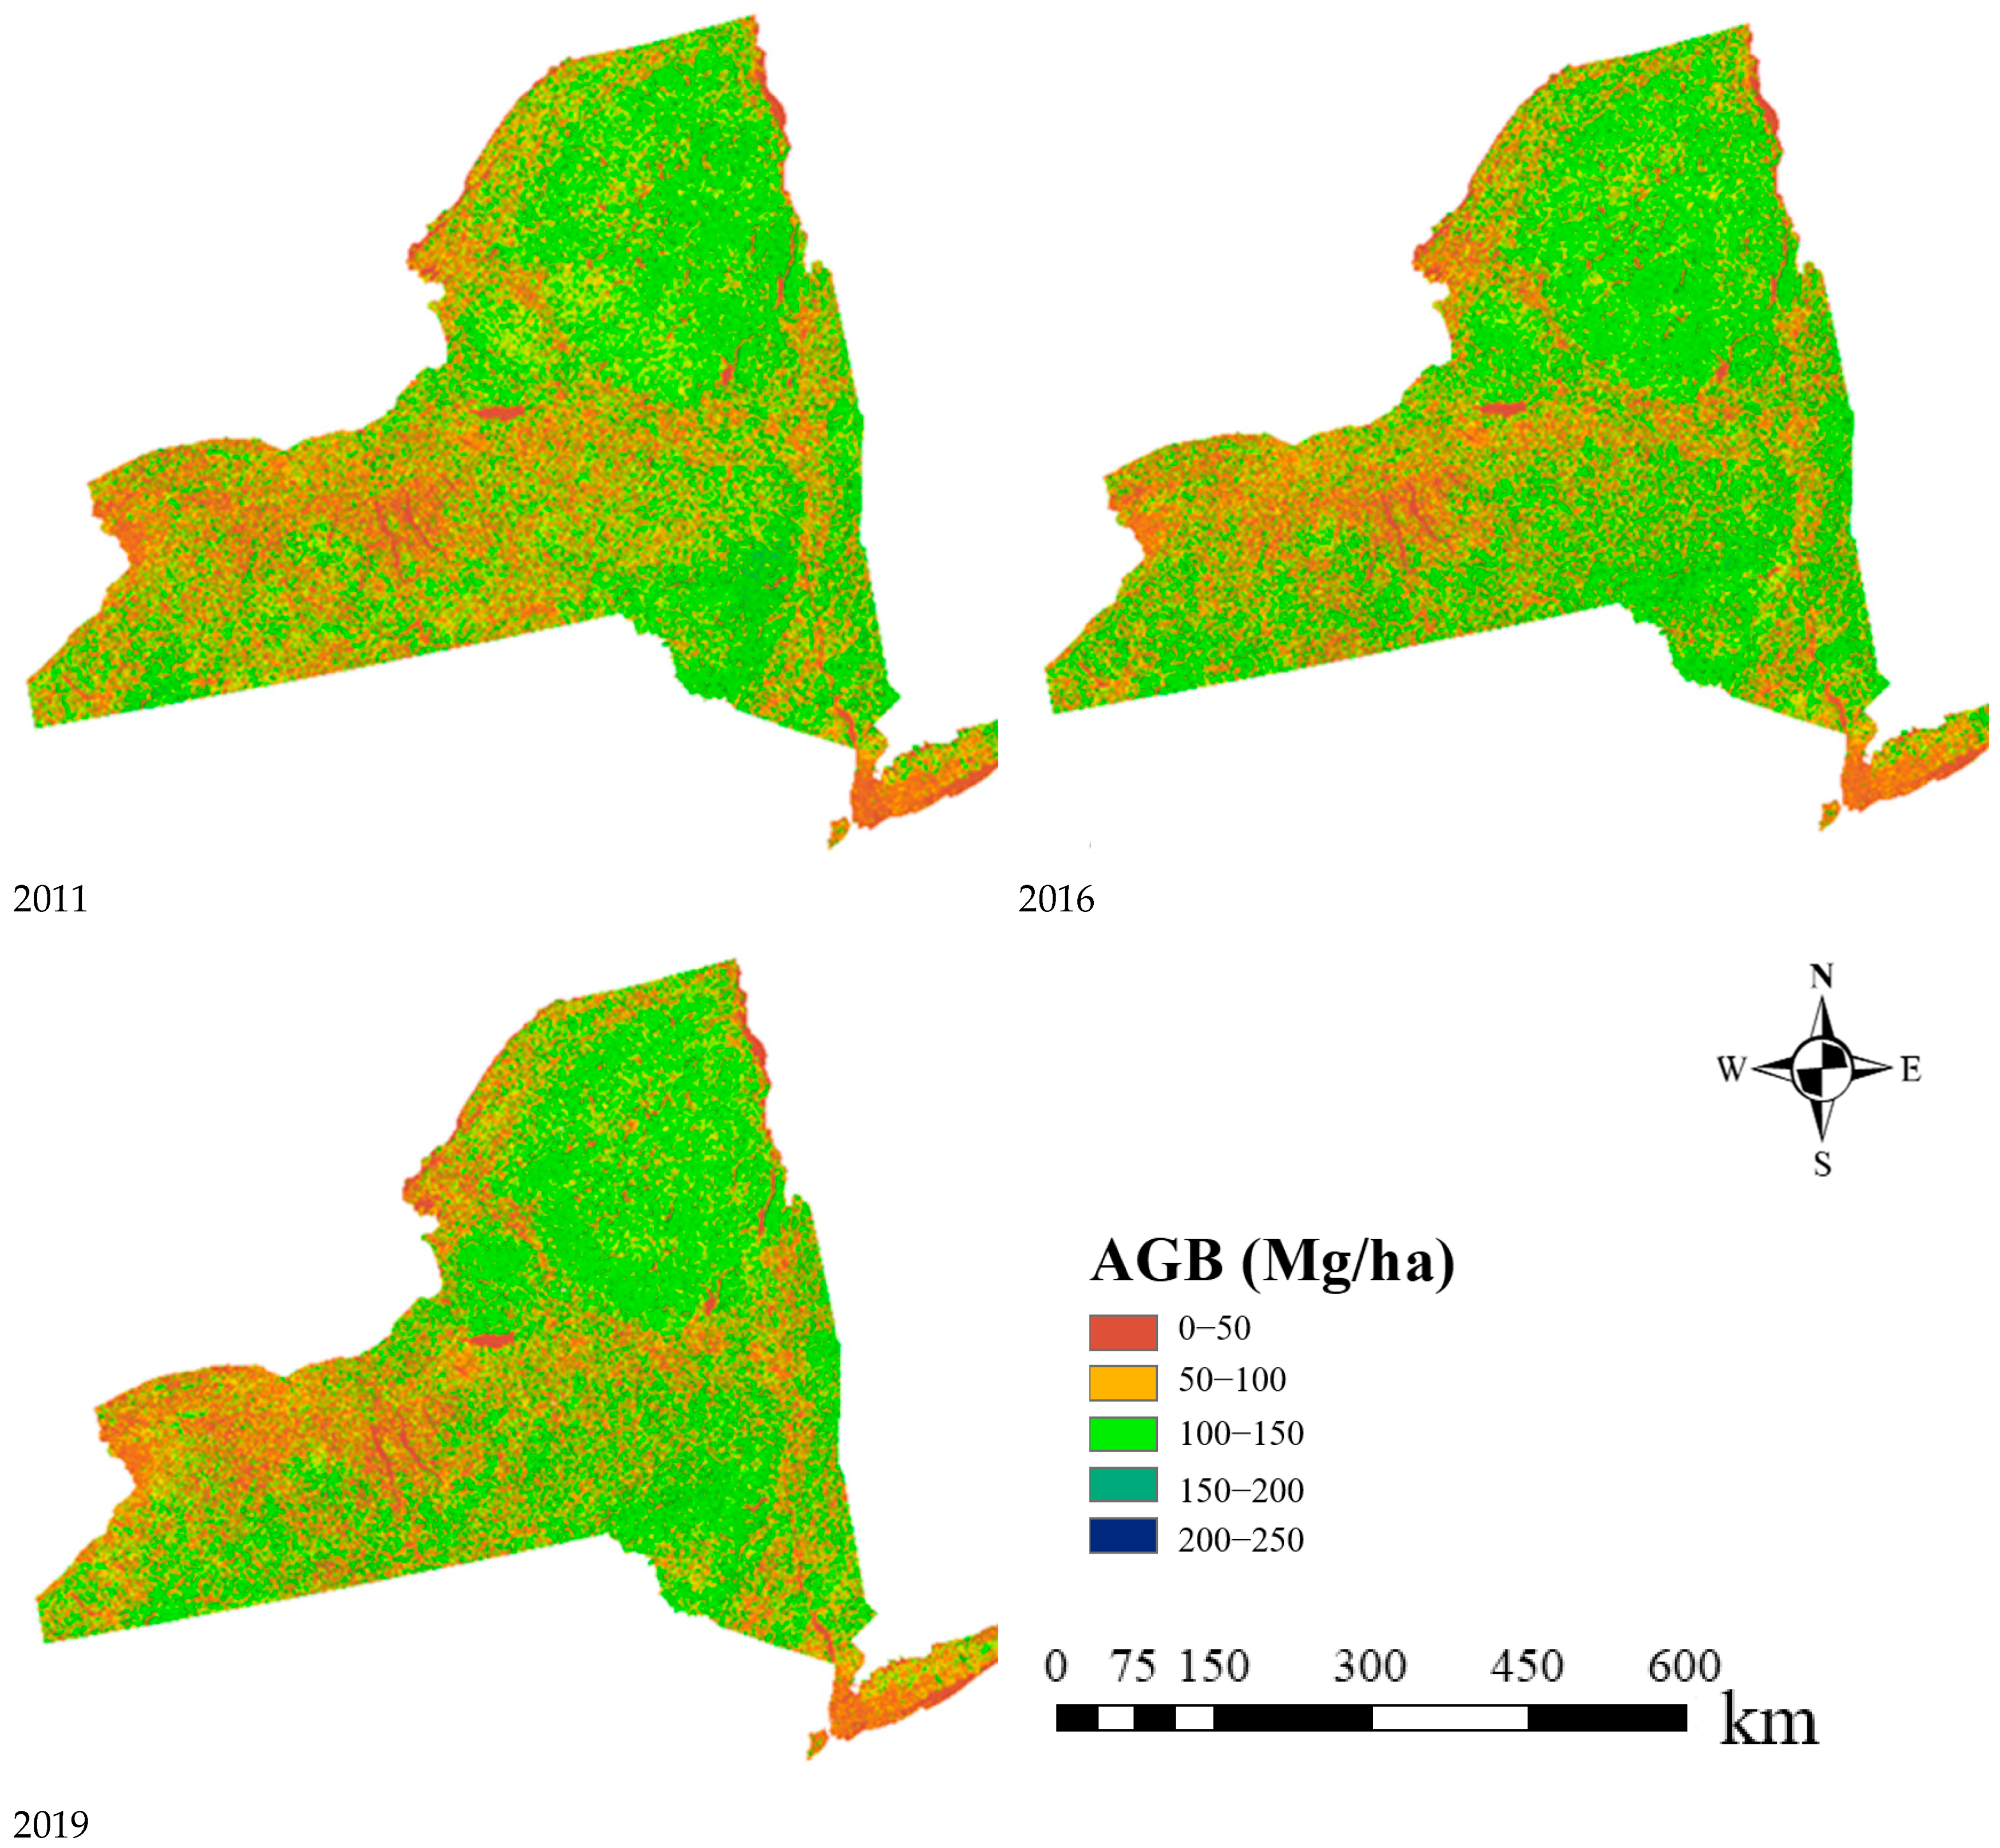
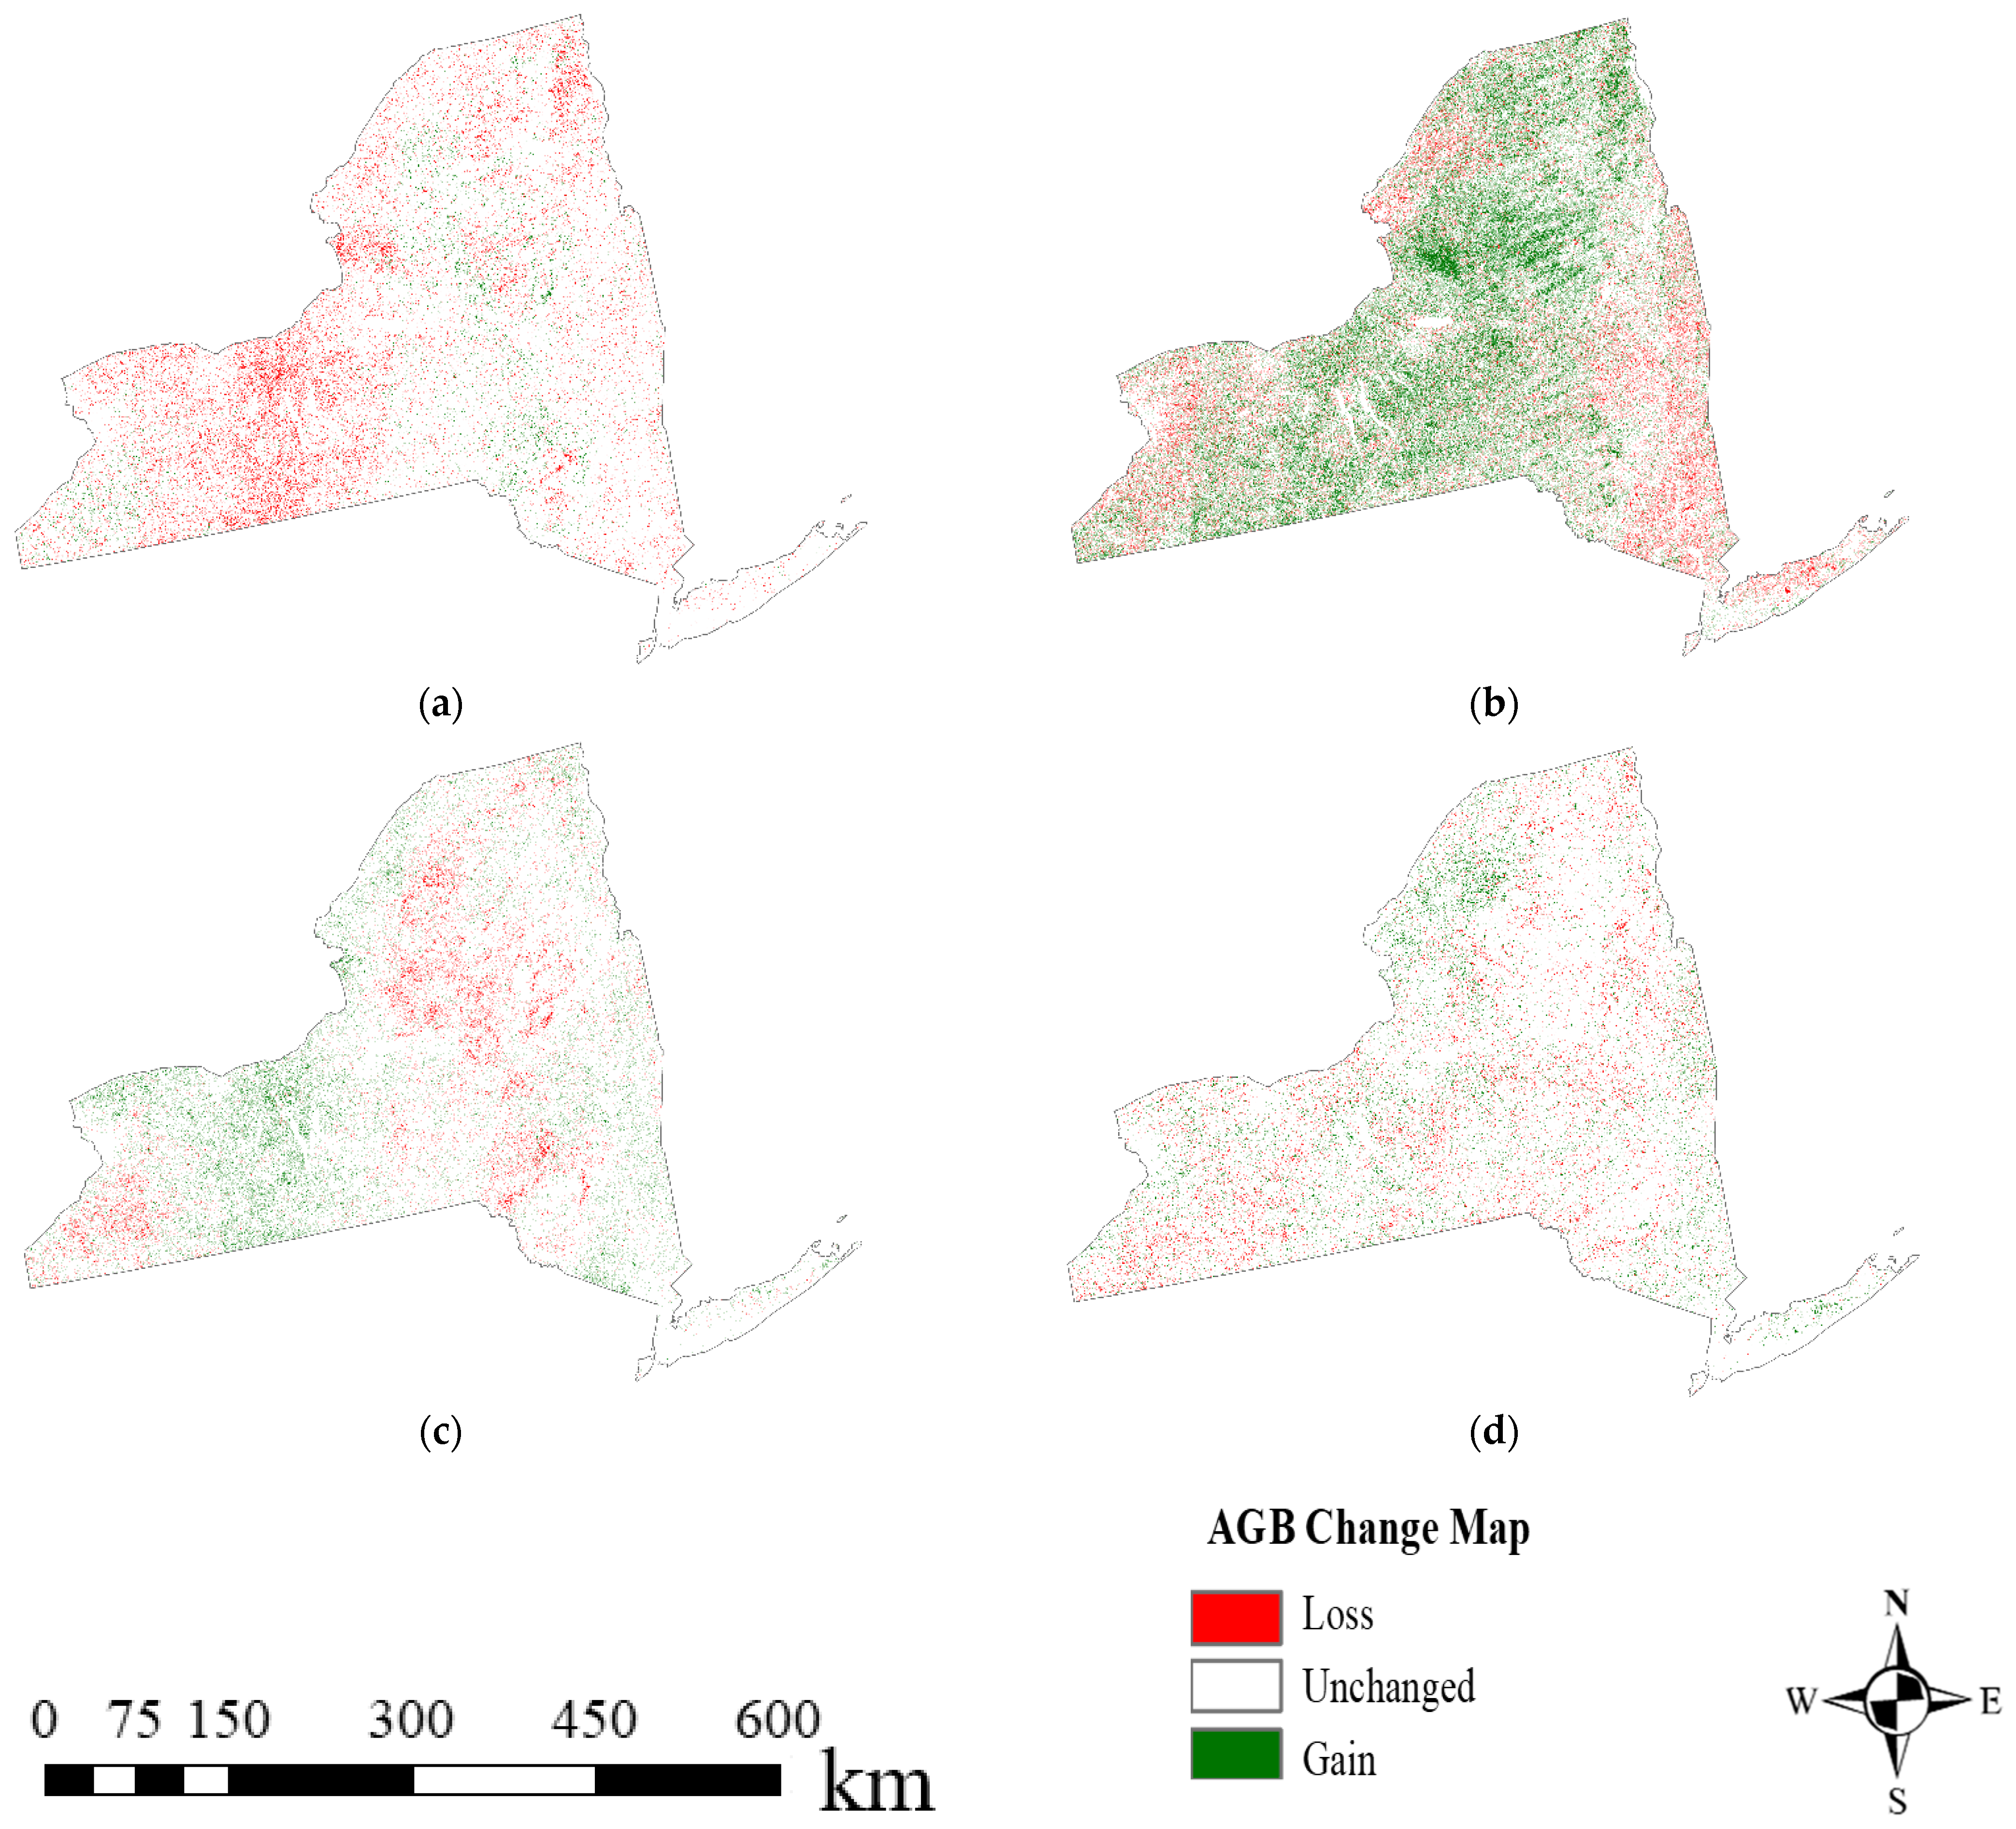
4.1. Historical AGB Mapping
4.2. Accuracy Assessment Using FIA Plots
5. Conclusions
Author Contributions
Funding
Data Availability Statement
Acknowledgments
Conflicts of Interest
References
- Food and Agriculture Organization of the United Nations. Global Forest Resources Assessment 2020—Key Findings; Food and Agriculture Organization of the United Nations: Rome, Italy, 2020. [Google Scholar]
- Chavan, B.; Rasal, G. Total sequestered carbon stock of Mangifera indica. J. Environ. Earth Sci. 2012, 2, 37–49. [Google Scholar]
- Zhu, Y.; Feng, Z.; Lu, J.; Liu, J. Estimation of Forest Biomass in Beijing (China) Using Multisource Remote Sensing and Forest Inventory Data. Forests 2020, 11, 163. [Google Scholar] [CrossRef] [Green Version]
- Siry, J.P.; Cubbage, F.W.; Ahmed, M.R. Sustainable forest management: Global trends and opportunities. For. Policy Econ. 2005, 7, 551–561. [Google Scholar] [CrossRef]
- Rodríguez-Veiga, P.; Wheeler, J.; Louis, V.; Tansey, K.; Balzter, H. Quantifying Forest Biomass Carbon Stocks from Space. Curr. For. Rep. 2017, 3, 1–18. [Google Scholar] [CrossRef] [Green Version]
- Saatchi, S. SAR methods for mapping and monitoring forest biomass. In SAR Handbook: Comprehensive Methodologies for Forest Monitoring and Biomass Estimation; Flores, A., Herndon, K., Thapa, R., Cherrington, E., Eds.; SERVIR Global Science: Huntsville AL, USA, 2019; pp. 207–246. [Google Scholar]
- Laney, D. 3D data management: Controlling data volume, velocity and variety. META Group Res. Note 2001, 6, 1. [Google Scholar]
- Amani, M.; Ghorbanian, A.; Ahmadi, S.A.; Kakooei, M.; Moghimi, A.; Mirmazloumi, S.M.; Moghaddam, S.H.A.; Mahdavi, S.; Ghahremanloo, M.; Parsian, S.; et al. Google Earth Engine Cloud Computing Platform for Remote Sensing Big Data Applications: A Comprehensive Review. IEEE J. Sel. Top. Appl. Earth Obs. Remote Sens. 2020, 13, 5326–5350. [Google Scholar] [CrossRef]
- Tamiminia, H.; Salehi, B.; Mahdianpari, M.; Quackenbush, L.; Adeli, S.; Brisco, B. Google Earth Engine for geo-big data applications: A meta-analysis and systematic review. ISPRS J. Photogramm. Remote Sens. 2020, 164, 152–170. [Google Scholar] [CrossRef]
- Hemati, M.; Hasanlou, M.; Mahdianpari, M.; Mohammadimanesh, F. A Systematic Review of Landsat Data for Change Detection Applications: 50 Years of Monitoring the Earth. Remote Sens. 2021, 13, 2869. [Google Scholar] [CrossRef]
- Gorelick, N.; Hancher, M.; Dixon, M.; Ilyushchenko, S.; Thau, D.; Moore, R. Google Earth Engine: Planetary-scale geospatial analysis for everyone. Remote Sens. Environ. 2017, 202, 18–27. [Google Scholar] [CrossRef]
- Hudak, A.T.; Fekety, P.A.; Kane, V.R.; Kennedy, R.E.; Filippelli, S.K.; Falkowski, M.J.; Tinkham, W.T.; Smith, A.M.S.; Crookston, N.L.; Domke, G.M.; et al. A carbon monitoring system for mapping regional, annual aboveground biomass across the northwestern USA. Environ. Res. Lett. 2020, 15, 095003. [Google Scholar] [CrossRef]
- De Jong, S.M.; Pebesma, E.J.; Lacaze, B. Above-ground biomass assessment of Mediterranean forests us-ing airborne imaging spectrometry: The DAIS Peyne experiment. Int. J. Remote Sens. 2003, 24, 1505–1520. [Google Scholar] [CrossRef]
- Kelsey, K.C.; Neff, J.C. Estimates of Aboveground Biomass from Texture Analysis of Landsat Imagery. Remote Sens. 2014, 6, 6407–6422. [Google Scholar] [CrossRef] [Green Version]
- Luo, S.; Wang, C.; Xi, X.; Nie, S.; Fan, X.; Chen, H.; Ma, D.; Liu, J.; Zou, J.; Lin, Y.; et al. Estimating forest aboveground biomass using small-footprint full-waveform airborne LiDAR data. Int. J. Appl. Earth Obs. Geoinf. ITC J. 2019, 83, 101922. [Google Scholar] [CrossRef]
- Hussin, Y.A.; Gilani, H.; van Leeuwen, L.; Murthy, M.S.R.; Shah, R.; Baral, S.; Tsendbazar, N.-E.; Shrestha, S.; Shah, S.K.; Qamer, F.M. Evaluation of object-based image analysis techniques on very high-resolution satellite image for biomass estimation in a watershed of hilly forest of Nepal. Appl. Geomat. 2014, 6, 59–68. [Google Scholar] [CrossRef]
- Urbazaev, M.; Thiel, C.; Cremer, F.; Dubayah, R.; Migliavacca, M.; Reichstein, M.; Schmullius, C. Estimation of forest aboveground biomass and uncertainties by integration of field measurements, airborne LiDAR, and SAR and optical satellite data in Mexico. Carbon Balance Manag. 2018, 13, 5. [Google Scholar] [CrossRef] [Green Version]
- Mutanga, O.; Adam, E.; Cho, M.A. High density biomass estimation for wetland vegetation using WorldView-2 imagery and random forest regression algorithm. Int. J. Appl. Earth Obs. Geoinf. 2012, 18, 399–406. [Google Scholar] [CrossRef]
- Salehi, B.; Daneshfar, B.; Davidson, A.M. Accurate crop-type classification using multi-temporal optical and multi-polarization SAR data in an object-based image analysis framework. Int. J. Remote Sens. 2017, 38, 4130–4155. [Google Scholar] [CrossRef]
- Hirata, Y.; Furuya, N.; Saito, H.; Pak, C.; Leng, C.; Sokh, H.; Ma, V.; Kajisa, T.; Ota, T.; Mizoue, N. Object-Based Mapping of Aboveground Biomass in Tropical Forests Using LiDAR and Very-High-Spatial-Resolution Satellite Data. Remote Sens. 2018, 10, 438. [Google Scholar] [CrossRef] [Green Version]
- Silveira, E.M.O.; Silva, S.H.G.; Acerbi-Junior, F.W.; Carvalho, M.C.; Carvalho, L.M.T.; Scolforo, J.R.S.; Wulder, M.A. Object-based random forest modelling of aboveground forest biomass outperforms a pixel-based approach in a heterogeneous and mountain tropical environment. Int. J. Appl. Earth Obs. Geoinf. 2019, 78, 175–188. [Google Scholar] [CrossRef]
- Zhang, C.; Denka, S.; Cooper, H.; Mishra, D. Quantification of sawgrass marsh aboveground biomass in the coastal Everglades using object-based ensemble analysis and Landsat data. Remote Sens. Environ. 2018, 204, 366–379. [Google Scholar] [CrossRef]
- Chen, L.; Ren, C.; Bao, G.; Zhang, B.; Wang, Z.; Liu, M.; Man, W.; Liu, J. Improved Object-Based Estimation of Forest Aboveground Biomass by Integrating LiDAR Data from GEDI and ICESat-2 with Multi-Sensor Images in a Heterogeneous Mountainous Region. Remote Sens. 2022, 14, 2743. [Google Scholar] [CrossRef]
- Pham, L.T.; Brabyn, L. Monitoring mangrove biomass change in Vietnam using SPOT images and an object-based approach combined with machine learning algorithms. ISPRS J. Photogramm. Remote Sens. 2017, 128, 86–97. [Google Scholar] [CrossRef]
- Forests—NYS Dept. of Environmental Conservation. Available online: https://www.dec.ny.gov/lands/309.html (accessed on 13 December 2021).
- Albright, T.A. Forests of New York, 2017. In Resource Update FS-170; US Department of Agriculture, Forest Service, Northern Research Station: Newtown Square, PA, USA, 2018; pp. 1–4. [Google Scholar]
- Riemann, R.; Wilson, B.T.; Lister, A.; Parks, S. An effective assessment protocol for continuous geospatial datasets of forest characteristics using USFS Forest Inventory and Analysis (FIA) data. Remote Sens. Environ. 2010, 114, 2337–2352. [Google Scholar] [CrossRef]
- Forest Inventory and Analysis National Program. Available online: https://www.fia.fs.fed.us/ (accessed on 13 December 2021).
- Jenkins, J.C.; Chojnacky, D.C.; Heath, L.S.; Birdsey, R.A. National-scale biomass estimators for United States tree species. For. Sci. 2003, 49, 12–35. [Google Scholar]
- Burrill, E.A.; Wilson, A.M.; Turner, J.A.; Pugh, S.A.; Menlove, J.; Christiansen, G.; Conkling, B.L.; David, W. The Forest Inventory and Analysis Database: Database Description and User Guide Version 8.0 for Phase 2; US Department of Agriculture, Forest Service: Jackson, WY, USA, 2018; p. 946.
- NYS-LIDAR-Coverage. Available online: https://gis.ny.gov/elevation/lidar-coverage.htm (accessed on 13 December 2021).
- LAS. Available online: https://gis.ny.gov/elevation/metadata/Ulster-Dutchess-Orange-Counties-NY-Classified-LAS.xml (accessed on 13 December 2021).
- NY_WarrenWashingtonEssex_Spring2015. Available online: https://gis.ny.gov/elevation/metadata/Warren-Washington-Essex-2014-15.xml (accessed on 13 December 2021).
- Allegany and Steuben Counties, New York Lidar; Overall Project Metadata. Available online: https://gis.ny.gov/elevation/metadata/2016NY-Allegany-Steuben-Classified-Point-Cloud-USGSv1.2.xml (accessed on 13 December 2021).
- LIDAR Collection (QL2) for Cayuga County and Most of Oswego County, New York Lidar; Classified Point Cloud. Available online: https://gis.ny.gov/elevation/metadata/2018NY-Cayuga-Oswego-Classified-Point-Cloud.xml (accessed on 13 December 2021).
- Young, N.E.; Anderson, R.S.; Chignell, S.M.; Vorster, A.G.; Lawrence, R.; Evangelista, P.H. A survival guide to Landsat preprocessing. Ecology 2017, 98, 920–932. [Google Scholar] [CrossRef] [Green Version]
- Bai, B.X.; Tan, Y.M.; Wu, P. The spatial and temporal availability differences of cloud-free landsat images over three gorges reservoir area. ISPRS Int. Arch. Photogramm. Remote Sens. Spat. Inf. Sci. 2019, XLII-3/W9, 1–8. [Google Scholar] [CrossRef] [Green Version]
- Scaramuzza, P.; Micijevic, E.; Chander, G. SLC gap-filled products phase one methodology. Landsat Tech. Notes 2004, 5. [Google Scholar]
- API|LT-GEE Guide. Available online: https://emapr.github.io/LT-GEE/api.html#buildsrcollection (accessed on 13 December 2021).
- Kennedy, R.E.; Ohmann, J.; Gregory, M.; Roberts, H.; Yang, Z.; Bell, D.M.; Kane, V.; Hughes, M.J.; Cohen, W.B.; Powell, S.; et al. An empirical, integrated forest biomass monitoring system. Environ. Res. Lett. 2018, 13, 025004. [Google Scholar] [CrossRef]
- Daly, C.; Halbleib, M.; Smith, J.I.; Gibson, W.P.; Doggett, M.K.; Taylor, G.H.; Curtis, J.; Pasteris, P.P. Physiographically sensitive mapping of climatological temperature and precipitation across the conterminous United States. Int. J. Clim. 2008, 28, 2031–2064. [Google Scholar] [CrossRef]
- PRISM Climate Group at Oregon State University. Available online: https://prism.oregonstate.edu/normals/ (accessed on 13 December 2021).
- GitHub. terrainr: Retrieve Data from the USGS National Map and Transform it for 3D Landscape Visualizations, Issue #416 Ropensci/Software-Review. Available online: https://github.com/ropensci/software-review/issues/416 (accessed on 29 November 2021).
- Services. Available online: https://apps.nationalmap.gov/services/ (accessed on 29 November 2021).
- Kennedy, R.E.; Yang, Z.; Cohen, W.B. Detecting trends in forest disturbance and recovery using yearly Landsat time series: 1. LandTrendr—Temporal segmentation algorithms. Remote Sens. Environ. 2010, 114, 2897–2910. [Google Scholar] [CrossRef]
- Kennedy, R.E.; Yang, Z.; Gorelick, N.; Braaten, J.; Cavalcante, L.; Cohen, W.B.; Healey, S. Implementation of the LandTrendr Algorithm on Google Earth Engine. Remote Sens. 2018, 10, 691. [Google Scholar] [CrossRef] [Green Version]
- Burkman, B. Forest inventory and analysis—Sampling and plot design. FIA Fact Sheet Ser. USDA For. Serv. 2005. [Google Scholar]
- Addink, E.; van Coillie, F. Object-based image analysis. GIM Int. 2010, 24, 12–15. [Google Scholar]
- Achanta, R.; Süsstrunk, S. Superpixels and Polygons Using Simple Non-iterative Clustering. In Proceedings of the 2017 IEEE Conference on Computer Vision and Pattern Recognition (CVPR), Honolulu, HI, USA, 21–26 July 2017; pp. 4895–4904, ISBN 1063-6919. [Google Scholar]
- West, P.W. Tree and Forest Measurement; Springer: Berlin/Heidelberg, Germany, 2015. [Google Scholar] [CrossRef]
- Ji, L.; Gallo, K. An Agreement Coefficient for Image Comparison. Photogramm. Eng. Remote Sens. 2006, 72, 823–833. [Google Scholar] [CrossRef]
- Homer, C.; Dewitz, J.; Jin, S.; Xian, G.; Costello, C.; Danielson, P.; Gass, L.; Funk, M.; Wickham, J.; Stehman, S.; et al. Conterminous United States land cover change patterns 2001–2016 from the 2016 National Land Cover Database. ISPRS J. Photogramm. Remote Sens. 2020, 162, 184–199. [Google Scholar] [CrossRef]
- Wang, L.; Zhou, X.; Zhu, X.; Dong, Z.; Guo, W. Estimation of biomass in wheat using random forest regression algorithm and remote sensing data. Crop J. 2016, 4, 212–219. [Google Scholar] [CrossRef] [Green Version]
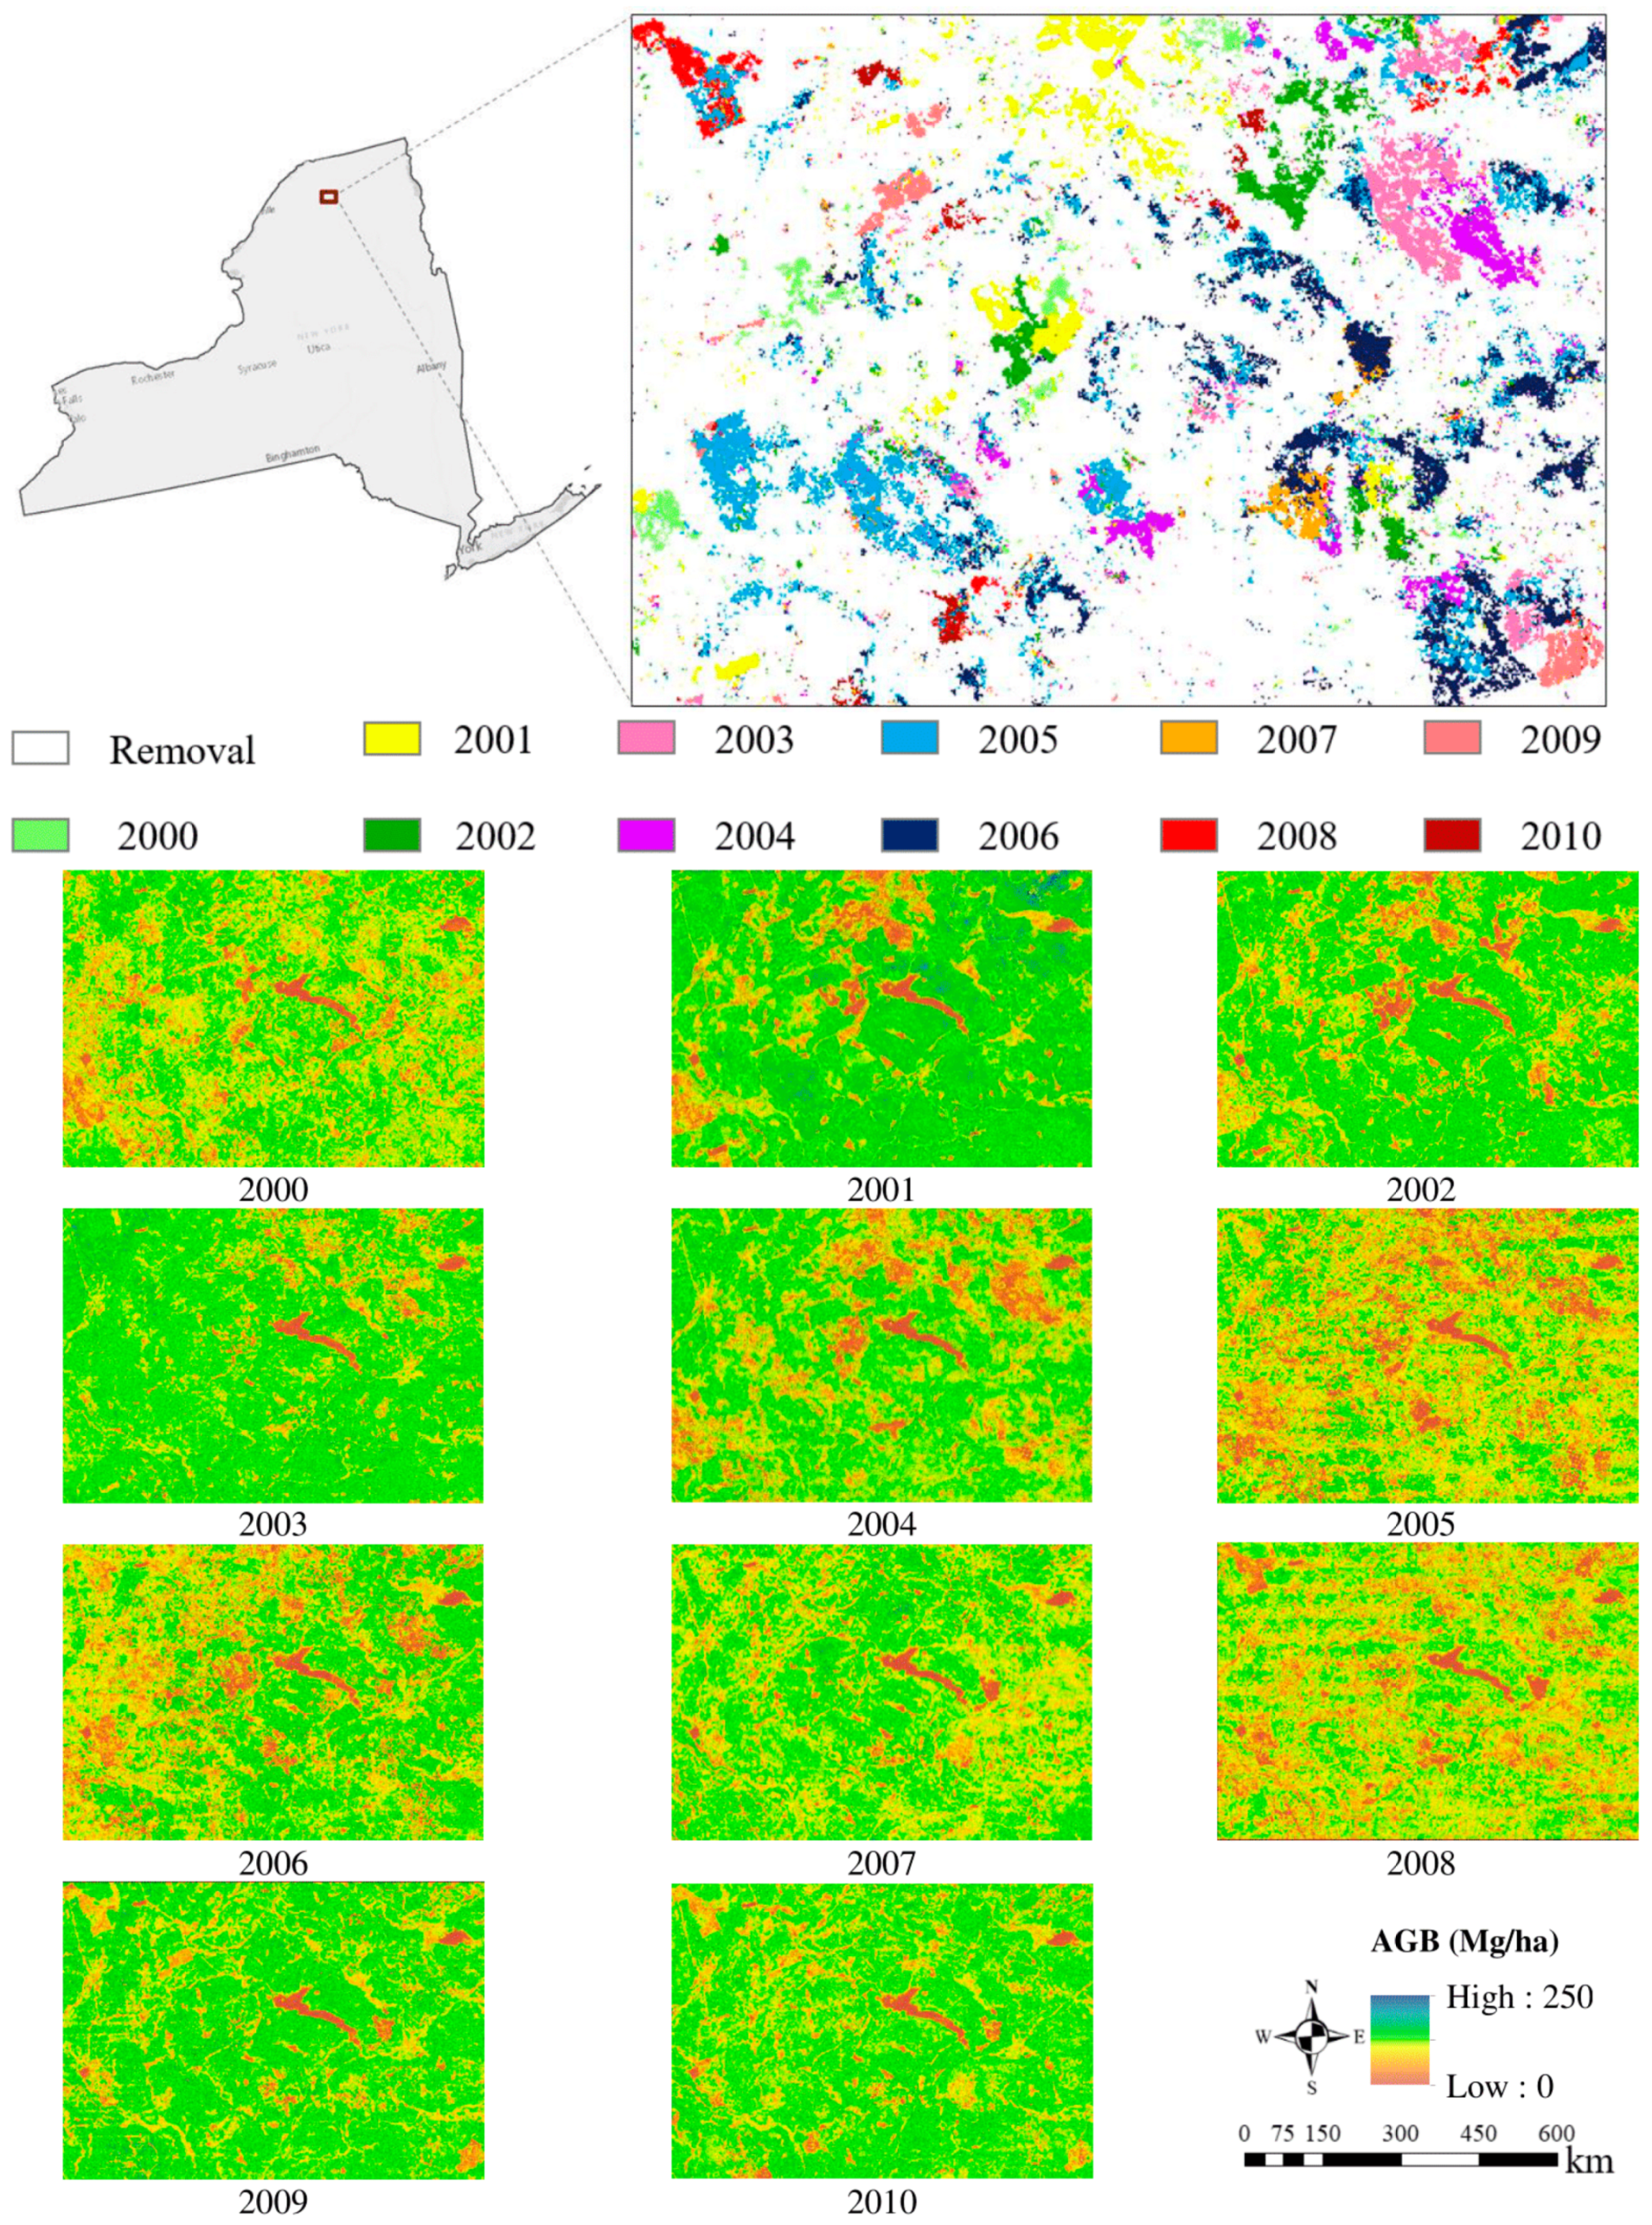
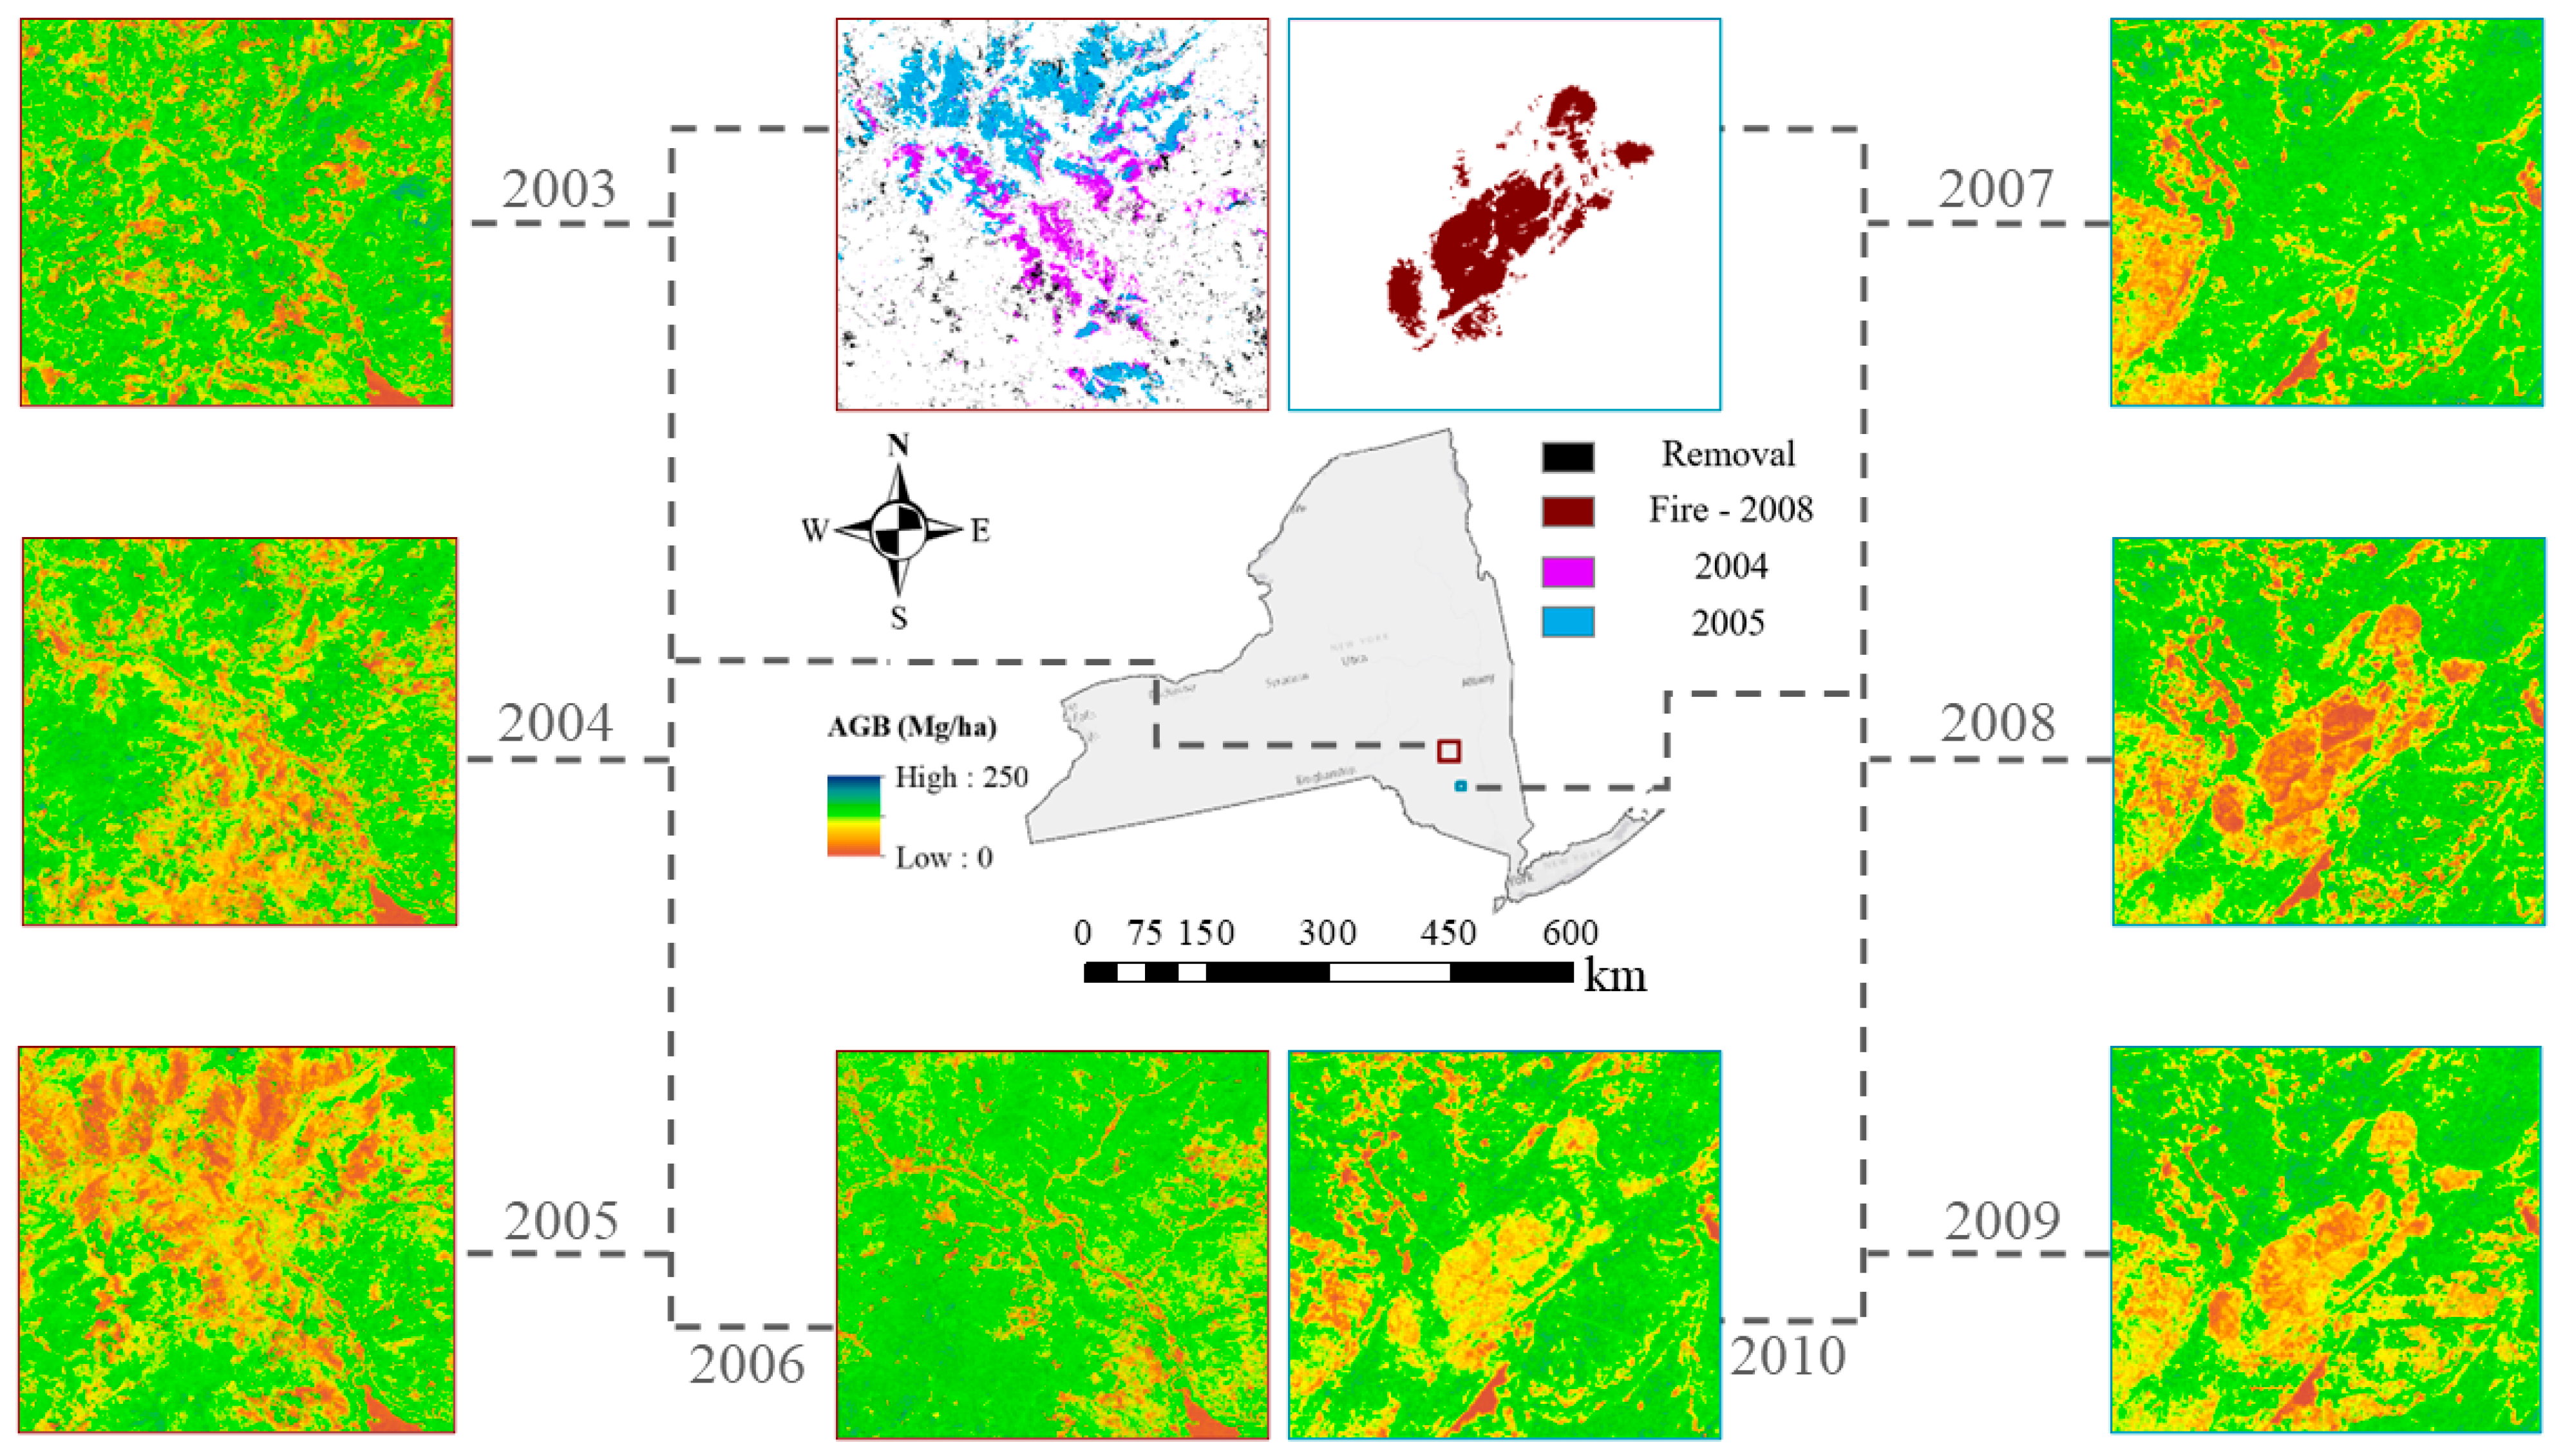
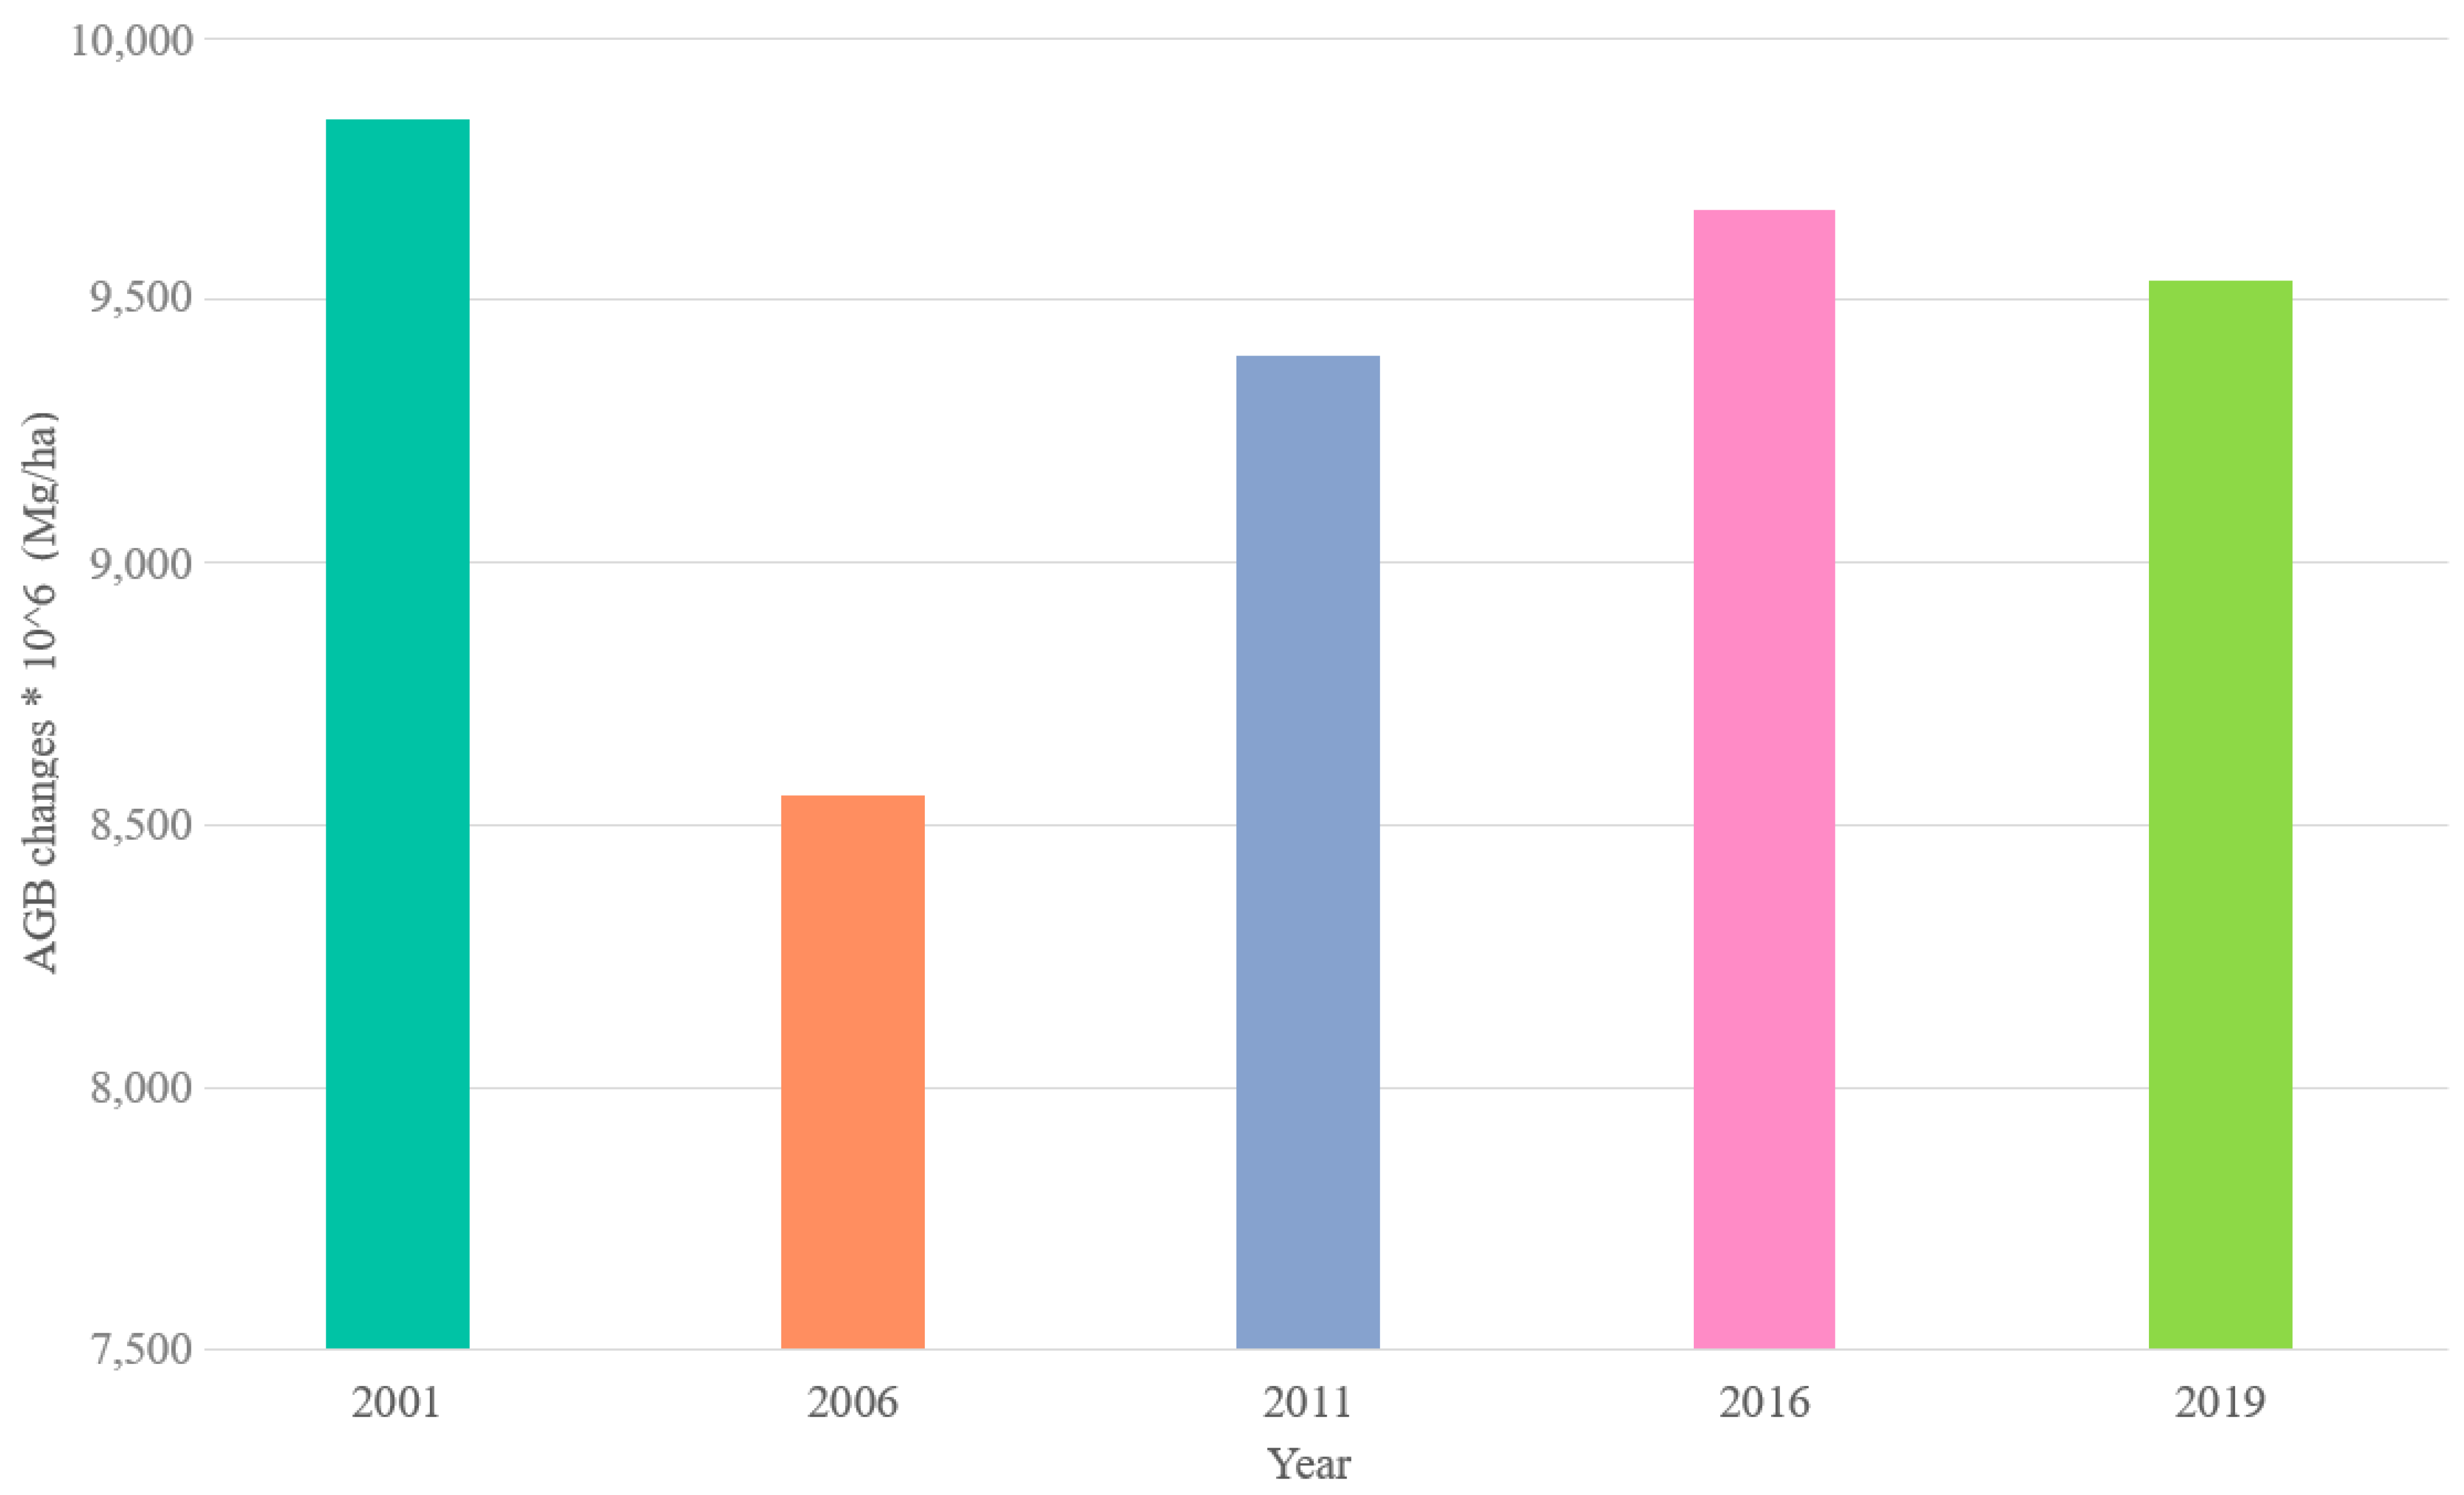

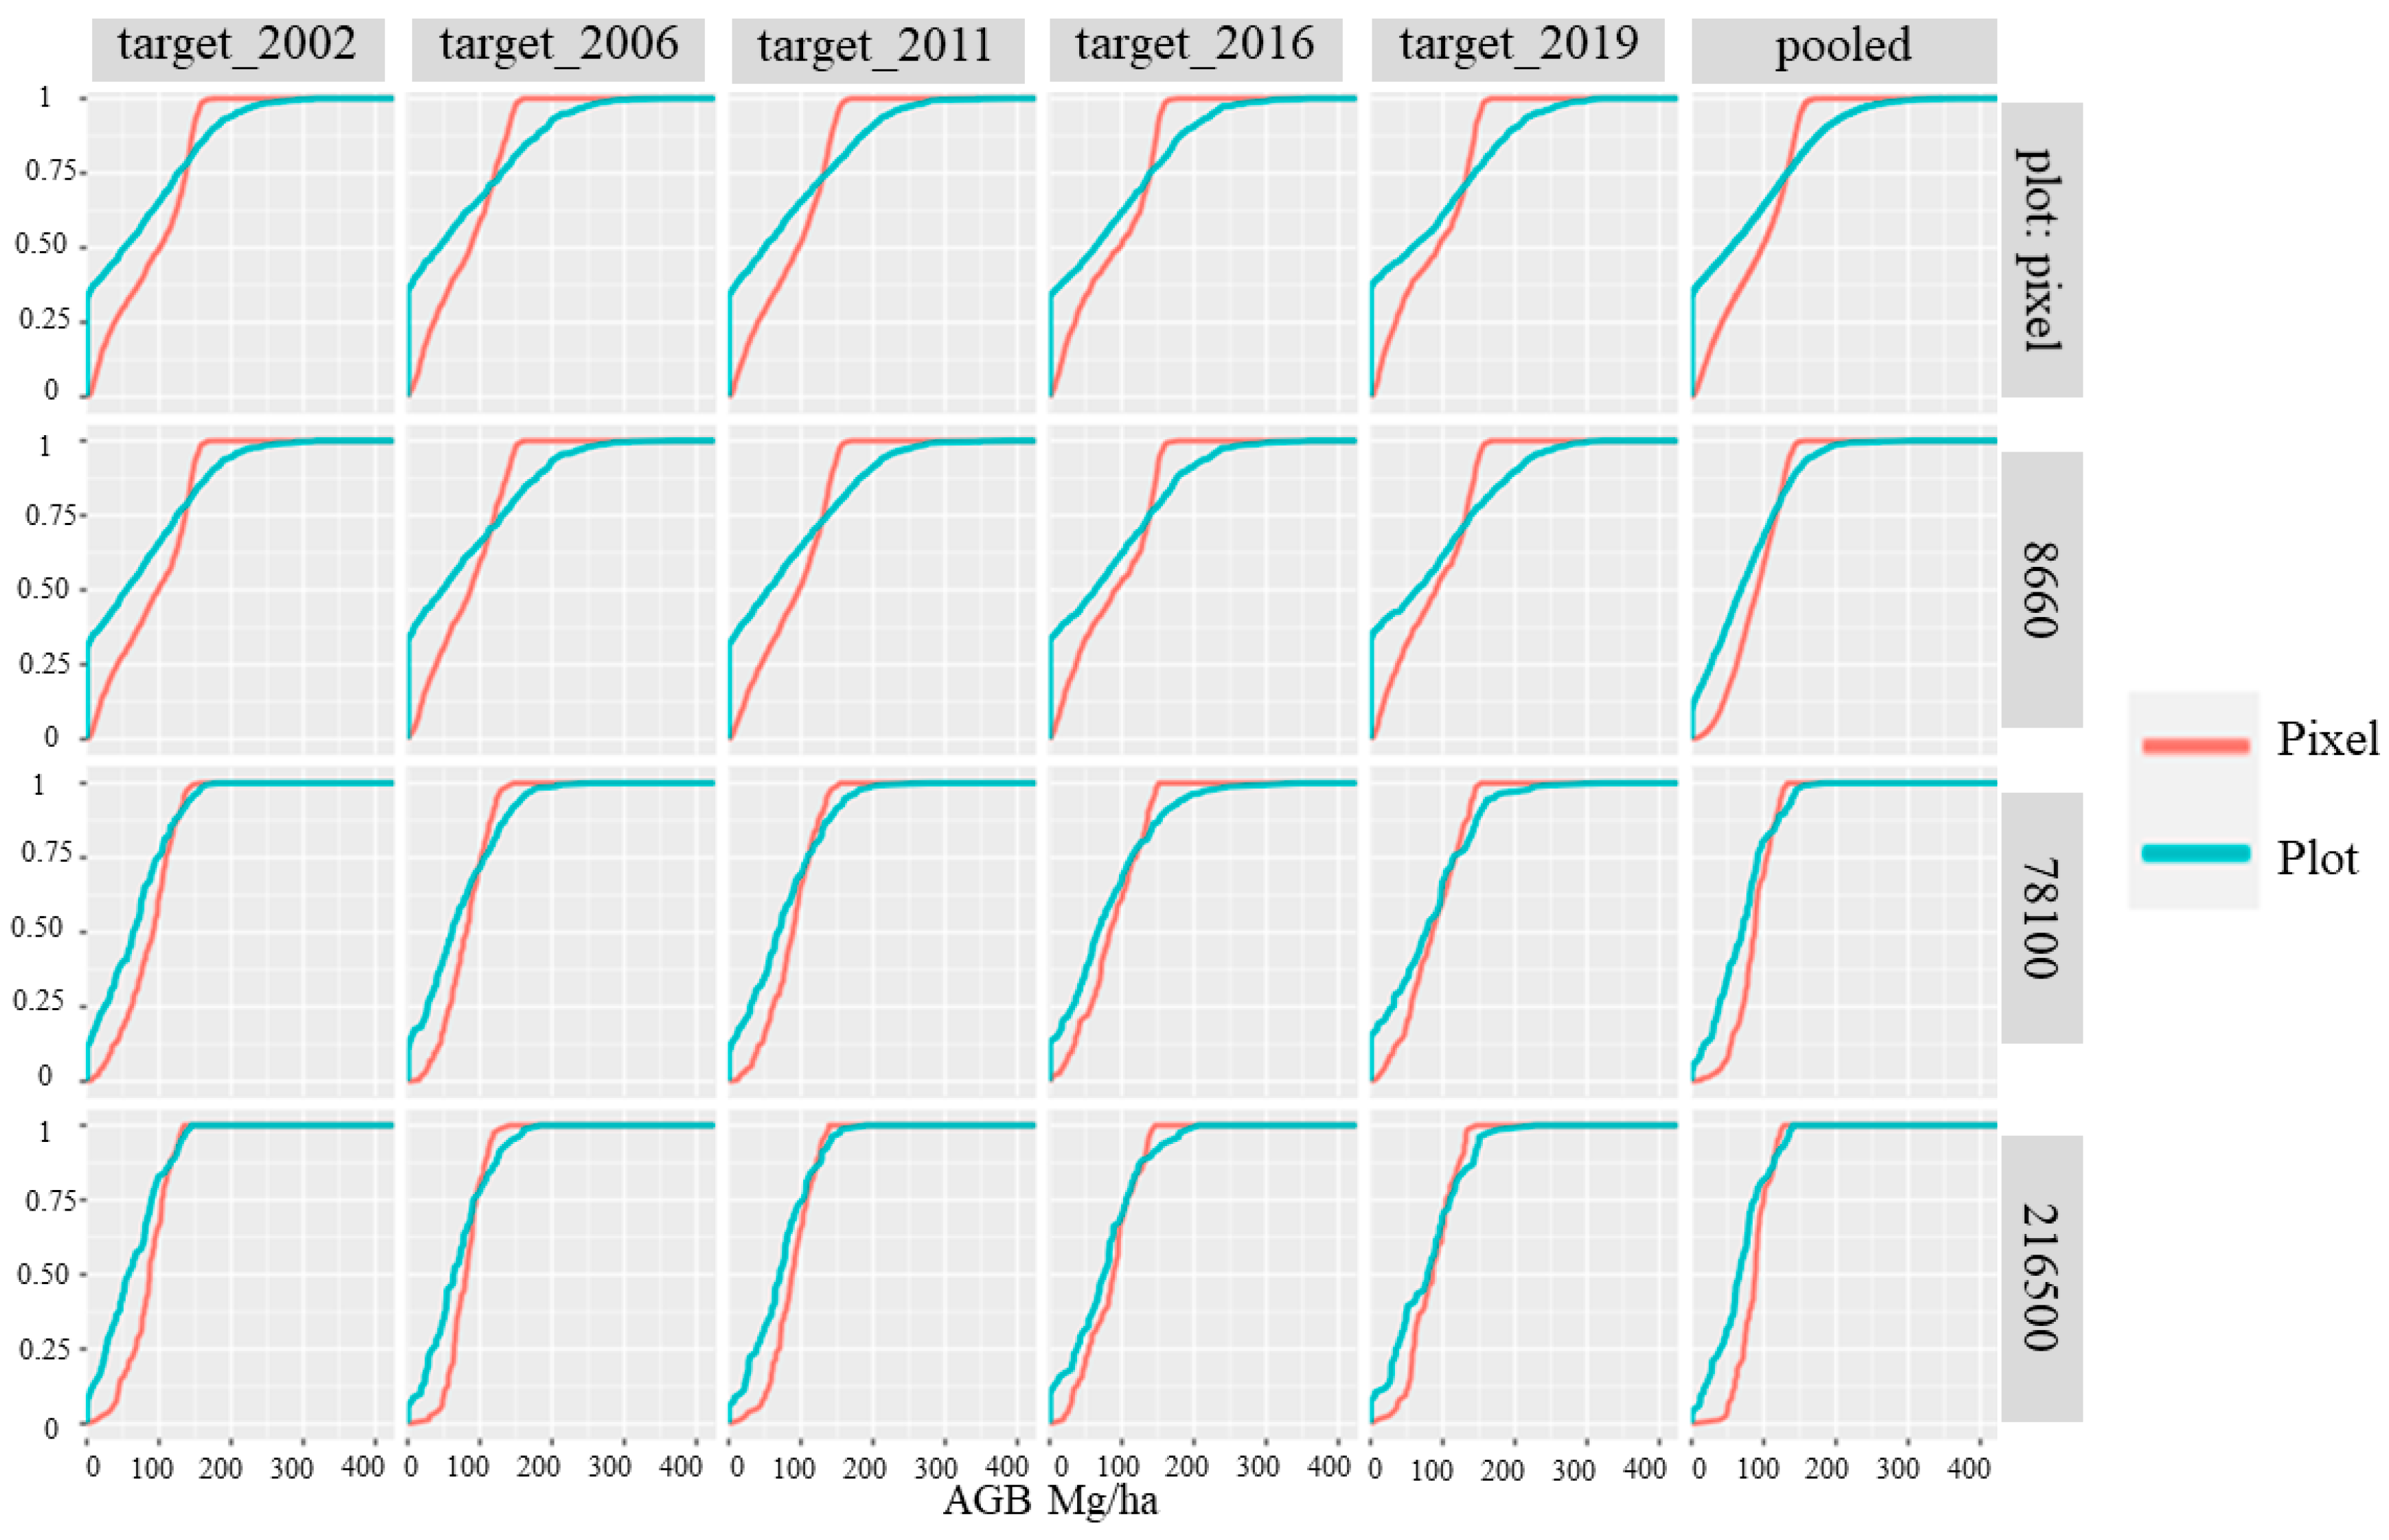


| Year | Min_AGB (Mg/ha) | Max_AGB (Mg/ha) | Mean_AGB (Mg/ha) | Median_AGB (Mg/ha) |
|---|---|---|---|---|
| 2002 | 0 | 317.18 | 71.26 | 52.73 |
| 2003 | 0 | 378.73 | 71.81 | 51.22 |
| 2004 | 0 | 298.51 | 67.61 | 37.55 |
| 2005 | 0 | 308.04 | 74.19 | 61.67 |
| 2006 | 0 | 369.94 | 70.80 | 43.69 |
| 2007 | 0 | 318.06 | 71.12 | 54.44 |
| 2008 | 0 | 324.59 | 73.13 | 56.10 |
| 2009 | 0 | 403.79 | 73.73 | 53.59 |
| 2010 | 0 | 320.69 | 73.03 | 49.37 |
| 2011 | 0 | 392.31 | 75.13 | 50.61 |
| 2012 | 0 | 330.86 | 73.34 | 60.18 |
| 2013 | 0 | 327.16 | 76.87 | 61.34 |
| 2014 | 0 | 422.62 | 78.07 | 58.50 |
| 2015 | 0 | 336.47 | 74.10 | 49.20 |
| 2016 | 0 | 360.56 | 79.45 | 62.64 |
| 2017 | 0 | 424.99 | 80.19 | 58.43 |
| 2018 | 0 | 349.01 | 76.99 | 65.12 |
| 2019 | 0 | 322.56 | 79.24 | 57.48 |
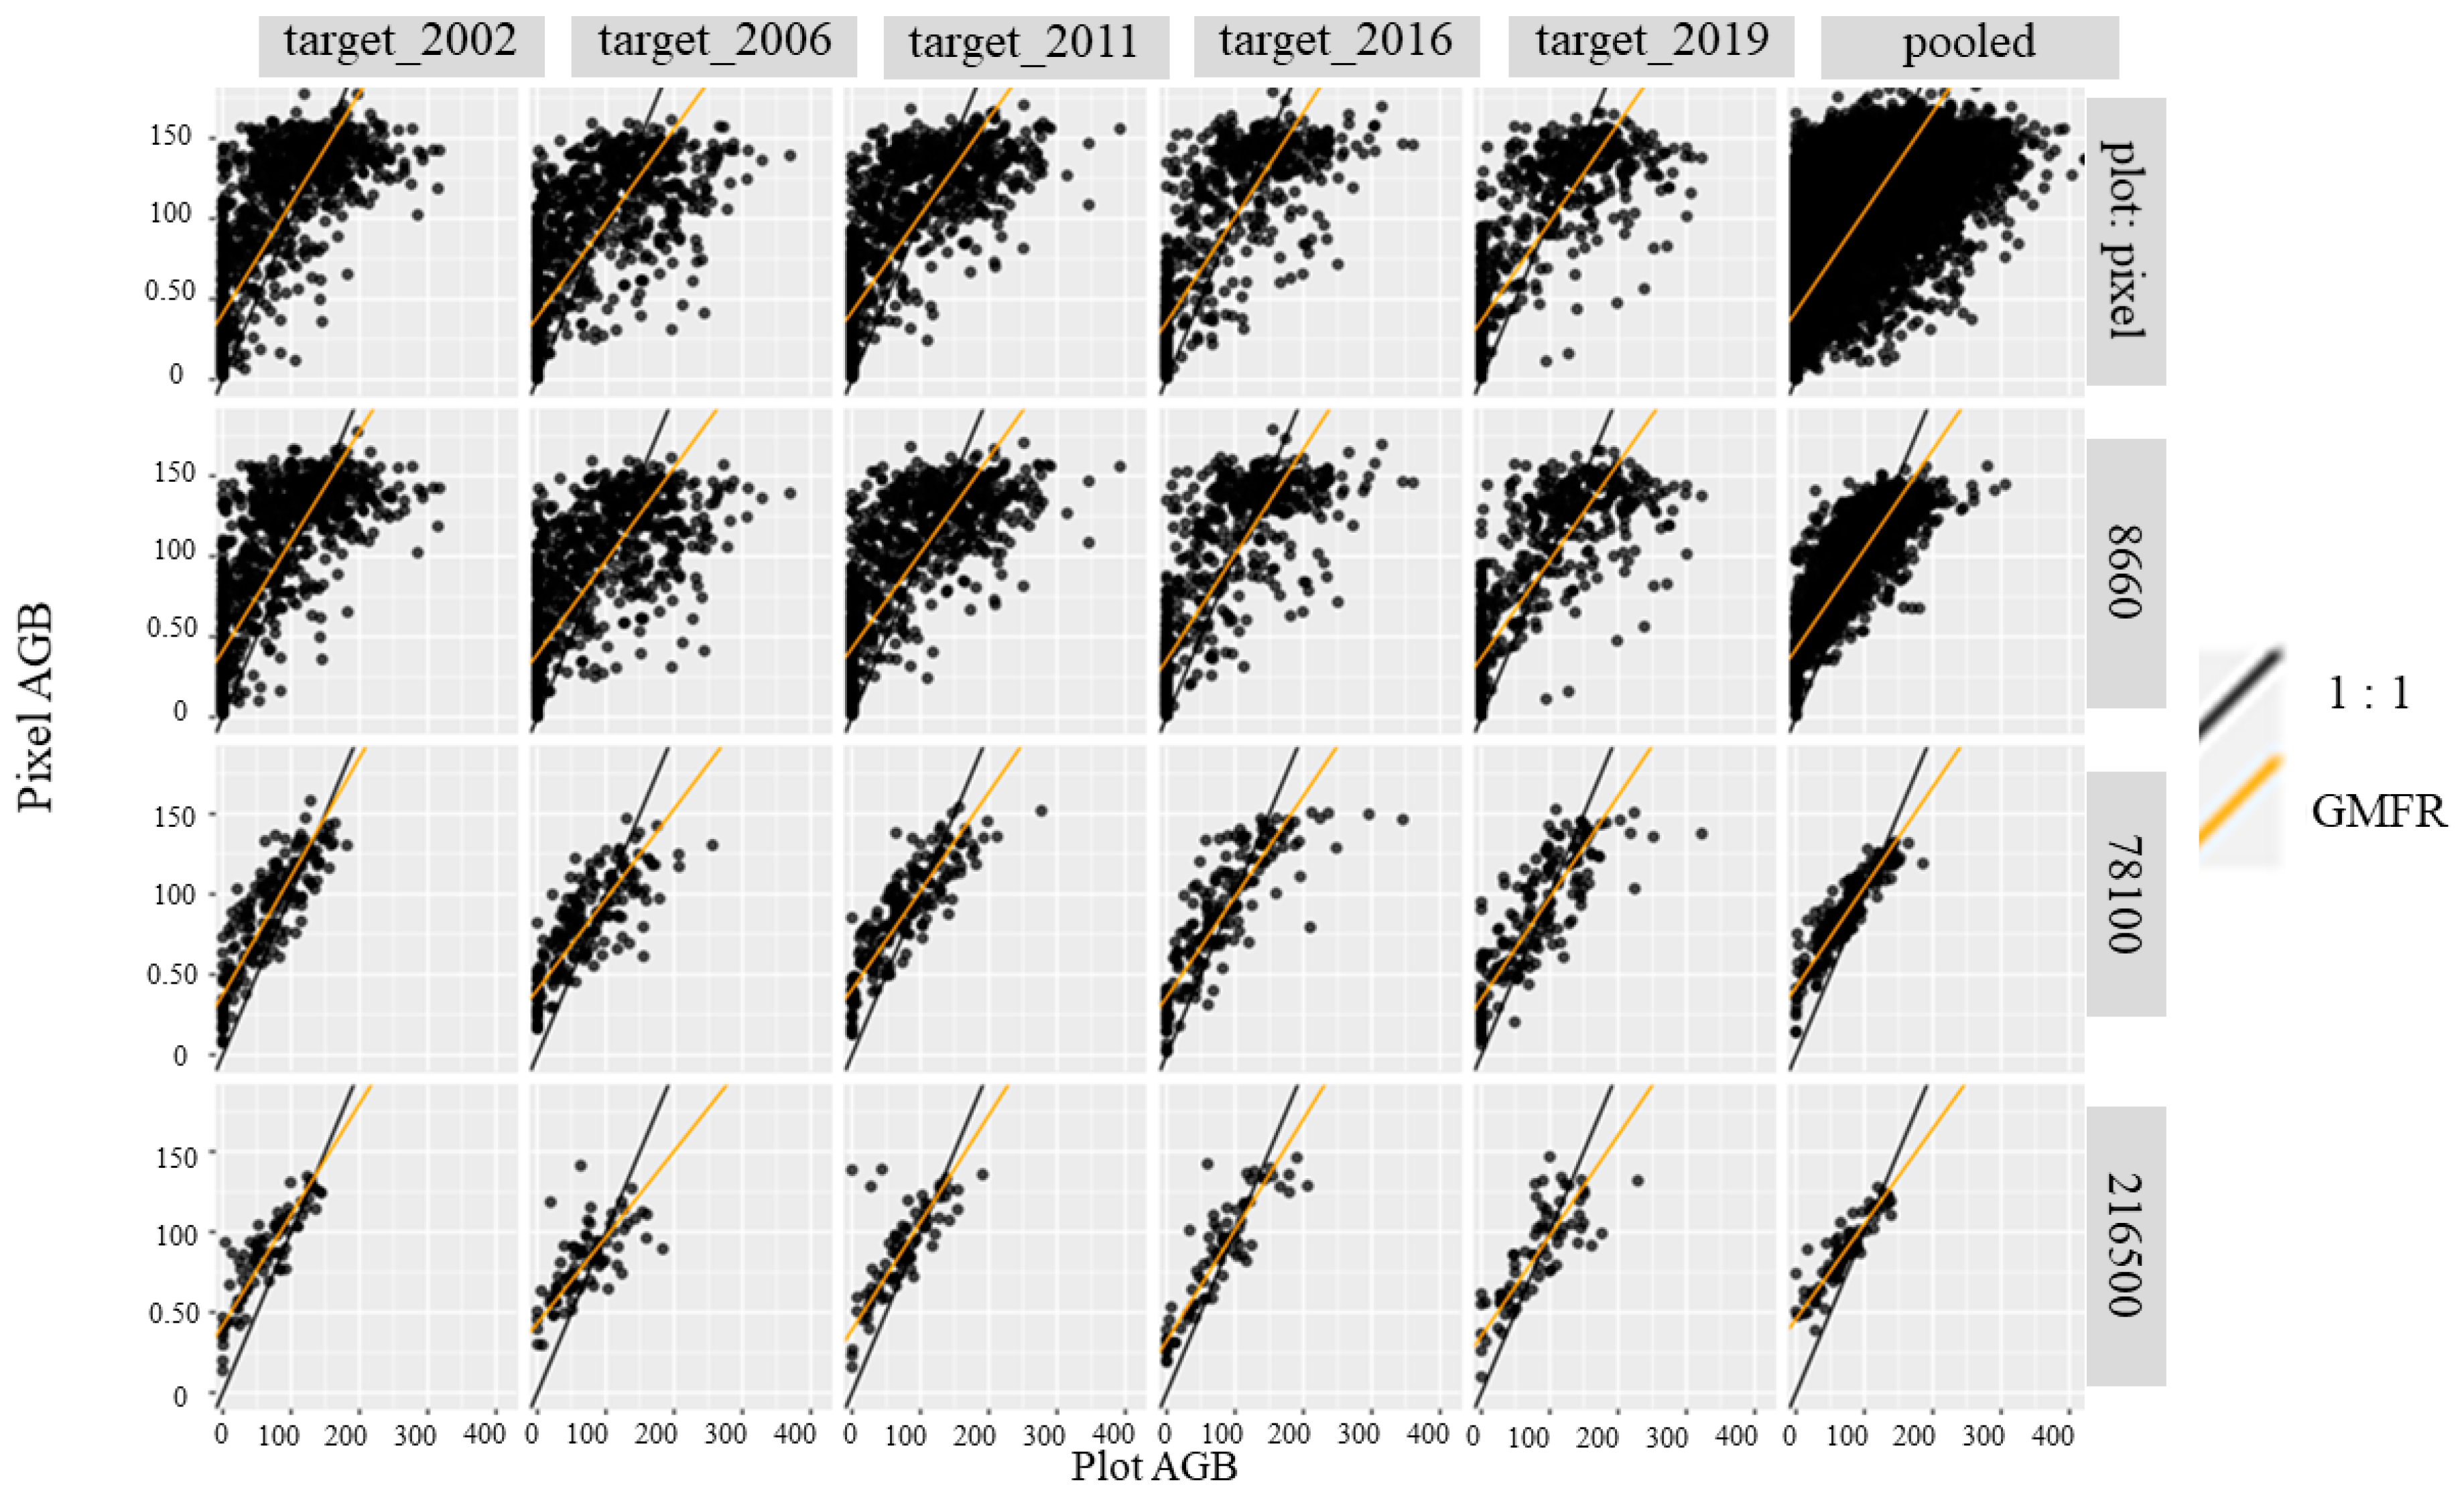
| Group | n | PPH | Mean FIA | MBE (Mg/ha) | RMSE (Mg/ha) | MAE (Mg/ha) | R2 | KS | AC | ACs | ACu |
|---|---|---|---|---|---|---|---|---|---|---|---|
| target_2002 | 1017 | NA | 71.33 | 18.53 | 52.71 | 41.83 | 0.56 | 0.35 | 0.49 | 0.84 | 0.65 |
| target_2006 | 880 | NA | 70.88 | 9.47 | 58.66 | 46.04 | 0.47 | 0.36 | 0.15 | 0.71 | 0.43 |
| target_2011 | 940 | NA | 75.21 | 12.03 | 56.66 | 45.14 | 0.55 | 0.34 | 0.32 | 0.75 | 0.57 |
| target_2016 | 640 | NA | 79.45 | 8.03 | 53.13 | 41.25 | 0.59 | 0.34 | 0.39 | 0.81 | 0.57 |
| target_2019 | 606 | NA | 79.46 | 5.76 | 54.53 | 42.67 | 0.60 | 0.38 | 0.30 | 0.75 | 0.56 |
| pooled | 14,333 | NA | 74.24 | 14.09 | 56.22 | 44.55 | 0.53 | 0.35 | 0.34 | 0.77 | 0.57 |
| Group | n | PPH | Mean FIA | MBE (Mg/ha) | RMSE (Mg/ha) | MAE (Mg/ha) | R2 | KS | AC | ACs | ACu |
|---|---|---|---|---|---|---|---|---|---|---|---|
| target_2002 | 921 | 1.10 | 71.75 | 18.84 | 51.90 | 41.03 | 0.56 | 0.32 | 0.49 | 0.84 | 0.65 |
| target_2006 | 821 | 1.07 | 72.20 | 8.91 | 57.69 | 45.30 | 0.47 | 0.34 | 0.13 | 0.70 | 0.43 |
| target_2011 | 855 | 1.10 | 76.67 | 11.62 | 56.06 | 44.62 | 0.55 | 0.32 | 0.30 | 0.73 | 0.57 |
| target_2016 | 576 | 1.11 | 78.49 | 8.66 | 52.0 | 40.07 | 0.60 | 0.34 | 0.41 | 0.82 | 0.59 |
| target_2019 | 526 | 1.15 | 80.30 | 5.17 | 53.64 | 40.89 | 0.60 | 0.35 | 0.28 | 0.73 | 0.54 |
| pooled | 1528 | 9.37 | 73.58 | 14.38 | 36.67 | 29.84 | 0.66 | 0.23 | 0.54 | 0.78 | 0.76 |
| Group | n | PPH | Mean FIA | MBE (Mg/ha) | RMSE (Mg/ha) | MAE (Mg/ha) | R2 | KS | AC | ACs | ACu |
|---|---|---|---|---|---|---|---|---|---|---|---|
| target_2002 | 193 | 5.25 | 65.47 | 20.25 | 32.37 | 27.31 | 0.71 | 0.25 | 0.67 | 0.82 | 0.84 |
| target_2006 | 191 | 4.60 | 69.59 | 10.10 | 36.15 | 29.77 | 0.60 | 0.26 | 0.37 | 0.70 | 0.67 |
| target_2011 | 190 | 4.94 | 74.31 | 12.00 | 32.76 | 27.02 | 0.73 | 0.23 | 0.57 | 0.77 | 0.80 |
| target_2016 | 184 | 3.48 | 78.36 | 6.64 | 38.17 | 28.00 | 0.68 | 0.20 | 0.46 | 0.78 | 0.68 |
| target_2019 | 179 | 3.37 | 79.99 | 5.29 | 37.20 | 28.44 | 0.65 | 0.17 | 0.41 | 0.78 | 0.63 |
| pooled | 201 | 70.16 | 69.96 | 15.76 | 25.81 | 21.12 | 0.81 | 0.27 | 0.66 | 0.76 | 0.90 |
| Group | n | PPH | Mean FIA | MBE (Mg/ha) | RMSE (Mg/ha) | MAE (Mg/ha) | R2 | KS | AC | ACs | ACu |
|---|---|---|---|---|---|---|---|---|---|---|---|
| target_2002 | 81 | 12.44 | 62.62 | 22.44 | 30.95 | 25.71 | 0.76 | 0.32 | 0.66 | 0.77 | 0.90 |
| target_2006 | 79 | 10.96 | 69.56 | 10.89 | 33.11 | 26.47 | 0.47 | 0.33 | 0.24 | 0.65 | 0.59 |
| target_2011 | 79 | 11.71 | 73.07 | 14.09 | 31.90 | 22.84 | 0.55 | 0.24 | 0.52 | 0.80 | 0.72 |
| target_2016 | 77 | 8.31 | 75.93 | 8.69 | 26.79 | 21.04 | 0.78 | 0.18 | 0.68 | 0.86 | 0.82 |
| target_2019 | 74 | 8.09 | 79.47 | 5.38 | 30.79 | 24.71 | 0.64 | 0.27 | 0.40 | 0.77 | 0.63 |
| pooled | 82 | 169.79 | 68.75 | 17.81 | 25.87 | 21.20 | 0.81 | 0.33 | 0.62 | 0.71 | 0.92 |
Publisher’s Note: MDPI stays neutral with regard to jurisdictional claims in published maps and institutional affiliations. |
© 2022 by the authors. Licensee MDPI, Basel, Switzerland. This article is an open access article distributed under the terms and conditions of the Creative Commons Attribution (CC BY) license (https://creativecommons.org/licenses/by/4.0/).
Share and Cite
Tamiminia, H.; Salehi, B.; Mahdianpari, M.; Beier, C.M.; Johnson, L. Mapping Two Decades of New York State Forest Aboveground Biomass Change Using Remote Sensing. Remote Sens. 2022, 14, 4097. https://doi.org/10.3390/rs14164097
Tamiminia H, Salehi B, Mahdianpari M, Beier CM, Johnson L. Mapping Two Decades of New York State Forest Aboveground Biomass Change Using Remote Sensing. Remote Sensing. 2022; 14(16):4097. https://doi.org/10.3390/rs14164097
Chicago/Turabian StyleTamiminia, Haifa, Bahram Salehi, Masoud Mahdianpari, Colin M. Beier, and Lucas Johnson. 2022. "Mapping Two Decades of New York State Forest Aboveground Biomass Change Using Remote Sensing" Remote Sensing 14, no. 16: 4097. https://doi.org/10.3390/rs14164097
APA StyleTamiminia, H., Salehi, B., Mahdianpari, M., Beier, C. M., & Johnson, L. (2022). Mapping Two Decades of New York State Forest Aboveground Biomass Change Using Remote Sensing. Remote Sensing, 14(16), 4097. https://doi.org/10.3390/rs14164097


