
Dual-View Stereovision-Guided Automatic Inspection System for Overhead Transmission Line Corridor


Abstract
:
1. Introduction
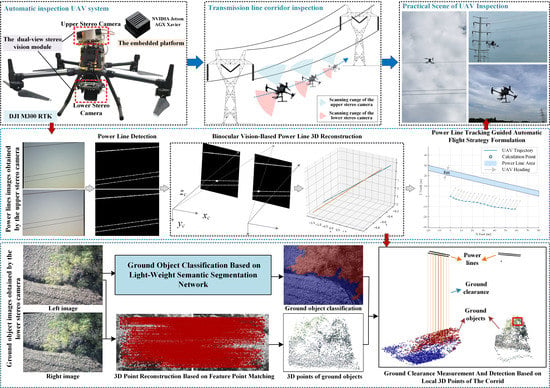
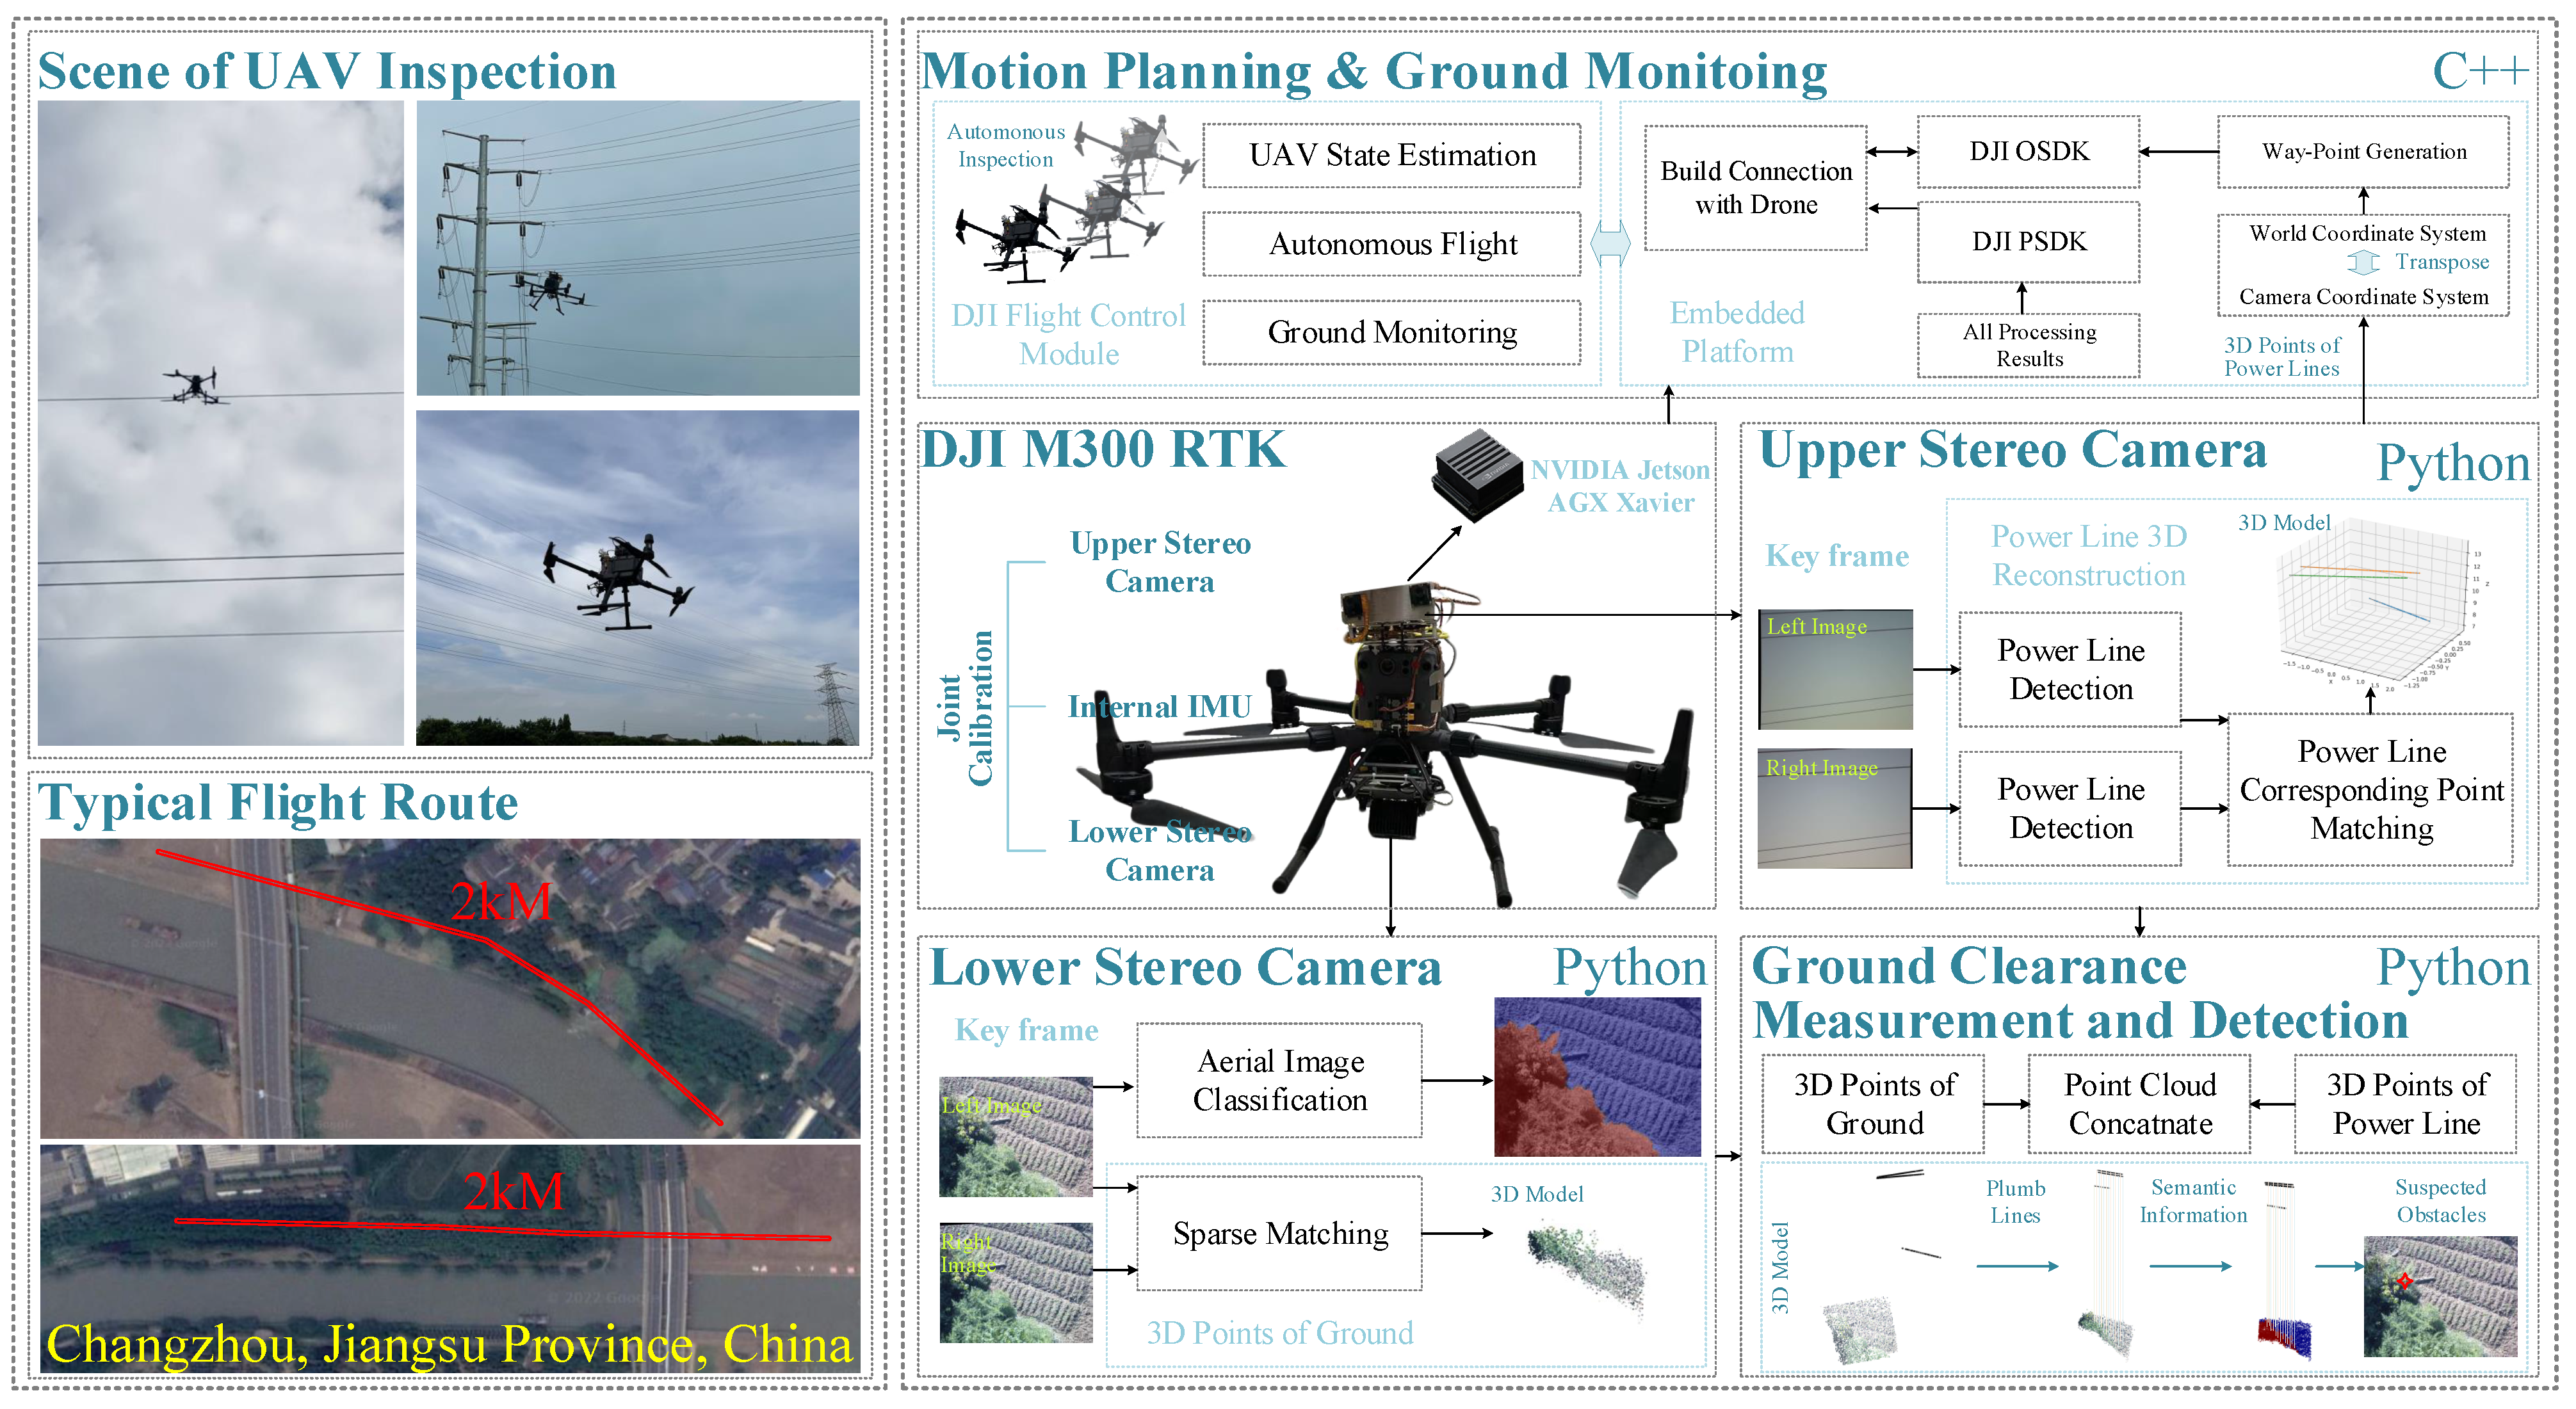
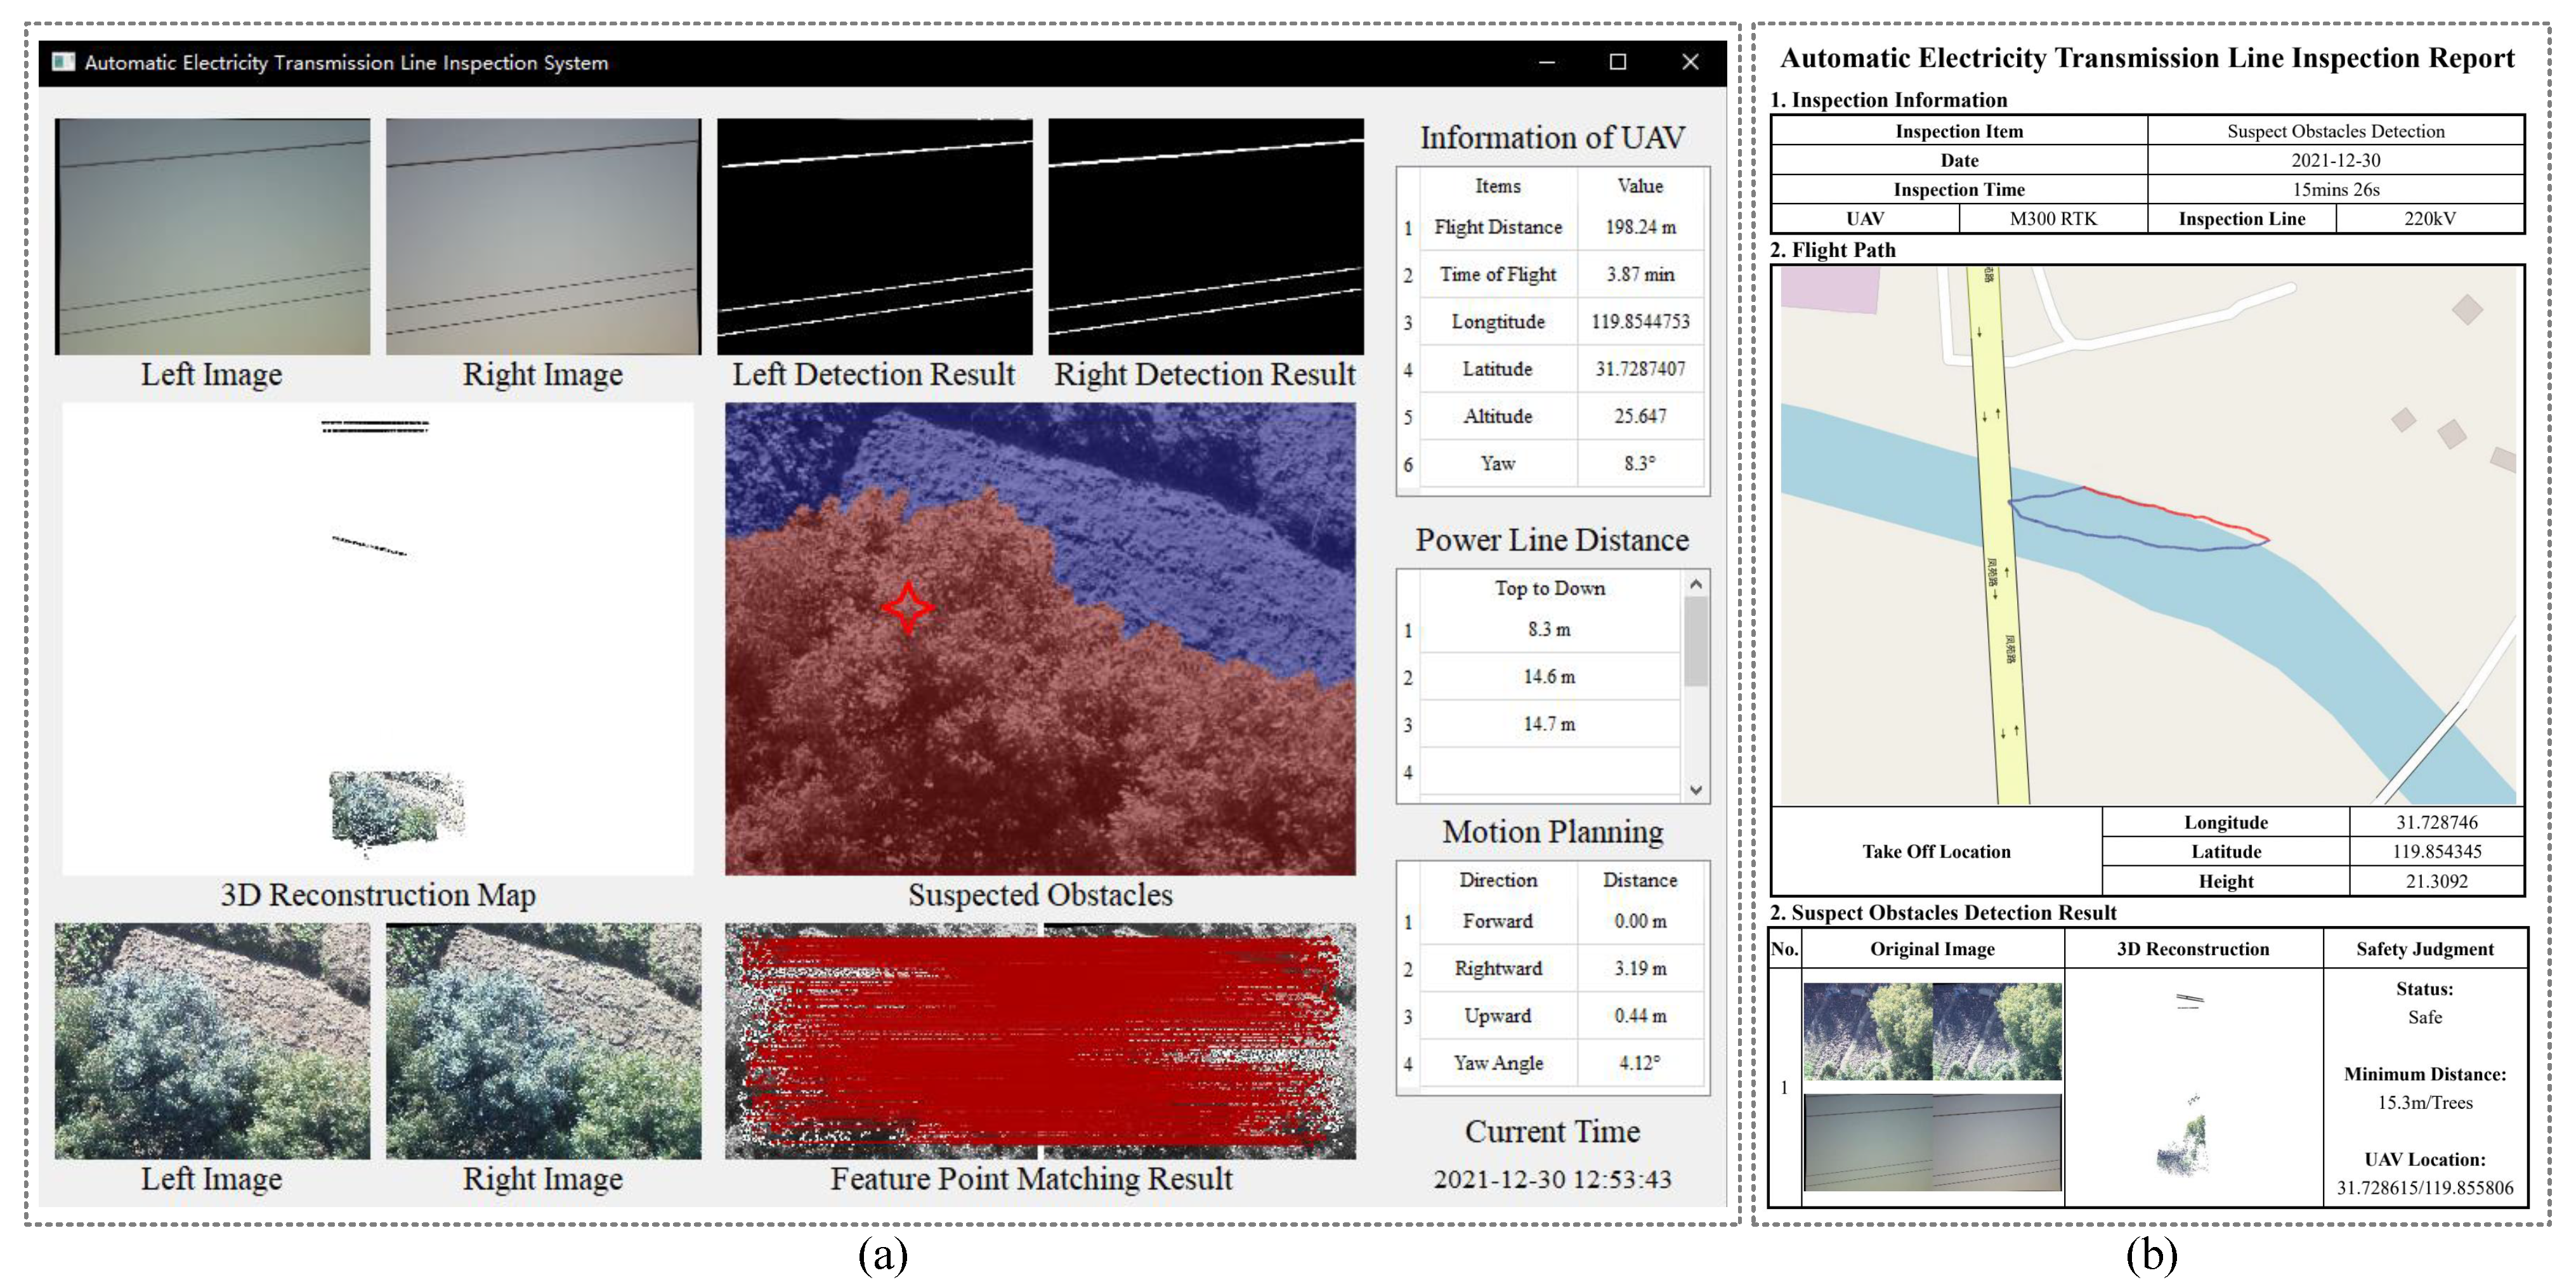
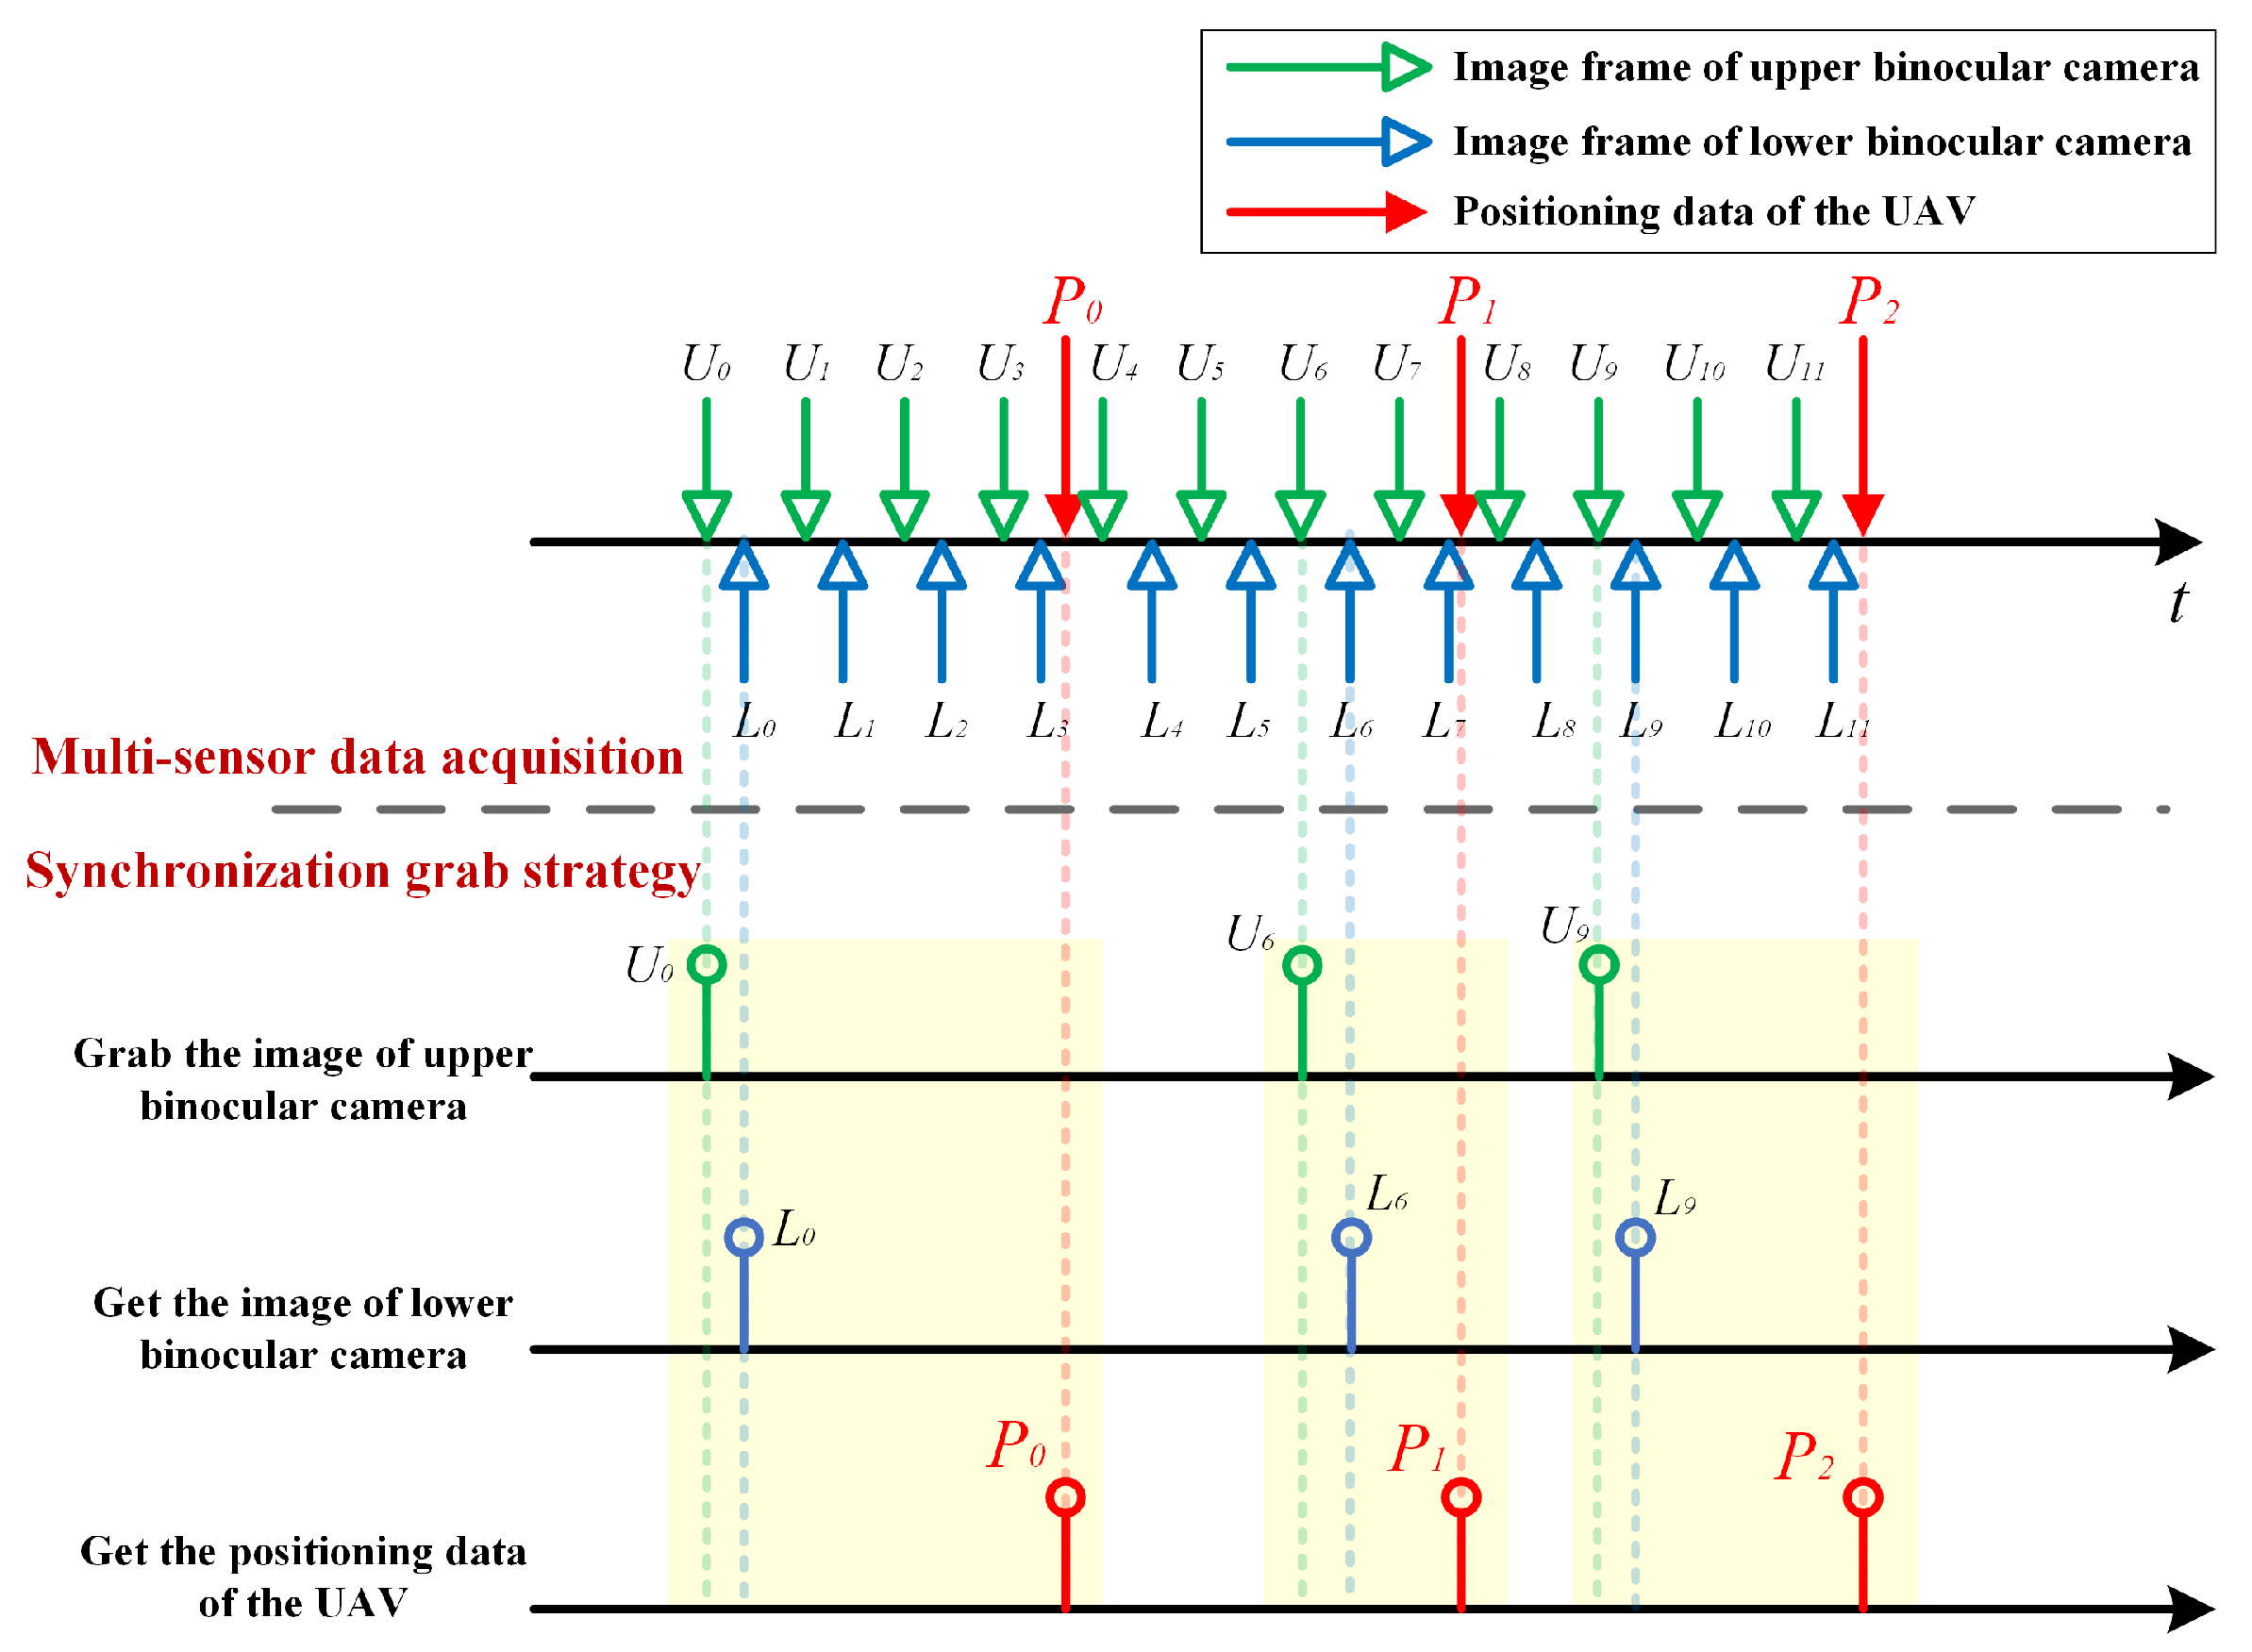
- A novel automatic inspection system for the transmission line corridor is developed. In this system, a dual-view stereovision module and an embedded NVIDIA platform are mounted on the UAV to perceive the surrounding environment. The dual-view stereovision module consists of two binocular cameras. One binocular camera is used to acquire the images of power lines and provide information for automatic flight. Another binocular camera is used to identify and locate the ground objects under power lines. The embedded NVIDIA platform is used to process information acquired by the dual-view stereovision module and achieve power line detection and reconstruction, aerial image classification, and ground clearance measurement. Different images from two views can be acquired and processed synchronously by the collaboration of the embedded NVIDIA platform and the dual-view stereovision module. Then, automatic inspection and real-time ground clearance measurement can be achieved simultaneously.
- A real-time automatic flight strategy formulation method based on power line tracking is proposed. We firstly propose an edge-assisted dual-refinement power line detection network, which can detect more high-level semantic cues and extract power lines from binocular images more accurately. Then, the detection results are utilized to locate power lines and calculate the distance between the UAV and power lines by binocular-vision-based 3D reconstruction processing. According to the calculated distance, the following flight points will be formulated one by one and used to control the automatic movement of the UAV along the power lines.
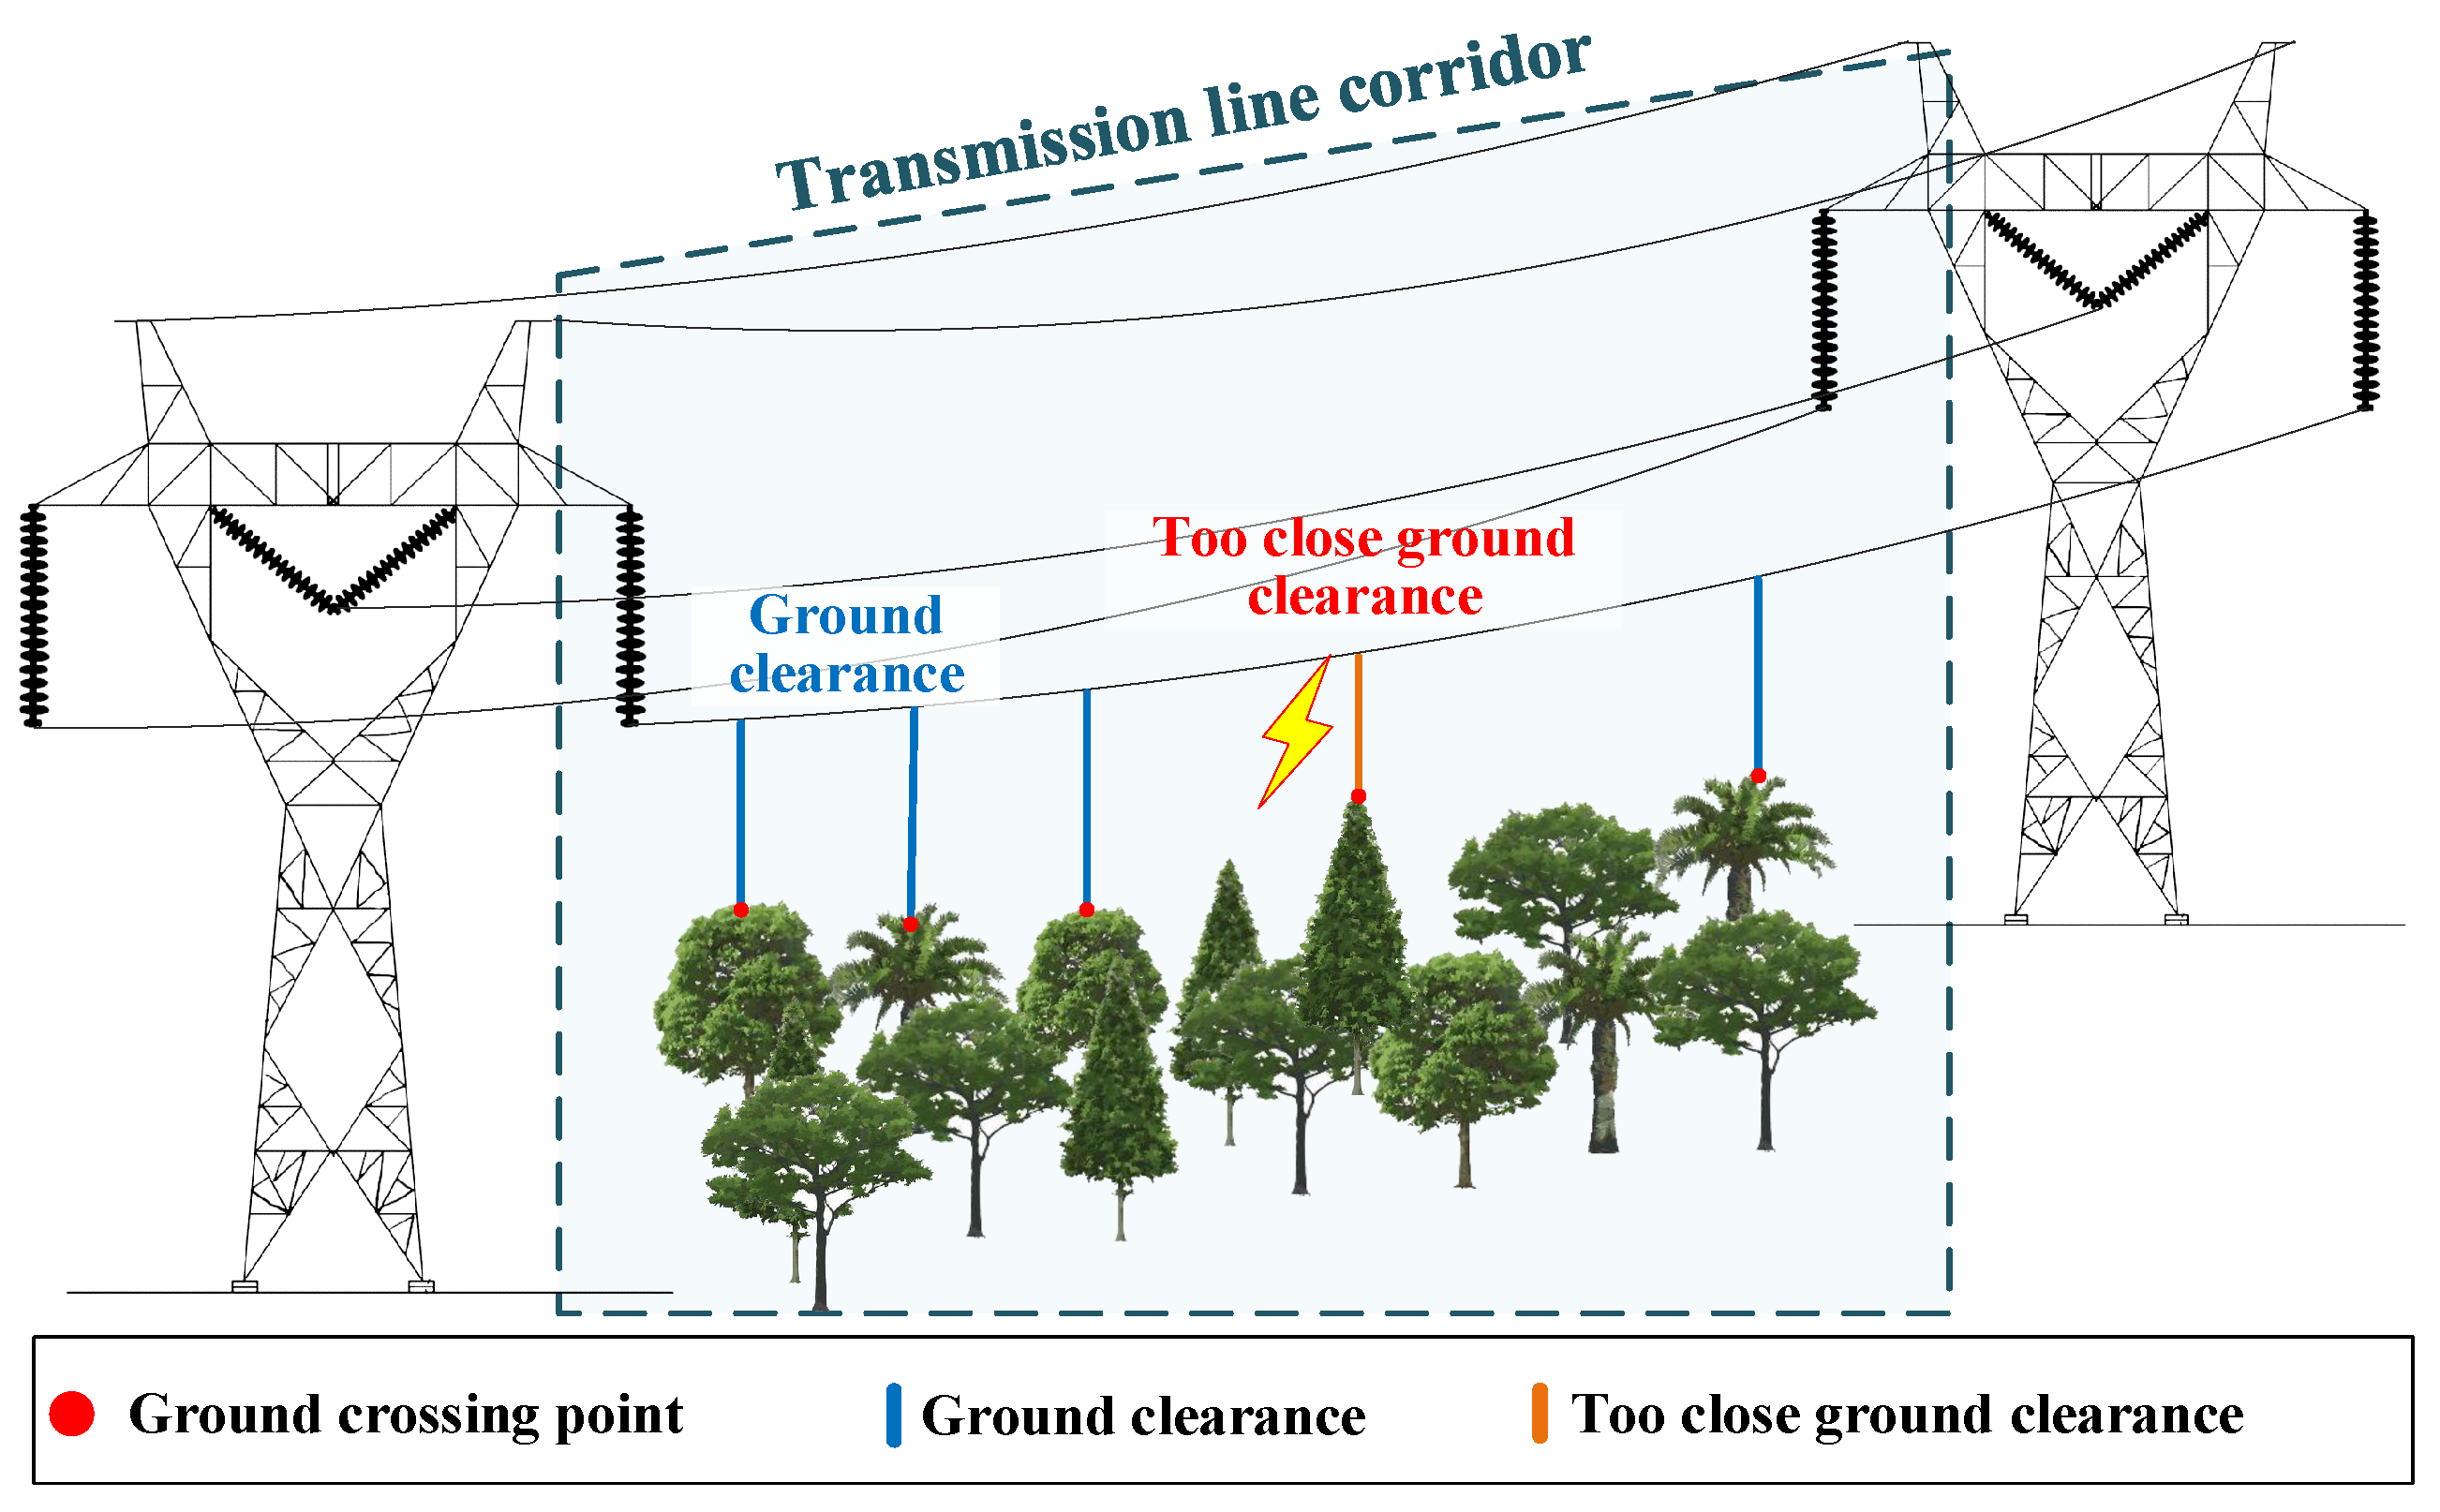
- We present a ground clearance measurement strategy with ground object identification to accurately detect the safety of transmission line corridors. In the proposed strategy, an aerial image classification method based on light-weight semantic segmentation network is proposed, which can classify ground objects effectively. After that, 3D points of ground objects are reconstructed by the advanced feature point matching method and concatenated with 3D points of corresponding power lines. Based on 3D points of the transmission line corridor, a plumb line between power lines and corresponding ground objects could be determined; then, the ground clearance could be calculated and detected without difficulty.
2. Automatic Transmission Line Corridor Inspection System Overview
2.1. Hardware Platform and System Architecture
2.2. Pipeline of Dual-View Stereovision-Guided Automatic Inspection Strategy
3. Methods
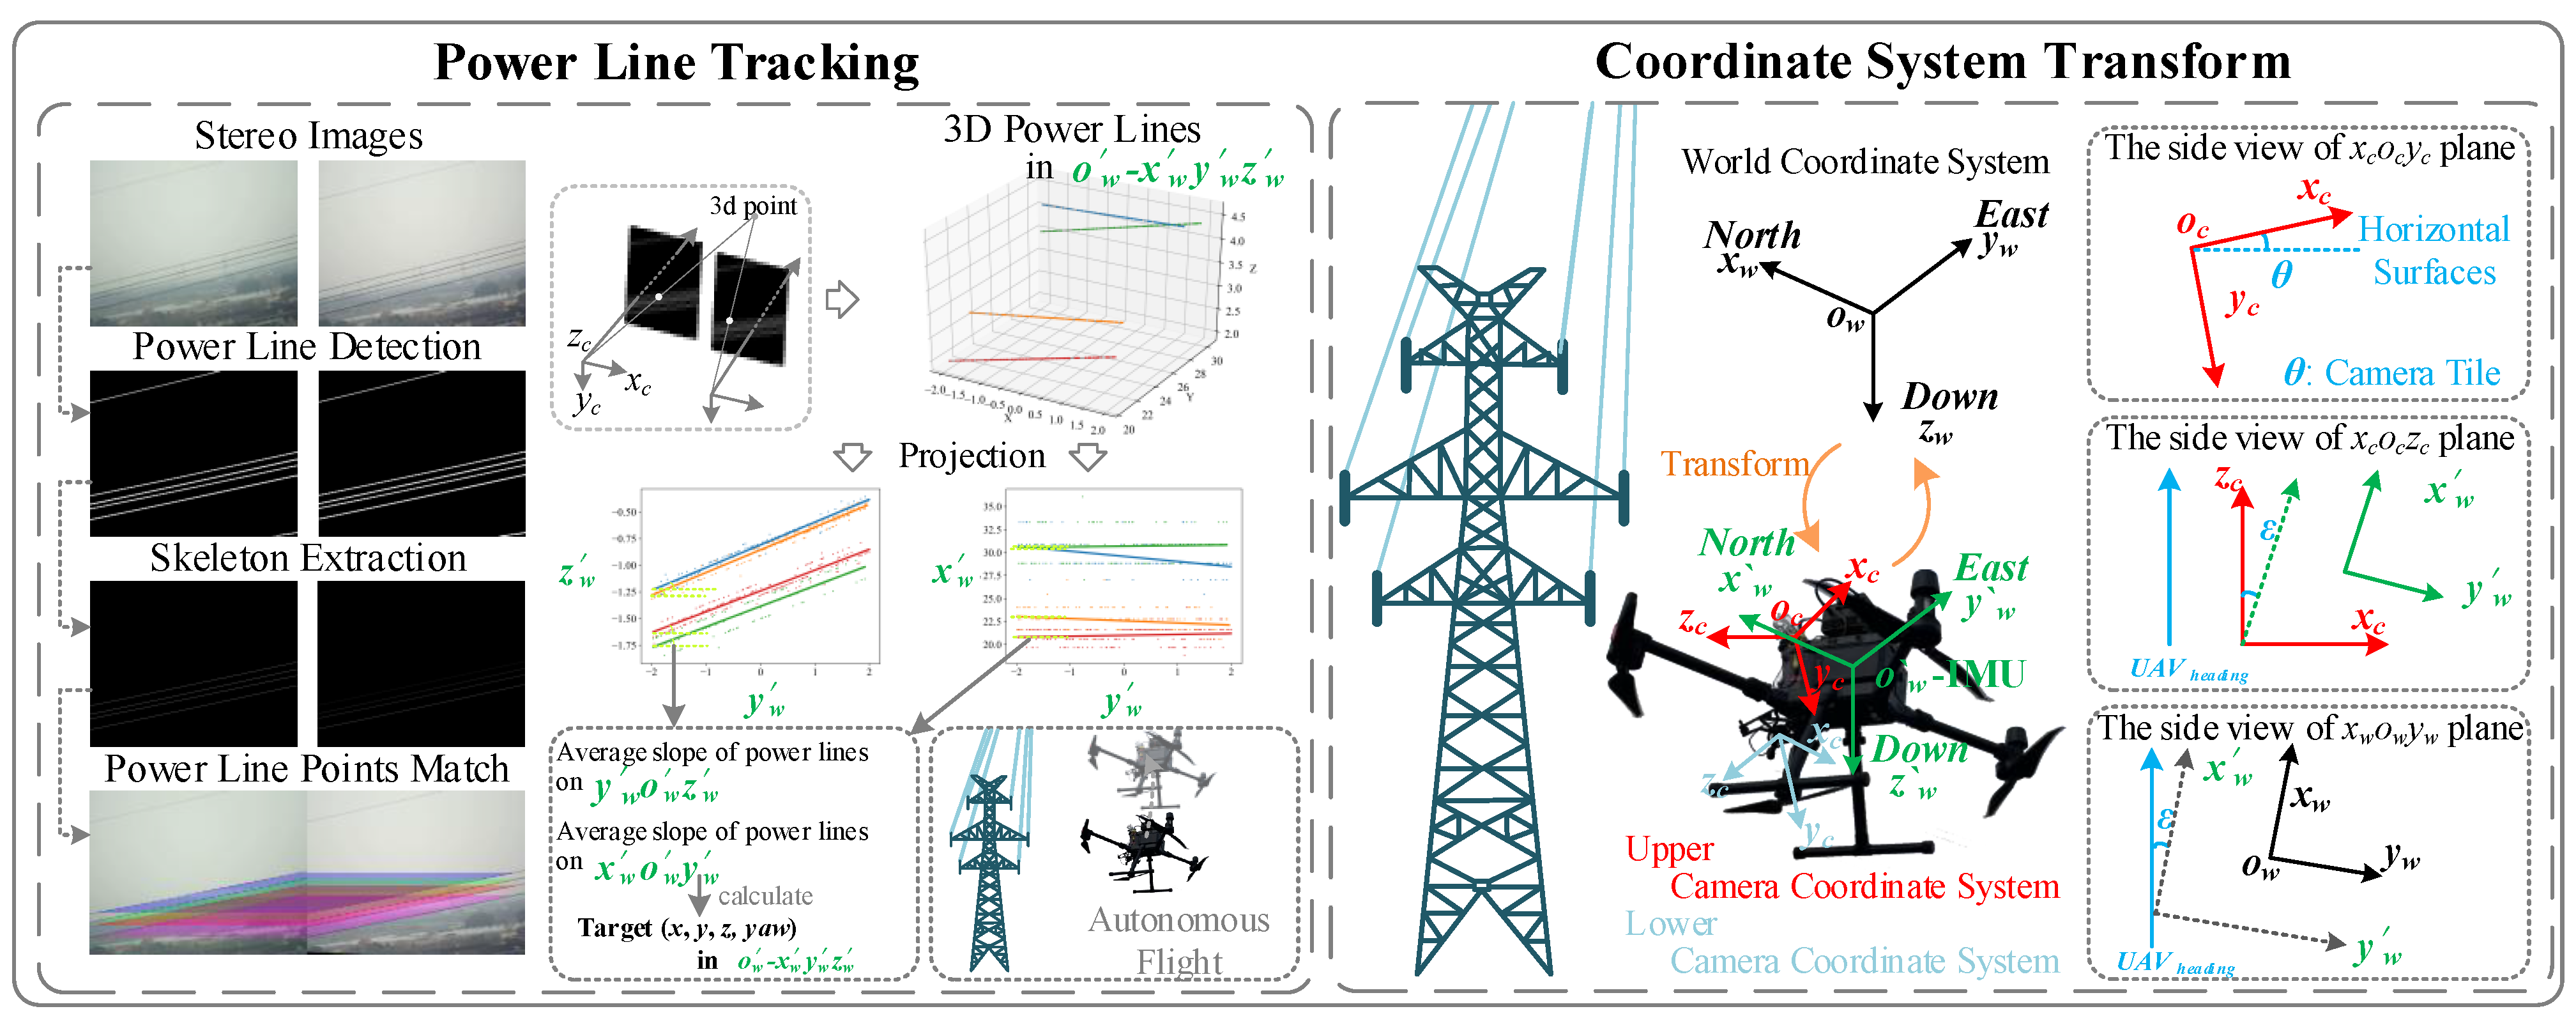
3.1. Real-Time Automatic Flight Strategy Formulation Based on Power Line Tracking
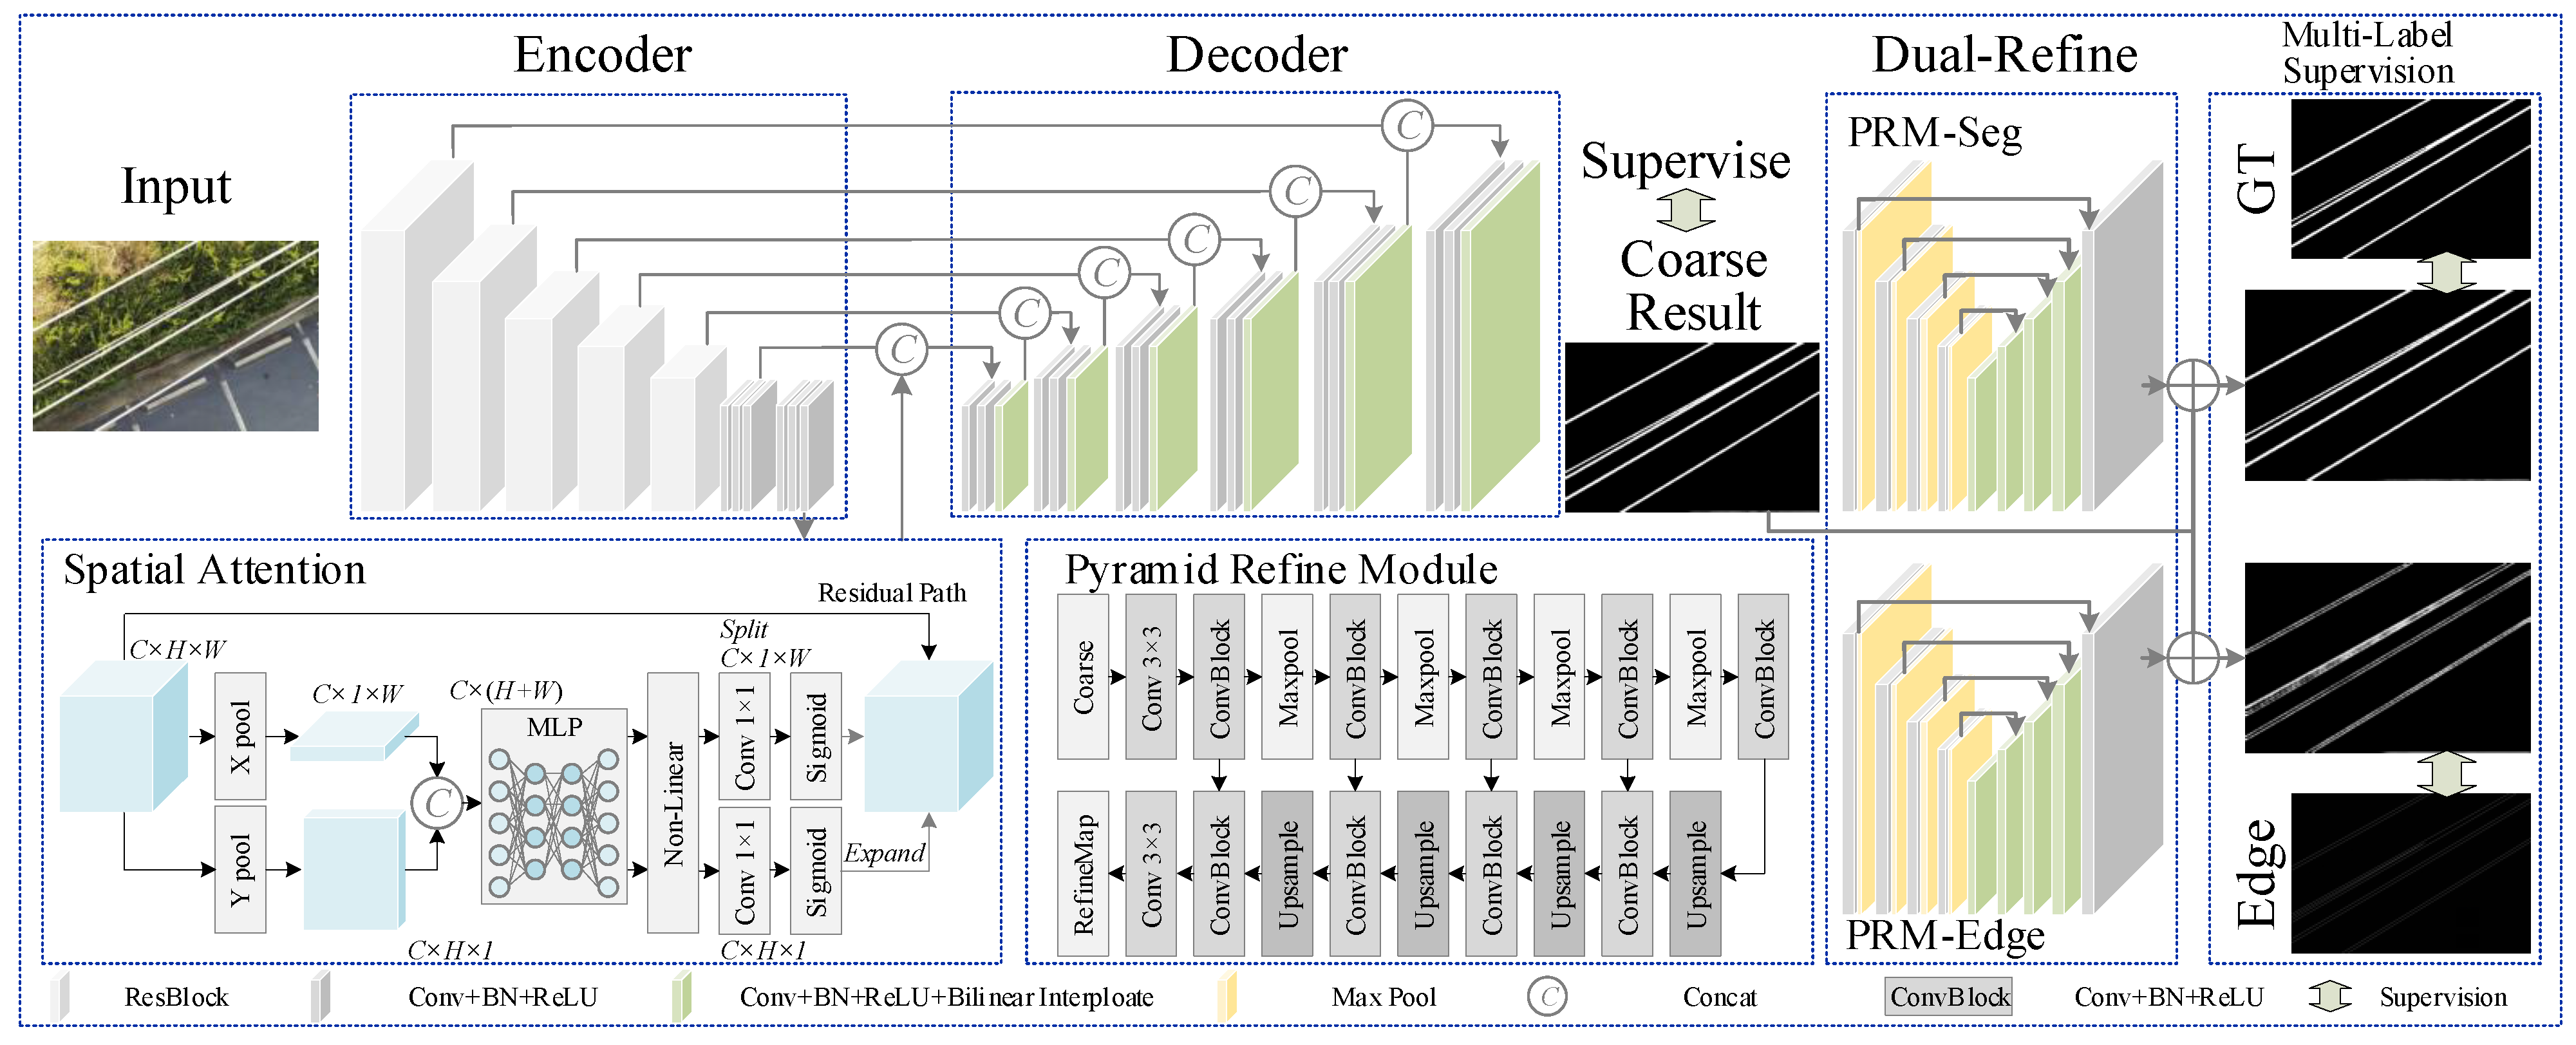
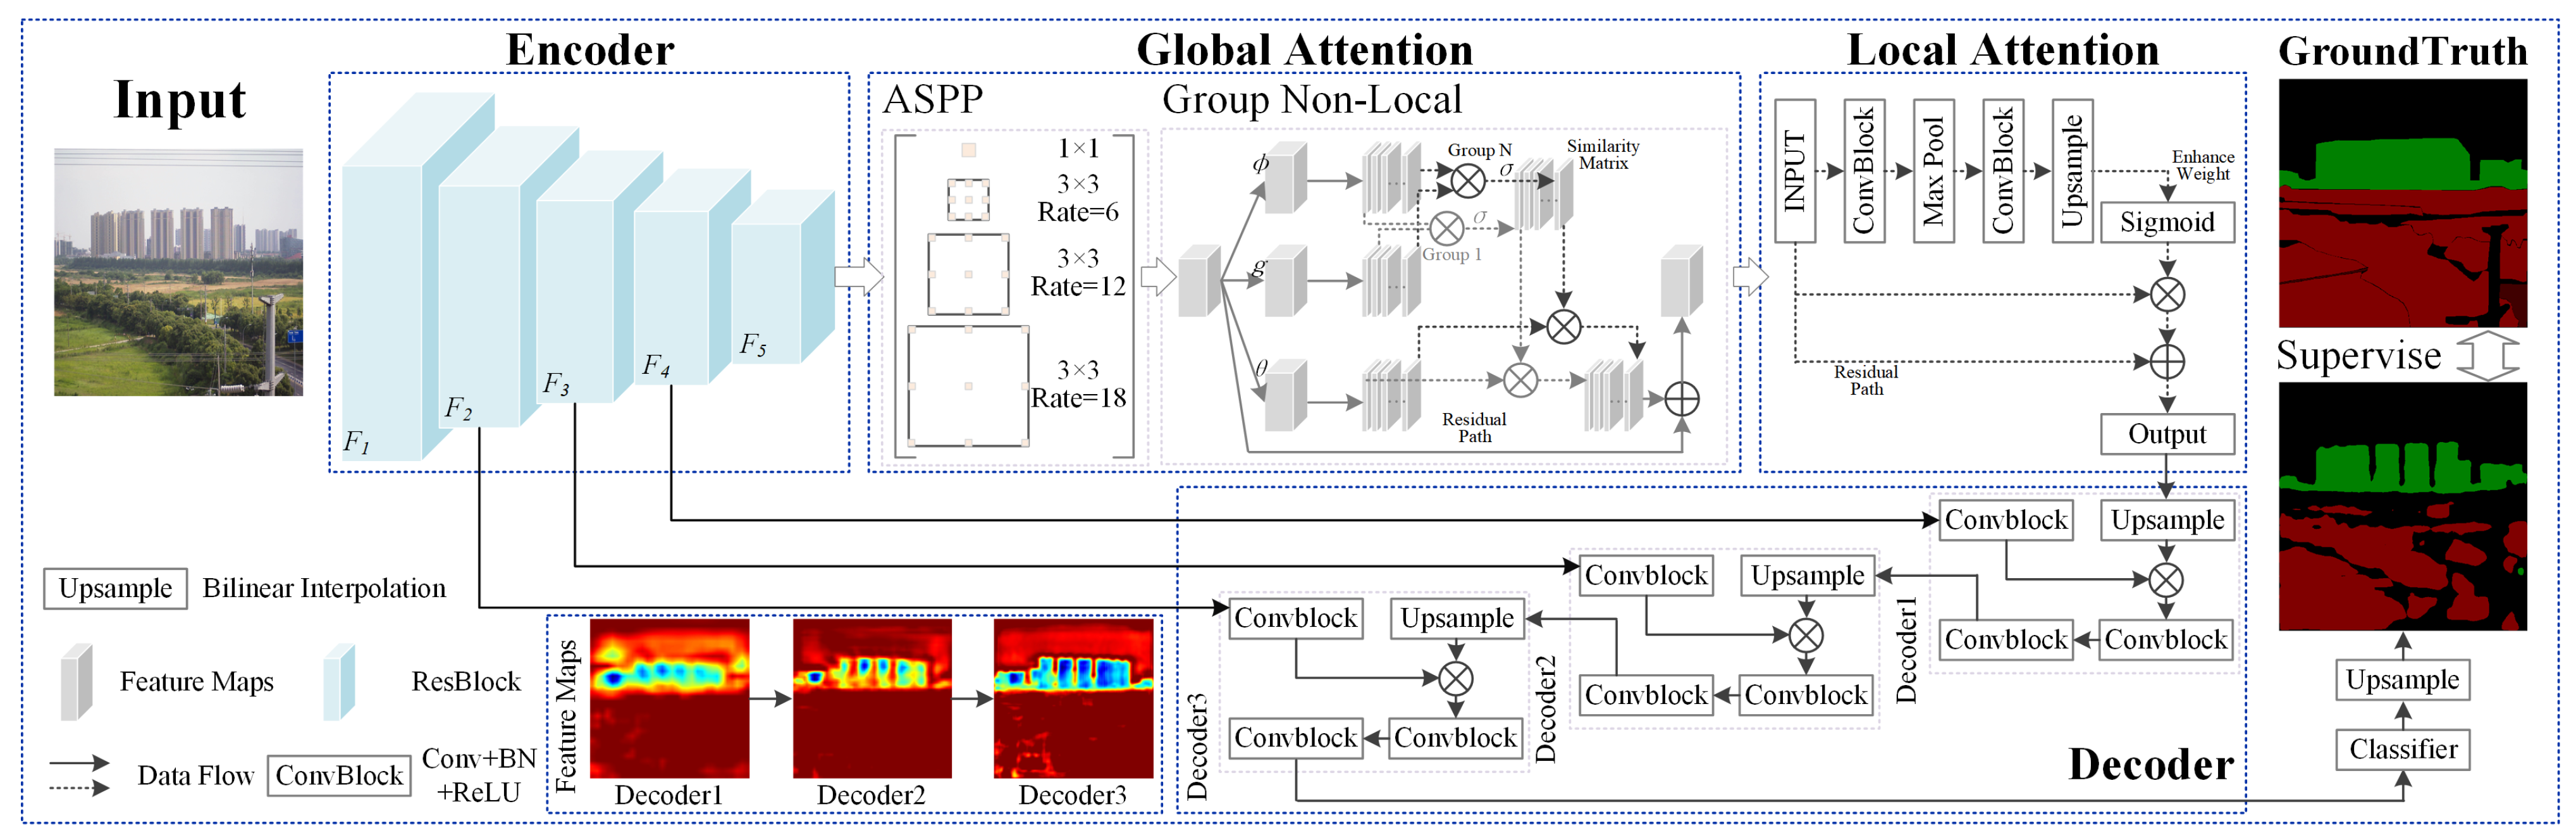
3.1.1. Edge-Assisted Power Line Detection
- (1)
- Spatial attention module
- (2)
- Dual-refinement module
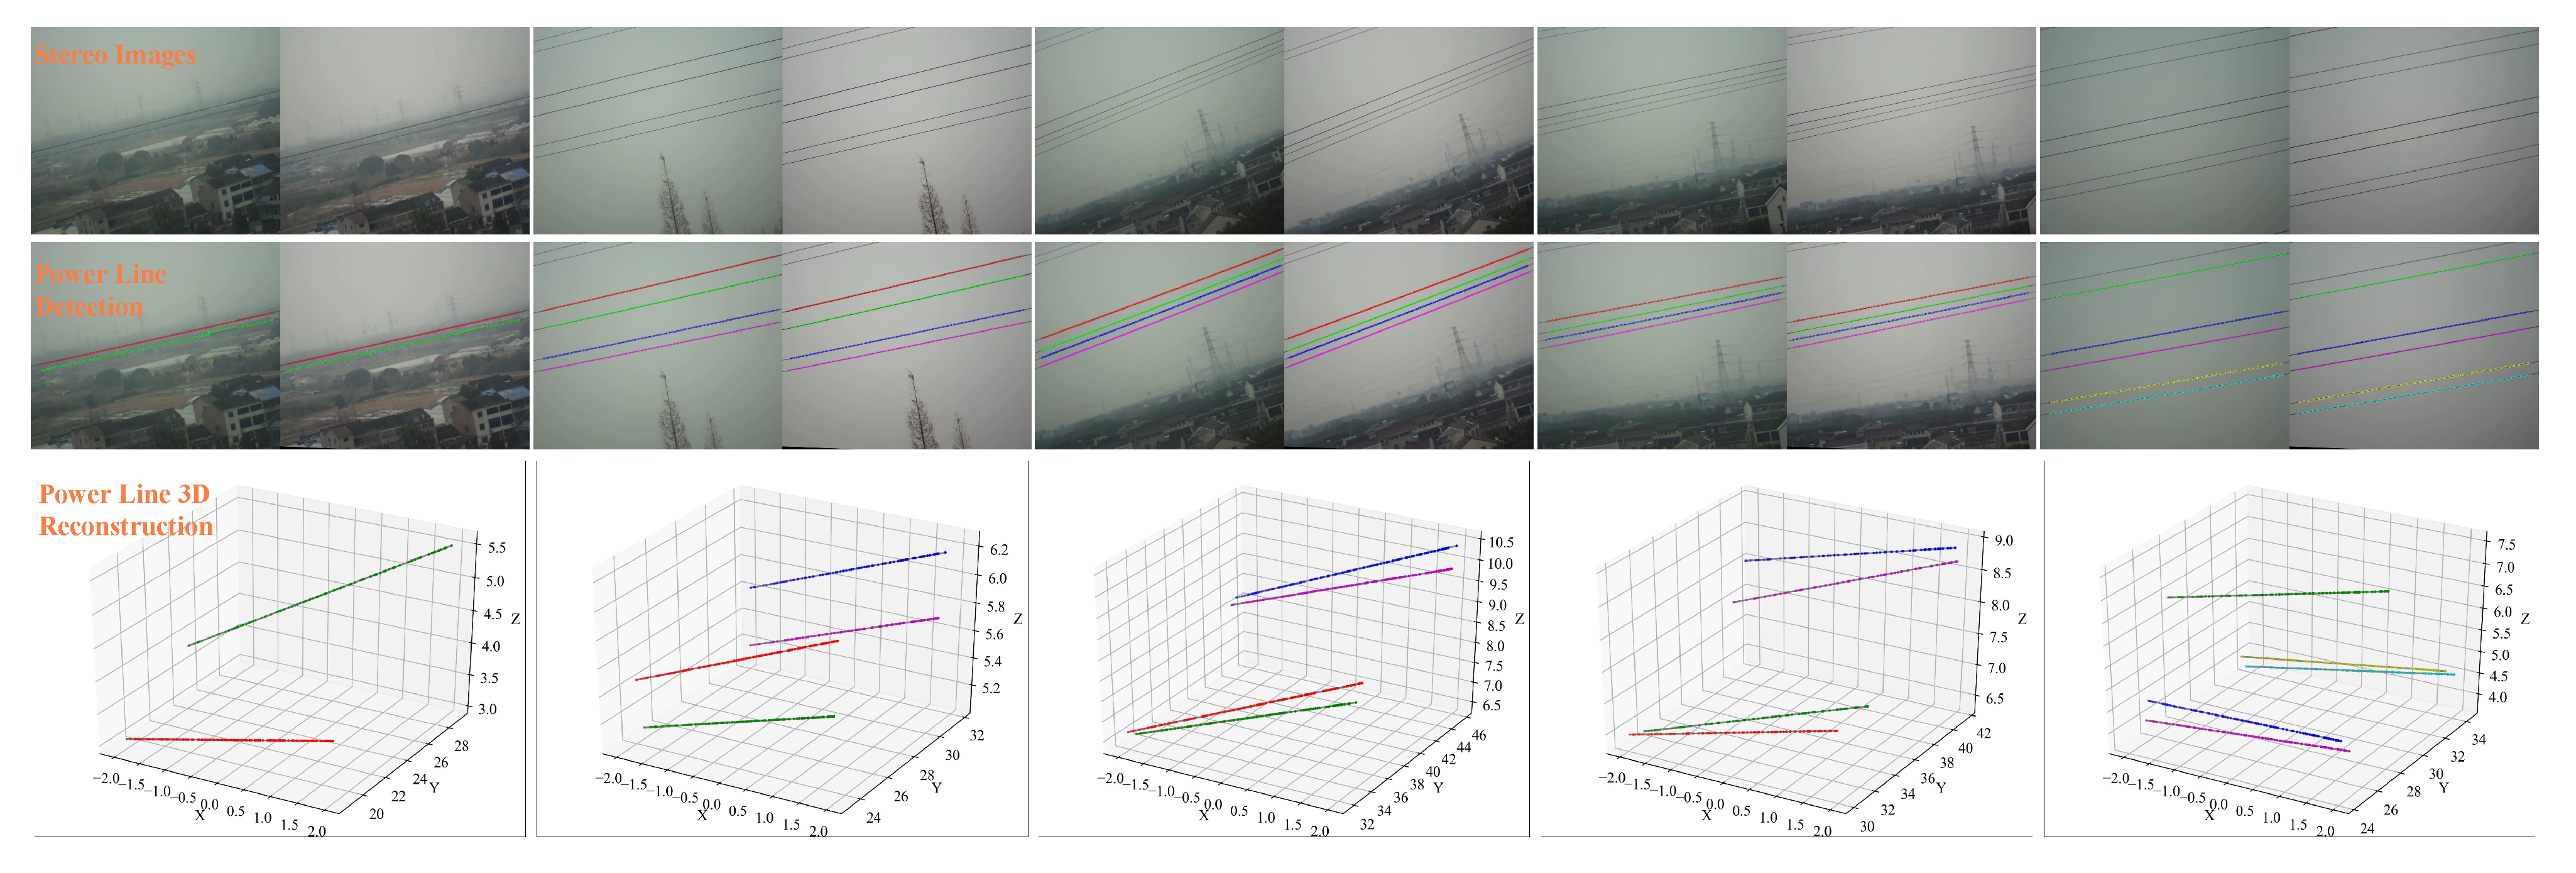
3.1.2. Binocular-Vision-Based Power Line 3D Reconstruction
3.1.3. Power Line Tracking Guided Automatic Flight Strategy Formulation
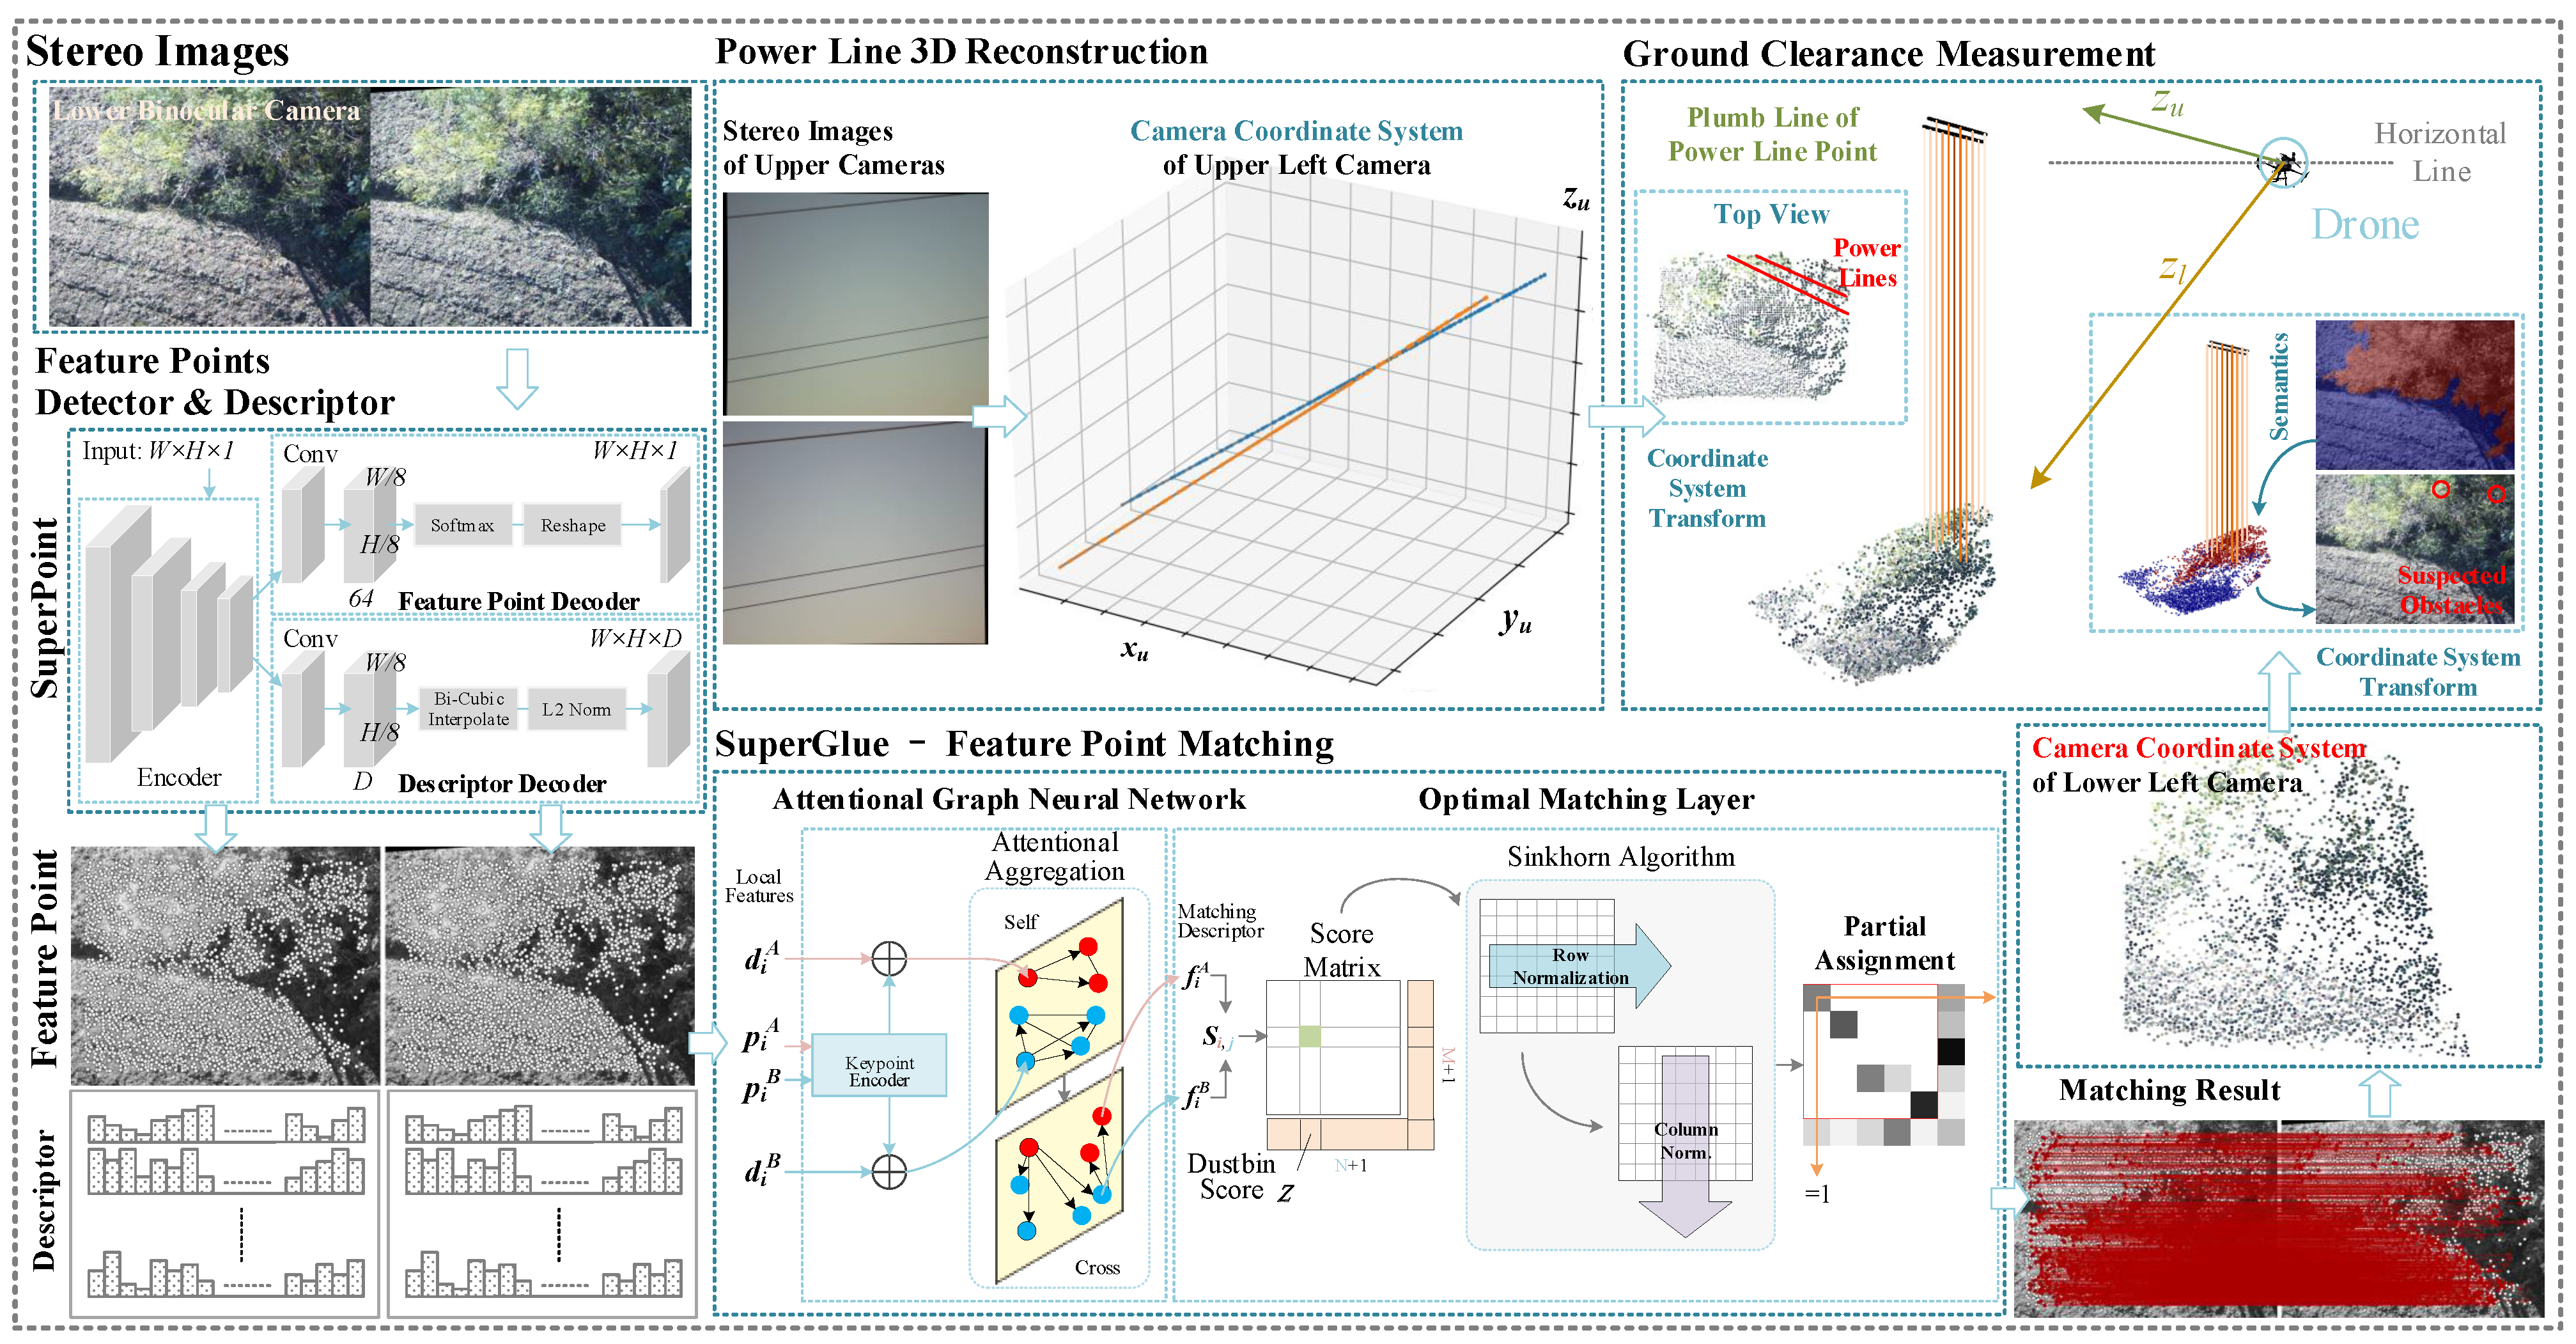
3.2. Ground Clearance Measurement and Detection of Transmission Corridors
3.2.1. Ground Object Classification Based on Light-Weight Semantic Segmentation Network
3.2.2. Ground Clearance Measurement and Detection
- (1)
- 3D point reconstruction of ground objects based on feature point matching
- (2)
- Ground clearance measurement and detection based on local 3D points of the corridor
4. Results
4.1. Experiments of Power Line Detection
4.1.1. Datasets and Implementation Details
- (1)
- Transmission Towers and Power Lines Aerial-image Dataset (TTPLA)
- (2)
- Power Line Image Dataset (PLID)
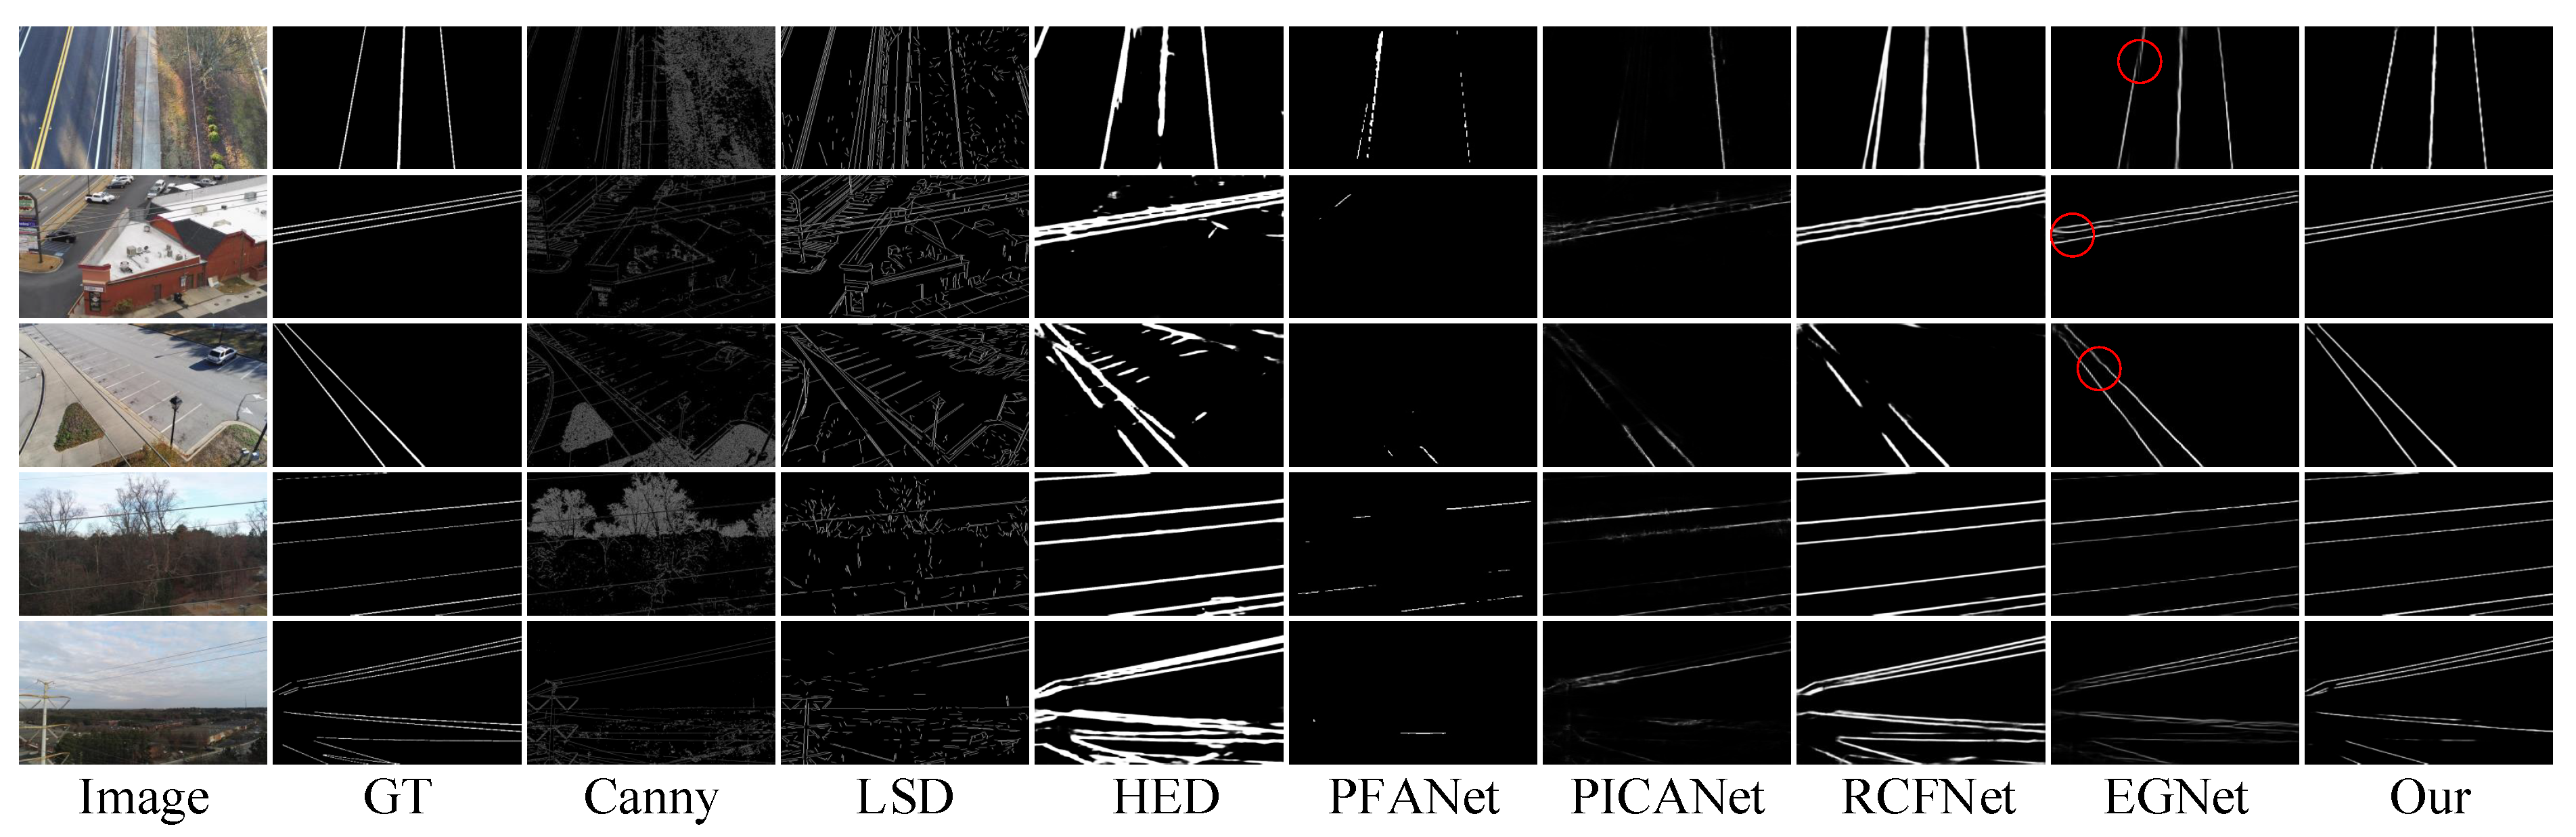
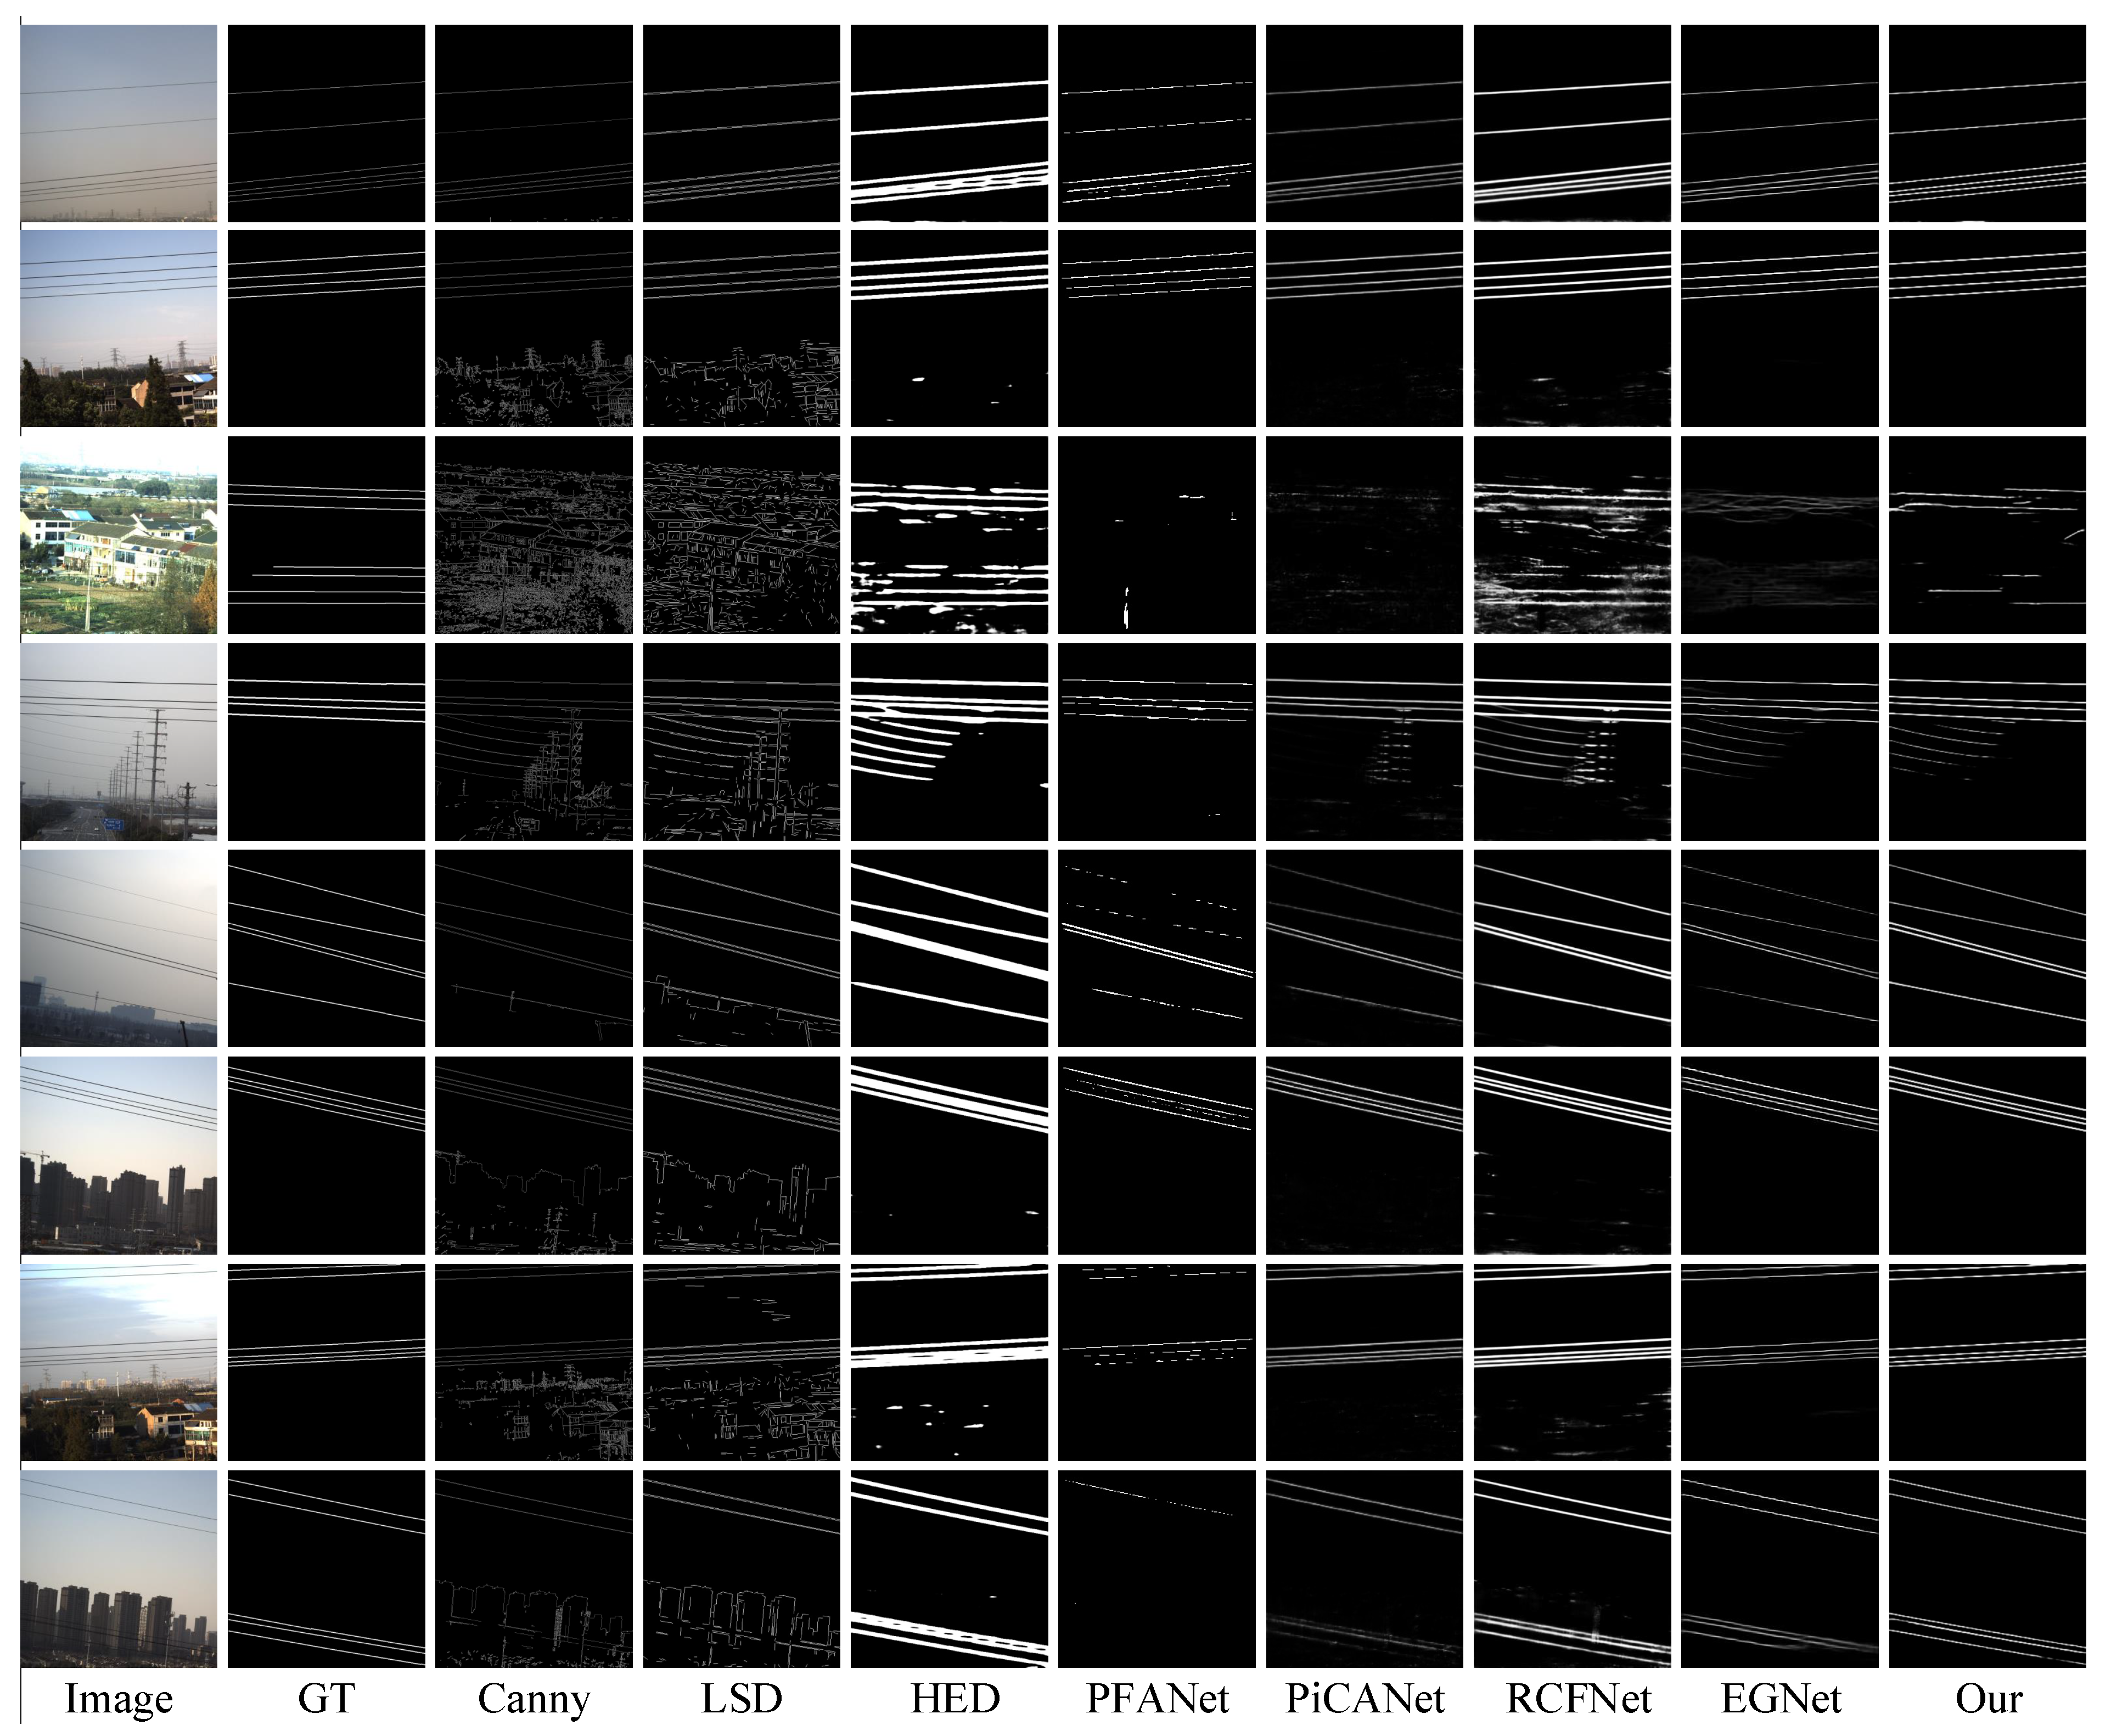
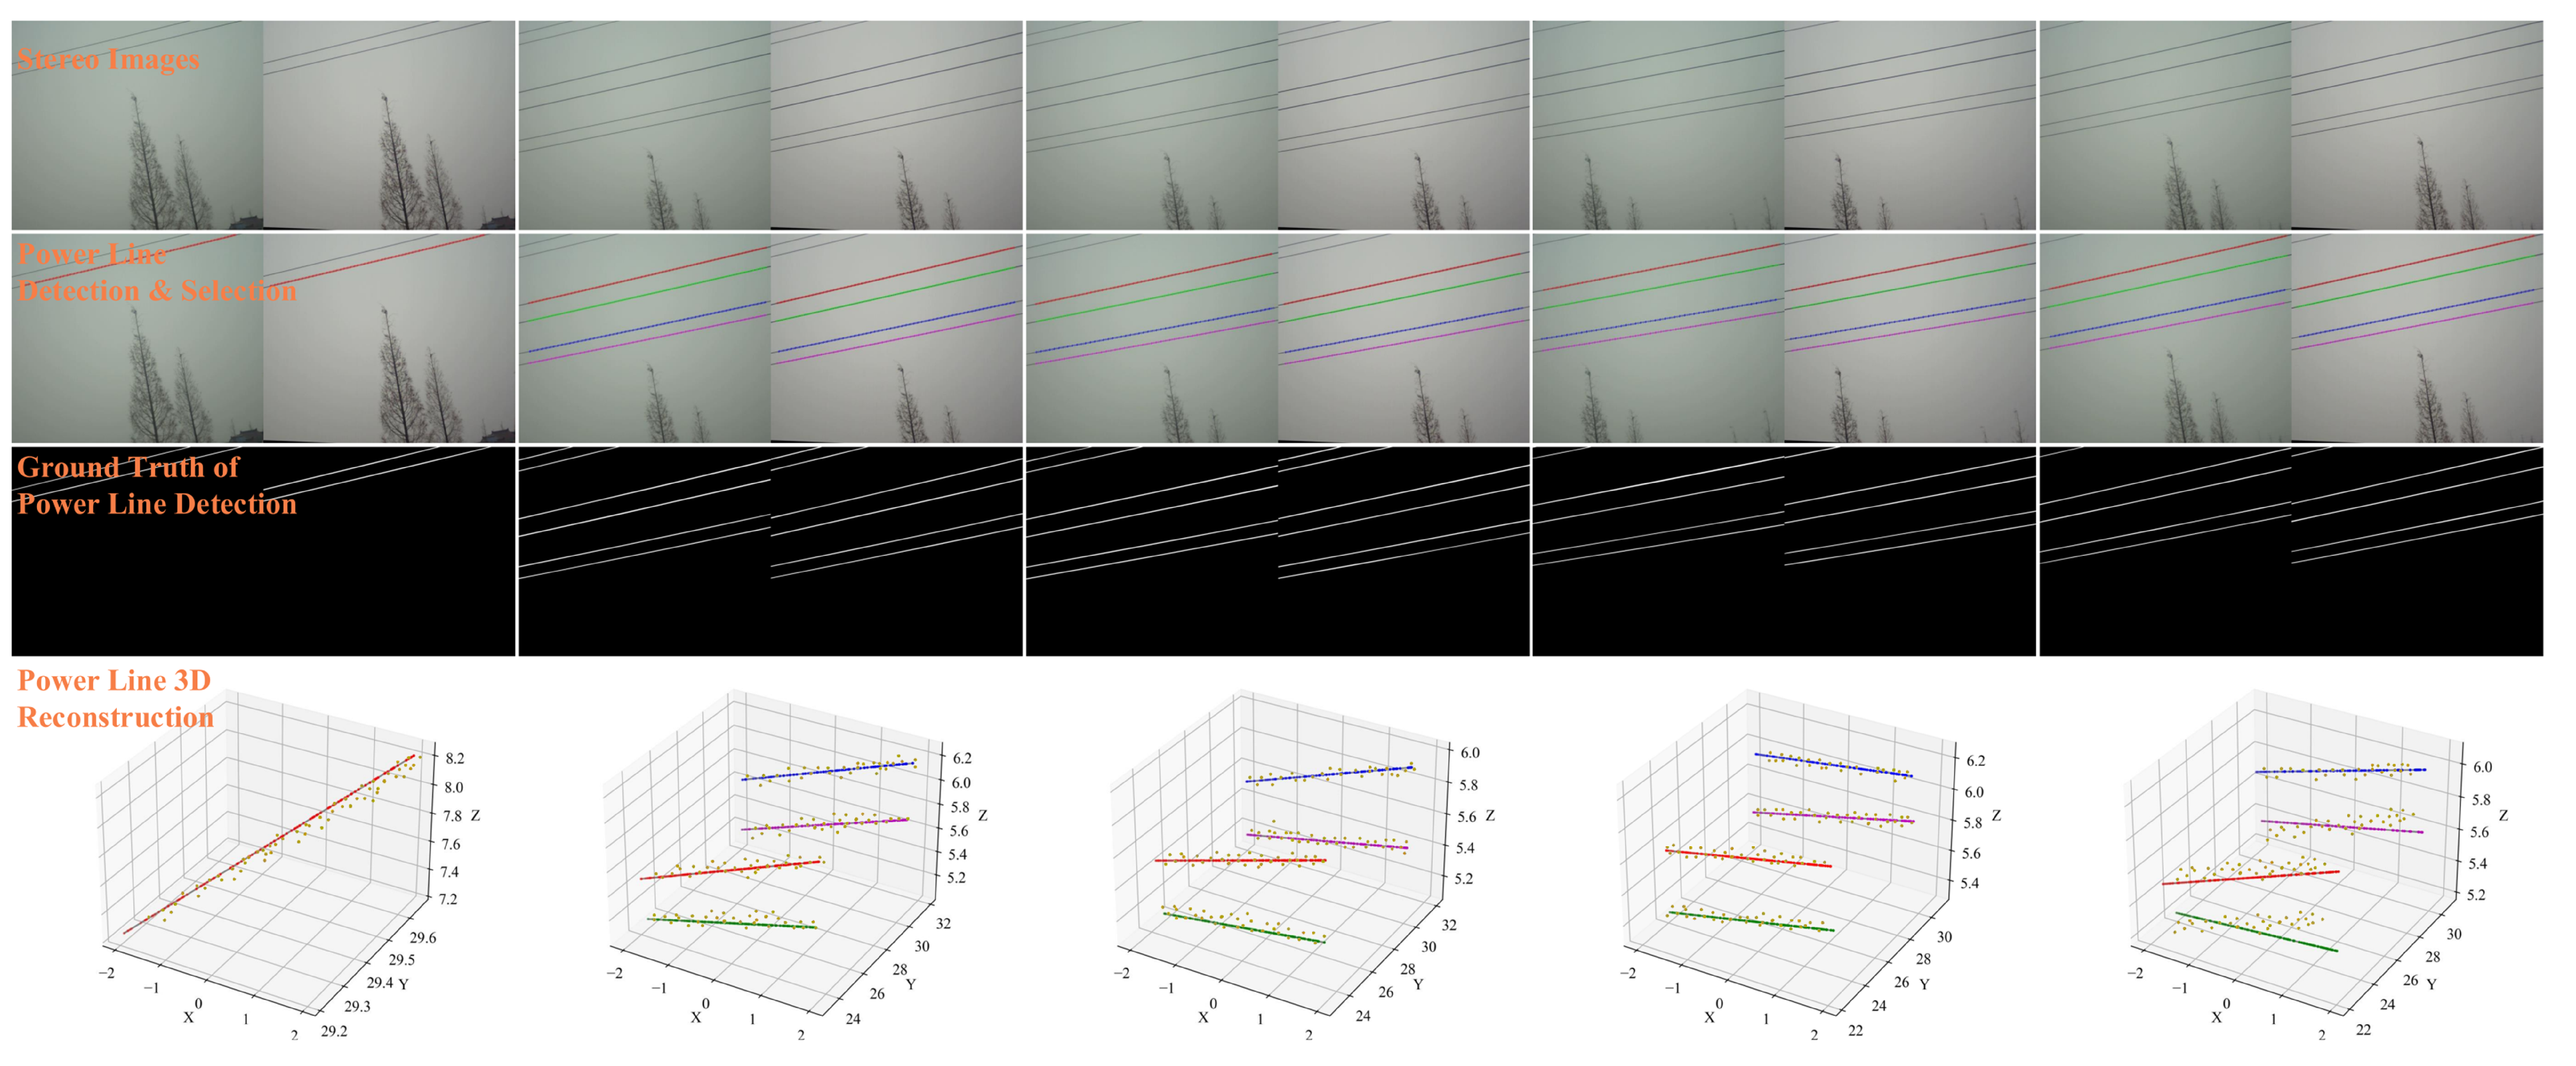
4.1.2. Visual Comparison
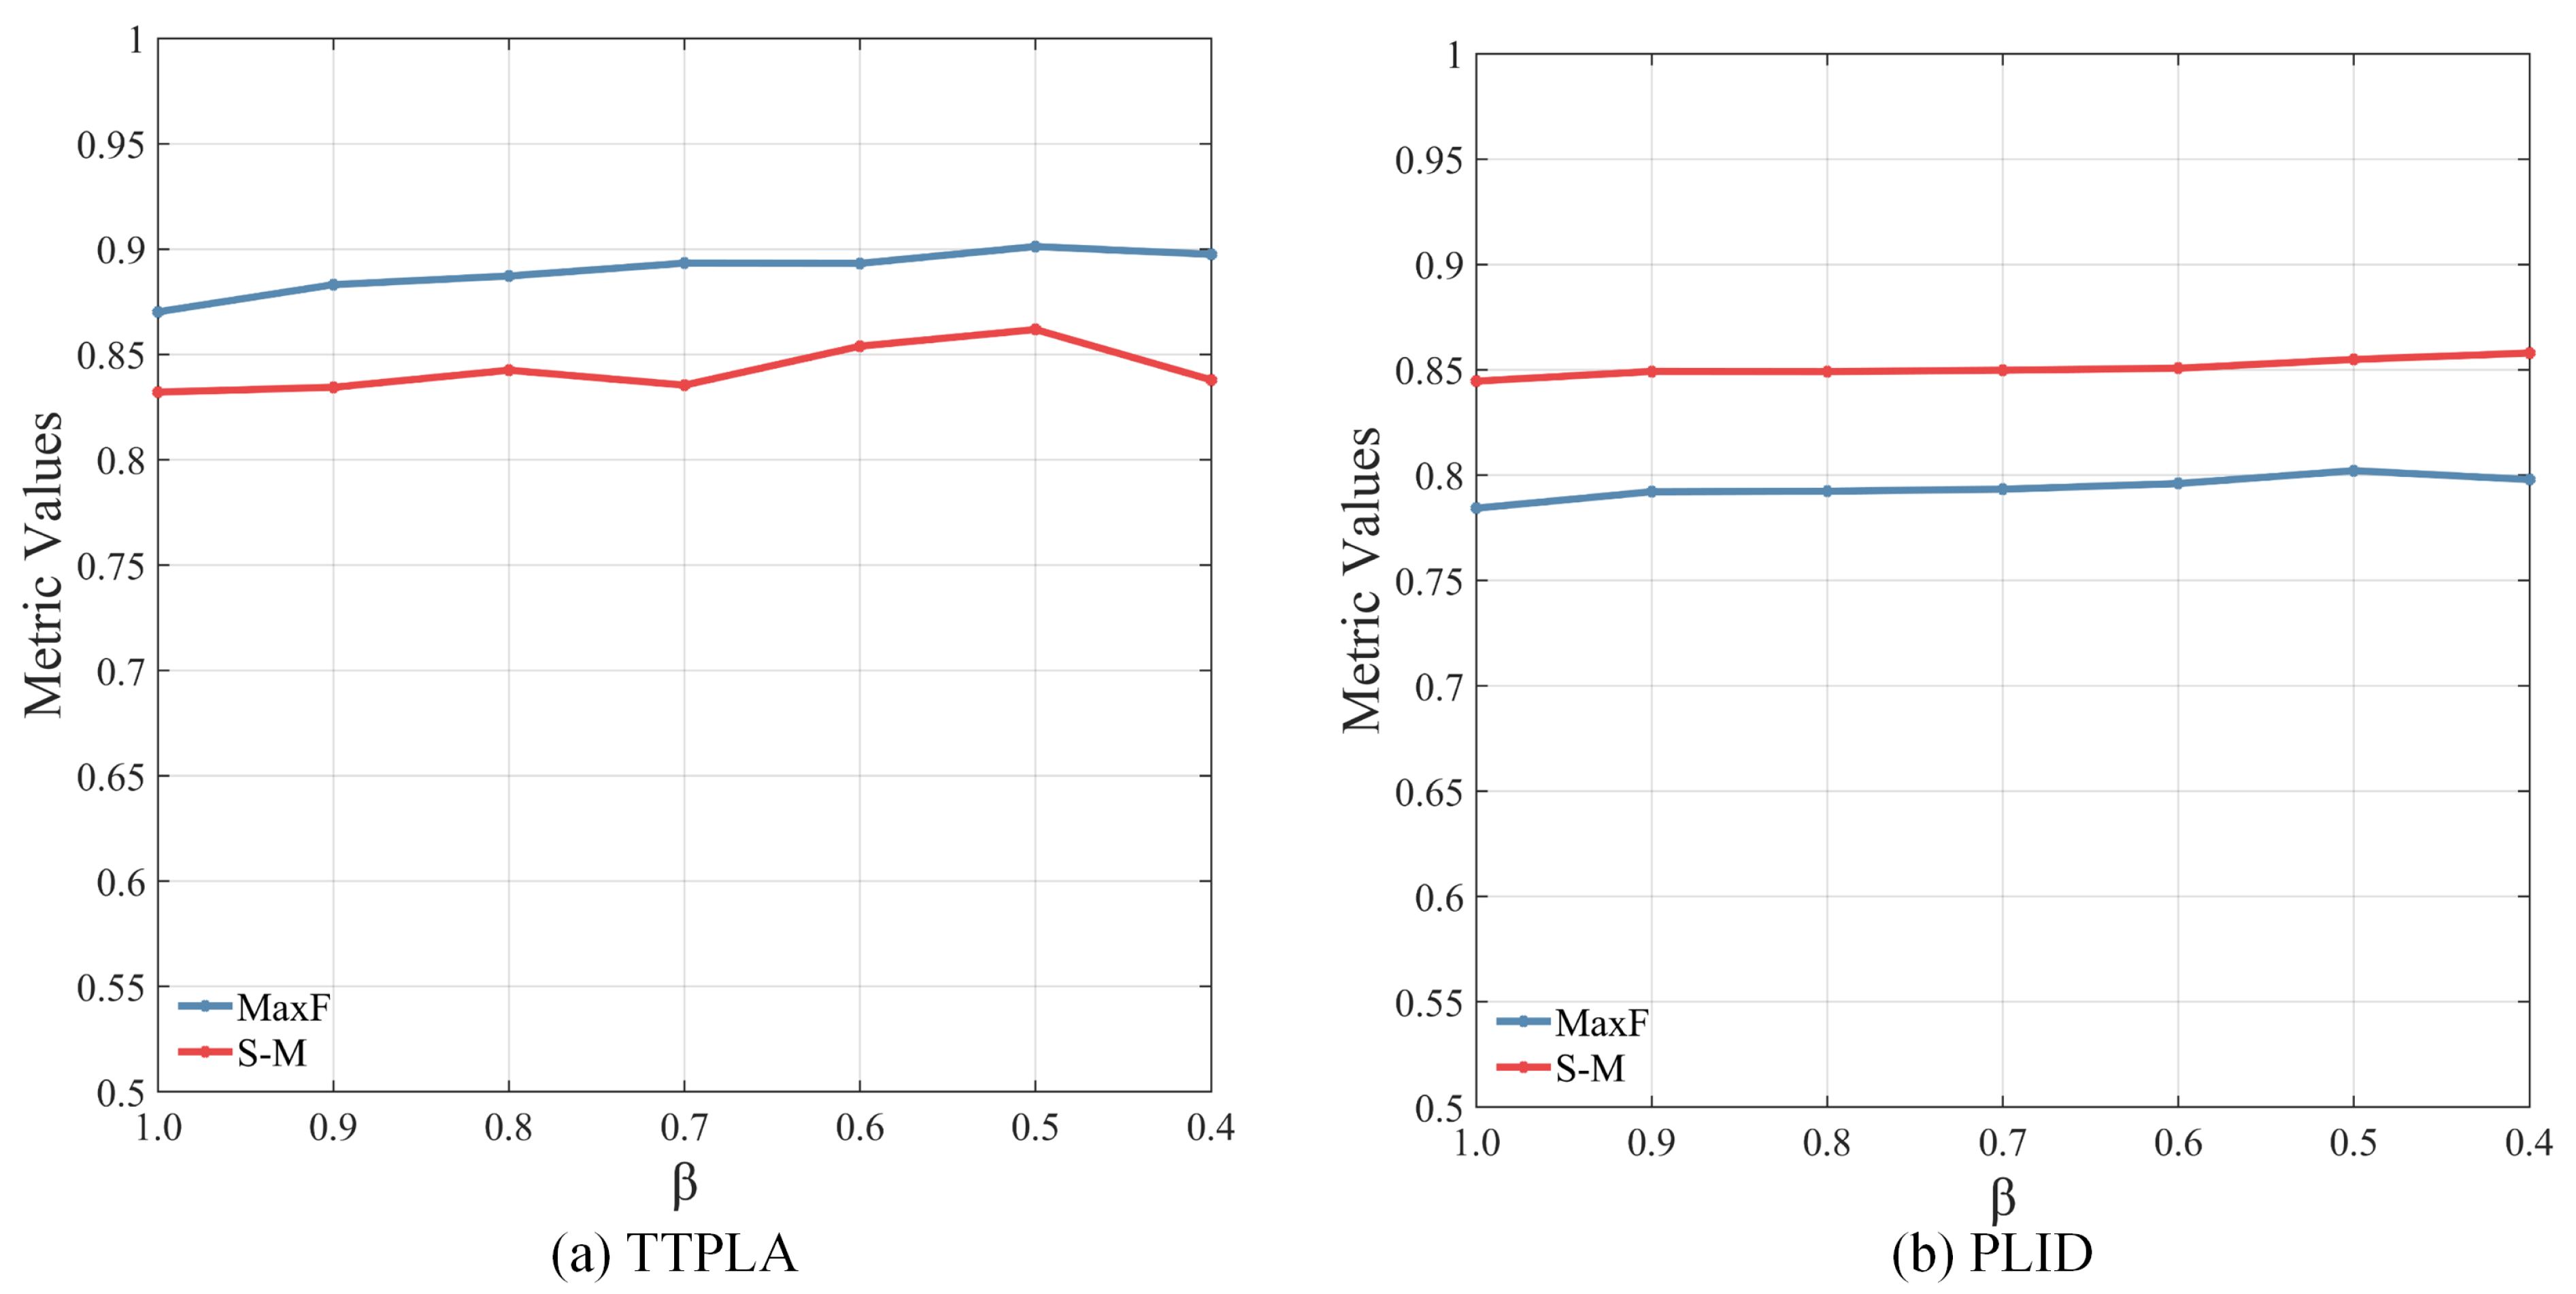
4.1.3. Quantitative Evaluation
4.2. Experiments of Power Line Tracking
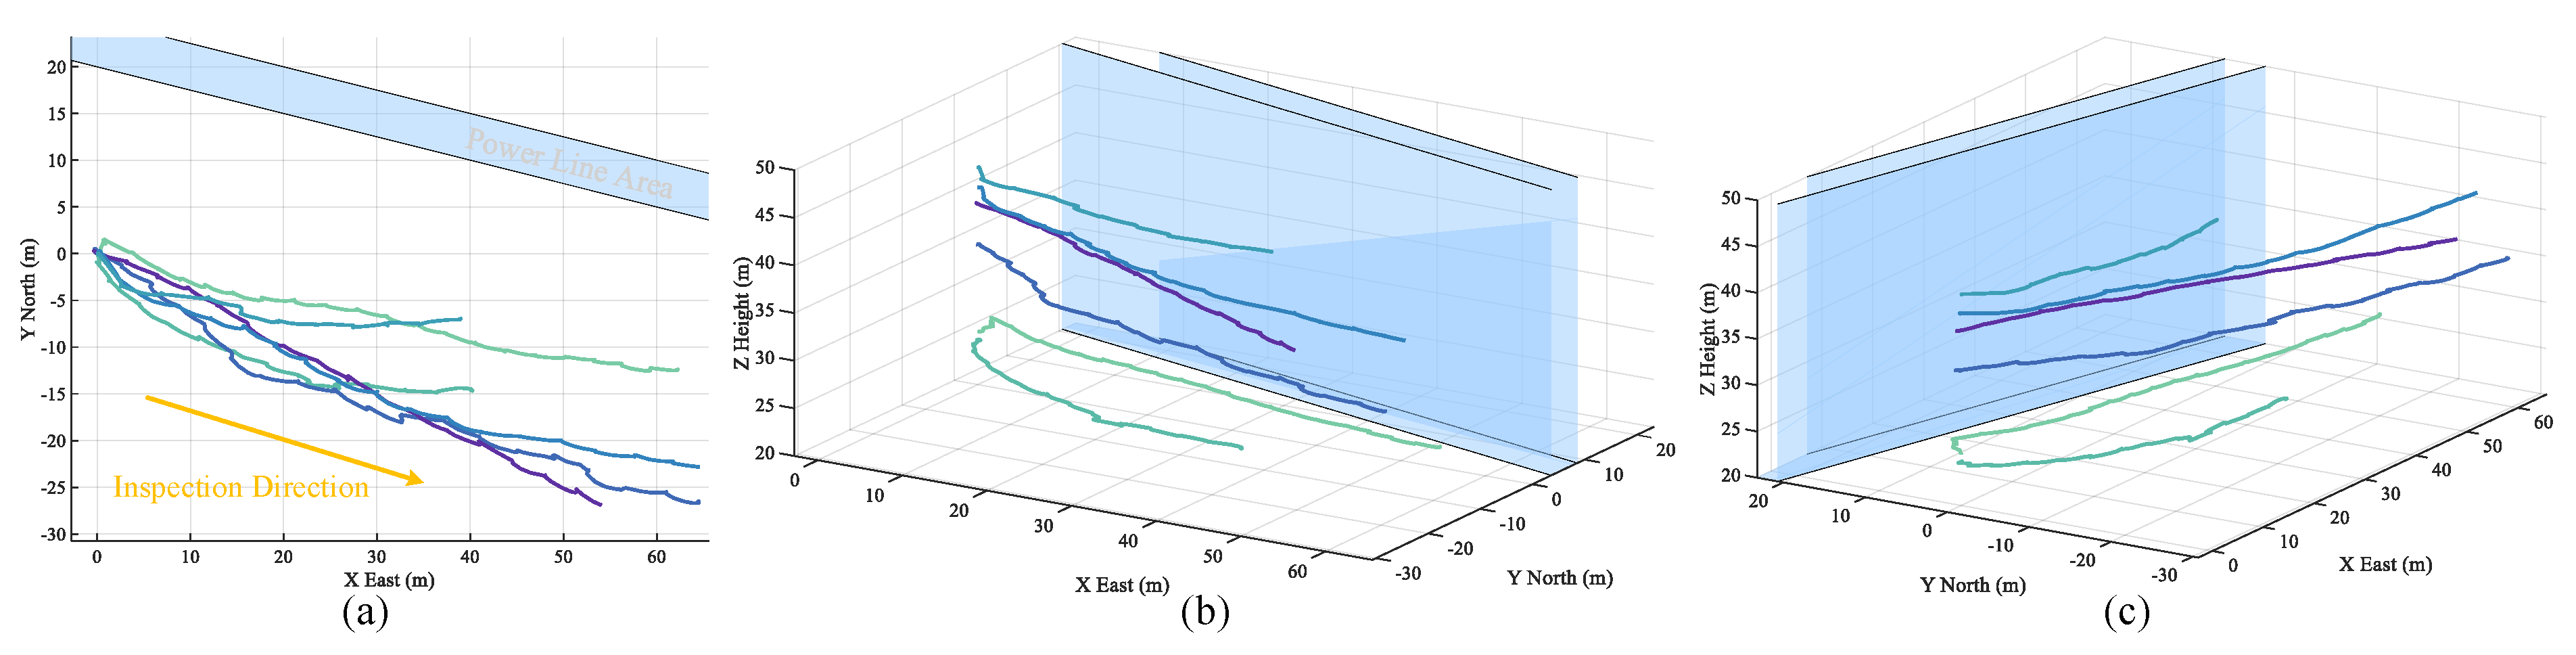
4.2.1. Performance of Power Line 3D Reconstruction
4.2.2. Experiments of Autonomous Flight
4.3. Experiments of Ground Clearance Measurement and Detection
4.3.1. Performance of the Proposed Aerial Image Classification Network
- (1)
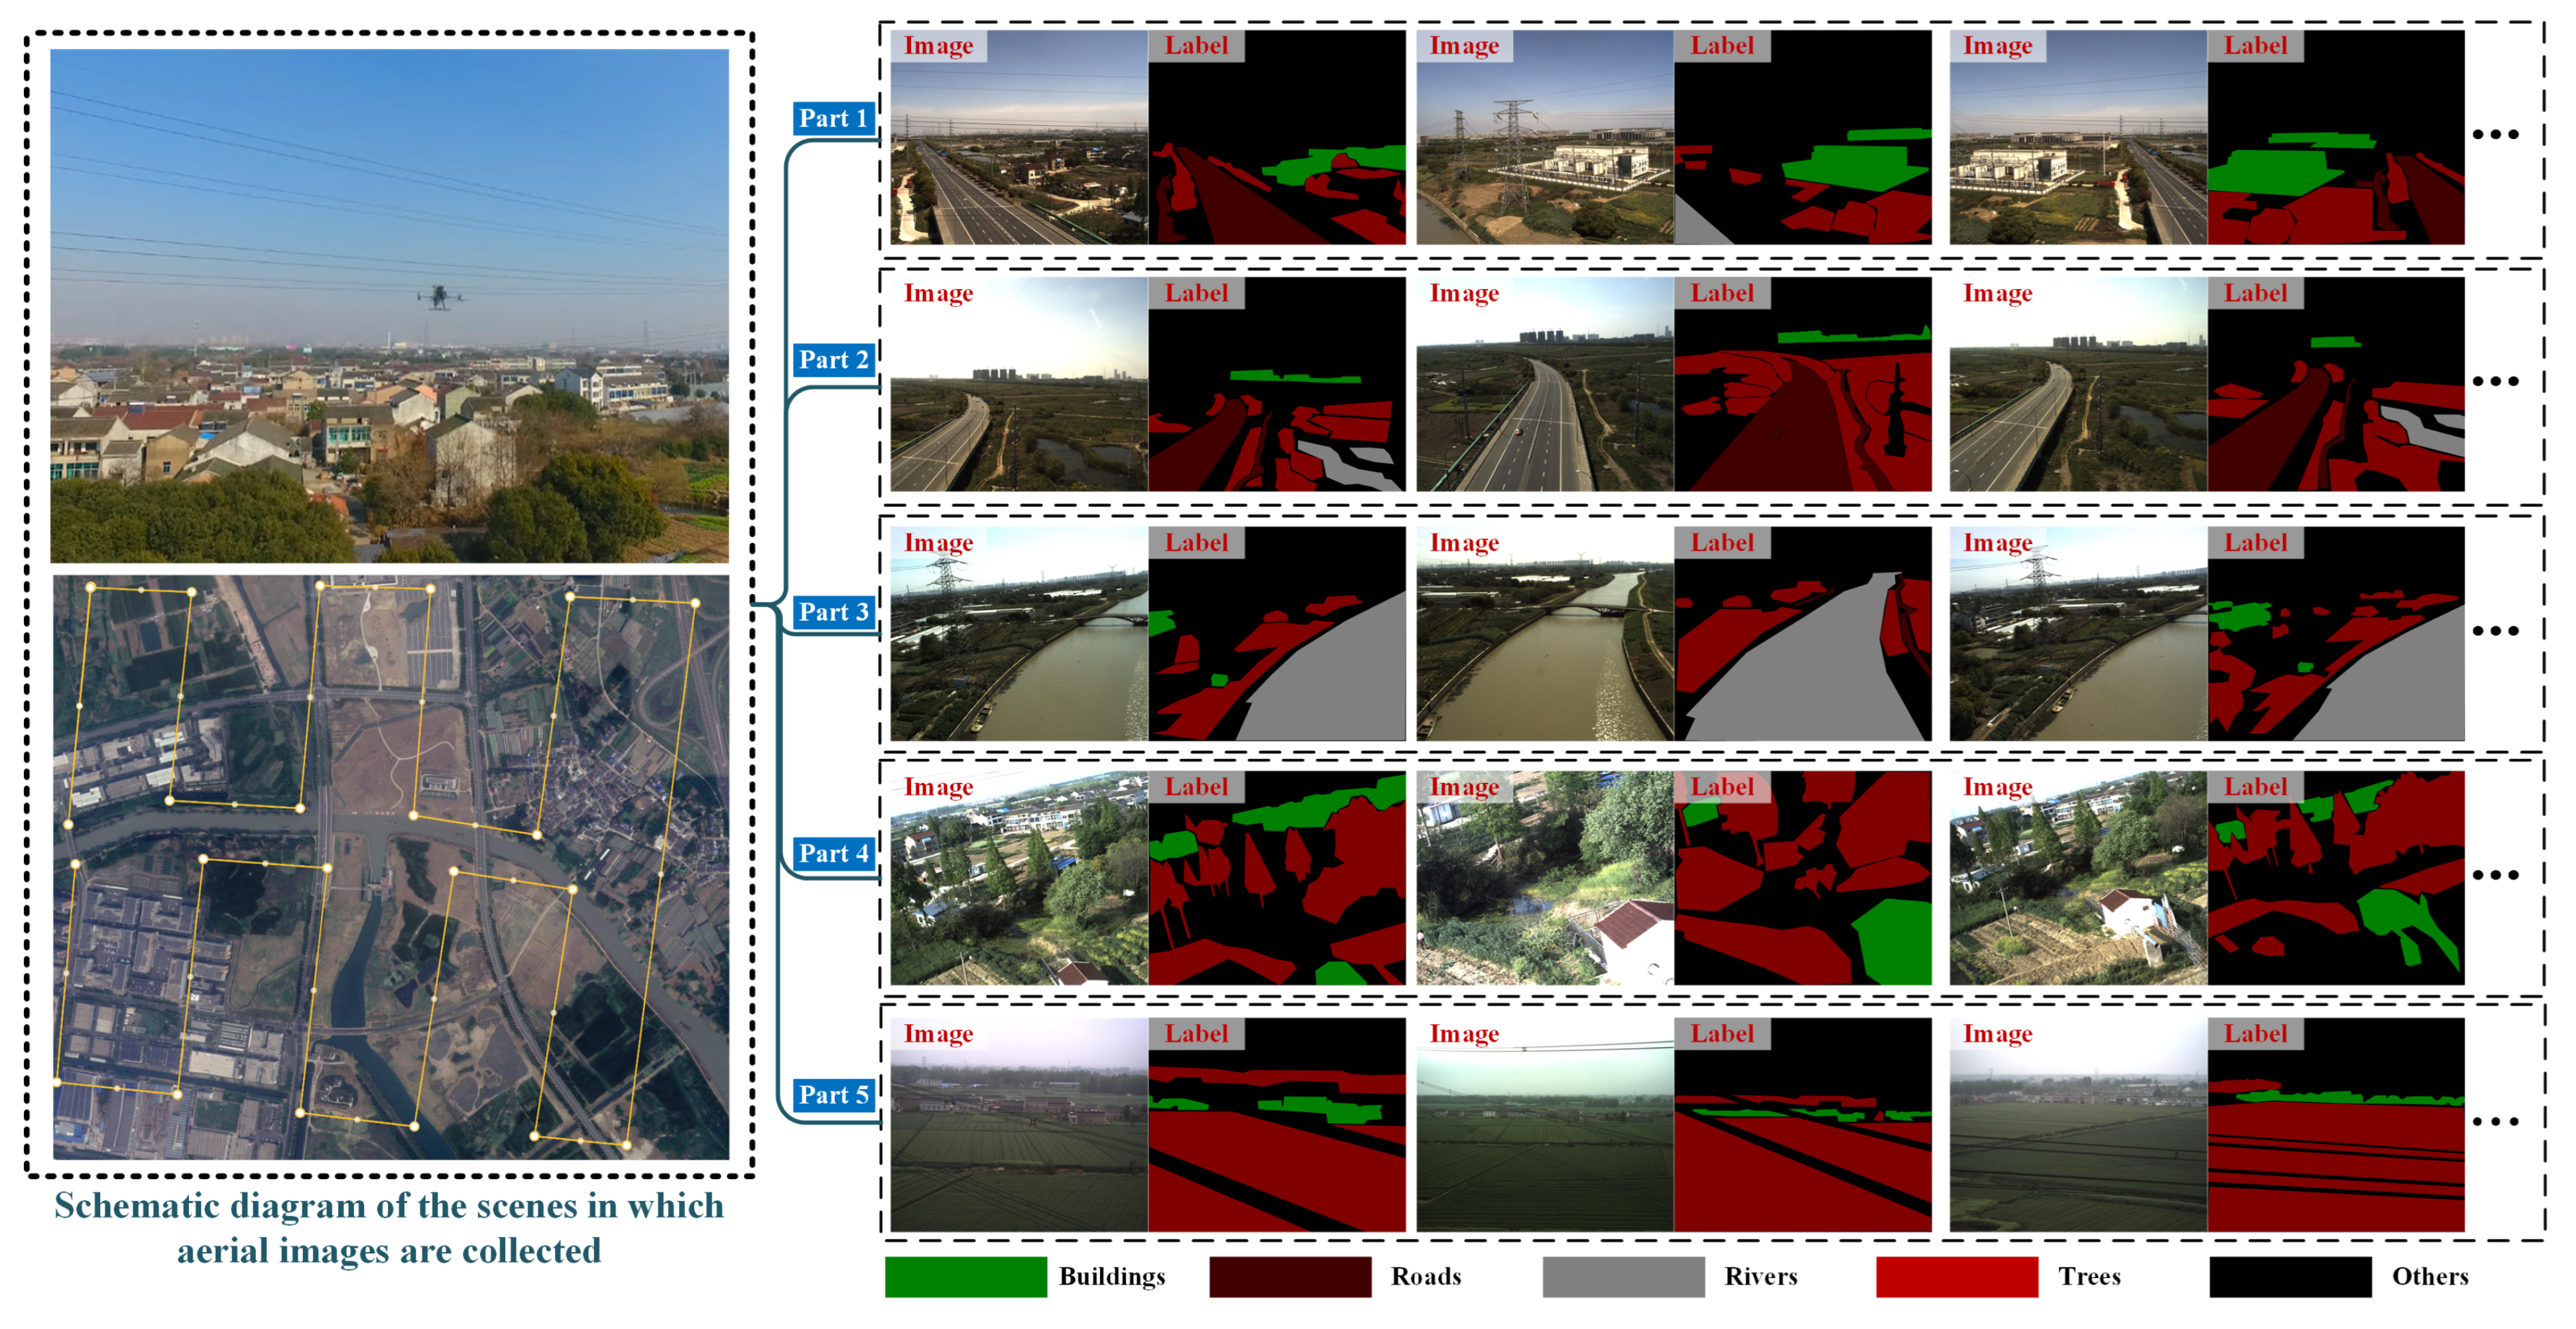
- Datasets and implementation details
- (2)
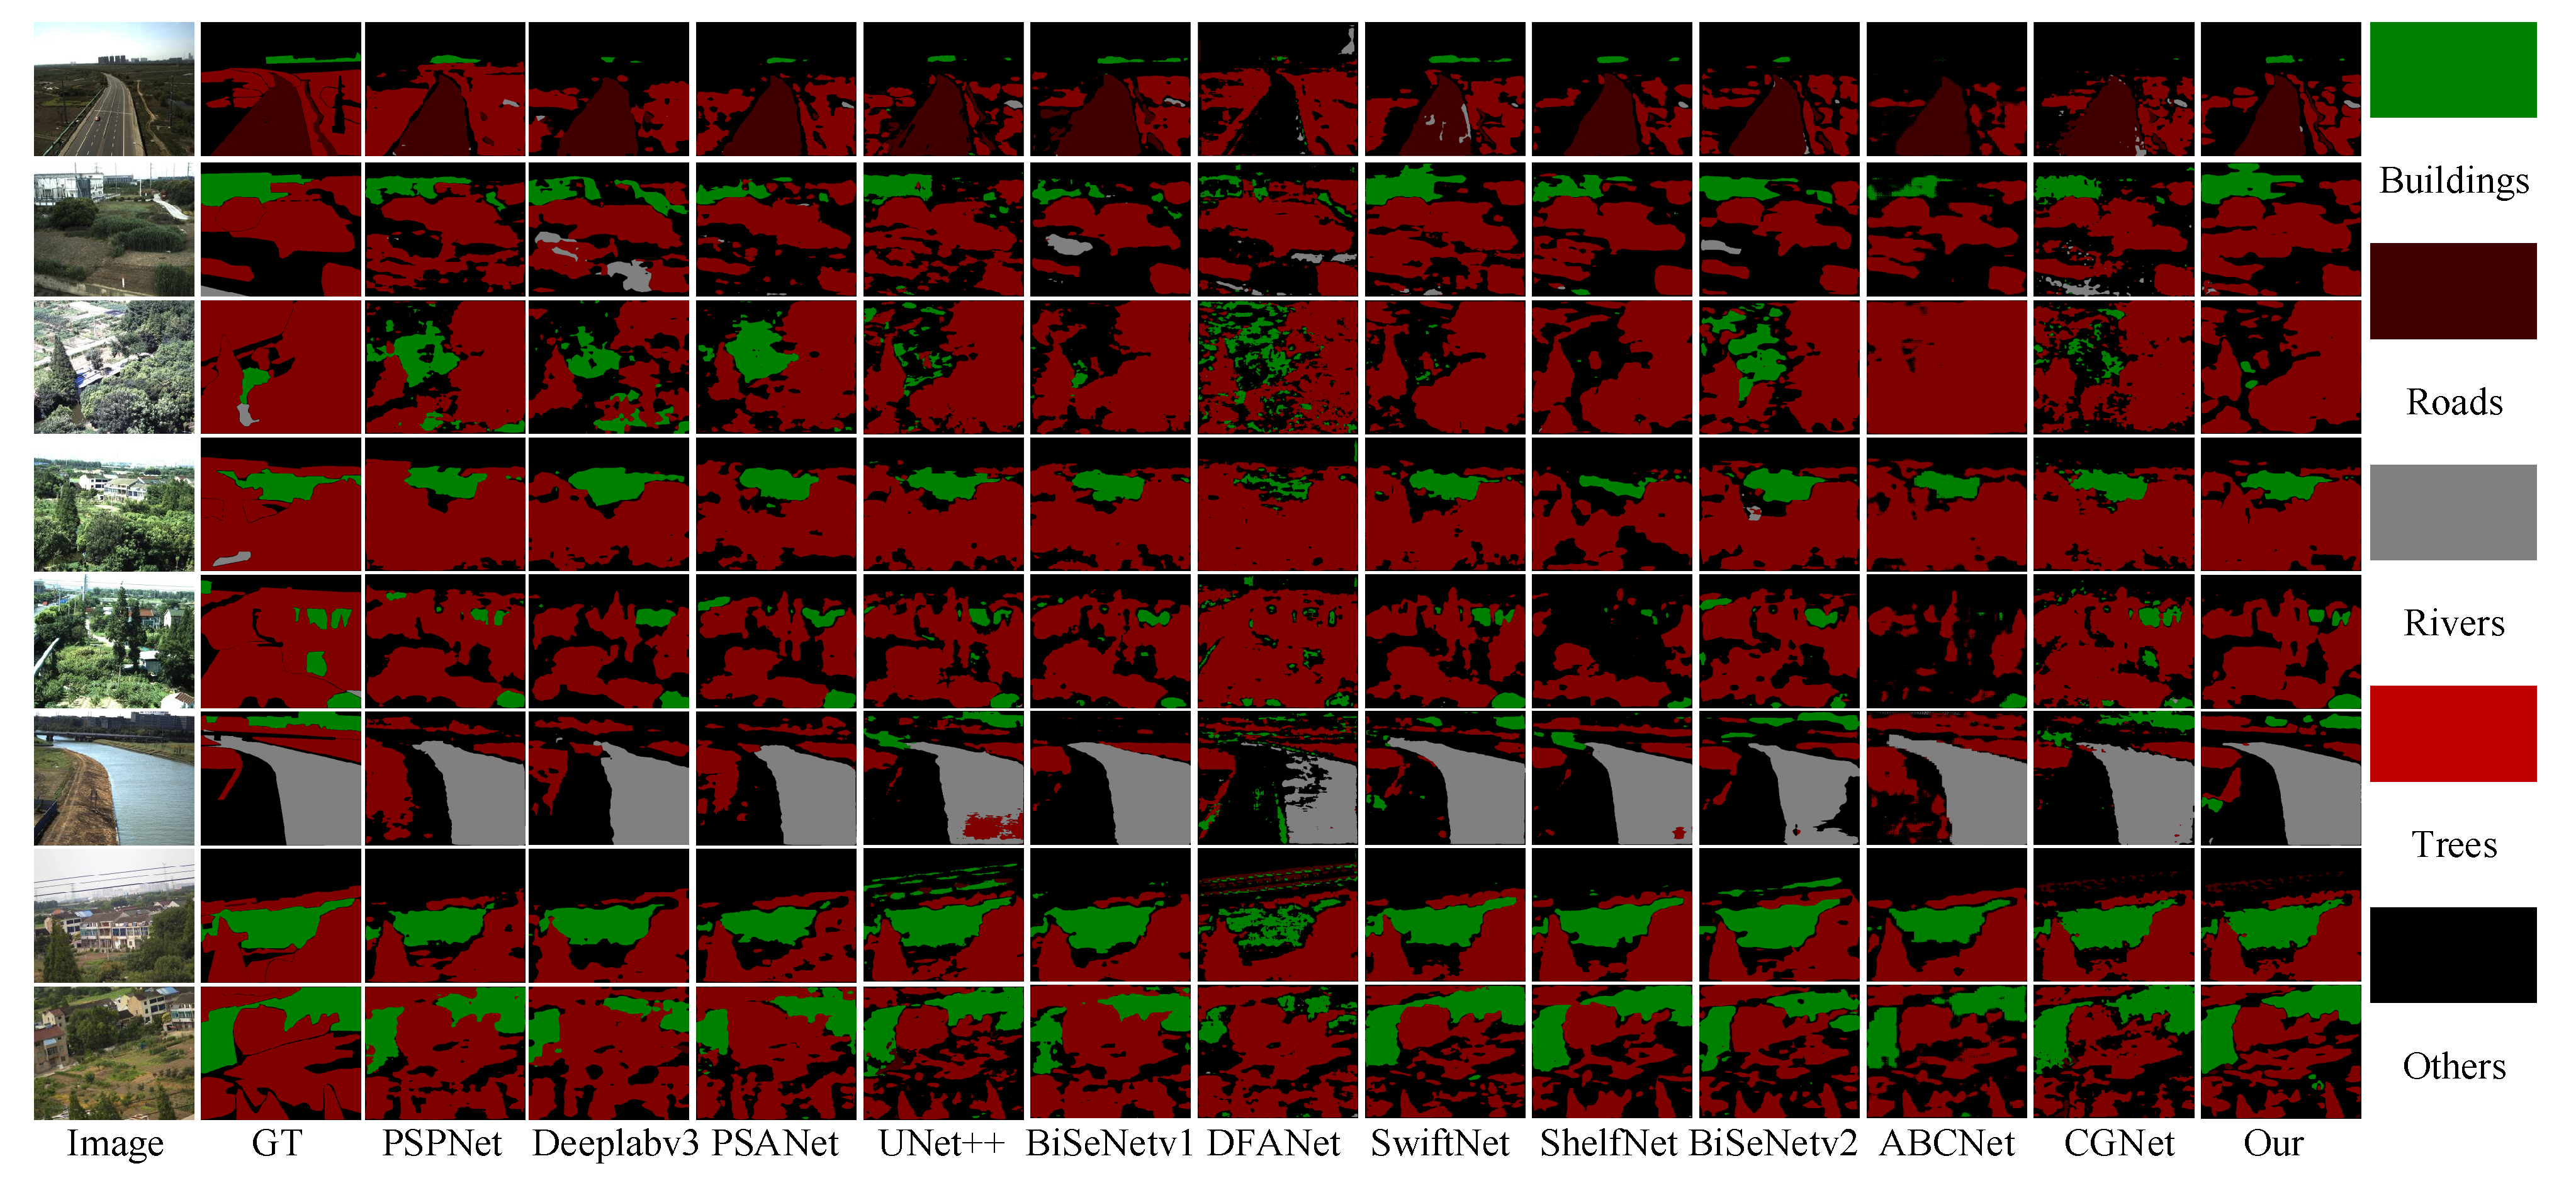
- Visual comparison
- (3)
- Quantitative evaluation
4.3.2. Performance of the Clearance Distance Measure Method
- (1)
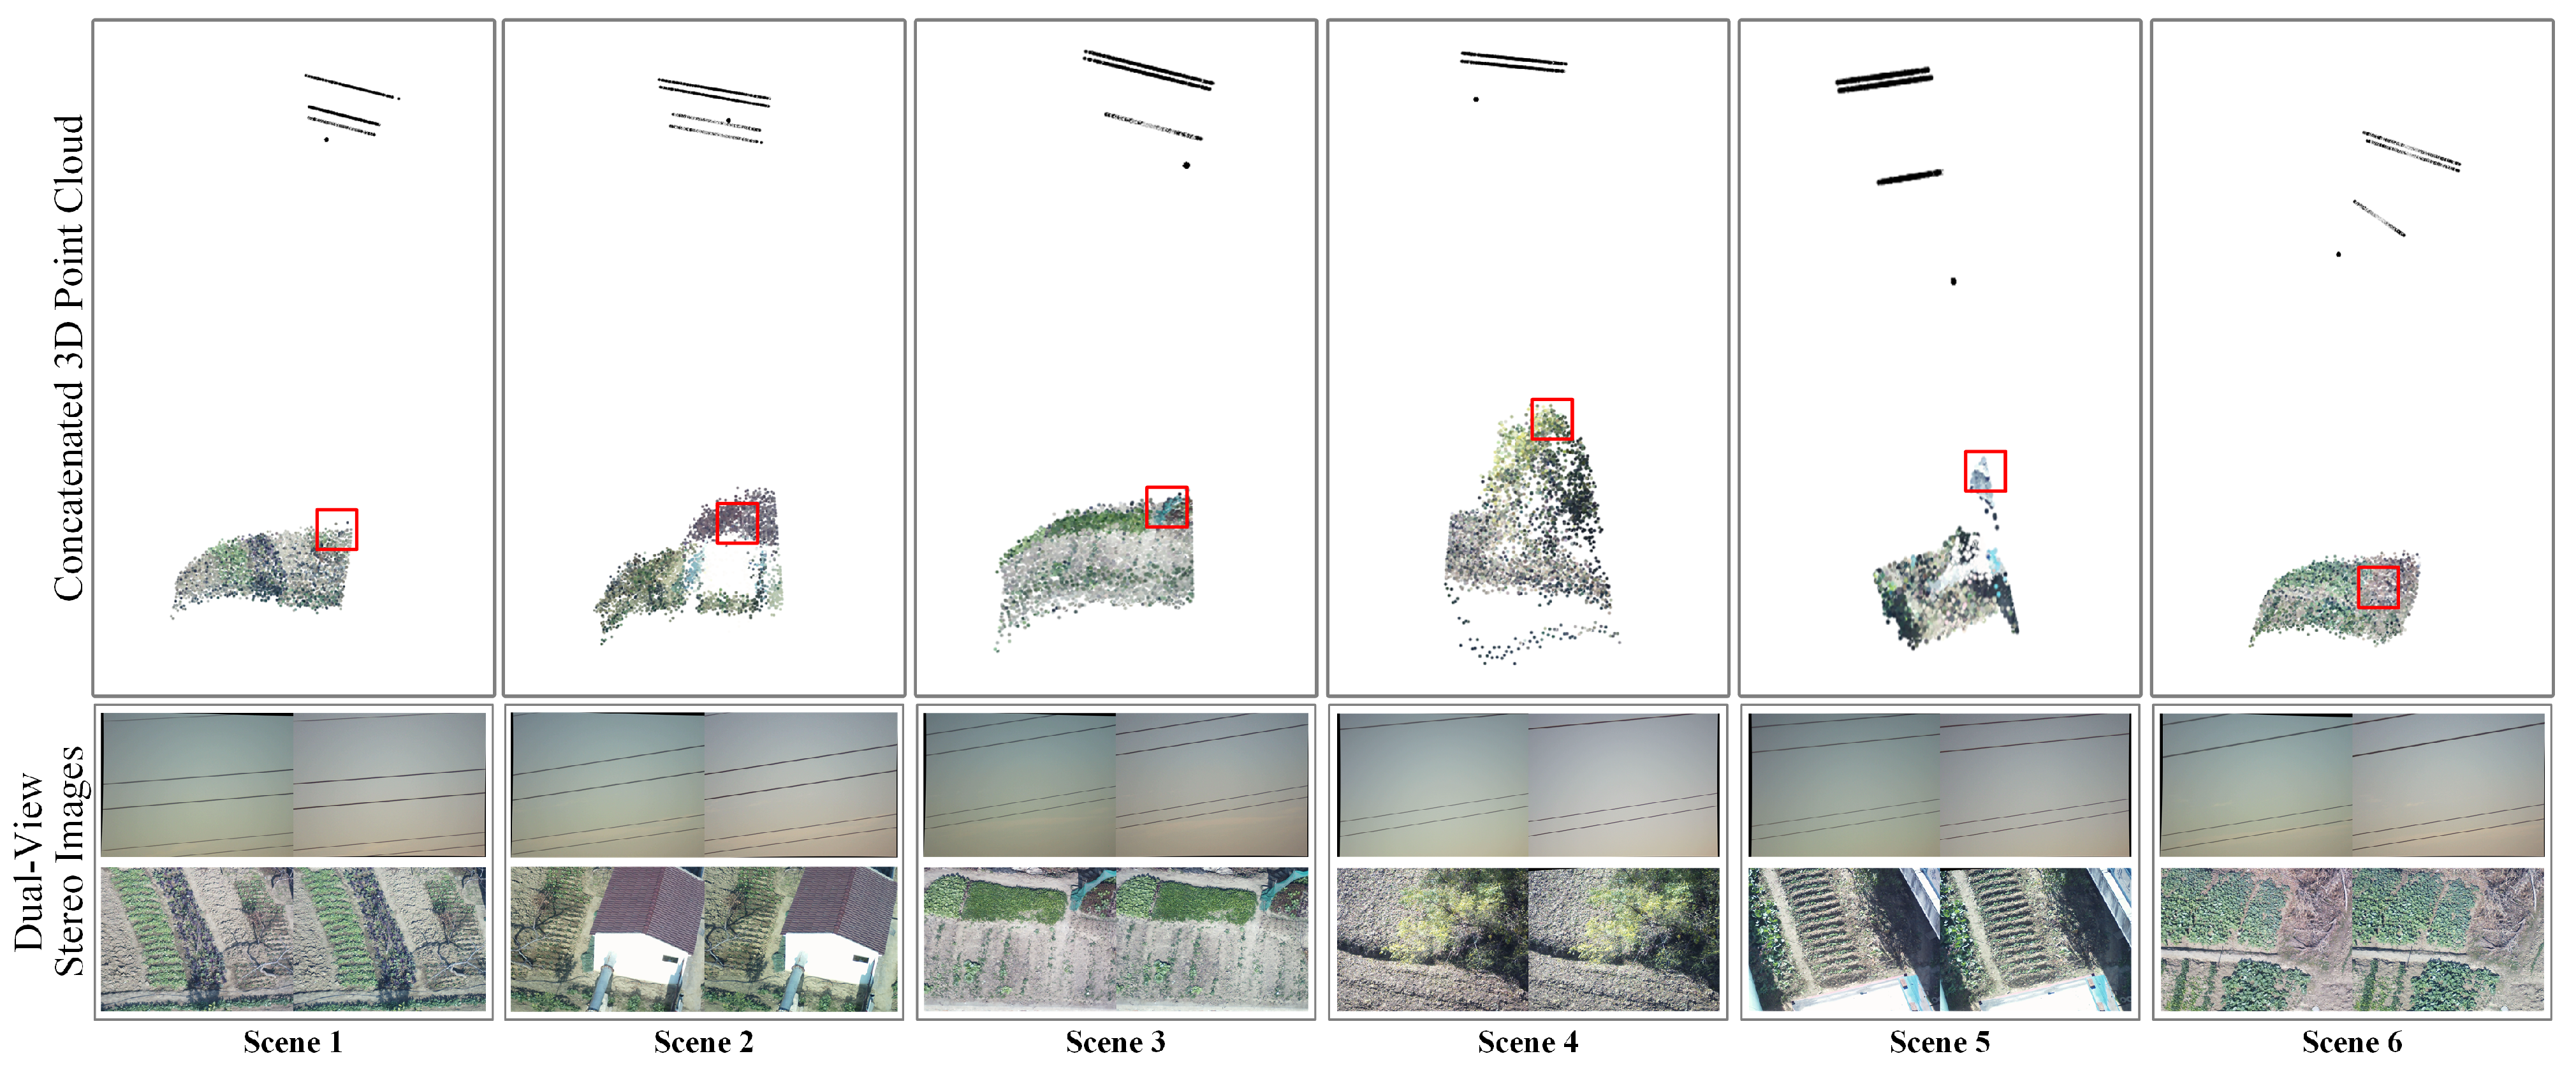
- Visualization of generated local 3D points of the transmission line corridor
- (2)
- Quantitative evaluation of ground clearance measurement results
5. Discussion
6. Conclusions
Author Contributions
Funding
Data Availability Statement
Conflicts of Interest
References
- Tao, X.; Zhang, D.; Wang, Z.; Liu, X.; Zhang, H.; Xu, D. Detection of Power Line Insulator Defects Using Aerial Images Analyzed With Convolutional Neural Networks. IEEE Trans. Syst. Man Cybern. Syst. 2020, 50, 1486–1498. [Google Scholar] [CrossRef]
- Ola, S.R.; Saraswat, A.; Goyal, S.K.; Jhajharia, S.; Rathore, B.; Mahela, O.P. Wigner Distribution Function and Alienation Coefficient-based Transmission Line Protection Scheme. IET Gener. Transm. Distrib. 2020, 14, 1842–1853. [Google Scholar] [CrossRef]
- Choi, H.; Yun, J.P.; Kim, B.J.; Jang, H.; Kim, S.W. Attention-based Multimodal Image Feature Fusion Module for Transmission Line Detection. In IEEE Transactions on Industrial Informatics; Springer: Berlin/Heidelberg, Germany, 2022; p. 1. [Google Scholar] [CrossRef]
- Kandanaarachchi, S.; Anantharama, N.; Muñoz, M.A. Early Detection of Vegetation Ignition Due to Powerline Faults. IEEE Trans. Power Deliv. 2021, 36, 1324–1334. [Google Scholar] [CrossRef]
- Shi, S.; Zhu, B.; Mirsaeidi, S.; Dong, X. Fault Classification for Transmission Lines Based on Group Sparse Representation. IEEE Trans. Smart Grid 2019, 10, 4673–4682. [Google Scholar] [CrossRef]
- Jiang, S.; Jiang, W.; Huang, W.; Yang, L. UAV-Based Oblique Photogrammetry for Outdoor Data Acquisition and Offsite Visual Inspection of Transmission Line. Remote Sens. 2017, 9, 278. [Google Scholar] [CrossRef] [Green Version]
- Nguyen, V.N.; Jenssen, R.; Roverso, D. Automatic Autonomous Vision-Based Power Line Inspection: A Review of Current Status and The potential Role of Deep Learning. Int. J. Electr. Power Energy Syst. 2018, 99, 107–120. [Google Scholar] [CrossRef] [Green Version]
- Yang, L.; Fan, J.; Liu, Y.; Li, E.; Peng, J.; Liang, Z. A Review on State-of-the-Art Power Line Inspection Techniques. IEEE Trans. Instrum. Meas. 2020, 69, 9350–9365. [Google Scholar] [CrossRef]
- Zhai, Y.; Yang, X.; Wang, Q.; Zhao, Z.; Zhao, W. Hybrid Knowledge R-CNN for Transmission Line Multifitting Detection. IEEE Trans. Instrum. Meas. 2021, 70, 1–12. [Google Scholar] [CrossRef]
- Zhao, Z.; Qi, H.; Qi, Y.; Zhang, K.; Zhai, Y.; Zhao, W. Detection Method Based on Automatic Visual Shape Clustering for Pin-Missing Defect in Transmission Lines. IEEE Trans. Instrum. Meas. 2020, 69, 6080–6091. [Google Scholar] [CrossRef] [Green Version]
- Guan, H.; Sun, X.; Su, Y.; Hu, T.; Wang, H.; Wang, H.; Peng, C.; Guo, Q. UAV-Lidar Aids Automatic Intelligent Power Line Inspection. Int. J. Electr. Power Energy Syst. 2021, 130, 106987. [Google Scholar] [CrossRef]
- Song, B.; Li, X. Power Line Detection From Optical Images. Neurocomputing 2014, 129, 350–361. [Google Scholar] [CrossRef]
- Zhao, W.; Dong, Q.; Zuo, Z. A Method Combining Line Detection and Semantic Segmentation for Power Line Extraction from Unmanned Aerial Vehicle Images. Remote Sens. 2022, 14, 1367. [Google Scholar] [CrossRef]
- Zhang, Y.; Yuan, X.; Li, W.; Chen, S. Automatic Power Line Inspection Using UAV Images. Remote Sens. 2017, 9, 824. [Google Scholar] [CrossRef] [Green Version]
- Abdelfattah, R.; Wang, X.; Wang, S. TTPLA: An Aerial-Image Dataset for Detection and Segmentation of Transmission Towers and Power Lines. In Proceedings of the Asian Conference on Computer Vision (ACCV), Virtual, 30 November–4 December 2020. [Google Scholar]
- Vemula, S.; Frye, M. Real-Time Powerline Detection System for an Unmanned Aircraft System. In Proceedings of the IEEE International Conference on Systems, Man, and Cybernetics (SMC 2020), Toronto, ON, Canada, 11–14 October 2020; pp. 4493–4497. [Google Scholar] [CrossRef]
- Li, Y.; Ibanez-Guzman, J. Lidar for Autonomous Driving: The Principles, Challenges, and Trends for Automotive Lidar and Perception Systems. IEEE Signal Process. Mag. 2020, 37, 50–61. [Google Scholar] [CrossRef]
- Zhang, Y.; Yuan, X.; Fang, Y.; Chen, S. UAV Low Altitude Photogrammetry for Power Line Inspection. ISPRS Int. J. Geo-Inf. 2017, 6, 14. [Google Scholar] [CrossRef]
- Caron, G.; Eynard, D. Multiple camera types simultaneous stereo calibration. In Proceedings of the IEEE International Conference on Robotics and Automation, Shanghai, China, 9–13 May 2011; pp. 2933–2938. [Google Scholar] [CrossRef]
- Strauß, T.; Ziegler, J.; Beck, J. Calibrating multiple cameras with non-overlapping views using coded checkerboard targets. In Proceedings of the 17th International IEEE Conference on Intelligent Transportation Systems (ITSC), Qingdao, China, 8–11 October 2014; pp. 2623–2628. [Google Scholar] [CrossRef]
- Figueiredo, R.; Hansen, J.; Fevre, J.; Brandão, M.; Kayacan, E. On the Advantages of Multiple Stereo Vision Camera Designs for Autonomous Drone Navigation. arXiv 2021, arXiv:2105.12691. [Google Scholar]
- Zhou, Y.; Li, Q.; Wu, Y.; Ma, Y.; Wang, C. Trinocular Vision and Spatial Prior Based Method for Ground Clearance Measurement of Transmission Lines. Appl. Opt. 2021, 60, 2422–2433. [Google Scholar] [CrossRef] [PubMed]
- Chang, C.W.; Lo, L.Y.; Cheung, H.C.; Feng, Y.; Yang, A.S.; Wen, C.Y.; Zhou, W. Proactive Guidance for Accurate UAV Landing on a Dynamic Platform: A Visual–Inertial Approach. Sensors 2022, 22, 404. [Google Scholar] [CrossRef] [PubMed]
- Ronneberger, O.; Fischer, P.; Brox, T. U-Net: Convolutional Networks for Biomedical Image Segmentation. In Proceedings of the Medical Image Computing and Computer-Assisted Intervention–MICCAI, Munich, Germany, 5–9 October 2015; pp. 234–241. [Google Scholar]
- Rehder, J.; Nikolic, J.; Schneider, T.; Hinzmann, T.; Siegwart, R. Extending Kalibr: Calibrating the Extrinsics of Multiple IMUs and of Individual Axes. In Proceedings of the IEEE International Conference on Robotics and Automation (ICRA), Stockholm, Sweden, 16–21 May 2016; pp. 4304–4311. [Google Scholar] [CrossRef]
- Wang, X.; Girshick, R.; Gupta, A.; He, K. Non-Local Neural Networks. In Proceedings of the IEEE Conference on Computer Vision and Pattern Recognition (CVPR), Salt Lake City, UT, USA, 18–23 June 2018. [Google Scholar]
- DeTone, D.; Malisiewicz, T.; Rabinovich, A. SuperPoint: Self-Supervised Interest Point Detection and Description. In Proceedings of the IEEE Conference on Computer Vision and Pattern Recognition (CVPR) Workshops, Salt Lake City, UT, USA, 18–23 June 2018. [Google Scholar]
- Sarlin, P.E.; DeTone, D.; Malisiewicz, T.; Rabinovich, A. SuperGlue: Learning Feature Matching With Graph Neural Networks. In Proceedings of the IEEE/CVF Conference on Computer Vision and Pattern Recognition (CVPR), Seattle, WA, USA, 13–19 June 2020. [Google Scholar]
- Paszke, A.; Gross, S.; Massa, F.; Lerer, A.; Bradbury, J.; Chanan, G.; Killeen, T.; Lin, Z.; Gimelshein, N.; Antiga, L.; et al. PyTorch: An Imperative Style, High-Performance Deep Learning Library. In Advances in Neural Information Processing Systems; MIT Press: Cambridge, MA, USA, 2019; Volume 32. [Google Scholar]
- Grompone von Gioi, R.; Jakubowicz, J.; Morel, J.M.; Randall, G. LSD: A Line Segment Detector. Image Process. Line 2012, 2, 35–55. [Google Scholar] [CrossRef] [Green Version]
- Xie, S.; Tu, Z. Holistically-Nested Edge Detection. In Proceedings of the IEEE International Conference on Computer Vision (ICCV), Santiago, Chile, 7–13 December 2015. [Google Scholar]
- Liu, Y.; Cheng, M.M.; Hu, X.; Wang, K.; Bai, X. Richer Convolutional Features for Edge Detection. In Proceedings of the IEEE Conference on Computer Vision and Pattern Recognition (CVPR), Honolulu, HI, USA, 21–16 July 2017. [Google Scholar]
- Liu, N.; Han, J.; Yang, M.H. PiCANet: Learning Pixel-Wise Contextual Attention for Saliency Detection. In Proceedings of the IEEE Conference on Computer Vision and Pattern Recognition (CVPR), Salt Lake City, UT, USA, 18–23 June 2018. [Google Scholar]
- Zhao, J.X.; Liu, J.J.; Fan, D.P.; Cao, Y.; Yang, J.; Cheng, M.M. EGNet: Edge Guidance Network for Salient Object Detection. In Proceedings of the IEEE/CVF International Conference on Computer Vision (ICCV), Seoul, Korea, 27 October–2 November 2019. [Google Scholar]
- Zhao, T.; Wu, X. Pyramid Feature Attention Network for Saliency Detection. In Proceedings of the IEEE/CVF Conference on Computer Vision and Pattern Recognition (CVPR), Long Beach, CA, USA, 15–20 June 2019. [Google Scholar]
- Zhao, H.; Shi, J.; Qi, X.; Wang, X.; Jia, J. Pyramid Scene Parsing Network. In Proceedings of the IEEE Conference on Computer Vision and Pattern Recognition (CVPR), Honolulu, HI, USA, 21–16 July 2017. [Google Scholar]
- Chen, L.C.; Papandreou, G.; Kokkinos, I.; Murphy, K.; Yuille, A.L. DeepLab: Semantic Image Segmentation with Deep Convolutional Nets, Atrous Convolution, and Fully Connected CRFs. IEEE Trans. Pattern Anal. Mach. Intell. 2018, 40, 834–848. [Google Scholar] [CrossRef] [Green Version]
- Zhao, H.; Zhang, Y.; Liu, S.; Shi, J.; Loy, C.C.; Lin, D.; Jia, J. PSANet: Point-wise Spatial Attention Network for Scene Parsing. In Proceedings of the European Conference on Computer Vision (ECCV), Munich, Germany, 8–14 September; 2018. [Google Scholar]
- Zhou, Z.; Rahman Siddiquee, M.M.; Tajbakhsh, N.; Liang, J. UNet++: A Nested U-Net Architecture for Medical Image Segmentation. In Proceedings of the Deep Learning in Medical Image Analysis and Multimodal Learning for Clinical Decision Support, Granada, Spain, 20 September 2018; pp. 3–11. [Google Scholar]
- Yu, C.; Wang, J.; Peng, C.; Gao, C.; Yu, G.; Sang, N. BiSeNet: Bilateral Segmentation Network for Real-time Semantic Segmentation. In Proceedings of the European Conference on Computer Vision (ECCV), Munich, Germany, 8–14 September 2018. [Google Scholar]
- Li, H.; Xiong, P.; Fan, H.; Sun, J. DFANet: Deep Feature Aggregation for Real-Time Semantic Segmentation. In Proceedings of the IEEE/CVF Conference on Computer Vision and Pattern Recognition (CVPR), Long Beach, CA, USA, 15–20 June 2019. [Google Scholar]
- Wang, H.; Jiang, X.; Ren, H.; Hu, Y.; Bai, S. SwiftNet: Real-Time Video Object Segmentation. In Proceedings of the IEEE/CVF Conference on Computer Vision and Pattern Recognition (CVPR), Nashville, TN, USA, 20–25 June 2021; pp. 1296–1305. [Google Scholar]
- Zhuang, J.; Yang, J.; Gu, L.; Dvornek, N. ShelfNet for Fast Semantic Segmentation. In Proceedings of the IEEE/CVF International Conference on Computer Vision (ICCV) Workshops, Seoul, Korea, 27 October–2 November 2019. [Google Scholar]
- Liu, P.; Zhang, H.; Yang, G.; Wang, Q. An Improved Image Segmentation Method of BiSeNetV2 Network. In Proceedings of the 4th International Conference on Control and Computer Vision; Association for Computing Machinery: New York, NY, USA, 2021; pp. 13–17. [Google Scholar]
- Liu, Y.; Chen, H.; Shen, C.; He, T.; Jin, L.; Wang, L. ABCNet: Real-Time Scene Text Spotting with Adaptive Bezier-Curve Network. In Proceedings of the IEEE/CVF Conference on Computer Vision and Pattern Recognition (CVPR), Virtual, 13–19 June 2020. [Google Scholar]
- Wu, T.; Tang, S.; Zhang, R.; Cao, J.; Zhang, Y. CGNet: A Light-Weight Context Guided Network for Semantic Segmentation. IEEE Trans. Image Process. 2021, 30, 1169–1179. [Google Scholar] [CrossRef] [PubMed]


| Hardware Device | Hardware Model | Specification | |
|---|---|---|---|
| UAV | DJI M300 RTK | Dimensions: 810(L) × 670(W) × 430(H) mm | |
| Max Takeoff Weight: 9 kg | |||
| Max Wind Resistance: 15 m/s | |||
| Max Flight Time: 55 min | |||
| Max Speed: 17 m/s | |||
| Hovering Accuracy: ±0.1 m | |||
| Horizontal Positioning Accuracy: 1 cm + 1 ppm | |||
| Vertical Positioning Accuracy: 1.5 cm + 1 ppm | |||
| Embedded Platform | Nvidia Jetson AGX Xavier developer kit | GPU: 512 Cores and 64 Tensor-Cores | |
| AI Performance: 32 Tops | |||
| Memory: 32 GB 256-bit LPDDR4x 136.5 GB/s | |||
| Power: 10 W | 15 W | 30 W | |||
| Mechanical: 100 mm × 87 mm (L × W) | |||
| Dual-View Stereo Vision Module | LenaCV® CAM-AR0135-3T16 Lena Computer Vision Company | Upper binocular camera | Resolution: 1280 × 960 pixels |
| Frame Rate: 30 fps | |||
| Focal Length: 25 mm | |||
| Baseline Distance: 104.49 mm | |||
| Lower binocular camera | Resolution: 1280 × 960 pixels | ||
| Frame Rate: 30 fps | |||
| Focal Length: 16 mm | |||
| Baseline Distance: 101.45 mm | |||
| Dataset | Metries | Canny | LSD | HED | PFANet | PiCANet | RCFNet | EGNet | Ours |
|---|---|---|---|---|---|---|---|---|---|
| TTPLA | MaxF | 0.1537 | 0.2506 | 0.6034 | 0.5109 | 0.7242 | 0.8730 | 0.7972 | 0.9012 |
| MAE | 0.1944 | 0.0715 | 0.0526 | 0.0390 | 0.0405 | 0.0227 | 0.0314 | 0.0209 | |
| S-M | 0.4660 | 0.5235 | 0.6997 | 0.5690 | 0.6659 | 0.8460 | 0.7322 | 0.8618 | |
| PLID | MaxF | 0.5331 | 0.4300 | 0.4819 | 0.6967 | 0.7992 | 0.8002 | 0.7320 | 0.8021 |
| MAE | 0.0415 | 0.0422 | 0.0620 | 0.0266 | 0.0271 | 0.0377 | 0.0270 | 0.0204 | |
| S-M | 0.5716 | 0.6030 | 0.6236 | 0.6959 | 0.8338 | 0.7719 | 0.7738 | 0.8549 |
| Ground Objects | Buildings | Trees | Roads | Rivers |
|---|---|---|---|---|
| The min safety ground clearance | 6.0 m | 3.5 m | 8.0 m | 7.0 m |
| Part | Typical Background Objects | Total Number | Original Image Resolution | Number for Training | Number for Inference | Input Image Resolution |
|---|---|---|---|---|---|---|
| 1 | Buildings, Roads | 35 | 27 | 8 | ||
| 2 | Roads, Trees | 42 | 32 | 10 | ||
| 3 | Rivers, Trees | 32 | 24 | 8 | ||
| 4 | Buildings, Trees | 44 | 33 | 11 | ||
| 5 | Trees | 47 | 35 | 12 |
| Model | Year and Ref. | Class IoU (%) | mIoU (%) | Param (M) | ||||
|---|---|---|---|---|---|---|---|---|
| Trees | Buildings | Rivers | Roads | Others | ||||
| PSPNet | 2017 [36] | 68.11 | 61.66 | 81.16 | 62.47 | 75.74 | 68.35 | 46.7 |
| DeepLab | 2017 [37] | 60.10 | 61.56 | 78.16 | 56.00 | 73.29 | 63.96 | 39.0 |
| PSANet | 2018 [38] | 65.72 | 60.20 | 79.83 | 57.87 | 75.07 | 65.91 | 48.3 |
| UNet++ | 2018 [39] | 66.86 | 69.55 | 79.84 | 61.02 | 76.97 | 69.32 | 9.2 |
| BiSeNetv1 | 2018 [40] | 64.34 | 61.17 | 78.43 | 56.05 | 73.62 | 65.00 | 13.3 |
| DFANet | 2019 [41] | 62.72 | 24.07 | 37.55 | 0.01 | 62.94 | 31.44 | 2.2 |
| SwiftNet | 2019 [42] | 66.32 | 72.62 | 84.43 | 60.18 | 76.34 | 70.89 | 11.8 |
| ShelfNet | 2019 [43] | 62.98 | 66.72 | 80.78 | 59.13 | 74.19 | 67.40 | 14.5 |
| BiSeNetv2 | 2020 [44] | 65.41 | 60.01 | 70.82 | 57.11 | 73.47 | 63.33 | 3.3 |
| ABCNet | 2021 [45] | 61.73 | 61.02 | 71.81 | 47.63 | 71.98 | 60.55 | 13.4 |
| CGNet | 2021 [46] | 65.85 | 61.82 | 79.63 | 55.07 | 74.47 | 65.59 | 0.5 |
| Ours | - - | 69.71 | 74.40 | 86.59 | 64.91 | 78.50 | 73.90 | 12.9 |
| Time Consuming | Scene 1 | Scene 2 | Scene 3 | Scene 4 | Scene 5 | Scene 6 |
|---|---|---|---|---|---|---|
| Power line detection time | 0.212s | 0.208 s | 0.214 s | 0.205 s | 0.201 s | 0.205 s |
| Power line 3D reconstruction time | 0.525 s | 0.568 s | 0.498 s | 0.475 s | 0.535 s | 0.528 s |
| Ground object classification time | 0.196 s | 0.213 s | 0.199 s | 0.203 s | 0.204 s | 0.205 s |
| Ground object 3D reconstruction time | 0.314 s | 0.303 s | 0.315 s | 0.318 s | 0.314 s | 0.317 s |
| Ground clearance measurement time | 0.256 s | 0.244 s | 0.252 s | 0.238 s | 0.248 s | 0.251 s |
| The next target point recalculation time | 0.105 s | 0.107 s | 0.111 s | 0.105 s | 0.108 s | 0.105 s |
| Total time consuming | 1.608 s | 1.643 s | 1.589 s | 1.544 s | 1.610 s | 1.611 s |
| Types | Average Clearances | Error | ||
|---|---|---|---|---|
| LiDAR | Proposed Method | Mean Absolute (m) | Standard Deviation (m) | |
| Scene 1 | 24.843 | 24.871 | 0.168 | 0.0176 |
| Scene 2 | 23.910 | 23.940 | 0.208 | 0.0199 |
| Scene | Category of Ground Object | Measured Clearance | Safety Standards | Judgment Results |
|---|---|---|---|---|
| 1 | Trees | 14.9 m | 3.5 m | Safe |
| 2 | Buildings | 11.4 m | 6.0 m | Safe |
| 3 | Trees | 16.7 m | 3.5 m | Safe |
| 4 | Trees | 6.9 m | 3.5 m | Safe |
| 5 | Buildings | 10.3 m | 6.0 m | Safe |
| 6 | Trees | 20.2 m | 3.5 m | Safe |
Publisher’s Note: MDPI stays neutral with regard to jurisdictional claims in published maps and institutional affiliations. |
© 2022 by the authors. Licensee MDPI, Basel, Switzerland. This article is an open access article distributed under the terms and conditions of the Creative Commons Attribution (CC BY) license (https://creativecommons.org/licenses/by/4.0/).
Share and Cite
Zhou, Y.; Xu, C.; Dai, Y.; Feng, X.; Ma, Y.; Li, Q. Dual-View Stereovision-Guided Automatic Inspection System for Overhead Transmission Line Corridor. Remote Sens. 2022, 14, 4095. https://doi.org/10.3390/rs14164095
Zhou Y, Xu C, Dai Y, Feng X, Ma Y, Li Q. Dual-View Stereovision-Guided Automatic Inspection System for Overhead Transmission Line Corridor. Remote Sensing. 2022; 14(16):4095. https://doi.org/10.3390/rs14164095
Chicago/Turabian StyleZhou, Yaqin, Chang Xu, Yunfeng Dai, Xingming Feng, Yunpeng Ma, and Qingwu Li. 2022. "Dual-View Stereovision-Guided Automatic Inspection System for Overhead Transmission Line Corridor" Remote Sensing 14, no. 16: 4095. https://doi.org/10.3390/rs14164095
APA StyleZhou, Y., Xu, C., Dai, Y., Feng, X., Ma, Y., & Li, Q. (2022). Dual-View Stereovision-Guided Automatic Inspection System for Overhead Transmission Line Corridor. Remote Sensing, 14(16), 4095. https://doi.org/10.3390/rs14164095