Article

Late Cenozoic to Present Kinematic of the North to Eastern Iran Orogen: Accommodating Opposite Sense of Fault Blocks Rotation

by
Ahmad Rashidi
1,
Majid Shahpasandzadeh
2 and
Carla Braitenberg
3,*
1
Department of Seismotectonics, International Institute of Earthquake Engineering and Seismology, Tehran P.O. Box 19537-14453, Iran
2
Department of Earth Sciences, Graduate University of Advanced Technology, Kerman P.O. Box 117-76315, Iran
3
Department of Mathematics and Geoscience, University of Trieste, 34127 Trieste, Italy
*
Author to whom correspondence should be addressed.
Remote Sens. 2022, 14(16), 4048; https://doi.org/10.3390/rs14164048
Submission received: 16 June 2022 / Revised: 10 August 2022 / Accepted: 13 August 2022 / Published: 19 August 2022

Abstract

:
The opposite-sense fault block rotation across the continental strike-slip faulting plays an important role in accommodating crustal deformation in the north of the East Iran orogen. This research constrains the post-Neogene kinematics of the NW-SE to E-W left-lateral transpressional zones at the northern termination of the N-S striking right-lateral Neh fault system in the East Iran orogen. Using two case studies, we analyzed the NW-SE Birjand splay and the E-W Shekarab transpression zone by analysis of satellite images, structural features, fault geometry and kinematics, GPS (Global Positioning System) velocities, fault- and earthquake-slip stress inversion, and paleomagnetic data. Our results show two distinctive regions of opposite-sense fault block rotations and with different rotation rates. As an asymmetric arc, the Birjand splay displays a transition from the prevailing N-S right lateral shear in the east to NW-SE left lateral transpression in the middle and E-W left lateral shear in the west. In the east, with clockwise fault block rotation, the N-S right lateral faults and the NW-SE oblique left-lateral reverse faults constitute push-ups through the restraining fault bends. In the west, with counterclockwise fault block rotation, the Shekarab transpression zone is associated with the duplex, pop-up, and shear folds. Our suggested kinematic model reveals that the N-S right-lateral shear is consumed on the left-lateral transpressional zones through the vertical axis fault block rotation. This led to an E-W shortening and N-S along-strike lengthening in the East Iran orogen. This research improves our understanding of how opposite fault block rotations accommodate India- and Eurasia-Arabia convergence in the north of the East Iran orogen. The suggested model has implications in the kinematic evolution of intra-plate strike-slip faulting through continental collision tectonics.

1. Introduction

Continental strike-slip faults play an important role in accommodating crustal deformation through escape tectonics, strain partitioning, crustal thickening, and vertical axis crustal block rotation, or a combination of them. The vertical axis crustal block rotation can be achieved by fault block rotation [1,2,3] or by diffuse faulting of a continuously deforming continent. Lateral transport of crustal blocks usually occurs where strike-slip faults run roughly oblique to the convergence direction.
In the framework of the Alpine-Himalaya orogenic system with prevailing E-W and NW-SE trends of folds and thrust belts, the N-S trend of the East Iran orogen (“Sistan suture zone” of [4,5]; “Sistan orogenic belt” of [6]; “East Iranian orocline” of [7]) is unique. In fact, the geodynamics of central Iran, consisting of the Lut, Tabas, and Yazd crustal blocks, and the East Iran orogen are controlled by the Arabia- and Indian-Eurasia convergence in the west and the east, respectively. The prevailing crustal deformation in the northern part of the East Iran orogen, NE of the Lut block, is accommodated by crustal shortening and vertical axis fault-block rotations [8], and controls the present kinematics of this and surrounding areas. The N-S right-lateral shear between the Lut and the Afghan crustal blocks is taken up through the Neh (Nehbandan) fault system (Figure 1). The Neh fault system is composed of the West and East Neh faults, which constitute the boundaries of the East Iran orogen. The differential shearing across the western and eastern boundaries of the Lut block is accommodated by diffusive fault interactions at their terminations by the transpressional NW-SE oblique strike-slip faults, WNW-ESE thrusts, and ENE-WSW (E-W) left-lateral strike-slip faulting [8,9,10,11,12]. The absence of strength discontinuities and consequent strain localization along with dissipative heating, could explain diffusive strike-slip fault patterns in the north of eastern Iran rather than development of major (more than 10 mm/yr slip rate) intraplate strike-slip faults [13].
This study describes the geometric reconstruction of the Birjand splay, as the northern termination of the Neh fault system, presenting new field data on the identification of faults and their movements, and the fusion of geodetic and geologic data in order to investigate the post-Neogene structural characteristic of the north of the Eastern Iran orogen in the framework of the Arabia- and India-Eurasia convergence.
The aim of this research is therefore to decipher: (1) how the N-S right-lateral shear between the central Iran and Afghan crustal blocks is accommodated through a diffuse NW-SE to E-W left-lateral transpressional zone; and (2) its role in the tectonic configuration and present kinematics of the region north of central and eastern Iran. In fact, this paper improves our understanding of how the post-Neogene continental shortening accommodates in the north of Eastern Iran orogen by the opposite sense fault-block rotations. After analyzing high resolution satellite images, structural features, geomorphic markers, fault kinematics, published GPS velocities, reliable earthquake focal mechanisms, paleostress inversions, and published paleomagnetic data, we propose a new model for the determination of kinematics of the north of Eastern Iran orogen that has implications for the tectonic evolution of the opposite sense intraplate strike-slip faulting in the continental collision.

2. Tectonic Setting

Central Iran, as a part of the Alpine-Himalayan orogenic system, is embedded between the Alborz orogen in the north, the Zagros fold-thrust belt in the west-southwest, the Makran subduction zone in the south, and the Eastern Iran orogen in the east. The East Iran orogen marks the closure of a narrow branch of Neotethys that opened during the Middle Cretaceous called the “Sistan Ocean” [5,15]. This was followed by a Late Cretaceous suturing between the Lut block in the west and the Afghan block to the east [16,17]. Central Iran is composed of the Lut, Tabas and Yazd crustal blocks from east to west (Figure 1). Most of these blocks have undergone counter-clockwise rotation from the Late Cretaceous to the Early Tertiary [18,19].
Seismicity of eastern Iran is influenced by the active N–S Nayband and Neh right-lateral strike-slip fault systems, separated by a distance of ~200 km [20,21]. The four main West Neh, East Neh, Kahourak, and Nosrat-Abad faults (Eastern-Lut fault system) constitute the boundary of the Lut block with the Afghan block (Figure 1b). The Western-Lut fault system, consisting of the Nayband, Gowk, and Sabzevaran faults, delineates the boundary of the Lut block with the central Iranian microcontinent (CIM) and the metamorphic rocks (MIG) in the west (Figure 1b) [4,5,12,22,23,24,25].
The velocity field, deduced from the GPS station vectors, demonstrates the present-day deformation of central and eastern Iran on a regional scale [14]. The N-S faults between the central Iranian microcontinent (CIM), Eastern Iran orogen (EOI) crustal blocks and the Afghan block have ~16 mm/yr right-lateral shearing in the south of 34–35°N [14]. The E-W left-lateral Dasht-e Bayaz and Doruneh faults are the prominent structures to the north of 34–35°N (Figure 1b) [26,27,28].
Based on the geological and geomorphological evidence [28], in the late Cenozoic, the cumulative N-S right-lateral shearing along the Eastern-Lut fault system (~70–80 km) was much greater than the total amounts of N-S shearing at the Western-Lut fault system (~20 km). By considering the assumption that the distribution of geological slip is representative of the present-day activity, it was inferred that ~two-thirds (~10 mm/yr) of the 16 mm/yr rates of the right-lateral shearing between the Lut and Afghan blocks is taken up along the Neh fault system.
According to the displaced young alluvial fan deposits in the high-resolution SPOT5 (pixel size 2.5 m) images [29], a slip rate of ~1.75–2.50 mm/yr has been estimated for the East Neh fault, and about 1–5 mm/yr for the West Neh fault. The Sabzevaran fault system accommodates ~6 mm/yr of right-lateral slip in the Quaternary across the southwest of the Lut block [30]. To the north, ~2 Ma displaced basalts [15] suggest slip rates of ~1.5–2.4 mm/yr along the Nayband-Gowk faults, across the western margin of the Lut [20].
The northern and southern terminations of the Eastern-Lut fault system follow a curved pattern to the west and east, respectively [5,7,24]. The northern terminations of the East and West Neh faults define a series of WNW-ESE dominant splays in the NE part of Lut, where several destructive earthquakes have occurred, such as: the 1979 Abiz (Mw6.6) [31,32]; the 1979 Qayen (Mw 6.5) [31,32]; the 1994 Abiz (Mw 6.2) [24]; and the 1997 Abiz [24]. In this study, our focus is on the northern part of the East Iran orogen, at the northern termination of the Neh fault system, with the presence of a series of WNW-ESE dominant left-lateral transpressional splays. One of these fault splays, known as the Birjand splay, is located in the south-southeast of the Birjand metropolitan city. This transpressional fault splay consists of several faults with different mechanisms, folds, duplexes, and pop-ups.

3. Data and Methodology

To analyze the post-Neogene kinematic and structural evolution of the Birjand splay, we integrated field observations with remote sensing techniques. We present the data and methodologies in this chapter.

3.1. Field Studies of Faults

Fault kinematics and active tectonics of the study area were deciphered by measuring the cumulative fault offsets in the field through identification of dislocation of geologic units, studying the drag of the Quaternary landforms and post-Neogene rock units. These data were used to elaborate fault kinematic indicators with well-established methods. We constrained the compatible faults and the post-Neogene stress regime by the inverse method on fault slip (e.g., [33]). The basic hypothesis is that the fault movement occurs in the direction and sense of the maximum shear stress, or precisely in the direction of the stress vector on the fault plane. The fault orientations can be of different values, since pre-existing faults or anisotropies could be present. In this approach, local variations of stress pattern for a single fault-cluster are neglected, as are the interactions between fault motions. Input data are the field measurements of the orientation of the fault, given as strike, dip and slip. Based on the fault slip data, the present-day stress directions were determined by a least squares fitting procedure [34]. For this scope, we used the Win-Tensor software [35], from which the azimuth and plunge of the principal stress axes (σ1, σ2, and σ3) are obtained. For the faults with kinematic indicators such as slickenside-lineation, we obtained the T (extension) and P (shortening) quadrants, and also the positions of the principal-stress axes, by using the FaultKin software. Processing of the data was done with published software, so for the methodological details we refer to the relevant publications.
The input data of the fault orientations were determined by direct access in the field, using classical methods, such as with a compass, goniometer, and tiltmeter. The parameters were recorded together with their uncertainties. The data are found in the results section.

3.2. Geodetic Strain

Geodetic Strain Field and Rotation Rate

The geodetic strain field with the combined analysis of the fault slip data can play a significant role in achieving a better understanding of the present kinematics [11], and can then be correlated with the focal mechanism of the earthquakes [36]. We used published GPS velocity vectors, reported by [37] (Table 1), and referred to the Iranian Permanent GNSS Network. The velocities were interpolated using the Delaunay triangulation method to constrain geodetic strain rates, calculated from the velocity gradient tensor in each triangular network. Each tensor was decomposed into symmetric (εij) and antisymmetric (ωij) parts, which showed geodetic strain and rotation rates, respectively (Equation (1); [38]).
G i j = ε i j + ω i j
The obtained tensor for each triangular network provided us with a differential rotation rate as its antisymmetric parts (Equation (2); [38]). Ri represents the quantity of the rotation vector, and its signs show the direction of rotation.
R 1 = ω 23 ω 32 2 ,   R 2 = ω 13 ω 31 2 ,   R 3 = ω 12 ω 21 2

3.3. Satellite Images and Digital Terrain Model

In part, the faults we describe are macroscopic features that can be traced as discontinuities either in the digital terrain model or in remote sensing optical images. With Iran being an arid country, the faults and lithological changes are well exposed and clearly visible in the satellite images. We found that the images published in the Google Earth application fully accomplish the requested requirements on spatial resolution and quality. These images have been produced by mosaicking a large number of satellite images from the Google owned acquisition satellite, but also with available land observation systems such as Sentinel 2 and Landsat. The details on the acquisitions are transparent to the user of this Google Earth product. However, we found that in comparison with single acquisitions of Sentinel 2, the images we found in Google Earth were of higher quality, as they were the result of a sophisticated processing scheme, including cancelling of pixels affected by clouds or snow. Faults identified by field work were matched with the images, and in case a continuous discontinuity was found, it was associated to the fault identified in the field and manually continued on the image by visual inspection. We also found that some lithological units could be identified through their coloring in the images, such as presence of peridotite, with its much darker color next to sedimentary rock. We also used the Microsoft mapping product “Bing Maps” (www.bing.com/maps accessed on 10 June 2021), which we found to have superior resolution compared to Google Earth in areas where the satellite imagery has been integrated with aerial optical imaging. Again, the data sources which were used to define the product were transparent to the user; however, according to the studied area, close to 1 m pixels resolution can be found. In the text captions we define which of the two products has been used.

4. Results on Distributed Faulting in the Area

The NW-SE Birjand splay, as the northern termination of the Neh fault system, follows the structural weakness inherited from the Eastern Iran orogen, due to the ophiolitic emplacement [8] between ~89 Ma and 34 Ma [5]. The prevalent N-S right-lateral, NW-SE oblique, and ENE-WSW (E-W) left-lateral strike-slip faulting controls the kinematics of this area. In the following, we provide the geometric and kinematic characteristics of these faults in order to determine the post-Neogene to present kinematics of the northern part of eastern Iran.

4.1. The N-S Right-Lateral Strike-Slip Faults

Geometry of a strike-slip fault is dependent on the rank (smaller fault segments within the larger fault), the step (left step or right step), and the arrangement (pinnate or en-echelon) of the fault [40]. Arrays of strike-slip faults determine the type of local deformation, the dynamic rupture process, and fault damage zones. To determine the structural and kinematic characteristics of the Birjand splay, the aforementioned parameters have been considered in this study.
The N-S right-lateral East and West Neh fault system constitutes the eastern border of the Birjand splay [5]. The West Neh fault is composed of the West Neh, Esmaeilabad, Pokht, and Kuch-Esfezar fault segments, with a left-step array in NE of the Lut block (Figure 1c). We recorded the offsets and dragging of the Cretaceous ophiolitic mélanges and the Cenozoic rock units along the faults (Figure 2).
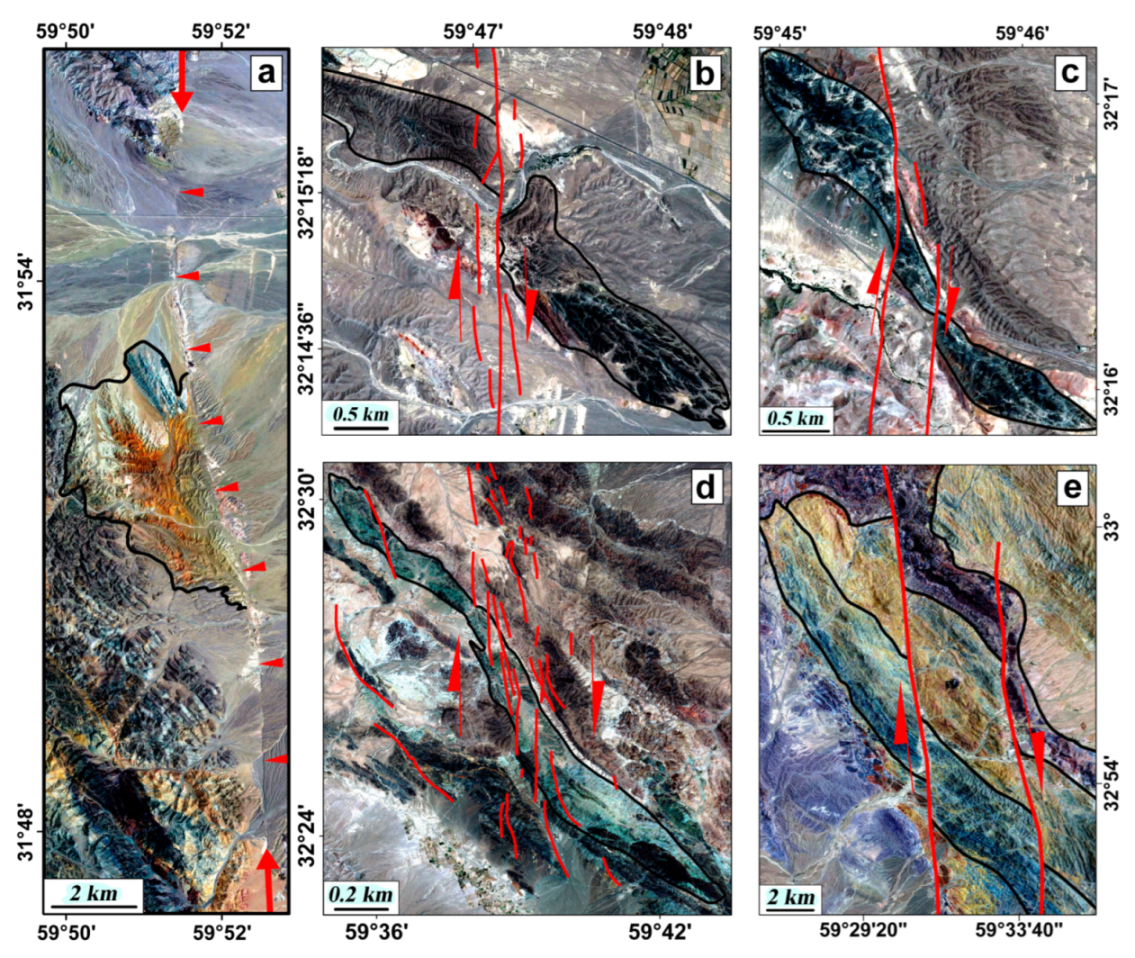
The right-lateral Esmaeilabad fault, a northern segment of the West Neh fault, is 75 km long. This fault cuts the Neogene conglomerate and, in some parts, follows the boundary of the Neogene conglomerate with the Eocene volcanics. In the west, fault propagation folding such as the NW-SE Giv and Hashtoogan folds are linked to the fault (Figure 1d). The satellite images reveal releasing and restraining stopovers and bends along this fault. For example, west of the Esmailabad village, where the fault strand on the satellite images is obvious, a restraining left-bend could be seen (Figure 2a). The Neogene sandstone and gypsiferous rocks have been uplifted in this pressure zone. Northern segments of the fault clearly incised the Birjand splay and show dragging and ~1.5 km right-lateral offsets of the Cretaceous peridotites (Figure 2b,c).
The N-S right-lateral Pokht fault with a left-step array is the northern continuation of the Esmaeilabad fault. The Pokht fault with a length of ~20 km has two main en echelon northern and southern segments (Figure 1c). Along its southern segment, the dragging and offsets of ~800 m in the upper Cretaceous peridotites is considerable (Figure 2d).
The N-S right-lateral Kuch-Esfezar faults displaced different rock units. Investigation of the fault strands on the satellite images confirms that the Kuch-Esfezar faults, as a continuation of the Pokht fault, have a close relationship with the other structures (Figure 1c). The faults within the mountains displaced the Pliocene andesitic basalts right-laterally, as well as the Paleocene volcanics and turbidites. The average offset of the rock units amounts to more than 2 km (Figure 2e).
The N-S right-lateral Fanud fault with ~20 km length, which is identified for the first time, shows five short main segments with an en echelon array (Figure 1d). Across the fault, striations clearly show the prevailing right-lateral motion of this fault (Figure 3). The Fanud fault sheared the Quaternary deposits, the upper Cretaceous calc-schists, and also all of the Cretaceous ophiolithic mélanges across the width of the Birjand splay.
These N-S right-lateral strike-slip faults have shifted the western part of the Birjand splay to the north. The satellite images and our field studies all confirm that the trend of the western part of the Birjand splay (Bagheran mountains), to the west of the Fanud fault, is rotated and is closer to an E-W trend. In this part of the Birjand splay, the NW-SE oblique and E-W left-lateral strike-slip faults show an extensive distribution (Figure 1d).

4.2. The NW-SE Oblique and the E-W Left-Lateral Strike-Slip Faults

The NW-SE oblique faults and E-W left-lateral strike-slip faults are mostly distributed to the west side of the Fanud fault, in the Bagheran mountain range (Figure 1d). To understand the Late Cenozoic to present kinematics of the area, we focused on collecting fault-slip data and measuring offsets of the post-Neogene sediments and Quaternary geomorphic markers. Some researchers used these indicators to determine the past and present kinematic models in different areas of the world (e.g., [12,41,42,43]). In the following, a brief structural overview of the NW-SE and ENE-WSW (E-W) faults in the Birjand splay is presented.

4.2.1. South Birjand Fault

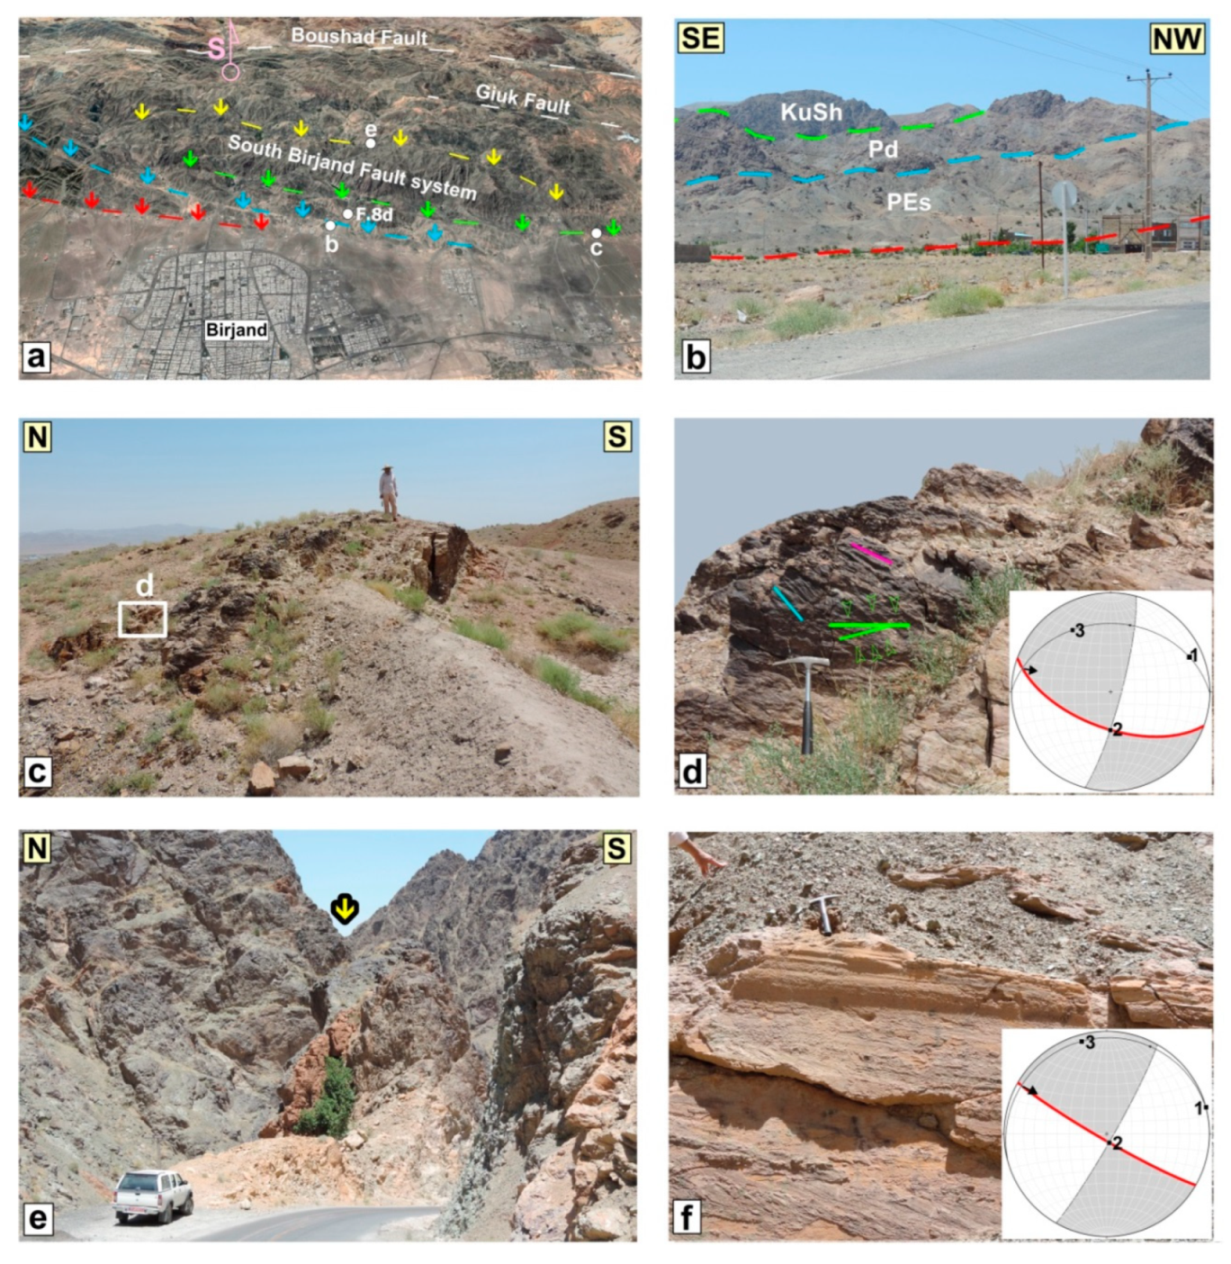
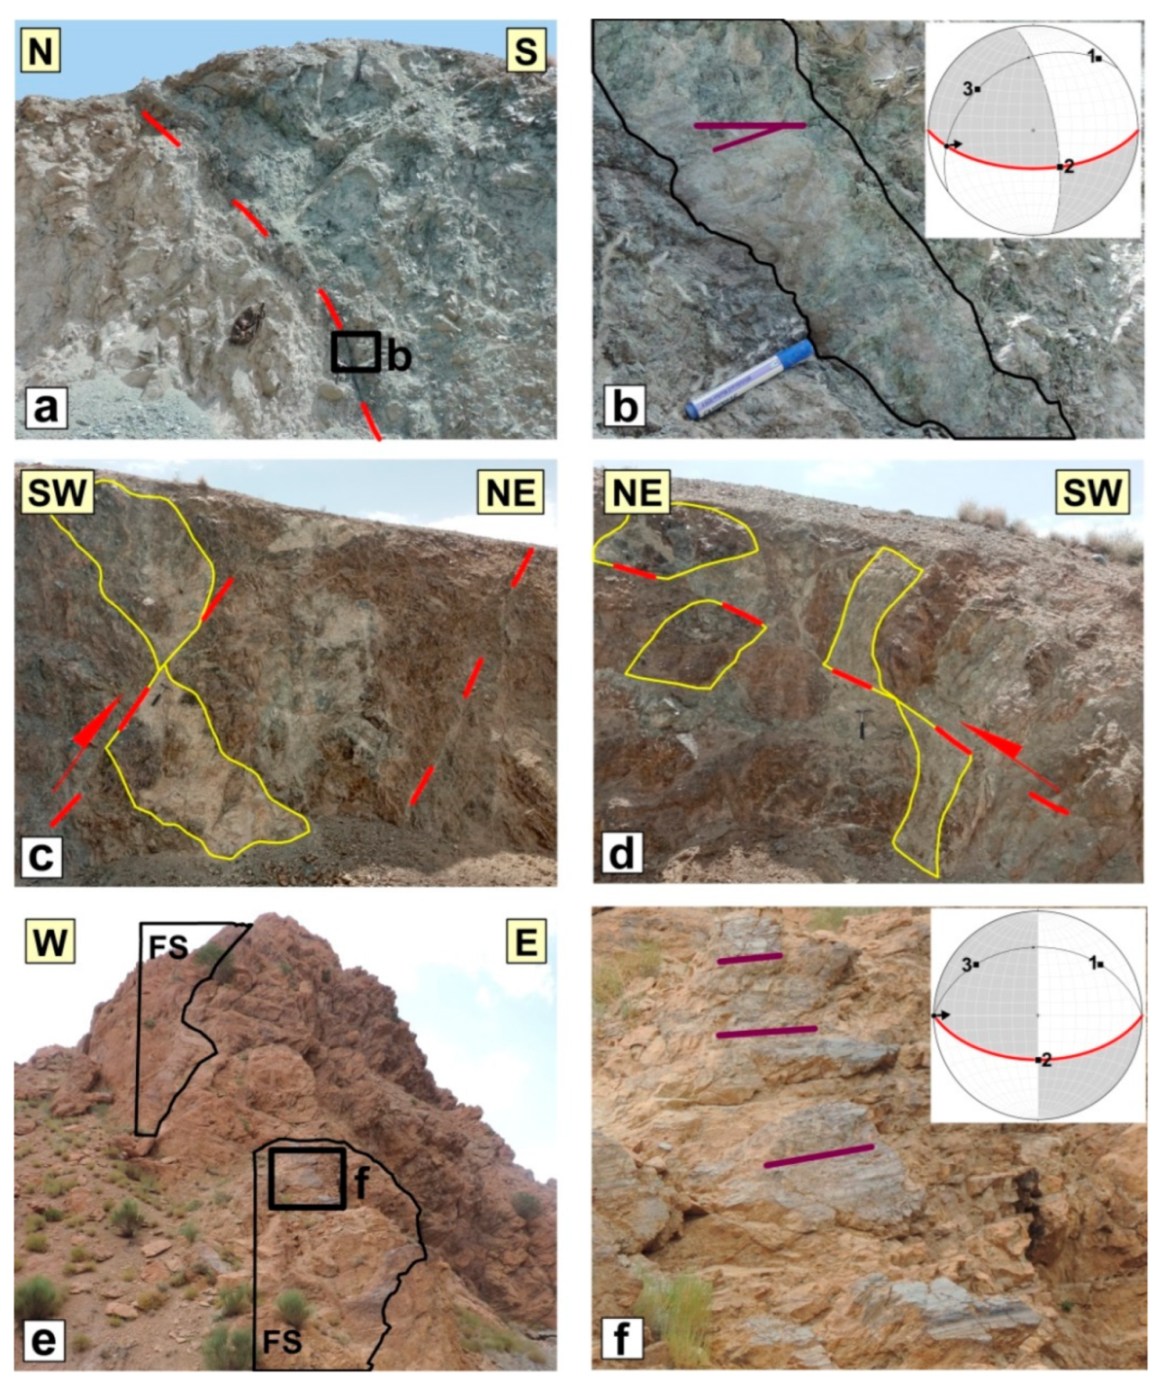
The South Birjand fault, emplaced in a crustal weakness zone inherited from the East Iran orogen [5], appears as a sharp fault strand within the ophiolithic mélanges which separates them from the Birjand plain deposits to the north. Investigation of the Google Earth images and SRTM topography associated with the field studies indicates this fault, especially in the south of Birjand city, to be composed of sub-parallel segments with significant overlaps (Figure 4a and Figure 5a). The fault segments displaced the Quaternary sediments (Qt), Paleocene flysch (PEs), upper Cretaceous peridotites (mostly harzburgite and partly lherzolite, Pd), upper Cretaceous flysch (KuSh), and spilitic basalts (Figure 5b).
The NW-SE South Birjand fault, with a length of ~50 km, is located in the Bagheran range front between Moud city and SE of the Siojan village (Figure 1c). Using satellite imagery and field surveying, the structural map of the Bagheran range is prepared (Figure 1d). According to this map, the South Birjand fault along its length consists of six main segments with notable overlaps (Figure 1d and Figure 6). This section provides geometric and kinematic characteristics of these fault segments.
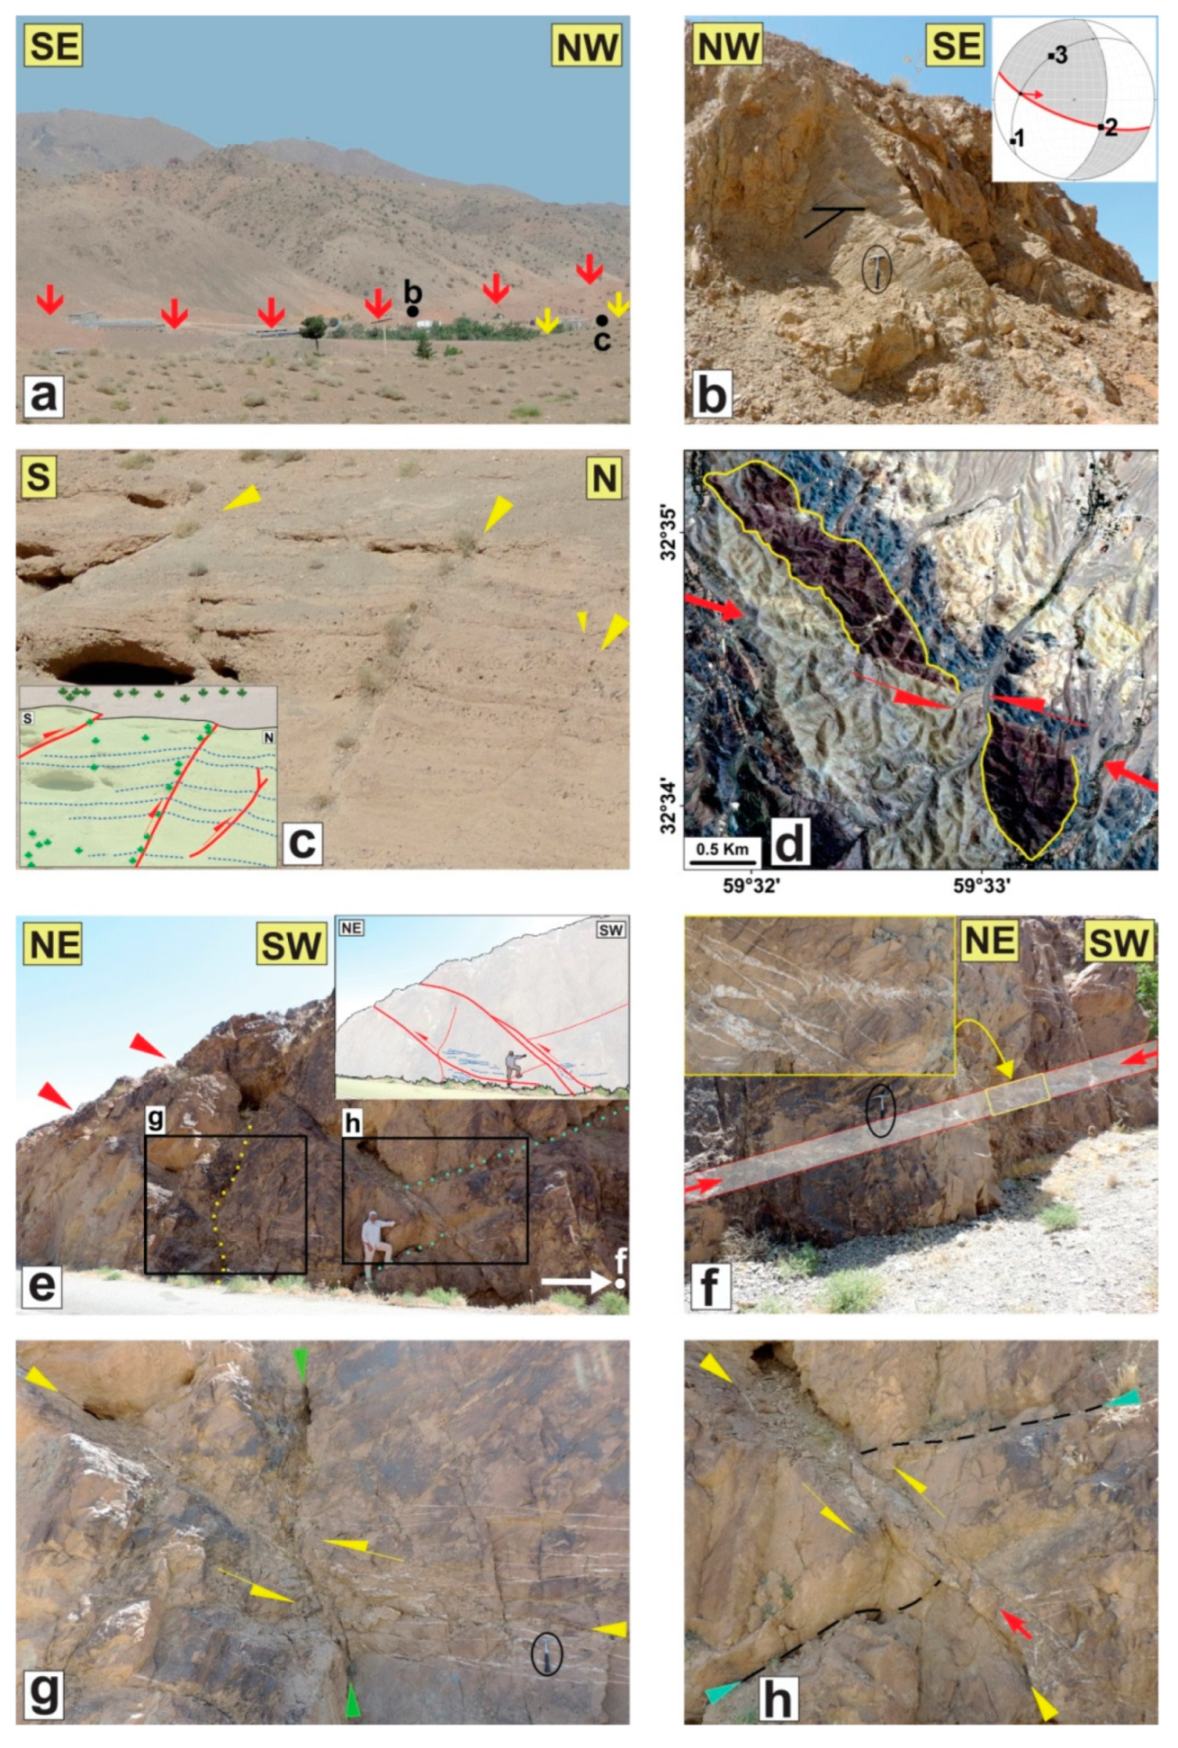
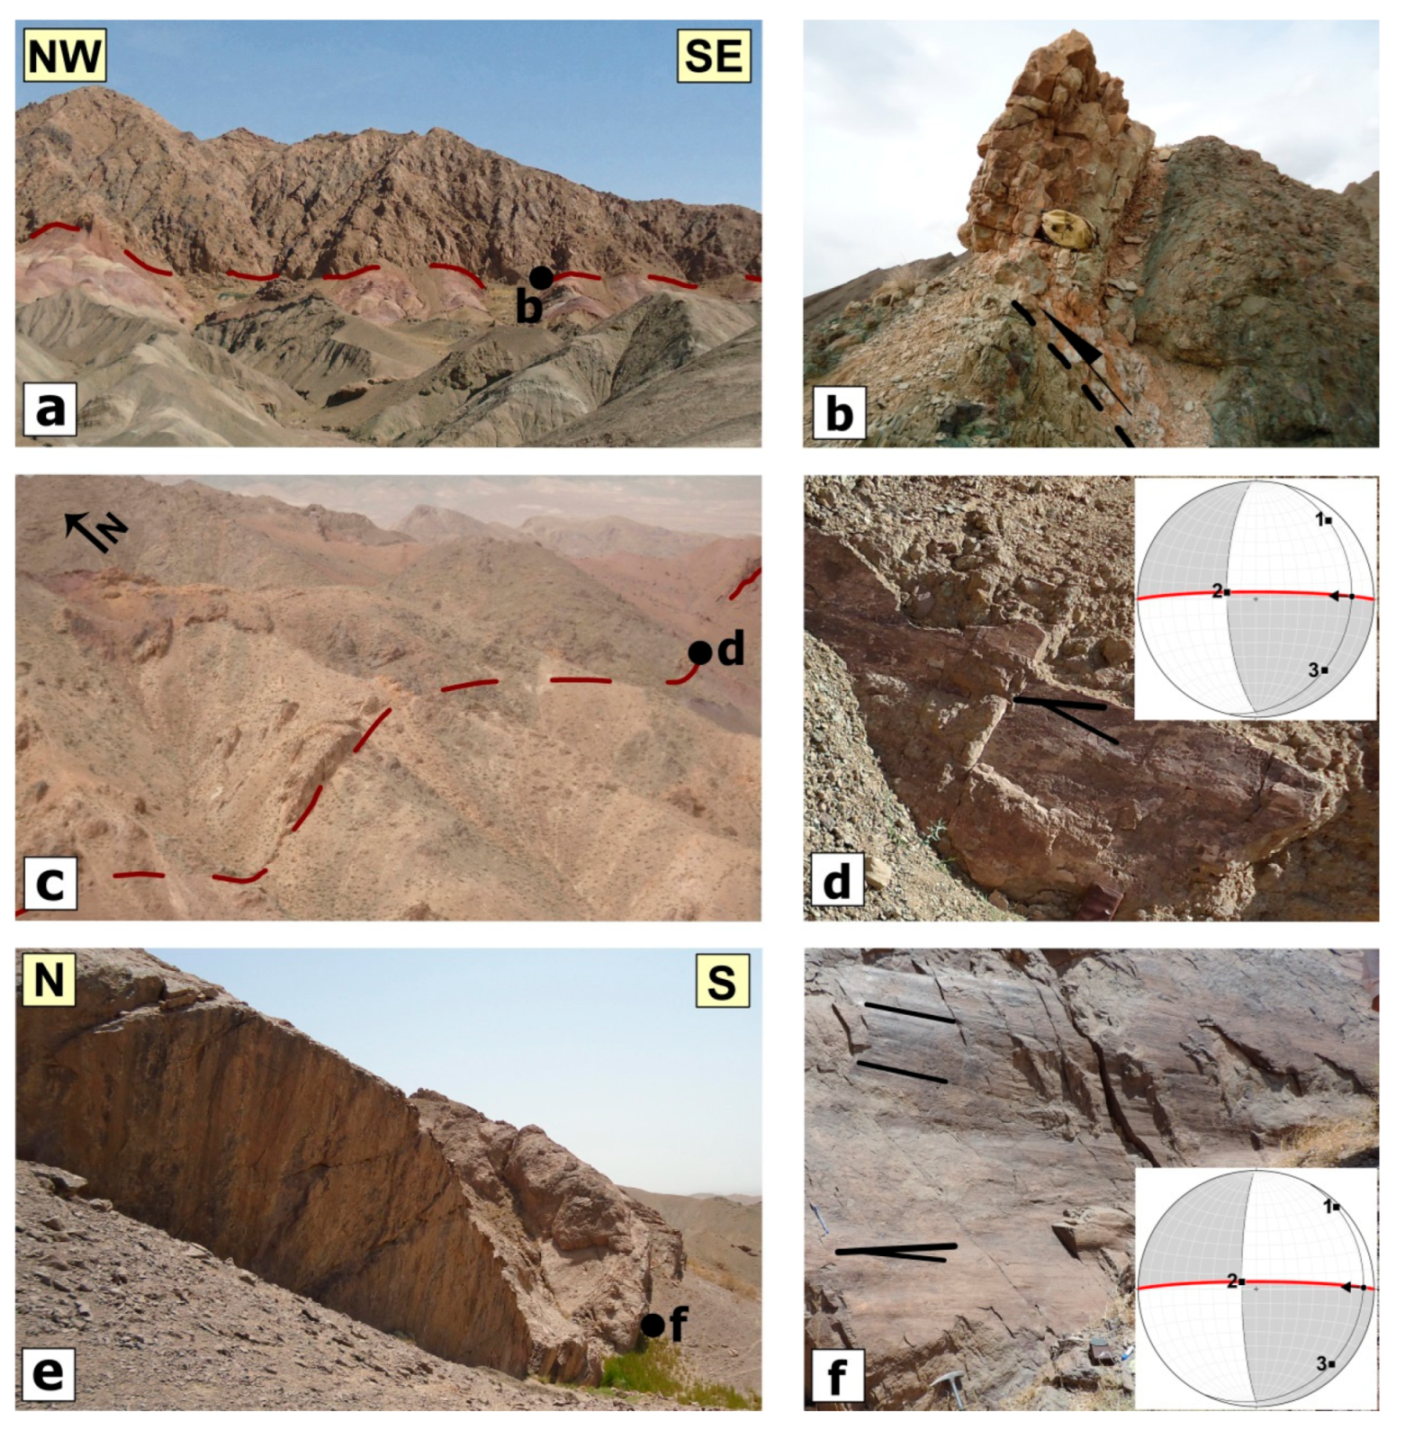
The northernmost segment of the South Birjand fault across the range front separates the upper Cretaceous ophiolitic mélanges and Paleocene flysches to the south from the Quaternary gravel fan deposits to the north [44]. Along one of the northern segments, ~6 m uplift of the alluvial deposits is observed [8]. We found the fault plane and its striations where the fault constitutes the boundary of Paleocene flysch with the Quaternary gravels (32°46′30″N; 59°23′E) (Figure 4a–c). The field evidence shows its latest oblique left-lateral reverse motion, which confirms its recent activity during the late Quaternary (Figure 4b). In the south, ~4 km west of Maud city (Figure 1d), ~1 km left-lateral offset of the upper Craterous spilitic basalts and radiolarites is recorded (Figure 4d). Assuming a consistent fault displacement during the past ~66 million years, we suggest a horizontal slip rate of ~6.6 mm/yr for this segment.
Close to the Boushad village (32°46′58″N; 59°20′47″E), the South Birjand fault displaced the Paleocene flysch rock blocks and minor fractures vertically ~1 m (Figure 4e,g,h). In this section, the sigmoidal veins on the hanging-wall of the South Birjand fault (Figure 4e,f) suggest a nearly horizonal right lateral shearing (Figure 4f). The veins are cut off and displaced by the fault plane. Due to a reverse component of the South Birjand fault, we expect these veins to show a left lateral shearing. Furthermore, tilting of the flysch deposits indicates gentle folding in the field and also on the geologic map [44]. Thus, these sigmoidal veins could be related to the folding process. Development of the sigmoidal veins during folding on the limbs of flexural folds has been discussed by various researchers [45,46,47,48].
We recorded three sets of striations on the South Birjand fault, between the Quaternary alluvial deposits and the Cretaceous flysch (Figure 5c,d). The fact that several movements may occur on the fault plane often introduces complications for the correct kinematic interpretation. The last movement will usually overprint the previous kinematic criteria [49]. The youngest fault striations (285°/10°) suggest a left-lateral mechanism, with a reverse component. We found the southern segments of this fault (N60°W, 85°SW) within the spilitic basalts which show a left-lateral strike-slip motion (Figure 5e). As a result, the southern segments of the South Birjand fault across their length show a left-lateral strike-slip motion, whereas the northern segments of the fault display a left-lateral with reverse movement, while the reverse motion increases to the east.
The Giuk and Boushad faults are situated south of the South Birjand fault. These faults have played an important role in the Bagharan range deformation.

4.2.2. Giuk Fault

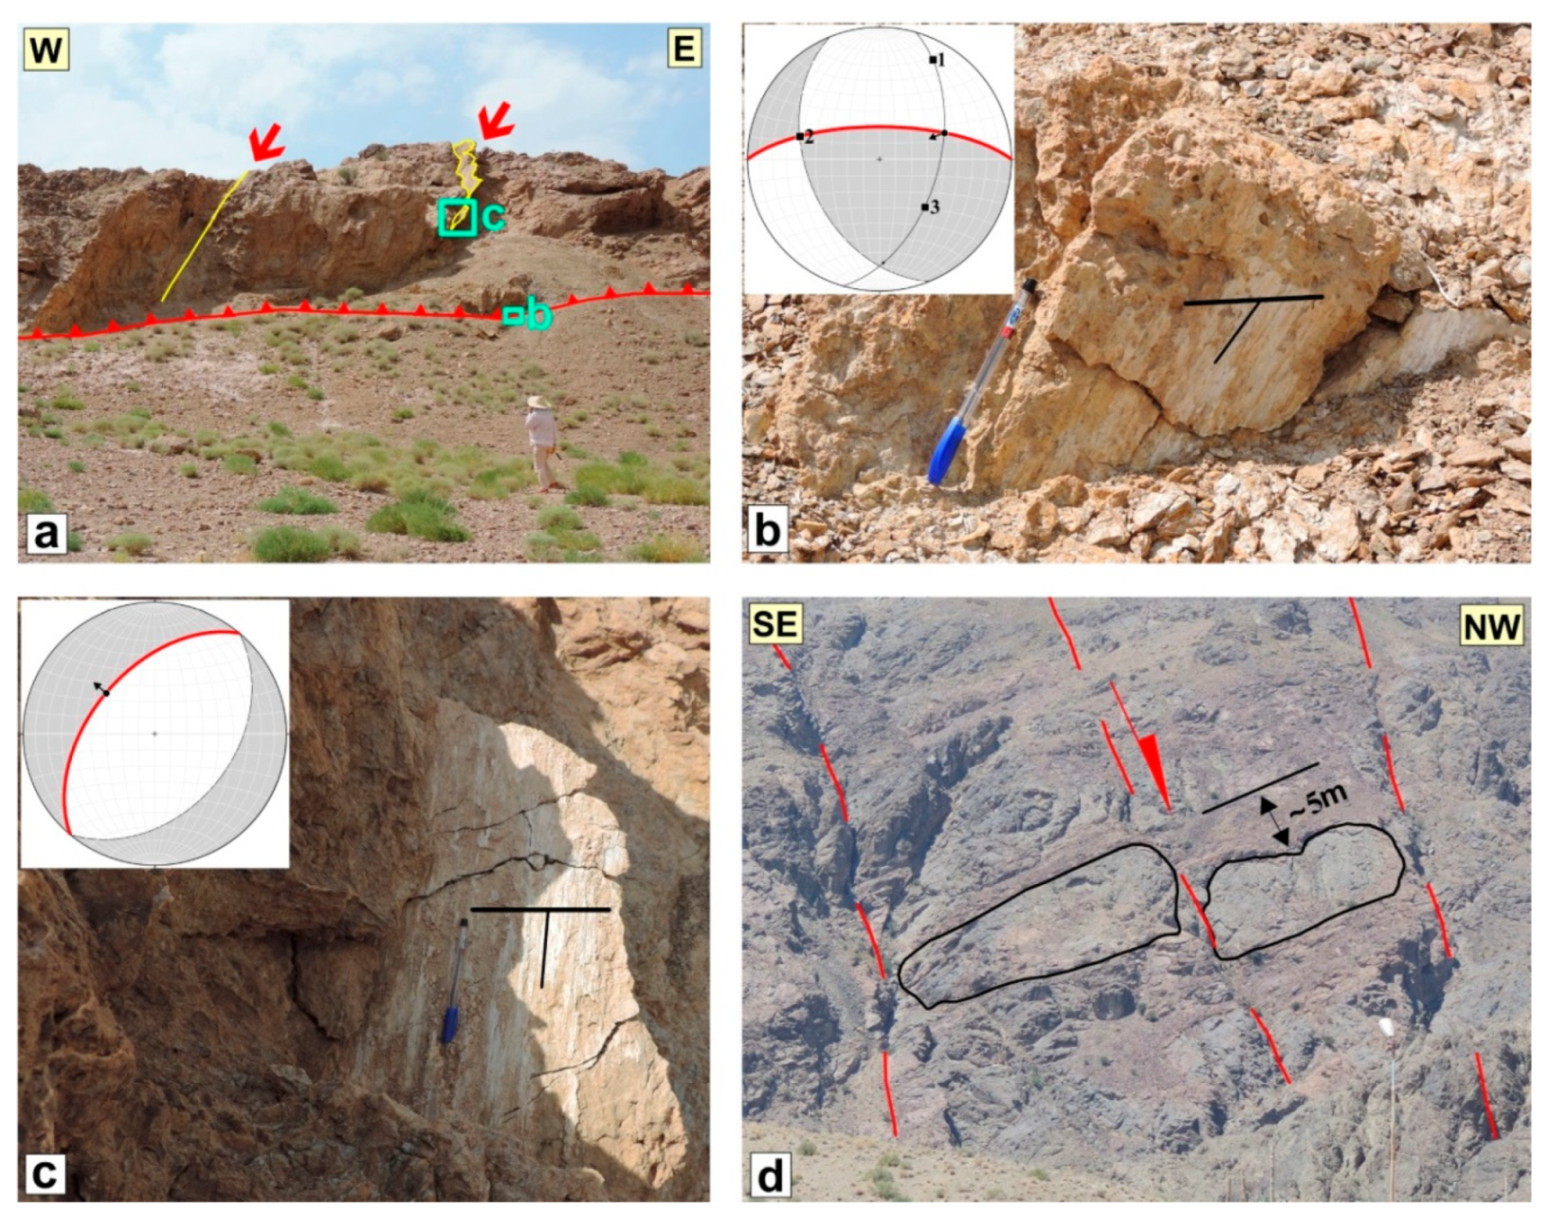
The left-lateral Giuk fault with a reverse component (N75°W, 80°SW; 285°/00°, Figure 6a,b), named after the Giuk village, is here introduced for the first time (Figure 1d). This fault displaces the Cretaceous ophiolithic mélange and flysch deposits. Peridotites in the study area are boudinaged on a scale of meters. In the middle part of the fault, mostly lozenge and cone-shaped peridotite boudins follow each other discontinuously (Figure 6c,d). The long axis trend of the boudins, in the section view, is approximately parallel and perpendicular to the dip direction of foliation in the strike-slip and reverse tectonic regimes, respectively [50]. Generally, the trend of boudins is measured by recording the azimuth of enveloping surfaces that join the flanks of adjacent boudins along the same margin of structure [50,51]. The studied peridotite boudins generally show parallel alignment to the enveloping surfaces and are sub-parallel to the fault strike because of shearing in the Giuk fault zone.

4.2.3. Boushad Fault

The Boushad fault, with a length of ~40 km, has played an important role in shearing and facilitating alteration processes within the Bagheran range. The Boushad fault separates the Cretaceous ophiolitic mélange and the Tertiary volcano-sedimentary rocks. The Boushad fault can be divided into the eastern NW-SE and the western E-W fault segments. The trace of the fault in its westernmost termination is not traceable, while its eastern segment obviously connects to the Fanud fault (Figure 1d). Although the western segment (N90°E, 90°) did not show any specific kinematic indicator, the eastern segment (N70°E, 70°SW; 285°/14°) could be considered as an oblique left-lateral reverse fault (Figure 6e,f).

4.2.4. Kakhki Fault

The Kakhki fault, with a length of ~25 km, is traceable on the satellite images and in the field. This fault, as introduced for the first time in this study, has a general NW-SE strike and is located between the upper Cretaceous peridotites and shales. In the east, it is parallel to the Boushad fault and connects to the N-S Fanud fault (Figure 1d), but in the west, its strike become closer to the E-W trend and connects to the Boushad fault (Figure 1d). According to the fault-slip data, an oblique left-lateral reverse motion is suggested for this fault (Figure 7a,b).

4.2.5. Chenesht Fault

The Chenesht fault has a length of ~30 km, consisting of an east and west segment. The eastern segment with a NW-SE strike constitutes the boundary of the Cretaceous peridotites with the listvenites-serpentinites or the schists with the spilitic basalts. Field evidence shows a reverse component for this oblique left-lateral fault (Figure 7c,d). The western segment, which is mostly curved, follows the contact of the Cretaceous ophiolitic mélanges with the Eocene flysch. This segment with general attitudes N90°W, 55°S and its slicken lines (270°/00°) shows a left lateral strike-slip mechanism (Figure 7e).

4.2.6. Gol Fault

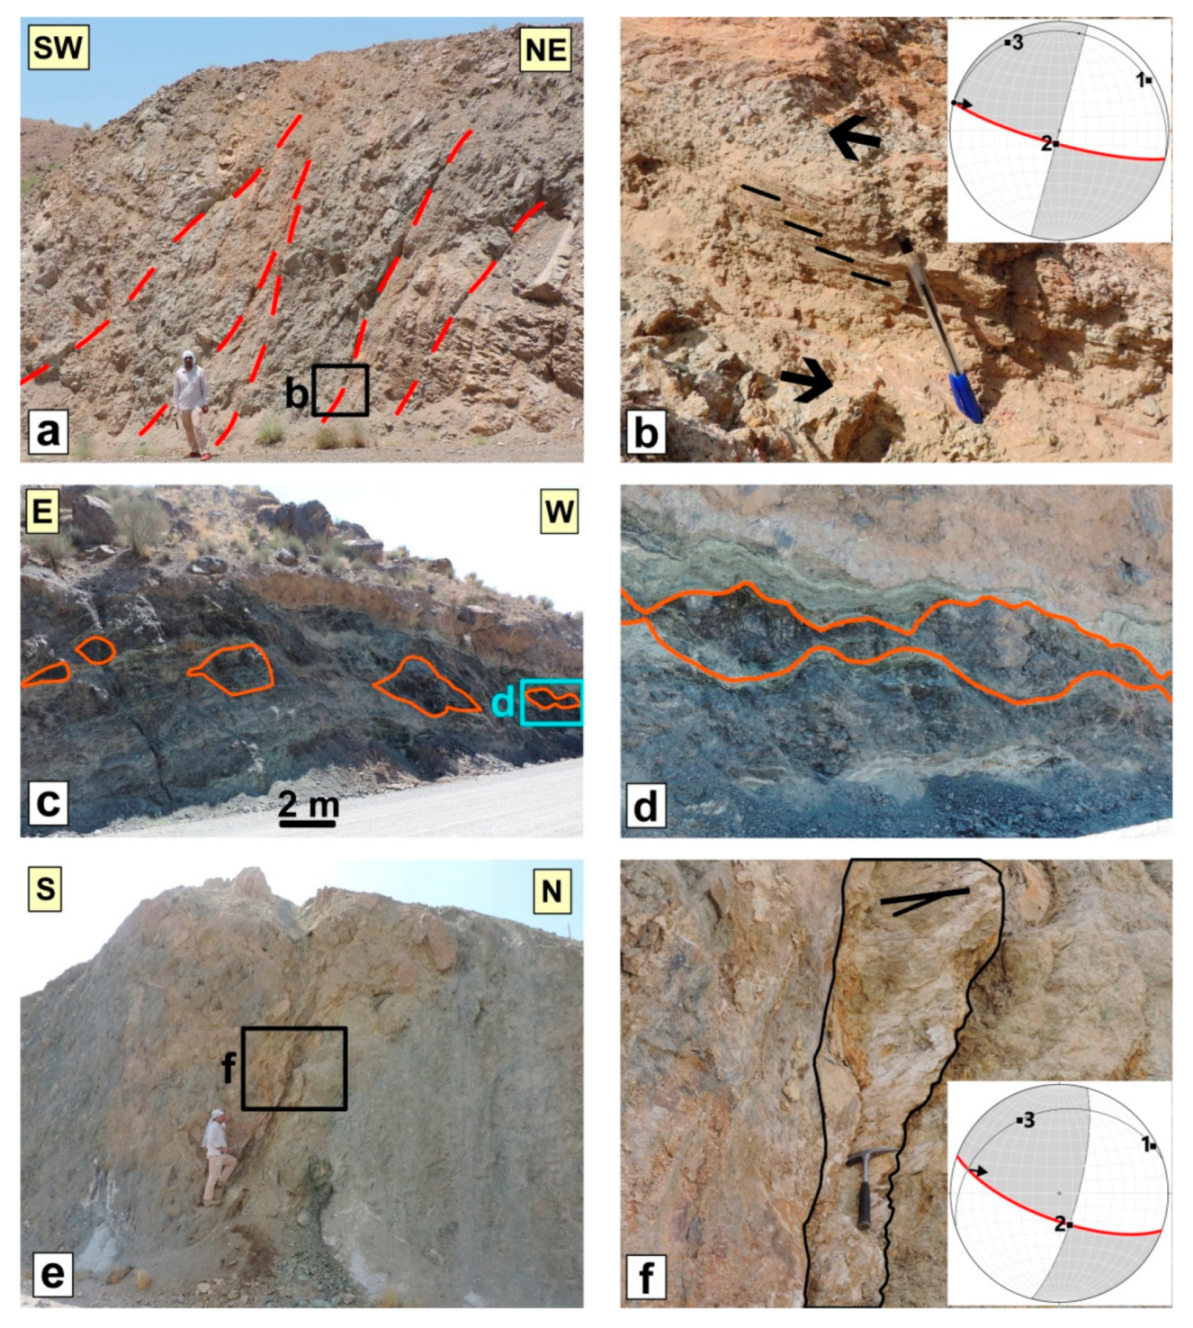
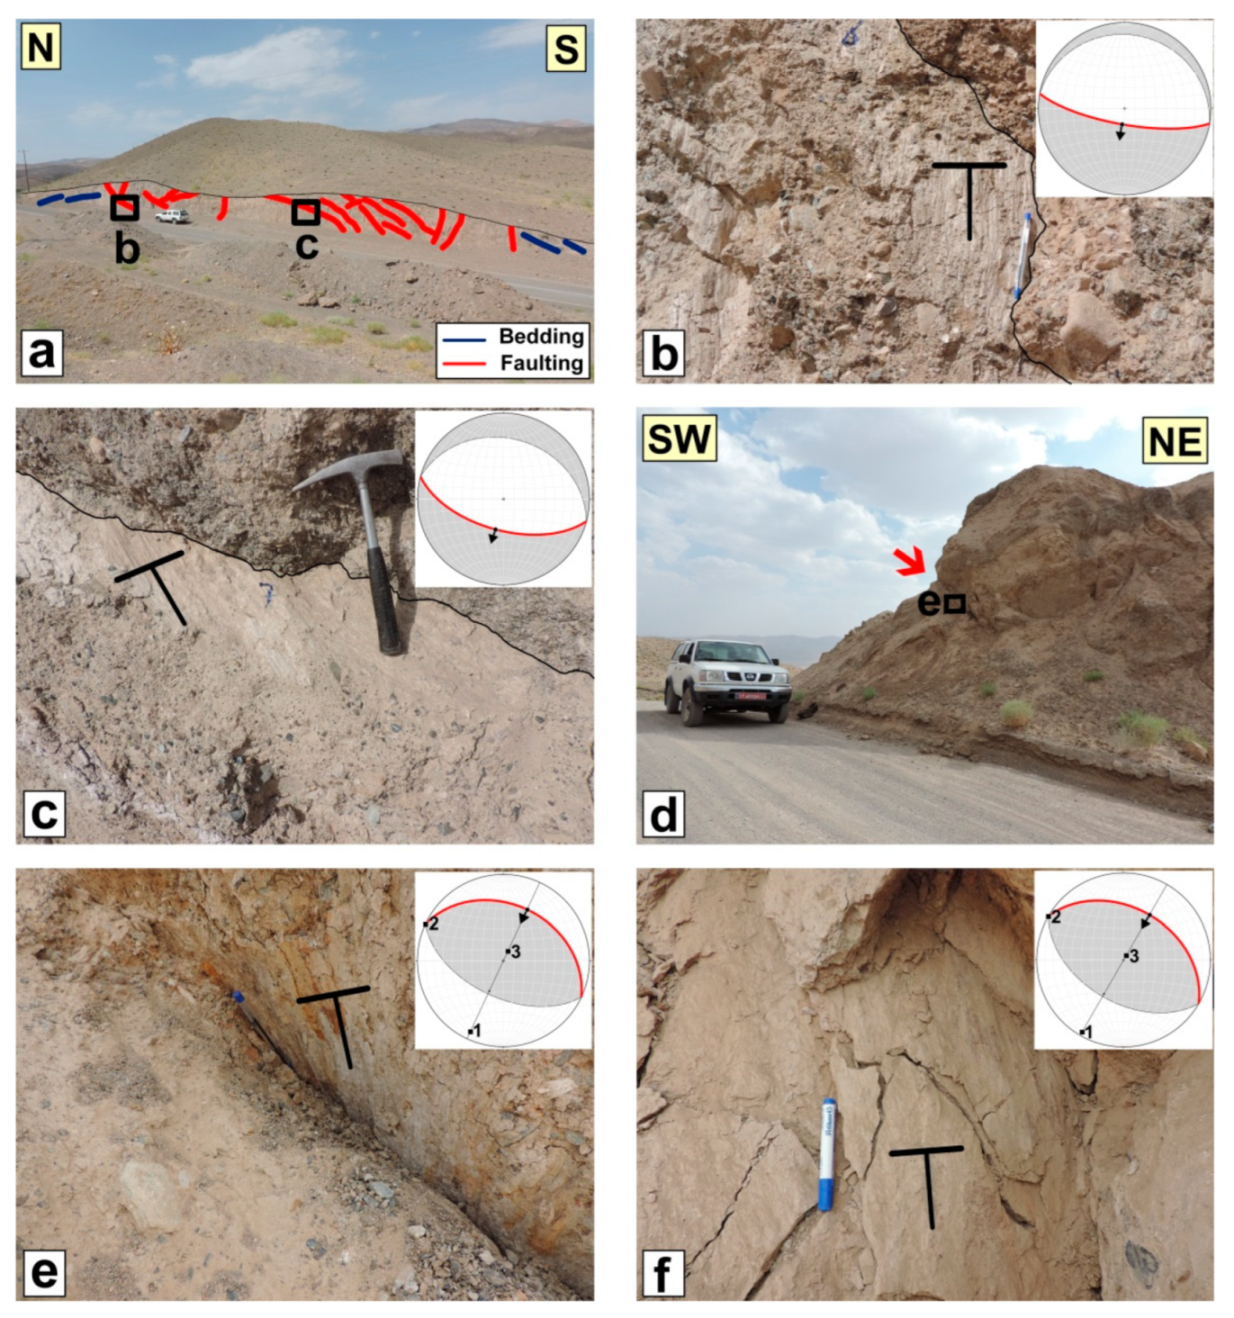
The Gol fault is situated in the intensely deformed southern front of the Bagheran range. This fault with a WNW-ESE strike and ~45 km length follows the overall trend of fold axial traces. The Gol fault consists of several segments with different lengths and strikes. In general, it could be divided into the two main east and west segments (Figure 1d). The Quaternary alluvials, young terraces, and gravel fans are folded and displaced along the fault [8]. Along the west segment, fault scarps with clear striations are recorded between the Cretaceous flysch to the north and the Quaternary alluvials to the south. Geometric and kinematic characteristics of the fault planes (N90°E, 70°N; 068°/46°) show a reverse mechanism with a left-lateral strike-slip component for the western segment (Figure 8a,b). On the hanging-wall of this segment, a set of normal faults (N40°E, 50°NW; 310°/50°) is observed. The normal faults with similar direction are also mapped in the northern front of the Bagheran range. For example, in the southwest of Birjand city (see F.8d on the Figure 5a), a normal displacement of ~5 m is recorded across the fault (Figure 8d).
The conspicuous linear scarp and uplift of the Neogene and Quaternary deposits, SE of the Gol village, could be the result of reverse movement along a N-NE dipping fault at depth. In the hanging-wall of the west Gol fault, anticlines with WNW-SSE axial traces, which are associated with the normal faults, are developed in the Neogene conglomerates (Figure 9a). The WNW-ESE trending normal faults dip both to the NNE and SSW (Figure 9b,c). Similar hidden reverse active faults in the form of anticlinal folding and axial normal faulting are also reported elsewhere (e.g., [52]).

4.2.7. Nasrabad (or Mokhtaran) Fault

Across the southern front of the Bagheran range, discontinuous fault scarps of the west Gol, east Gol, and the Nasrabad faults show an en echelon array. The Nasrabad fault with a length of ~35 km, which connects to the Esmaeil-abad fault, is the eastern continuation of the Gol fault (Figure 1d). Similar to the west Gol fault, its activity has caused the uplift of the Neogene conglomerates on its hanging-wall. The folds with NW-SE axial traces in the conglomerates follow the Bagheran range trend. These folds constitute the Give folds of [8]. Our field data reveal that the NW-SE Nasrabad fault has a reverse mechanism (Figure 9d, Table 1). Because of this, the reliefs across the southeastern part of the fault, such as the Kuh-e Bazu mountain, reach to a height of ~200 m [8].

5. Results on Distributed Faulting on the Shekarab Range

In the N-NW of Birjand, there are two nearly parallel faults of the North Birjand and Shekarab faults (Figure 1c and Figure 10). These faults constitute a left-lateral transpressional shear zone (Shekarab transpressional duplex) with a width of ~5 km, where the duplexes, pop-ups, and folds formed under a shear-compressive system. Analysis of the structural features of the Shekarab range and comparison of it with the Bagheran range leads to detailed assessment of the fault patterns within the northern part of East Iran orogen. In the following, we determine the geometric and kinematic characteristics of the structures in the Shekarab range.

5.1. North Birjand Fault

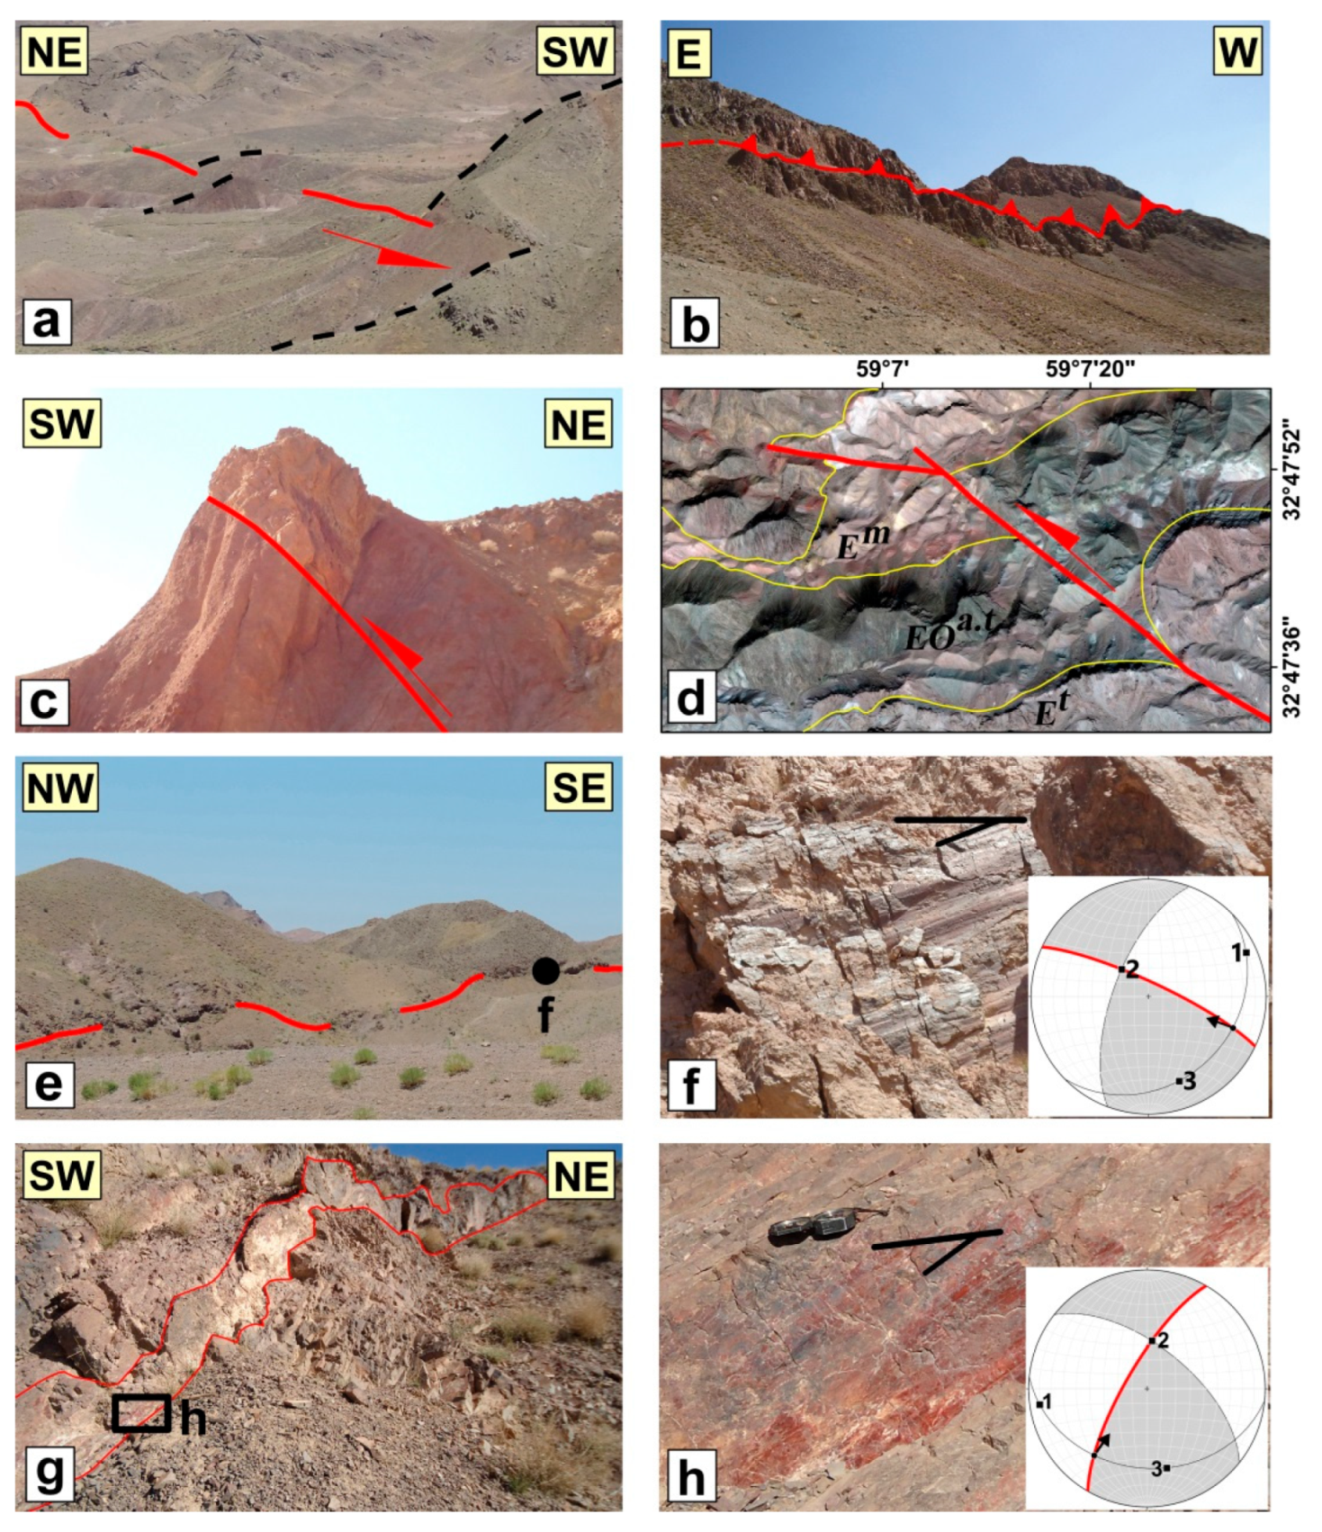
The E-W North Birjand fault (NBF), with a length of ~35 km, is located in the southern front of the Shekarab range (Figure 1c and Figure 10). The fault trace in its terminations could be traced at the Birjand plain. In the range front, the fault strands separate the Neogene conglomerate, tuff, and tuffaceous marl to the north from the Quaternary terraces and gravel fans to the south. The fault plane (~N90°E, 65°N) usually lies parallel to the general trend of the rock units (e.g., Figure 11a). Occurrence of micro earthquakes, shearing and uplifting of the Quaternary sediments, and the fault scarps all show recent activity of the North Birjand fault. The stream deflection and fault-propagation folding are the result of left-lateral and reverse motions of the fault (e.g., Figure 11b,c).

5.2. Shekarab Fault

The Shekarab fault, at ~30 km long and with an E-W strike, is situated in the northern front of the Shekarab range (Figure 1c and Figure 10). In the west, the fault incised the Eocene basaltic andesites and tuffs, while in the east it follows the contact of Eocene basaltic andesites to the south and Cretaceous ophiolithic mélanges to the north [44]. On the satellite images, the easternmost fault strand could be detected within the Birjand plain, while its western continuation is not well traceable (Figure 1c). The Quaternary geomorphic features such as stream offsets and fault scarps could be considered as recent Shekarab fault activity. The youngest fault kinematic indicators suggest its recent oblique left-lateral reverse motion (e.g., Figure 11d–f).
In the following section, the kinematics of the Shekarab transpressional duplex are briefly discussed.

5.3. The Shekarab Transpressional Zone

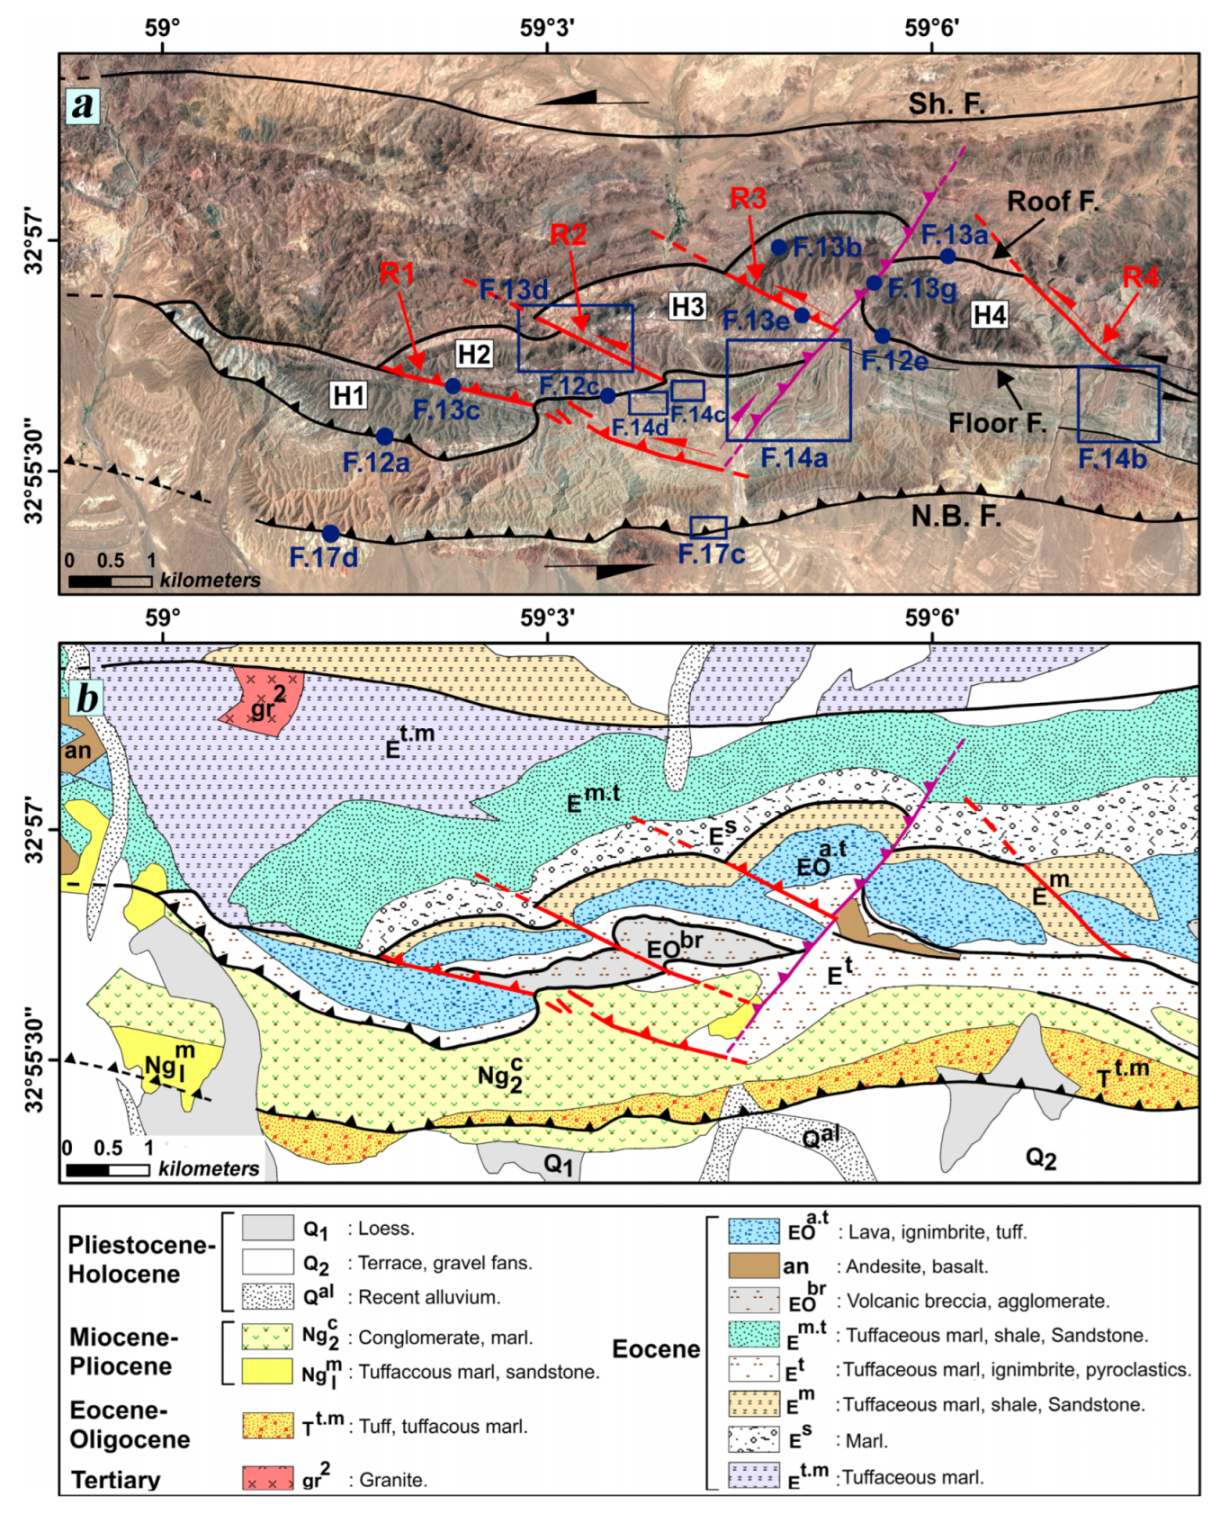
In the middle of the Shekarab transpressional zone, a duplex structure has been formed (Figure 10). The duplex is very sharp in the map view. Structural analysis of this duplex could enhance our understanding of the transpressional kinematics where there are the structural complexities of the strike-slip fault terminations.
The duplex is composed of several horses (the H with numbers on the Figure 10), which in the map view are located at the lateral side of each other (Figure 10). Three main geological layers generally constitute the horses: (1) the Eocene tuffaceous marl, ignimbrite, and pyroclastics (Et); (2) the lava, ignimbrite, tuff (Eoa.t); and (3) the tuffaceous marl, shale, sandstone (Eom) (Figure 10b). In some areas locally, the horses include the Eocene volcanic breccia and agglomerate (Eobr). In the following, geometric and kinematic features of the floor, roof, and ramp faults are presented.

5.3.1. The Floor and Roof faults

The floor fault of the Shakarab duplex (Figure 10) is composed of the western (related to the H1), middle (related to the H2, H3), and eastern (related to the H4) parts (Figure 10). The surface geometry of floor faults follows the geometry of the horses. Along the western part (N60°W, 55°NW), the Eocene tuffaceous marl and pyroclastics are thrusted on the Neogene conglomerate and marl (e.g., Figure 12a,b). The middle and eastern parts of the floor fault (N90°E, 85°N) show nearly similar striations of 088°/20° and 090°/10°, respectively. Thus, our field data suggest an oblique left-lateral reverse mechanism for the floor faults.
Distribution of displacements within a duplex structure occurs from a lower-level or floor fault to the higher-level or roof fault [53]. The roof fault in most of its length is located between the Eocene tuffaceous marl, shale, sandstone (Em), and marl (Es) (Figure 10). The left-lateral offset of the rock units (on the map view) and their repetition (on the section view) could be seen along the fault (Figure 13a,b).

5.3.2. The Ramps of Duplex

Based on the field data and the satellite image analysis, we determined the geometric and kinematic characteristics of the ramps (Figure 10). Field visits of the R1 show that the rock units of the H2 are reversed on the H1 (e.g., Figure 13c). The surface trace of the R1 to the southeast within the Eocene volcanic breccia, agglomerate (EObr), is clearly traceable (Figure 10b). On the satellite images, ~350 m left-lateral offset of the Eocene lava, ignimbrite, and tuff (Eoa.t) along the R2 could be seen (Figure 13d). The R2 activity was associated with fault-related folding within the Eocene tuffaceous marl (Et). Where the R3 (N65°W, 80°NE) is visible, it shows a clear striation (110°/25°) (Figure 13e,f). In contrast, the ramp of R4 is determined only based on its linear trace on the satellite image.

5.3.3. The Antithetic Faults

In the Shekarab shear zone, a sharp antithetic fault ~4 km long and with a NE-SW strike has displaced the floor and roof faults (Figure 10). This antithetic fault (N30°E, 75°N; 218°/29°) displays an oblique right-lateral reverse motion (Figure 13g,h). Interestingly, the R1 and the antithetic faults constitute a pop-up structure [54,55], mostly composed of the H2, H3, and the western part of the H4 (Figure 10). The progressive deformation within the Shekarab shear zone has caused folding with different axial-trace directions (ENW-ESE) that could show the sense of the fault block rotations (Figure 14).
In summary, the Shekarab transpressional shear zone was associated with synthetic faults (Figure 10), which are defined as the ramps, floor, and roof faults of the Shekarab duplex. Because of the similar floor and roof fault mechanism, we suggest the Shekarab duplex is an active-roof duplex (e.g., [53,56,57,58]).

6. Results on Stress and Strain Fields

6.1. Analysis of the Fault Slip Data

The post-Neogene geometry and kinematics of faults are determined in the western Birjand splay (Bagheran range), the eastern Birjand splay, and the Shekarab range (see Section 4 and Section 5). Based on these fault slip data, the present-day stress directions have been determined. The maximum horizontal stress (σ1) is oriented N49°E, N44°E, and N51°E for the Bagheran range, the eastern Birjand splay, and the Shekarab range, respectively (Figure 15 and Table 2). This minor variation in the σ1 direction could hypothetically be the result of fault-block rotations due to the left-lateral activity of the northern Neh fault terminations (see the Section 6.2).

6.2. Geodetic Strain Field and Rotation Rate

Here (Table 3), we give the principal axes of the strain rates derived from the published GPS velocities and values reported in Table 1 [37], and found through the principle strain analysis described in the Methods section.
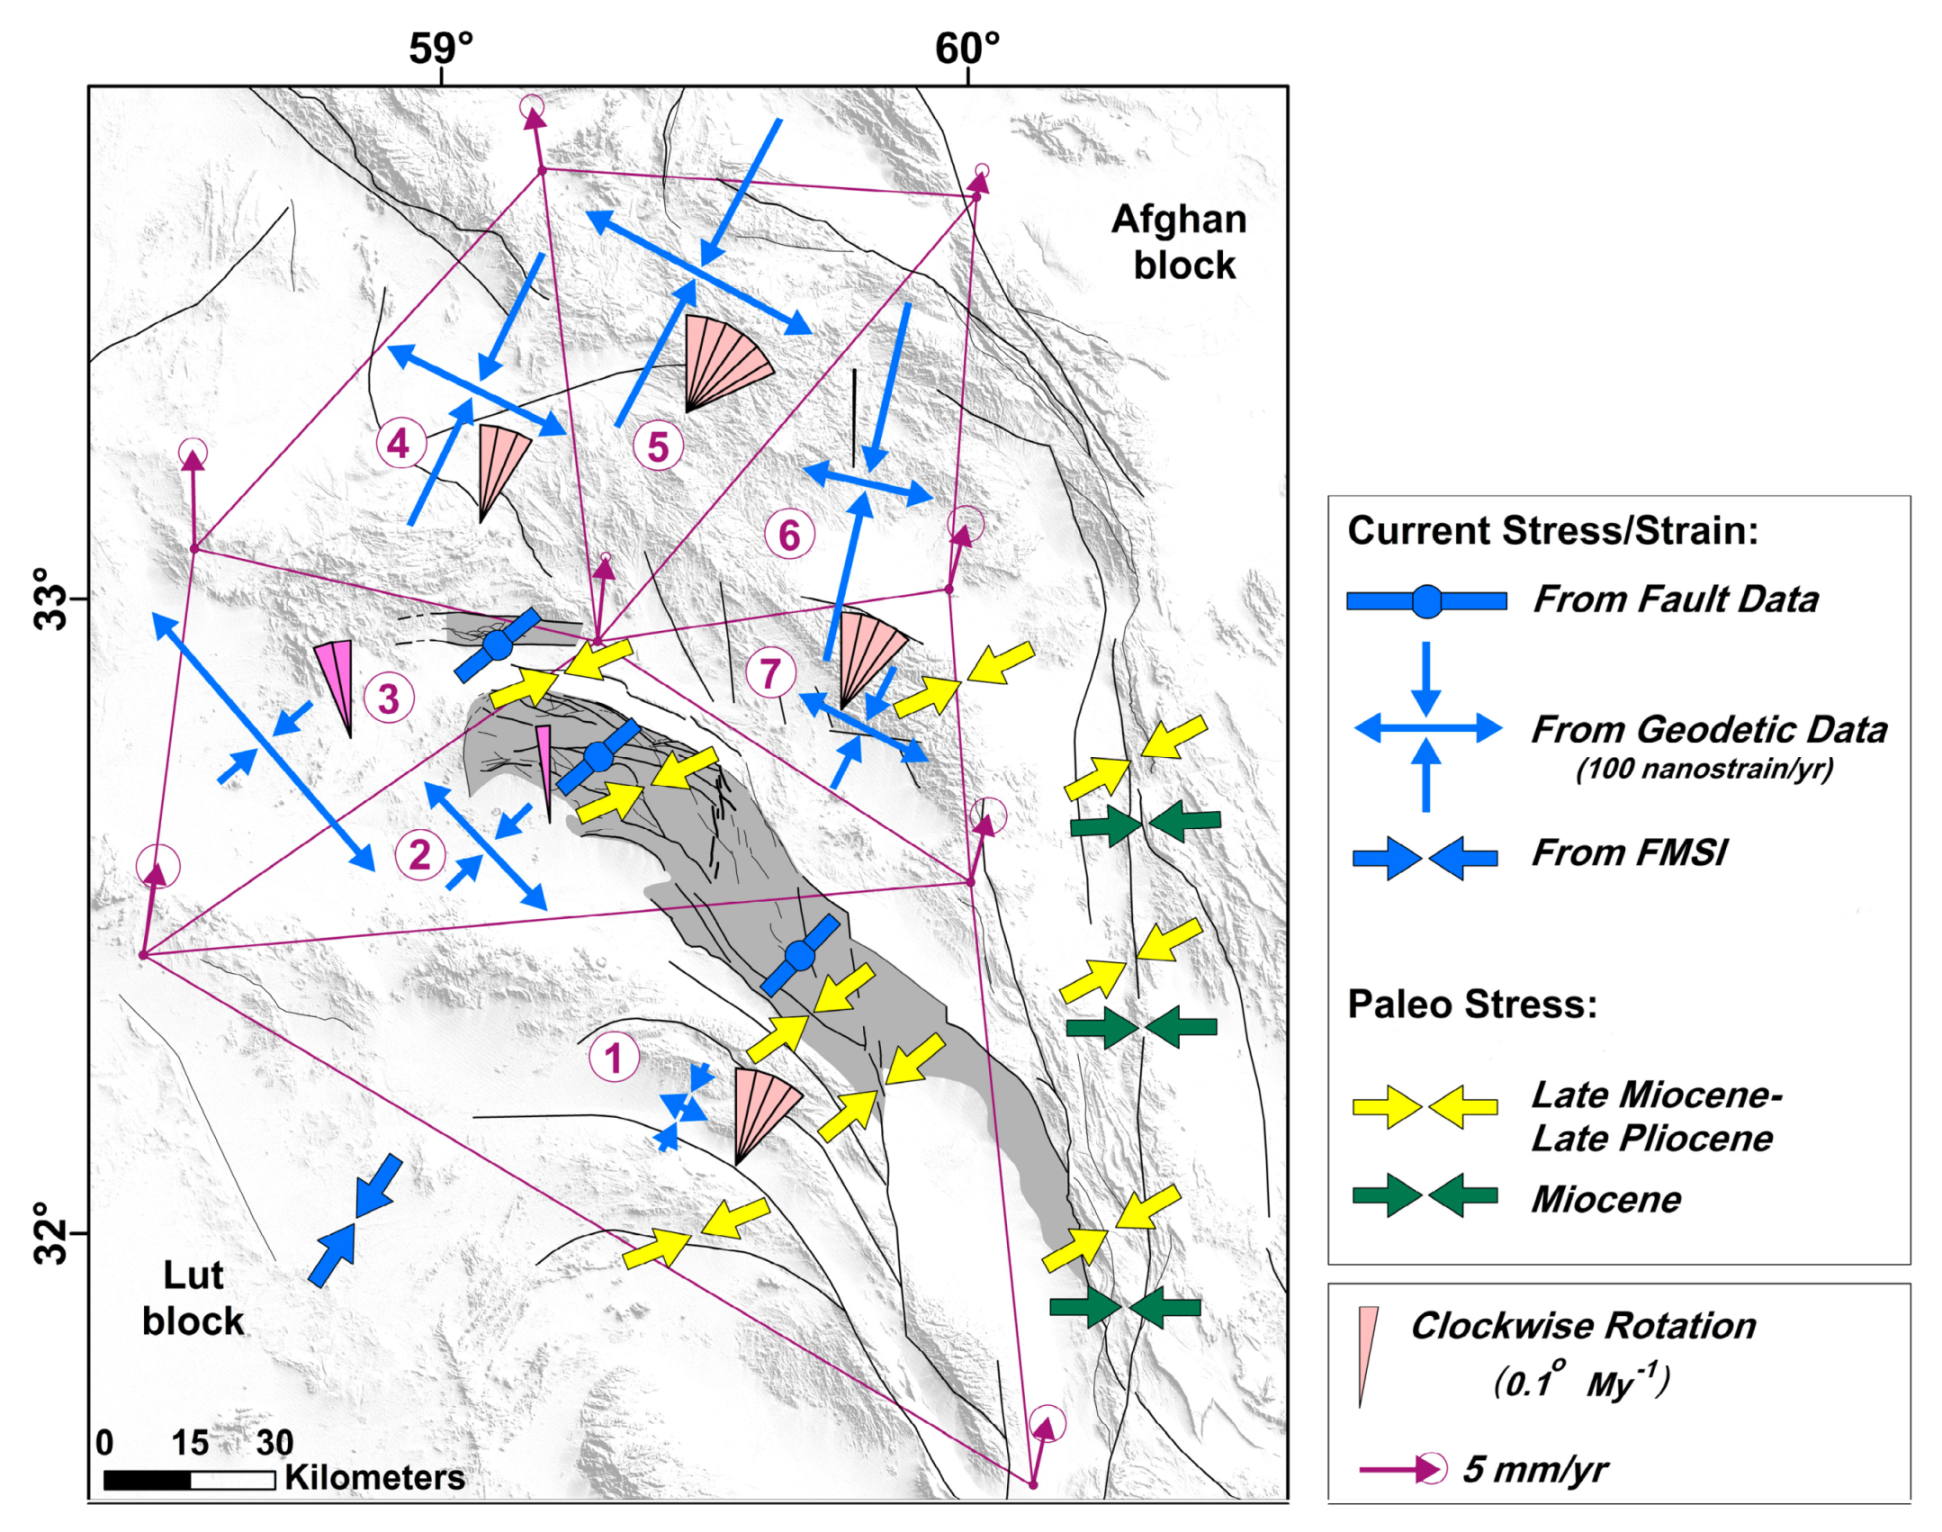
Geodetic strain rates show the present-day NE-SW compression axis, which has an oblique orientation relative to the main fault trends (e.g., the South Birjand, North Birjand, and Shekarab faults). In addition, the extensions axes in the networks show strike-slip motions. The triangle 3 with the high extension rate (Figure 16) includes the Shekarab duplex and pop-up structures.
We computed the geodetic rotation rates within this triangular network similar to the previous studies (e.g., [59]). The obtained rotation rates (Table 4; Figure 16) illustrate two distinctive areas with opposite rotation senses in the north of the East Iran orogen. In networks 2 and 3, with an array of left-lateral strike-slip faults (e.g., the South Birjand, North Birjand, and Shekarab faults), rotations are counter-clockwise (CCW), whereas in networks 1 and 4–7, with the NNW-SSE right-lateral strike-slip faults (e.g., the Esmaeilabad, west Neh, and east Neh faults), rotations are clockwise (CW).
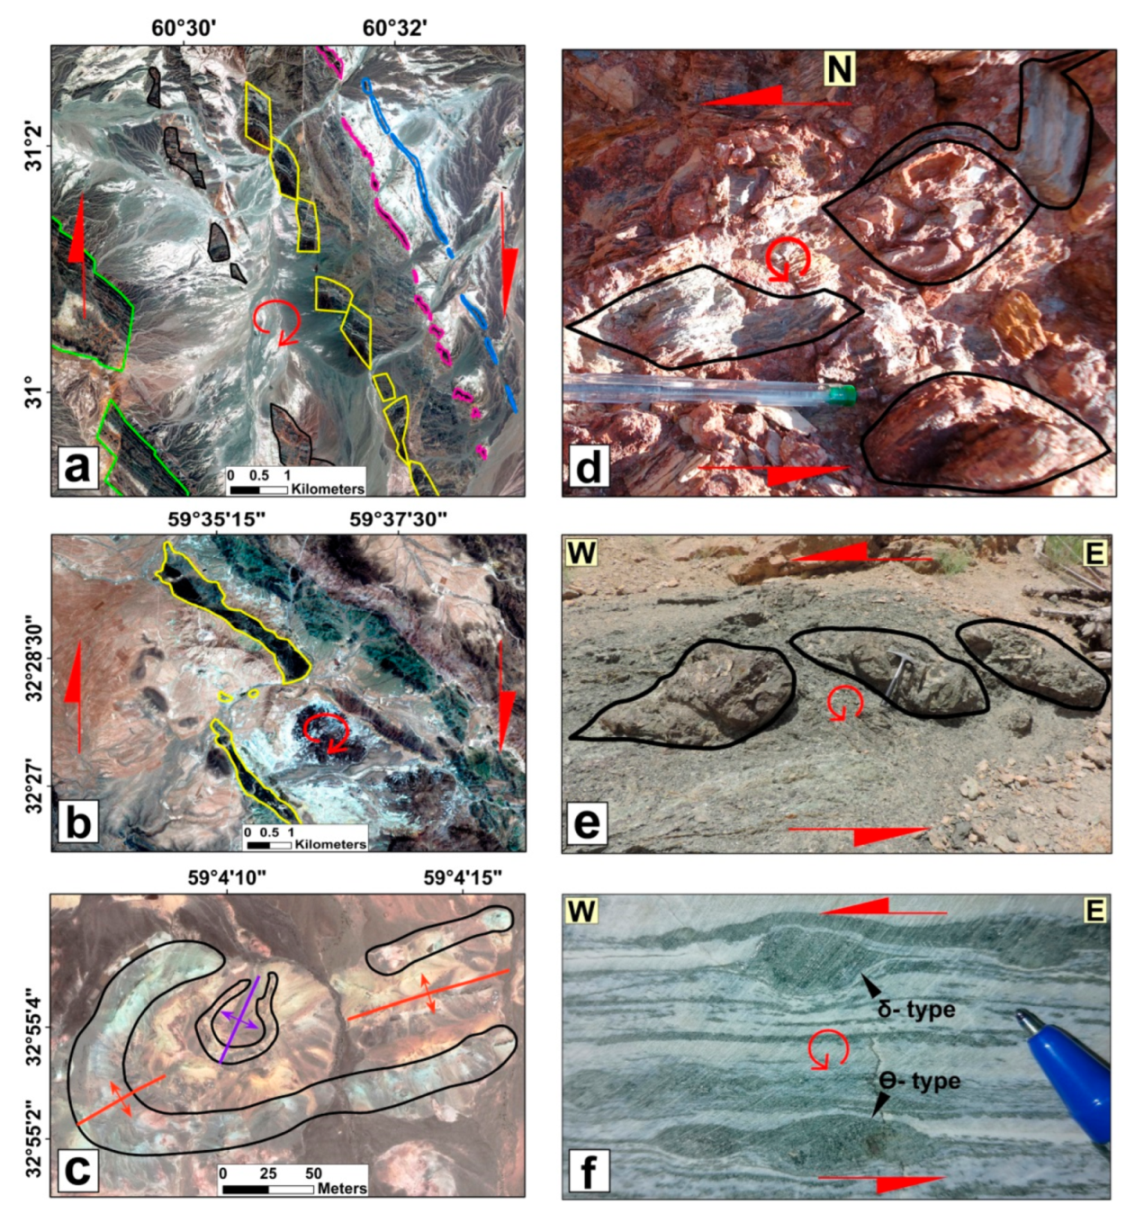
Our field data and satellite images analysis in eastern Iran indicates CW and CCW rotations that are related to the right-lateral and left-lateral strike-slip faulting in this area, respectively. We presented two typical cases of the right-lateral offsets with CW rotation of the rock units within the right-lateral Zahedan fault (Figure 17a) and the eastern part of the Birjand splay (Figure 17b). The strike of the rock units within each block have changed due to their rotations. In the Shekarab range, CCW rotations of the anticline core on the satellite image (Figure 17c), the boudinaged folds (Figure 14d), and boudined rock pieces in the field (Figure 17d) are well visible. The boudined rock units (Figure 17e) and δ-type porphyroclasts in the mylonites (Figure 17f) indicate a CCW rotation in the Bagheran range.

7. Discussion and Interpretation of Results

The multidisciplinary observations on fault movement and geodetic strain rates are discussed and set into a regional interpretative model, addressing first the structural evolution of the Shekarab duplex, followed by demonstrating that the kinematics of the Birjand splay and of the Shekarab zone imply vertical axis fault block rotation. The discussion then addresses the tectonic model of the Birjand splay and closes with a comprehensive regional tectonic and kinematic model of north of central and east Iran.
Our suggested kinematic model is compatible with the current model for the NE of Iran [8], but proposes an updated interpretation based on the newly acquired data. According to [8], the N-S right lateral shear of the Neh fault system is accommodated by the diffuse E-W thrusting (e.g., Giv and Nauzad thrusts) and left-lateral faulting, such as the active Dasht-e-Bayaz fault farther north. In their model, the E-W left lateral faults suffer a clockwise (CW) rotation, while the E-W thrusts, which link at their eastern ends to the N-S right-lateral faults, rotate counterclockwise (CCW). In addition, this model requires a transition from non-vertical axis fault block rotation in the south to a fault configuration that needs fault block rotation in the north. Compiling and updating our fault kinematics and GPS-derived strain data with the stress inversions and published paleomagnetic data, we suggest an alternative model, in which the N-S right-lateral shear in the north of the East Iran orogen is taken up in the NW-SE left-lateral transpression and the E-W left-lateral faults. This fault pattern causes CCW rotation of the central Iranian blocks, which changes to the CW rotation in the left-lateral transpressional fault splays and strike-slip faults.

7.1. Structural Evolution of the Shekarab Duplex

Our field and satellite image analysis confirms the suggested structural model of the Shekarab duplex (Figure 18). Shear folds are usually formed at different stages of deformation in the shear zones [51]. As a result of the progressive deformation, the shear fold axes rotate and usually displace the rock units along their axes [51,61,62,63]. The faults formed kinematically along the axes are synthetic faults within the shear zone which can form the duplex structures [64].
In the left-lateral Shekarab duplex, the recent shear folds and displacement of rock units along the fold axes are recorded (Figure 14). This duplex at the first stages of the progressive deformation could be assumed to be a shear fold with a NW-SE axis (Figure 18a). Later, the folded units are displaced along the fold axis and the E-W faults (as the roof and floor faults) in the center of the shear zone (Figure 18b). The low to moderately plunging fault striations on the roof and floor faults imply a wrench-dominated oblique slip deformation in this zone. The structural data show the recent left-lateral faulting with a reverse component for the ramps. Continuation of the ramp traces could be seen to the south. The ramp 1 (R1) with the antithetic fault (An. F) created a pop-up structure which encompasses the horses 2, 3 (H2, H3), and the western part of horse 4 (H4) (Figure 18c).

7.2. Vertical-Axis Fault Block Rotation

In this research, we focused on determining the kinematics of the Birjand splay (as a case study) and the Shekarab transpressional zone (as a part of the old-isolated splay) to constrain how opposite sense fault-block rotations accommodate in the north of the East Iran orogen. To constrain the comprehensive kinematics and dynamics of the deformation, a combination of structural, paleostress, and geodetic strain data with published paleomagnetic results is required. In addition to structural data, paleomagnetic results as a supplementary data provide independent measures of fault block rotation. Prevailing vertical-axis fault block rotation in north of the East Iran orogen, NE of the Lut block, could be constrained via the following independent fault kinematics, seismic neostress, and geodetic strain.
By changing the regional and local stress regime, the kinematics, geometry, and slip-rate of faults, as well as the spacing and internal strain rate of the crustal faulted blocks, could be changed. In kinematic analysis of the continental strike-slip faults, an important issue is the possibility of fault block rotations due to tectonic stress changes. The tectonic regime of central and eastern Iran shows drastic changes in the Plio-Quaternary (e.g., [65]). In addition, the low slip rate of faults and sporadic seismicity across central Iran indicates that compressional and strike slip deformations have declined since ~5–2 Ma. For the evaluation of such a possibility in the north of eastern Iran, we elaborate geometric and kinematics of the Neh fault termination in the Birjand fault splay and the Shakaran transpressinal shear zone.
In the northern termination of the N-S right-lateral Neh fault, CCW fault block rotation switches to CW rotation at the NW left-lateral transpressional zones. We suggest the N-S right-lateral Fanuad fault as an axis for the Birjand splay with an opposite sense of fault block rotations in the east and west. As a result, the NW-SE oblique left-lateral reverse faults show a CW rotation in the east Birjand splay, whereas the NNW-SSE (E-W) left-lateral strike-slip faults show a CCW rotation in the west. This opposite sense of fault block rotation across the Fanud fault could be due to a passive book-shelf (domino) CCW rotation inside of an E-W left-lateral transpressional range in the west Birjand splay, the westernmost Neh fault terminations. In fact, field studies and satellite images analysis confirm such a book-shelf structure in the west Birjand splay. We suggest the initial WNW-ESE left-lateral P shears suffered such CCW rotation and gradual alignment with the shear zone boundary-faults during progressive deformation.
We used the asymmetric (ωij) parts of each geodetic tensor of a triangular network based on the available geodetic data (Figure 17). The GPS-derived rotation rates show a low CCW rotation within the west Birjand splay (Bagheran range) and the Shekarab range (networks triangles 2 and 3, Figure 16) which can be achieved by a prevailing left-lateral faulting. Instead, CW rotation within the east Birjand splay (e.g., network 1, Figure 16) is taken up by the oblique reverse coupled movement with left-lateral faults of the region, such as the south Birjand fault.
The paleomagnetic results [66] show that a vertical axis fault blocks CCW rotations of ~20–35° across central Iran, which is achieved by the N-S to NNW-SSE right-lateral faults since the Oligocene–Miocene. In contrast, paleomagnetic data display a low CW rotation of ~5.5–9.3° in the northeast of central Iran via the ENE-WSW left-lateral faults during this time [66]. This CW fault block rotation is assigned to the low rotation rate and/or bending of the initial E-W left-lateral faults due to northward impingement of central Iran into the eastern Alborz and western Kopeh-Dagh. This CCW vertical-axis fault block rotation was associated with ~12–37 km N-S shortening, whereas the CW fault block rotation has caused ~14–24 km N-S shortening across the north of central Iran during the late Cenozoic, assuming a block length of ~200 km [66]. The paleomagnetic data suggest ~30–80 km (~10–20%) of ~300–500 km of total Arabia-Eurasia shortening via the CCW rotation since the initial collision at 20–30 Ma [66]. This fault block rotation is consistent with the lack of crustal thickening in central Iran [67]. Our GPS-derived fault block rotations and also fault kinematic and earthquake focal mechanism stress inversions are consistent with the paleomagnetic CW fault block rotation north of the East Iran orogen.

7.3. Tectonic Model of the Birjand Splay within the East Iran Orogen

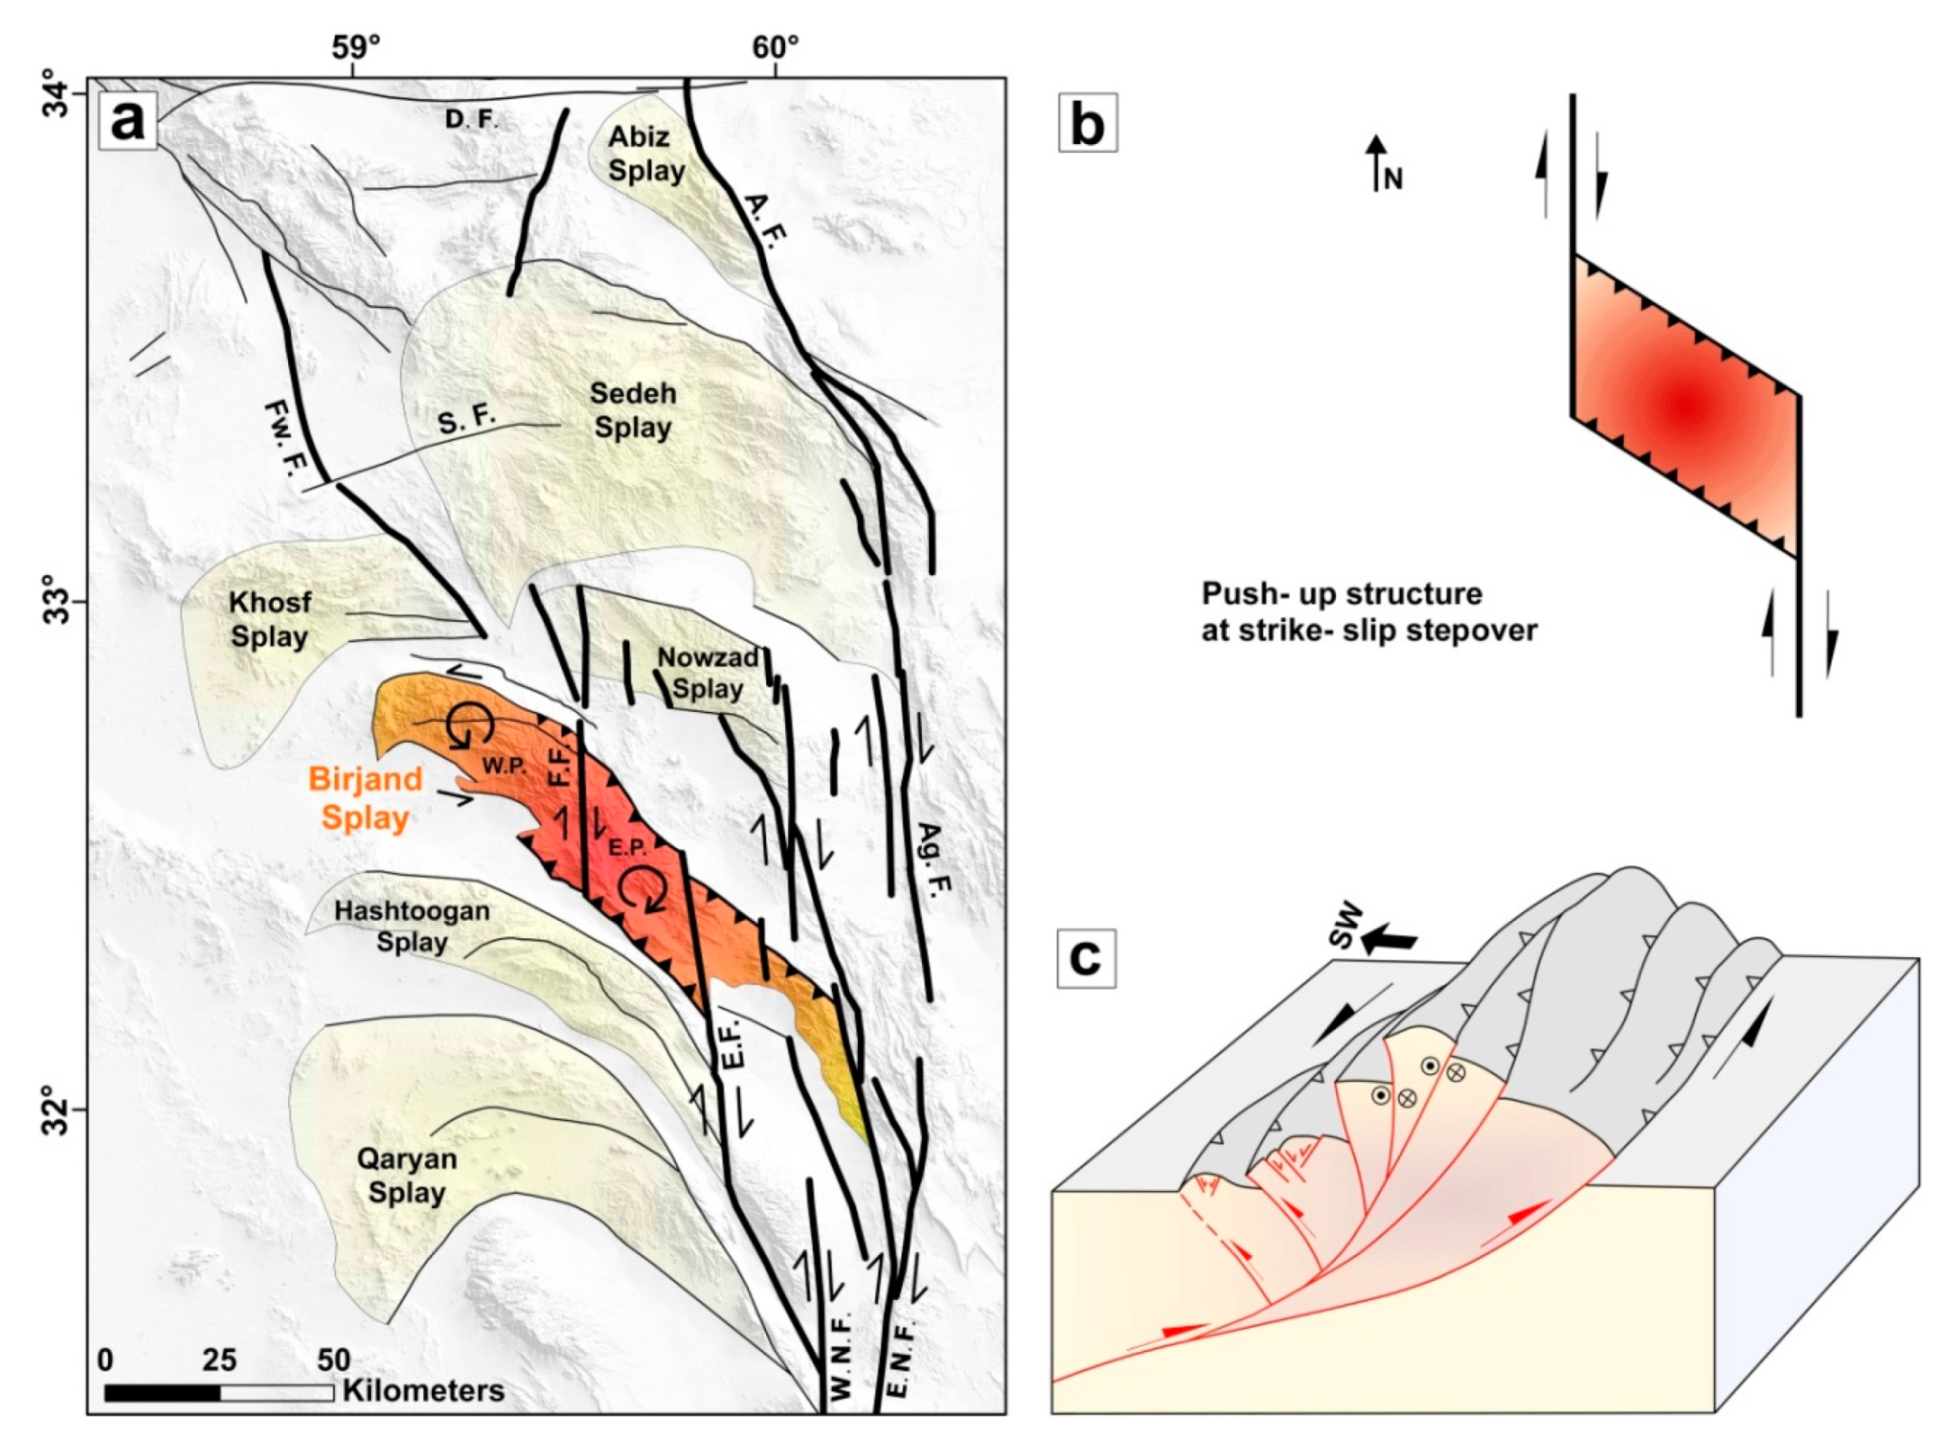
The N-S right-lateral shear between the Lut block and the Afghan block has been associated with the horsetail fault termination south of ~34°N, the E-W left-lateral Dashte-Bayaz fault (Figure 19 and Figure 20). The Qaryan, Hashtoogan, Birjand, Nowzad, Khosf, Sedeh and Abiz are the main northern splays of the Neh fault system (Figure 19a). According to our kinematic analysis, the Birjand splay could be geometrically considered as an asymmetric arc, with the Fanud fault as its axis. Geodetic data and geological evidence shows the present-day CW and CCW rotations for the eastern and western (Bagheran range) parts of this arc, namely the east and west Birjand splay, respectively (Figure 16 and Figure 17). The east Birjand splay is designated by the more NW-SE oblique reverse faults (e.g., Nasr Abad) and the N-S right-lateral faults (e.g., Esmaeil-abad and East Neh faults with an en-echelon array; Figure 19a). The geometry and kinematics of the faults indicate that the east Birjand splay is a restraining bend across the ~N-S right-lateral Fanud and Esmaeil-Abad faults (Figure 19b). This area, as a push-up structure, has been displaced in a more N-S direction by the second-order right-lateral faults. In the west Birjand splay, the E-W left-lateral faults coupled with the thrust faults accommodate the left-lateral transpression in the NW of the Birjand and the Shekarab range (Figure 1 and Figure 10). Our structural data (Section 5) suggest a prevailing left-lateral wrench-dominated transpression, illustrated by the Shekarab duplexes, pop-ups, and folds. We propose a schematic model (Figure 19) with the E-W left-lateral boundary faults, associated with the N-S reverse transition from the inner (southern) to the outer (northern) parts of the Birjand splay (Figure 19c). Many research works show similar transpressional tectonics (e.g., [68]).
Geometry and kinematics coupled with the geomorphological signatures of the Birjand splay faults, such as the South Birjand, Gol, North Birjand, and Shekarab faults in the range fronts, show fault migration. The fault migration has been recorded along many continental strike-slip faults as in the Basin and Range province of the western U.S.A. (e.g., [69]) and in the western Turkey (e.g., [70]). In this research, fault migration could be related to the fault pattern adjustments, required where vertical axis fault-block rotation accommodates the dominant deformation (e.g., [71]).

7.4. Regional Tectonics and Kinematic Implications

Inversion of fault kinematics show three successive late Cenozoic deformational stages in the East Iran orogen involving reorientation of maximum principal stress (σ1) directions from N90°E in the middle-late Miocene to N60°E in the late Pliocene and N25°E during the Plio-Quaternary, which reveal at least ~65° CCW rotation of σ1 during ~5–10 Ma [6]. The transient late Miocene to late Pliocene ENE-WSW compression could display progressive adjustment of soft to hard east Iran collision via reorientation of the stress regime [6]. The Miocene E-W compression could be related to the Lut-Afghan blocks during (East Iran orogeny) or the prevailing Chaman fault deformation further to the east (Pakistan). In contrast, the late Pliocene to present NNE-SSW compression is consistent with the present-day Arabia-Eurasia convergence, which had an important role in the organization of the strike-slip faults and their horsetail splays in eastern Iran.
Inversion of our fault slip data suggests the directions of the present σ1 direction ~N49°E, N44°E, and N51°E for the west Birjand splay (Bagheran range), east Birjand splay, and the Shekarab shear zone (Figure 15 and Figure 16). Kinematically, the N-S Fanud fault (FF) divided the NW-SE Birjand splay into the eastern and western parts. Our faults, and also the present stress and strain kinematics, illustrate a dominant reverse motion for parallel-splay faults of the east Birjand splay, and an oblique left-lateral reverse movement for the west Birjand splay faults (Figure 1d and Figure 19a). Therefore, the compressional stress regime deduced along the faults in the eastern part of the Birjand splay changes to a compressional-wrench dominated stress regime in the western part (Table 1).
We investigated the post-Neogene structural evolution of the E-W left-lateral Shekarab duplex and the NW-SE Birjand splay as two case studies at the termination of the N-S right-lateral Neh fault system. After the late Miocene, the N-S faults are reactivated as the right-lateral faults (e.g., East Neh, West Neh, and Zahedan faults; Figure 1) [6,15], which are manifested by the Plio-Quaternary right-lateral offsets of ~50–65 km, ~10 km, and ~13–20 km on the East Neh, West Neh, and Zahedan faults, respectively [72]. Synchronously, the left-lateral reverse WNW-ESE faults, as termination of the N-S faults, have been active farther in the north.
Our suggested kinematic model for the north of central and eastern Iran is provided in Figure 20. The published paleomagnetic results [73] from the Miocene of the Ala-Dagh, Binalud, and Kopeh-Dagh in northeast Iran show that the WNW-ENE faults underwent CW vertical axis rotations by the subsidiary NE-SW left-lateral faults (book-shelf structure) until ~2 Ma, which is inconsistent with the present seismicity and GPS data (Figure 20). These CW rotations confirm northward impinging of central Iran at about ~5-2 Ma, as well as oroclinal bending of northeast Iran [73]. Westward extrusion of the South Caspian Basin and western Kopeh Dagh since ~2 Ma was associated with fault kinematic reversal on the south Alborz (Shahrud fault) and north of central Iran (Doruneh fault) (Figure 20; [73]).
It seems that boundary conditions, fault slip-rate, pre-existing structures, and fault orientation and spacing relative to the convergence direction control how Arabia-Eurasia convergence are accommodated in the NE of central Iran. These parameters are important in the westward extrusion of the south Caspian basin and the west and northwest of the Lut block (e.g., [74]), as well as vertical-axis fault block rotation in the north of the East Iran orogen (Figure 20; [8]). The total fault slip-rates could show us a rough estimate of this extrusion. In fact, the N-S right-lateral shear is consumed on the left-lateral transpressional zones through the vertical axis fault block rotation in the NE of the Lut block. This leads to an N-S shortening and E-W lengthening [4], or along-strike collision lengthening [75]. The fault block rotation in central Iran could also facilitate the northward Arabian promontory impingement into Eurasia [75]. These styles of opposite senses of fault block rotation have been reported in the Aegean [76]. Similarly, N-S right-lateral shear in eastern Tibet is accommodated by the E-W left-lateral faults, manifested by CCW fault block rotation at a rate of 1–2° Myr−1 and 10–20 mmyr−1 E-W crustal shortening [77].

8. Conclusions

The northern part of the East Iran orogen is defined by the N-S right-lateral East Neh and West Neh faults, which terminate to an overlapping NW-SE left-lateral transpressional zone and ENE-WSW (E-W) left-lateral strike-slip faults. Our study reveals releasing and restraining stopovers and bending along the N-S right-lateral terminations of the Neh fault system, with several fault splays and duplexes in the evolving left-lateral transpressional zones, associated with fault migration. Because of recorded destructive earthquakes and seismic potential of the faults, post-Neogene fault migration in the NE of the Lut block requires more detailed tectonic geomorphology studies and seismic monitoring in order to mitigate the seismic hazard assessment in this area.
The NW-SE Birjand splay, as one of the northern terminations of the East Neh fault, is composed of sub-parallel fault segments with significant overlaps. The N-S right-lateral Fanud fault divides the Birjand splay into the western and eastern parts. The geodetic rotation rates reveal two distinct opposite rotations, CCW in the western and CW in the eastern Birjand splay. Faults geometry and kinematic data, seismic and fault-slip stress inversion, and GPS velocities all illustrate the presence of prevailing reverse parallel-splay faults in the eastern Birjand splay, and a dominant left-lateral and thrust faulting in the west Birjand splay. The main compressional stress regime deduced along the WNW-ESE faults in the eastern part changes to a compressional strike-slip stress regime in the west Birjand splay. These two distinct stress regimes are coherent with different structural settings of the resolved stress tensors.
According to this research, the prevalent N-S right-lateral, NW-SE oblique, and E-W left-lateral strike-slip faults control the kinematics of the northern part of the East Iran orogen, which has implications for the tectonic evolution of the opposite sense intraplate strike-slip faulting in continental collision. Our suggested kinematic model reveals that the N-S right-lateral shear in the East Iran orogen is consumed on the left-lateral transpressional zones through the vertical axis fault block rotation. This led to a N-S shortening and E-W lengthening or along-strike collision lengthening in the East Iran orogen. The fault block rotation in central Iran could also facilitate the northward Arabian promontory impingement into Eurasia. The suggested model integrates how the Arabia-Eurasia convergence is accommodated by different vertical-axis rotations of the fault blocks, which are embedded by opposite-sense fault systems in a complex tectonic collage.
The boundary conditions, fault slip-rate, pre-existing structures, and fault orientation relative to the Arabia-Eurasia convergence control westward extrusion in the west and northwest of the Lut block and vertical-axis fault block rotation in the north of eastern Iran. Determining post-Neogene fault slip-rates in the NE of Lut blocks could constrain the amount of south Caspian westward extrusion, northward motion of the central Iranian blocks, and also their associated vertical-axis rotation rates.

Author Contributions

Conceptualization, A.R., M.S. and C.B.; methodology, A.R. and M.S.; software, A.R.; validation, M.S. and C.B.; formal analysis, A.R. and M.S.; investigation, A.R., M.S. and C.B.; resources, M.S.; data curation, C.B.; writing—original draft preparation, A.R. and M.S.; writing—review and editing, C.B. All authors have read and agreed to the published version of the manuscript.

Funding

The APC was funded by MIUR-PRIN 2017, as well as support to C.B.

Data Availability Statement

The GPS data used in this paper are available in [37,39], which are openly available at the locations cited in the reference section. These datasets were derived from the following public domain resources: [IPGN; https://ipgn.ncc.gov.ir/en/ latest accessed on 28 January 2019]. The FaultKin 8.1 software [78,79] was used to display the T (extension) and P (shortening) quadrants, and also the positions of the principal-stress axes for the faults with kinematic indicators. The present-day stress directions have been determined by the inverse method of [34]. For this scope, we used the Win-Tensor program [35]. The SRTM30 (https://dwtkns.com/srtm30m latest accessed on 8 January 2020) satellite imagery in Google Earth (https://earth.google.com latest accessed on 1 July 2020), and the Bing maps aerial imagery (https://www.bing.com/maps/aerial latest accessed on 10 June 2021) were used in some figures (e.g., Figure 1, Figure 2, Figure 10, and Figure 14). The maps in this paper were produced using the GIS (Geographic Information System; https://www.esri.com latest accessed on 18 December 2013), GMT (Generic Mapping Tools; [80]), and Matlab (https://www.mathworks.com latest accessed on 1 September 2020) software/programs.

Acknowledgments

This work is the outcome of a joint research study with the International Institute of Earthquake Engineering and Seismology, Tehran (Iran); the Graduate University of Advanced Technology, Kerman (Iran); and the Department of Mathematics and Geosciences, University of Trieste, Trieste (Italy). The study is partly funded by MIUR-PRIN 2017.

Conflicts of Interest

The authors declare no conflict of interest.

References

  1. Jackson, J.; Molnar, P. Active faulting and block rotations in the Western Transverse Ranges, California. J. Geophys. Res. Earth Surf. 1990, 95, 22073–22087. [Google Scholar] [CrossRef]
  2. Molnar, P.; Tapponnier, P. Cenozoic Tectonics of Asia: Effects of a Continental Collision: Features of recent continental tectonics in Asia can be interpreted as results of the India-Eurasia collision. Science 1975, 189, 419–426. [Google Scholar] [CrossRef] [PubMed]
  3. Nur, A.; Ron, H.; Scotti, O. Kinematics and Mechanics of Tectonic Block Rotations. In Geophysical Monograph Series; Cohen, S.C., VanííEk, P., Eds.; American Geophysical Union: Washington, DC, USA, 2013; pp. 31–46. [Google Scholar] [CrossRef]
  4. Freund, R. Rotation of Strike Slip Faults in Sistan, Southeast Iran. J. Geol. 1970, 78, 188–200. [Google Scholar] [CrossRef]
  5. Tirrul, R.; Bell, I.R.; Griffis, R.J.; Camp, V.E. The Sistan suture zone of eastern Iran. Geol. Soc. Am. Bull. 1983, 94, 134. [Google Scholar] [CrossRef]
  6. Jentzer, M.; Fournier, M.; Agard, P.; Omrani, J.; Khatib, M.M.; Whitechurch, H. Neogene to Present paleostress field in Eastern Iran (Sistan belt) and implications for regional geodynamics: Paleostress Field in Eastern Iran. Tectonics 2017, 36, 321–339. [Google Scholar] [CrossRef]
  7. Bagheri, S.; Gol, S.D. The eastern iranian orocline. Earth-Sci. Rev. 2020, 210, 103322. [Google Scholar] [CrossRef]
  8. Walker, R.T.; Khatib, M.M. Active faulting in the Birjand region of NE Iran. Tectonics 2006, 25. [Google Scholar] [CrossRef]
  9. Calzolari, G.; Della Seta, M.; Rossetti, F.; Nozaem, R.; Vignaroli, G.; Cosentino, D.; Faccenna, C. Geomorphic signal of active faulting at the northern edge of Lut Block: Insights on the kinematic scenario of Central Iran: Tectonic geomorphology in central Iran. Tectonics 2015, 35, 76–102. [Google Scholar] [CrossRef]
  10. Calzolari, G.; Rossetti, F.; Della Seta, M.; Nozaem, R.; Olivetti, V.; Balestrieri, M.L.; Cosentino, D.; Faccenna, C.; Stuart, F.M.; Vignaroli, G. Spatio-temporal evolution of intraplate strike-slip faulting: The Neogene–Quaternary Kuh-e-Faghan Fault, central Iran. Geol. Soc. Am. Bull. 2015, 128, 374–396. [Google Scholar] [CrossRef]
  11. Rashidi, A. Geometric and kinematic characteristics of the Khazar and North Alborz Faults: Links to the structural evolution of the North Alborz-South Caspian boundary, Northern Iran. J. Southeast Asian Earth Sci. 2021, 213, 104755. [Google Scholar] [CrossRef]
  12. Rashidi, A.; Abbassi, M.-R.; Nilfouroushan, F.; Shafiei, S.; Derakhshani, R.; Nemati, M. Morphotectonic and earthquake data analysis of interactional faults in Sabzevaran Area, SE Iran. J. Struct. Geol. 2020, 139, 104147. [Google Scholar] [CrossRef]
  13. Molnar, P.; Dayem, K.E. Major intracontinental strike-slip faults and contrasts in lithospheric strength. Geosphere 2010, 6, 444–467. [Google Scholar] [CrossRef]
  14. Vernant, P.; Nilforoushan, F.; Hatzfeld, D.; Abbassi, M.R.; Vigny, C.; Masson, F.; Nankali, H.; Martinod, J.; Ashtiani, A.; Bayer, R.; et al. Present-day crustal deformation and plate kinematics in the Middle East constrained by GPS measurements in Iran and northern Oman. Geophys. J. Int. 2004, 157, 381–398. [Google Scholar] [CrossRef]
  15. Camp, V.; Griffis, R. Character, genesis and tectonic setting of igneous rocks in the Sistan suture zone, eastern Iran. Lithos 1982, 15, 221–239. [Google Scholar] [CrossRef]
  16. Saccani, E.; Delavari, M.; Beccaluva, L.; Amini, S. Petrological and geochemical constraints on the origin of the Nehbandan ophiolitic complex (eastern Iran): Implication for the evolution of the Sistan Ocean. Lithos 2010, 117, 209–228. [Google Scholar] [CrossRef]
  17. Zarrinkoub, M.H.; Pang, K.-N.; Chung, S.-L.; Khatib, M.M.; Mohammadi, S.S.; Chiu, H.-Y.; Lee, H.-Y. Zircon U–Pb age and geochemical constraints on the origin of the Birjand ophiolite, Sistan suture zone, eastern Iran. Lithos 2012, 154, 392–405. [Google Scholar] [CrossRef]
  18. Conrad, G.; Montigny, R.; Thuizat, R.; Westphal, M. Tertiary and quaternary geodynamics of southern Lut (Iran) as deduced from palaeomagnetic, isotopic and structural data. Tectonophysics 1981, 75, T11–T17. [Google Scholar] [CrossRef]
  19. Shafiei, B.; Haschke, M.; Shahabpour, J. Recycling of orogenic arc crust triggers porphyry Cu mineralization in Kerman Cenozoic arc rocks, southeastern Iran. Miner. Deposita 2008, 44, 265–283. [Google Scholar] [CrossRef]
  20. Walker, R.; Jackson, J. Offset and evolution of the Gowk fault, S.E. Iran: A major intra-continental strike-slip system. J. Struct. Geol. 2002, 24, 1677–1698. [Google Scholar] [CrossRef]
  21. Wellman, H.W. Active wrench faults of Iran, Afghanistan and Pakistan. Geol. Rundsch. 1966, 55, 716–735. [Google Scholar] [CrossRef]
  22. Berberian, M.; A Jackson, J.; Fielding, E.; E Parsons, B.; Priestley, K.; Qorashi, M.; Talebian, M.; Walker, R.; Wright, T.J.; Baker, C. The 1998 March 14 Fandoqa earthquake (Mw6.6) in Kerman province, southeast Iran: Re-rupture of the 1981 Sirch earthquake fault, triggering of slip on adjacent thrusts and the active tectonics of the Gowk fault zone. Geophys. J. Int. 2001, 146, 371–398. [Google Scholar] [CrossRef]
  23. Berberian, M.; Jackson, J.A.; Qorashi, M.; Talebian, M.; Khatib, M.; Priestley, K. The 1994 Sefidabeh earthquakes in eastern Iran: Blind thrusting and bedding-plane slip on a growing anticline, and active tectonics of the Sistan suture zone. Geophys. J. Int. 2000, 142, 283–299. [Google Scholar] [CrossRef]
  24. Berberian, M.; Jackson, J.A.; Qorashi, M.; Khatib, M.M.; Priestley, K.; Talebian, M.; Ghafuri-Ashtiani, M. The 1997 May 10 Zirkuh (Qa’enat) earthquake (Mw 7.2): Faulting along the Sistan suture zone of eastern Iran. Geophys. J. Int. 1999, 136, 671–694. [Google Scholar] [CrossRef]
  25. Boshrabadi, A.R.; Khatib, M.M.; Raeesi, M.; Mousavi, S.M.; Djamour, Y. Geometric-kinematic characteristics of the main faults in the W-SW of the Lut Block (SE Iran). J. Afr. Earth Sci. 2018, 139, 440–462. [Google Scholar] [CrossRef]
  26. Ambraseys, N.N.; Tchalenko, J.S. The Dasht-e Bayāz (Iran) earthquake of August 31, 1968: A field report. Bull. Seism. Soc. Am. 1969, 59, 1751–1792. [Google Scholar] [CrossRef]
  27. Berberian, M.; Yeats, R.S. Patterns of historical rupture in the Iranian Plateau. Bull. Seism. Soc. Am. 1999, 89, 120–139. [Google Scholar] [CrossRef]
  28. Walker, R.; Jackson, J. Active tectonics and late Cenozoic strain distribution in central and eastern Iran: Tectonics of central and eastern Iran. Tectonics 2004, 23. [Google Scholar] [CrossRef]
  29. Meyer, B.; Le Dortz, K. Strike-slip kinematics in Central and Eastern Iran: Estimating fault slip-rates averaged over the Holocene: Holocene strike-slip kinematics in Iran. Tectonics 2007, 26. [Google Scholar] [CrossRef]
  30. Regard, V.; Bellier, O.; Thomas, J.-C.; Bourlès, D.; Bonnet, S.; Abbassi, M.R.; Braucher, R.; Mercier, J.; Shabanian, E.; Soleymani, S.; et al. Cumulative right-lateral fault slip rate across the Zagros-Makran transfer zone: Role of the Minab-Zendan fault system in accommodating Arabia-Eurasia convergence in southeast Iran. Geophys. J. Int. 2005, 162, 177–203. [Google Scholar] [CrossRef]
  31. Baker, C. The Active Seismicity and Tectonics of Iran. Ph.D. Thesis, University of Cambridge, Cambridge, UK, 1993. [Google Scholar]
  32. Jackson, J. Living with earthquakes: Know your faults. J. Earthq. Eng. 2001, 5, 5–123. [Google Scholar] [CrossRef]
  33. Ezati, M.; Gholami, E.; Mousavi, S.M.; Rashidi, A.; Derakhshani, R. Active Deformation Patterns in the Northern Birjand Mountains of the Sistan Suture Zone, Iran. Appl. Sci. 2022, 12, 6625. [Google Scholar] [CrossRef]
  34. Angelier, J.; Tarantola, A.; Valette, B.; Manoussis, S. Inversion of field data in fault tectonics to obtain the regional stress? I. Single phase fault populations: A new method of computing the stress tensor. Geophys. J. Int. 1982, 69, 607–621. [Google Scholar] [CrossRef]
  35. Delvaux, D.; Sperner, B. New aspects of tectonic stress inversion with reference to the TENSOR program. Geol. Soc. London Spéc. Publ. 2003, 212, 75–100. [Google Scholar] [CrossRef]
  36. Rashidi, A.; Derakhshani, R. Strain and Moment Rates from GPS and Seismological Data in Northern Iran: Implications for an Evaluation of Stress Trajectories and Probabilistic Fault Rupture Hazard. Remote Sens. 2022, 14, 2219. [Google Scholar] [CrossRef]
  37. Khorrami, F.; Vernant, P.; Masson, F.; Nilfouroushan, F.; Mousavi, Z.; Nankali, H.; Saadat, S.A.; Walpersdorf, A.; Hosseini, S.; Tavakoli, P.; et al. An up-to-date crustal deformation map of Iran using integrated campaign-mode and permanent GPS velocities. Geophys. J. Int. 2019, 217, 832–843. [Google Scholar] [CrossRef]
  38. Malvern, L.E. Introduction to the Mechanics of a Continuous Medium; Prentice-Hall: Englewood Cliffs, NJ, USA, 1969. [Google Scholar]
  39. Raeesi, M.; Zarifi, Z.; Nilfouroushan, F.; Boroujeni, S.A.; Tiampo, K. Quantitative Analysis of Seismicity in Iran. Pure Appl. Geophys. 2016, 174, 793–833. [Google Scholar] [CrossRef]
  40. Deng, Q.; Wu, D.; Zhang, P.; Chen, S. Structure and deformational character of strike-slip fault zones. Pure Appl. Geophys. 1986, 124, 203–223. [Google Scholar] [CrossRef]
  41. Bartel, E.M.; Neubauer, F.; Genser, J.; Heberer, B. States of paleostress north and south of the Periadriatic fault: Comparison of the Drau Range and the Friuli Southalpine wedge. Tectonophysics 2014, 637, 305–327. [Google Scholar] [CrossRef]
  42. Ashidi, A.; Kianimehr, H.; Shafieibafti, S.; Mehrabi, A.; Derakhshani, R. Active faults in the west of the Lut block (central Iran). Геoфизисслед 2021, 22, 70–84. [Google Scholar] [CrossRef]
  43. Woodcock, N.H. Kinematics of strike-slip faulting, builth Inlier, mid-Wales. J. Struct. Geol. 1987, 9, 353–363. [Google Scholar] [CrossRef]
  44. Eftekhar Nezhad, J.; Stocklin, J. Geological Map of Iran sheet K8 (Birjand), scale 1:250,000. Geological Survey of Iran: Tehran, Iran, 1992. [Google Scholar]
  45. Al-Kindi, M. Understanding the Relationship between Large-Scale Fold Structures and Small-Scale Fracture Patterns: A Case Study from the Oman Mountains. Geosciences 2020, 10, 490. [Google Scholar] [CrossRef]
  46. Chauvet, A. Structural Control of Ore Deposits: The Role of Pre-Existing Structures on the Formation of Mineralised Vein Systems. Minerals 2019, 9, 56. [Google Scholar] [CrossRef]
  47. Fischer, M.P.; Jackson, P.B. Stratigraphic controls on eformation patterns in fault-related folds: A detachment fold example from the Sierra Madre Oriental, northeast Mexico. J. Struct. Geol. 1999, 21, 613–633. [Google Scholar] [CrossRef]
  48. Johnston, J.D. Three- dimensional geometries of veins and their relationship to folds: Examples from the Carboniferous of eastern Ireland. Irish J. Earth Sci. 1993, 12, 47–63. [Google Scholar]
  49. Doblas, M. Slickenside kinematic indicators. Tectonophysics 1998, 295, 187–197. [Google Scholar] [CrossRef]
  50. Goscombe, B.D.; Passchier, C.W.; Hand, M. Boudinage classification: End-member boudin types and modified boudin structures. J. Struct. Geol. 2004, 26, 739–763. [Google Scholar] [CrossRef]
  51. Alsop, G.; Strachan, R.; Holdsworth, R.; Burns, I. Geometry of folded and boudinaged pegmatite veins emplaced within a strike-slip shear zone: A case study from the Caledonian orogen, northern Scotland. J. Struct. Geol. 2020, 142, 104233. [Google Scholar] [CrossRef]
  52. Savidge, E.; Nissen, E.; Nemati, M.; Karasözen, E.; Hollingsworth, J.; Talebian, M.; Bergman, E.; Ghods, A.; Ghorashi, M.; Kosari, E.; et al. The December 2017 Hojedk (Iran) earthquake triplet—sequential rupture of shallow reverse faults in a strike-slip restraining bend. Geophys. J. Int. 2019, 217, 909–925. [Google Scholar] [CrossRef]
  53. Dahlstrom, C.D.A. Structural Geology in Eastern Margin of Canadian Rocky Mountains: ABSTRACT. AAPG Bull. 1970, 54. [Google Scholar] [CrossRef]
  54. Butler, R.W. The terminology of structures in thrust belts. J. Struct. Geol. 1982, 4, 239–245. [Google Scholar] [CrossRef]
  55. Elliott, D. The Strength of Rocks in Thrust Sheets. Eos 1981, 62, 397. [Google Scholar]
  56. Boyer, D.E.S.E. Thrust Systems. AAPG Bull. 1982, 66, 1196–1230. [Google Scholar] [CrossRef]
  57. Boyer, S.E.; Mitra, G. Fold duplexes. J. Struct. Geol. 2018, 125, 202–212. [Google Scholar] [CrossRef]
  58. Mitra, G.; E Boyer, S. Energy balance and deformation mechanisms of duplexes. J. Struct. Geol. 1986, 8, 291–304. [Google Scholar] [CrossRef]
  59. Rashidi, A.; Kianimehr, H.; Yamini-Fard, F.; Tatar, M.; Zafarani, H. Present Stress Map and Deformation Distribution in the NE Lut Block, Eastern Iran: Insights from Seismic and Geodetic Strain and Moment Rates. Pure Appl. Geophys. 2022, 179, 1887–1917. [Google Scholar] [CrossRef]
  60. Sheikholeslami, M.R.; Mobayen, P.; Javadi, H.R.; Ghassemi, M.R. Stress field and tectonic regime of Central Iran from inversion of the earthquake focal mechanisms. Tectonophysics 2021, 813, 228931. [Google Scholar] [CrossRef]
  61. Carreras, J.; Druguet, E.; Griera, A. Shear zone-related folds. J. Struct. Geol. 2005, 27, 1229–1251. [Google Scholar] [CrossRef]
  62. Llorens, M.-G.; Bons, P.D.; Griera, A.; Gomez-Rivas, E.; Evans, L.A. Single layer folding in simple shear. J. Struct. Geol. 2013, 50, 209–220. [Google Scholar] [CrossRef]
  63. Woodcock, N.H.; Rickards, B. Transpressive duplex and flower structure: Dent Fault System, NW England. J. Struct. Geol. 2003, 25, 1981–1992. [Google Scholar] [CrossRef]
  64. Renda, P.; Tavarnelli, E.; Tramutoli, M.; Gueguen, E. Neogene deformation of Northern Sicily, and their implications for the geodynamics of the Southern Tyrrhenian sea margin. Mem. Della Soc. Geol. Italiana 2000, 55, 53–59. [Google Scholar]
  65. Jackson, J.; Priestley, K.; Allen, M.; Berberian, M. Active tectonics of the South Caspian Basin. Geophys. J. Int. 2002, 148, 214–245. [Google Scholar] [CrossRef]
  66. Mattei, M.; Cifelli, F.; Muttoni, G.; Zanchi, A.; Berra, F.; Mossavvari, F.; Eshraghi, S.A. Neogene block rotation in central Iran: Evidence from paleomagnetic data. GSA Bull. 2012, 124, 943–956. [Google Scholar] [CrossRef]
  67. Hatzfeld, D.; Molnar, P. Comparisons of the kinematics and deep structures of the Zagros and Himalaya and of the Iranian and Tibetan plateaus and geodynamic implications. Rev. Geophys. 2010, 48. [Google Scholar] [CrossRef]
  68. Dubey, A.K. Simultaneous development of noncylindrical folds, frontal ramps, and transfer faults in a compressional regime: Experimental investigations of Himalayan Examples. Tectonics 1997, 16, 336–346. [Google Scholar] [CrossRef]
  69. Wernicke, B.; Axen, G.J. On the role of isostasy in the evolution of normal fault systems. Geology 1988, 16, 848. [Google Scholar] [CrossRef]
  70. Dart, C.; Cohen, H.A.; Akyüz, H.S.; Barka, A. Basinward migration of rift-border faults: Implications for facies distributions and preservation potential. Geology 1995, 23, 69. [Google Scholar] [CrossRef]
  71. Jackson, J. Active tectonics of the Aegean region. Annu. Rev. Earth Planet. Sci. 1994, 22, 239–271. [Google Scholar] [CrossRef]
  72. Walker, R.T. A remote sensing study of active folding and faulting in southern Kerman province, S.E. Iran. J. Struct. Geol. 2006, 28, 654–668. [Google Scholar] [CrossRef]
  73. Mattei, M.; Cifelli, F.; Alimohammadian, H.; Rashid, H.; Winkler, A.; Sagnotti, L. Oroclinal bending in the Alborz Mountains (Northern Iran): New constraints on the age of South Caspian subduction and extrusion tectonics. Gondwana Res. 2017, 42, 13–28. [Google Scholar] [CrossRef]
  74. Nozaem, R.; Mohajjel, M.; Rossetti, F.; Della Seta, M.; Vignaroli, G.; Yassaghi, A.; Salvini, F.; Eliassi, M. Post-Neogene right-lateral strike–slip tectonics at the north-western edge of the Lut Block (Kuh-e–Sarhangi Fault), Central Iran. Tectonophysics 2013, 589, 220–233. [Google Scholar] [CrossRef]
  75. Allen, M.B.; Kheirkhah, M.; Emami, M.H.; Jones, S. Right-lateral shear across Iran and kinematic change in the Arabia-Eurasia collision zone: Right-lateral shear across Iran. Geophys. J. Int. 2010, 184, 555–574. [Google Scholar] [CrossRef]
  76. Taymaz, T.; Jackson, J.; McKenzie, D. Active tectonics of the north and central Aegean Sea. Geophys. J. Int. 1991, 106, 433–490. [Google Scholar] [CrossRef]
  77. Molnar, P.; England, P. Late Cenozoic uplift of mountain ranges and global climate change: Chicken or egg? Nature 1990, 346, 29–34. [Google Scholar] [CrossRef]
  78. Allmendinger, R.W.; Cardozo, N.; Fisher, D.M. Structural Geology Algorithms: Vectors and Tensors; Cambridge University Press: Cambridge, UK, 2011. [Google Scholar] [CrossRef]
  79. Marrett, R.; Allmendinger, R.W. Kinematic analysis of fault-slip data. J. Struct. Geol. 1990, 12, 973–986. [Google Scholar] [CrossRef]
  80. Wessel, P.; Smith, W.H.F. New, improved version of generic mapping tools released. Eos Trans. Am. Geophys. Union 1998, 79, 579. [Google Scholar] [CrossRef]
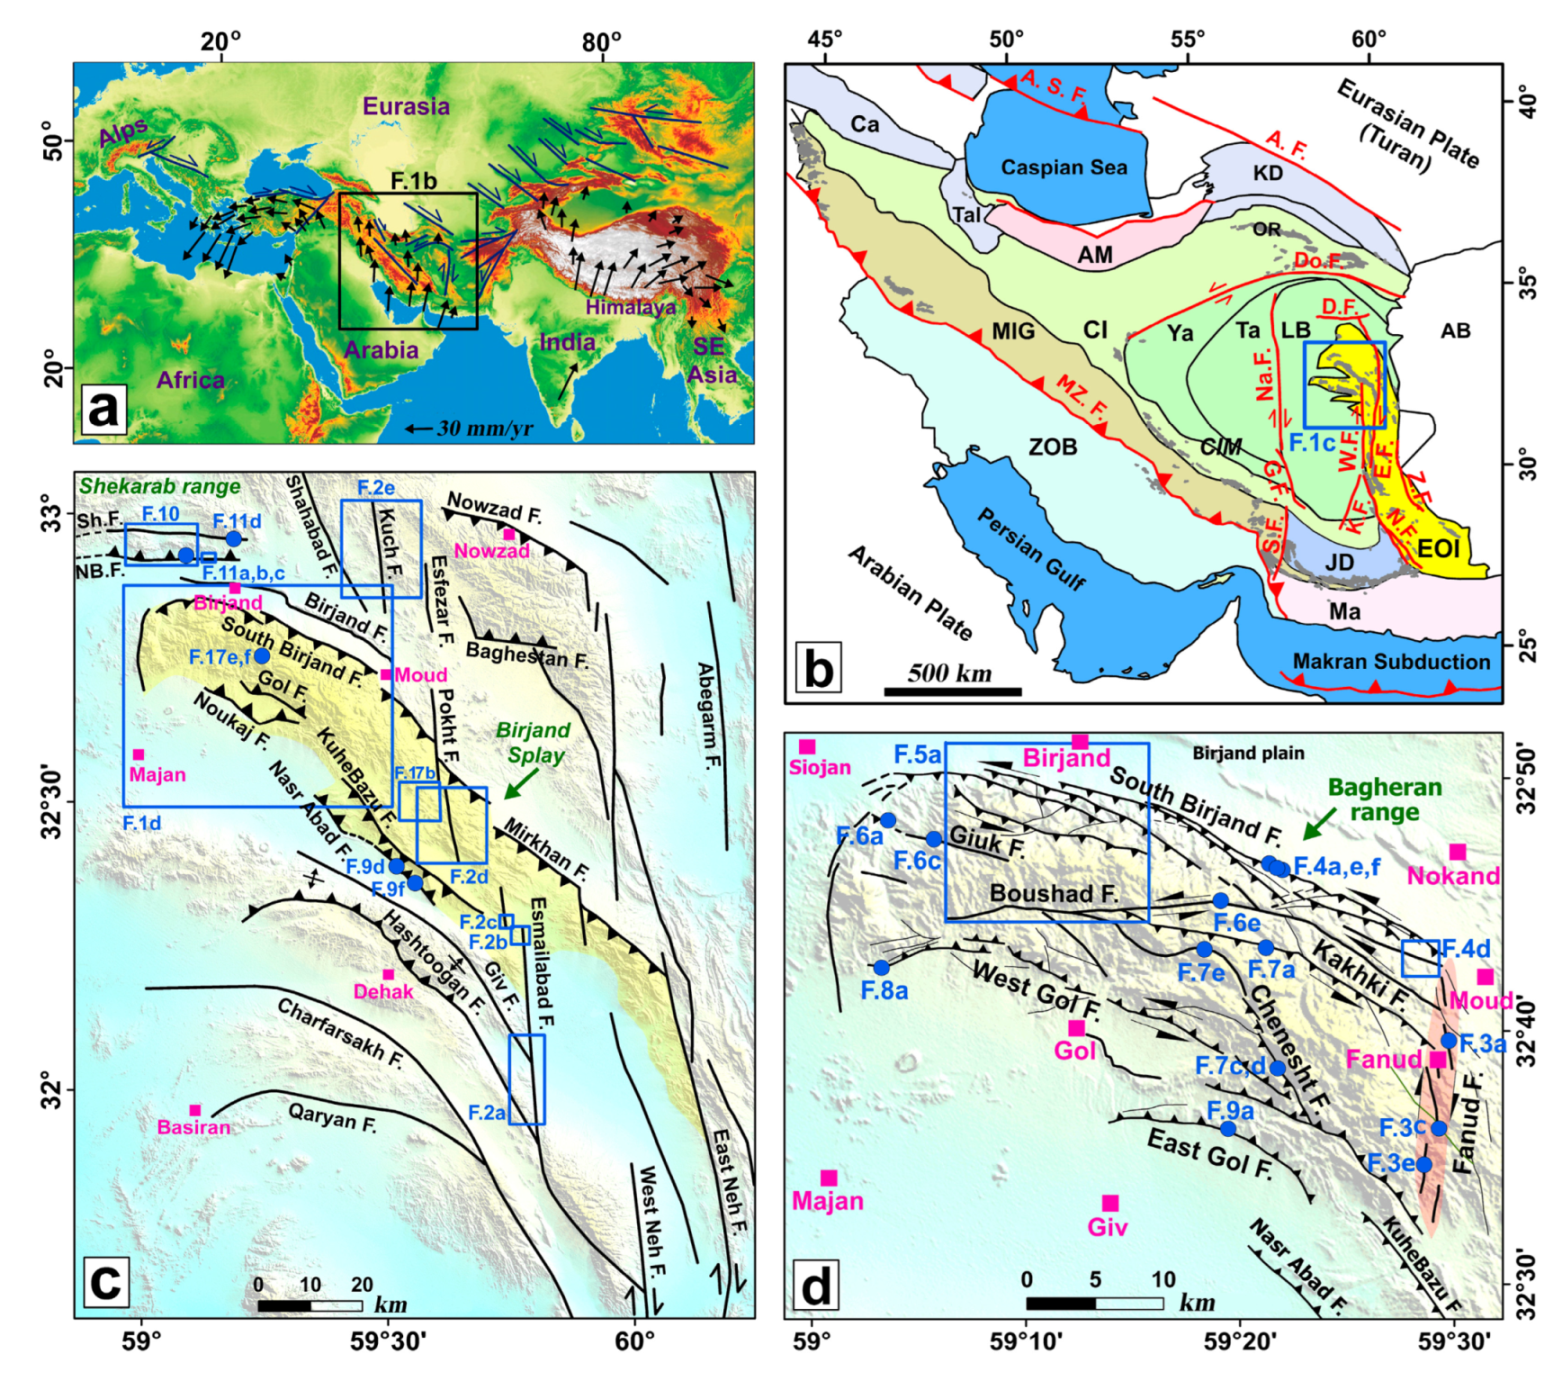
Figure 1. (a) The SRTM30 map of the Alpine-Himalaya orogenic system generated from continental collision of Eurasian plate with partnership of the Indian, Arabian, and African plates. The velocities vectors are relative to the Eurasian reference frame (determined by [14]). (b) The regional structure of the Eurasia–Arabia collision and the location of the Eastern Iran orogen. Abbreviations: Ca = Caucasus; Tal = Talesh; AM = Alborz Mountains; KD = Kopet Dagh; OR = ophiolitic rocks; MIG = zone of metamorphic rocks and intruded granitoides; CIM = Central Iranian Microcontinent; Cl = Central Iran; Ya = Yazd; Ta = Tabas; LB = Lut block; AB = Afghan block; ZOB = Zagros orogenic belt; JD = Jazmurian depression; Ma = Makran; EOI = Eastern Iran orogen; A.S.F. = Apsheron Sill fault; A.F. = Ashkabad fault; Do. F = Doruneh fault; D.F. = Dasht-e Bayaz fault; Na.F. = Nayband fault; G.F. = Gowk fault; S.F. = Sabzevaran fault; W.F. = West Neh fault; E.F. = East Neh fault; K.F. = Kahourak fault; N.F. = Nosratabad fault; Z.F. = Zahedan fault. (c) General structural map of the main north splays of the Nehbandan fault system. Sh. F. = Shekarab fault; NB. F. = North Birjand fault. (d) Detailed map of the faults in the western part of the Birjand splay (Bagheran range). Positions of some of following figures are shown in subplots (c,d).
Remotesensing 14 04048 g001
Figure 2. The Bing maps aerial imagery of the N-S right-lateral strike-slip faults in the study area. (a) The Esmaeilabad fault trace with a restraining left-bend marked by small arrows; (b,c) ~1.5 km right-lateral dragging and offsets of the Cretaceous peridotites along the Esmaeilabad fault; (d) ~800 m right-lateral dragging of the upper Cretaceous peridotites along the southern segment of the Pokht fault; (e) ~2 km right-lateral offsets of the Paleocene-Pliocene rock units along the Kuch fault. The long arrows show the relative shear movement across the faults.
Remotesensing 14 04048 g002
Figure 3. The Fanud fault with striations on its three segments (see the locations on Figure 1d). (a) Fault outcrops in the Cretaceous flysch with an attitude of N00°S, 80°W. (b) Close-up view of the slicken lines on the fault plane (182°/10°). (c) Fault trace in the Pleistocene terraces and gravel fans with attitude of N00°S, 85°W. (d) Close-up view (to the west) of the slicken lines on the fault plane (182°/20°). (e) Fault plane in the upper Cretaceous calc-schists with attitude of N20°E, 60°NW. (f) Close-up view of the slicken lines (202°/04°).
Remotesensing 14 04048 g003
Figure 4. Structural evidence of the eastern parts of the South Birjand fault (see locations on Figure 1d). (a) The fault traces between the Paleocene flysch deposits and Quaternary gravel fans. (b) Close-up view of the fault plane with mean attitude of N70°W, 70°SW and its slicken lines (277°/32°). (c) The youngest branches of the fault within the Quaternary deposits. (d) ~1 km left-lateral offset of the upper Cretaceous rock units along the southern branch of the fault. (e) The fault among the Paleocene flysch deposits that have displaced vertically rock blocks and minor fractures. (f) The sigmoidal veins indicate a nearly horizontal thrust shearing. (g,h) Close-up view of ~1 m reverse offsets along the fault plane.
Remotesensing 14 04048 g004
Figure 5. Structural evidence of the western parts of the South Birjand fault (see the locations on Figure 1d). (a) The four sub-parallel segments of the fault. (b) Fault segments separate different rock units: Qt = Quaternary sediments; Pes = Paleocene flysch; Pd = upper Cretaceous Peridotite; KuSh = upper Cretaceous flysch. (c) Outcrop of the fault between the Quaternary alluvial deposits and Cretaceous flysch. (d) Close-up view of the fault plane (N70°W, 60°SW) and its youngest striation (S3: 285°/10°). (e) Outcrop of the southern segment of the fault within the spilitic basalts. (f) Close-up view of the fault plane (N60°W, 85°SW) and its striation (300°/05°).
Remotesensing 14 04048 g005
Figure 6. (a) Outcrop of the western segment of the Giuk fault. (b) Close-up view of the fault plane (N75°W, 80°SW) and its slicken line (285°/00°). (c) The boudins of peridotite in the middle part of the Giuk fault. (d) Close-up view of the boudin structure. (e) Outcrop of the Boushad fault plane (N70°W, 70°SW). (f) Close-up view of the fault striation (285°/14°).
Remotesensing 14 04048 g006
Figure 7. Structural evidence of the Kakhki and Chenesht faults. (a,b) The Kakhki fault plane (N90°W, 60°S) and its slicken line (260°/17°). (c,d) Reverse offsets of the rock units by the eastern segment of the Chenesht fault. (e,f) The fault planes of the western segments of the Chenesht fault (N90°E, 55°S) and their slicken line (270°/00°).
Remotesensing 14 04048 g007
Figure 8. The field images of the west Gol fault and the normal faults within the Bagheran range. (a) Traces of the west Gol fault and a normal fault in the southern front of the Bagheran range. (b) Close-up view of the west Gol fault plane (N90°E, 70°N; 068°/46°). (c) Close-up view of the normal fault plane (N40°E, 50°NW; 310°/50°) in the hanging-wall of the Gol fault. (d) ~5 m normal offset in the northern front of the Bagheran range (see the location on the Figure 5a).
Remotesensing 14 04048 g008
Figure 9. Field images of the normal faults, and the Nasrabad fault in the southern front of the Bagheran mountain. (a) The normal faulting within the hanging-wall anticline related to the east Gol fault. (b,c) Close-up view of the two normal faults with the mean attitudes of N80°W, 75°SW and N75°W, 60°SW. (d) Trace of the Nasrabad fault among the Neogene units and Quaternary deposits. (e,f) Close-up view of the Nasrabad faults with mean attitudes of N65°W, 35°NE and N30°W, 40°NE, which show striations of 025°/35° and 030°/40°, respectively (see locations on Figure 1c,d).
Remotesensing 14 04048 g009
Figure 10. (a) Google Earth image and (b) geologic map of the Shekarab transpressional zone where the faults form a duplex structure between the two major North Birjand (N.B.F.) and Shekarab (Sh.F.) faults. H and R are the horses and ramps of the duplex, respectively. For details, refer to the text.
Remotesensing 14 04048 g010
Figure 11. (a) The NBF with attitude of ~N90°E, 65°N. (b,c) Google Earth image of the stream deflection and field image of the fault-propagation folds along of the North Birjand fault. (d) The trace of the Shekarab fault in the eastern part of its length. (e,f) Close-up views of the Shekarab fault (N90°E, 75°N; 070°/52°- N90°E, 80°N; 090°/00°) among the Eocene volcanic rocks.
Remotesensing 14 04048 g011
Figure 12. Field images of the western, middle, and eastern parts of the floor fault of the duplex in the Shekarab shear zone. (a,b) Trace of the western part of the floor fault between the Eocene and Neogene rock units with attitude of N60°W, 55°NW. (c,d) The middle part of the floor fault (N90°E, 85°N; 088°/20°). (e) The floor fault scarp and (f) fault plane (N90°E, 85°N; 090°/10°) in the eastern part of the duplex. The beach ball diagrams show the left-lateral with reverse motion of the faults.
Remotesensing 14 04048 g012
Figure 13. Field images of the roof faults (a,b) and ramps (cf) of the duplex, and also the antithetic fault (g,h) in the Shekarab shear zone. (a) The left-lateral displacement of the rock units along the roof fault. (b) The repetition of the rock units by the roof fault. (c) The reversed rock units of H2 on the H1. (d) ~350 m left-lateral offset of the rock units along the ramp (2). (e,f) The surface trace and close-up view of the R3 (N65°W, 80°NE; 110°/25°). (g,h) The surface trace and close-up view of the antithetic fault (N30°E, 75°NW; 218°/29°).
Remotesensing 14 04048 g013
Figure 14. Satellite images (from Google Earth) of the folds in the Shekarab transpressional zone (see the locations on Figure 10a). (a) Sequences of anticlines and synclines with different axial traces. (b) Shear folds between the floor fault (Floor F.) and a segment of the North Birjand fault (N.B.F.). (c) The displacement of the rock units along the R2 and associate shear fold axial trace. (d) The boudinaged folds and counter-clockwise rotation of the boudins.
Remotesensing 14 04048 g014
Figure 15. Stress inversion results of the fault slip data implemented by the Win-Tensor program for the western Birjand splay (a), eastern Birjand splay (b), Shekarab mountains (c), and the entire study area (d).
Remotesensing 14 04048 g015
Figure 16. The post-Neogene stress and strain map of the north part of the East Iran orogen (EIO). The present-day stress and strain directions are from the stress inversion of the fault data and geodetic data, respectively. The paleo-stress data are based on [6], and the presented stress inversions of the focal mechanism (FMSI) are from [60]. The geodetic rotation rates and their sense within each triangle are calculated from the geodetic data.
Remotesensing 14 04048 g016
Figure 17. Evidence of the CW rotations of the rock units within the N-S right-lateral shear zone (a,b), and CCW rotations within the E-W Shekarab transpressional zone (c,d) and the E-W Bagheran mountains (e,f). (a) The rotated rock units within the N-S right-lateral Zahedan fault. (b) The CW rotation of the rock units within the eastern part of the Birjand splay. (c) The rotation of the rock units in the anticline core. (d) The boudined rocks pieces which show the left-lateral shear sense and CCW rotation. (e) The rotated rock units within the Bagheran mountain. (f) The porphyroclasts show CCW rotation within a left-lateral shear zone.
Remotesensing 14 04048 g017
Figure 18. The proposed structural model for the duplex and pop-up structures within the Shekarab transpressional zone. (a) Formation of the shear folds with the NW-SE axes within the shear zone. (b) Displacement of the folded units along the fold axes (as the synthetic faults) and along the floor and roof faults. H and R with numbers are the horse and ramp of the duplex, respectively. (c) Formation of the pop-up structure on the hanging-walls of the ramp 1 and antithetic fault (An. F).
Remotesensing 14 04048 g018
Figure 19. The proposed tectonic model for the north of the East Iran orogen. (a) The northern splays of the N-S right-lateral fault terminations of the Neh fault system. (b) The east Birjand splay (EBS) as a push-up structure in the restraining bend of the Esmaeilabad fault (EF) and the Fanud fault (FF). (c) A schematic model for the west Birjand splay (WBS), which shows the E-W left-lateral faulting with the N-S reverse transition. Abbreviations: D. F.= Dasht-e Bayaz fault; A. F. = Abiz fault; S. F. = Sedeh fault; Fw. F. = Ferdows fault; Ag. F. = Abegarm fault; E. N. F. = East Neh fault; W. N. F. = West Neh fault; STZ = Shekarab transpressional zone.
Remotesensing 14 04048 g019
Figure 20. The suggested kinematic model for the north of central and eastern Iran. Details in the text. Abbreviations: EAF = Eshgh-Abad fault; DF = Doruneh fault; JT = Jangal fault; DBF = Dasht-e Bayaz fault; FT = Ferdows thrust; NF = Nowzad fault; GF = Give fault; ENF = East Neh fault; KF = Kalmard fault; NAF = Nayband fault; KBF = Kuhbanan fault; AF = Anar fault; NDF = Naein-Dehshir fault; SCB = South Caspian Basin; KD = Kopeh-Dagh zone; Bi = Binalud zone; AD = Ala-Dagh zone; Al = Alborz zone; Cl = central Iran zone; Ya = Yazd block; Tabas block; LB = Lut block; AB = Afghan block; BS = Birjand splay.
Remotesensing 14 04048 g020
Table 1. The GPS (Global Positioning System) stations in the area, their locations, velocities (Evel, Nvel in mm/yr), and their root mean square (SigVe and SigVn) uncertainties with respect to the Eurasia-fixed frame in east and north direction. RA = stands for reference [39]; IPGN = Iranian Permanent GNSS Network.
SiteLong.Lat.Evel (mm/yr)Nvel (mm/yr)SigVeSigVnCorrelationReferences
ABGR58.319032.48401.467.991.581.580.002RA
BIJD59.255332.90020.906.990.130.130.012IPGN
HJBD60.009833.60390.622.240.230.270.007IPGN
NOGH59.937032.98801.545.541.011.010.004RA
QAE259.188033.6630−0.595.330.750.720.006IPGN
SARB59.955032.57801.755.831.181.190.004RA
TOTI58.532033.0190−0.158.650.800.780.006RA
NEBA60.04731.5731.346.231.31.30.004RA
Table 2. The azimuth (az) and plunge (pl) of the main principal stress axes, computed from the fault slip data (σ1, σ2, σ3) for the study area. Senses IS, ID, IX are inverse sinistral, inverse dextral, and pure reverse dip-slip, respectively.
Fault PlaneSlip LineSlipLongitude (°E)Latitude (°N)Stress
Regime Index (R′)
Stress
Regime
σ1
(az/pl)
σ2
(az/pl)
σ3
(az/pl)
Area
DipDip Dir.PlungeAzim.Sense
8027010182ID59.499°32.663°1.62 ± 0.16Strike-slipcompressive049°/04°296°/80°140°/09°Western Birjand splay (Bagheran mountains)
8527020182ID59.490°32.608°
6029004202ID59.479°32.582°
7020032277IS59.346°32.785°
6020010285IS59.110°32.845°
8521005300IS59.177°32.807°
8019500285IS59.062°32.814°
7020014285IS59.305°32.755°
6018017260IS59.362°32.725°
5518000270IS59.311°32.725°
7036046068IS59.063°32.718°
3502535025IX59.548°32.365°2.56 ± 0.3Compressional224°/05°315°/09°107°/79°Eastern Birjand splay
4006040060IX59.565°32.355°
30452955IS59.558°32.360°
6024060240IX59.497°32.481°
55205340IS59.447°32.434°
7536052070IS59.212°32.950°1.64 ± 0.54Strike-slip
compressive
051°/04°316°/53°144°/37°Shekarab Mountains
8036000090IS59.212°32.949°
8536020088IS59.061°32.932°
8536010090IS59.091°32.938°
8002525110IS59.082°32.940°
7530029218ID59.091°32.943°
Table 3. The values and azimuths of the strain axes based on the geodetic strain rate.
TrianglesMax Horizontal
Extension (e1H) (Nano-Strain/yr)
Azimuth of e1H (Degrees)Min Horizontal
Extension (e2H) (Nano-Strain/yr)
Azimuth of e2H (Degrees)
14.2118°−7.628°
220.9136°−11.846°
340.1139°−12.149°
423.6116°−33.326°
530.5118°−39.328°
615.9103°−50.413°
717.2117°−14.227°
Table 4. The value and sense of the geodetic rotation rate in each triangle.
TriangleRotation (Degrees/yr)Rotation Sense
15.00 × 10⁻⁷clockwise
21.02 × 10⁻⁷counter-clockwise
32.57 × 10⁻⁷counter-clockwise
43.43 × 10⁻⁷clockwise
57.35 × 10⁻⁷clockwise
63.33 × 10⁻⁹clockwise
75.02 × 10⁻⁷clockwise
Publisher’s Note: MDPI stays neutral with regard to jurisdictional claims in published maps and institutional affiliations.