
Revealing Annual Crop Type Distribution and Spatiotemporal Changes in Northeast China Based on Google Earth Engine


Abstract
:
1. Introduction
2. Materials
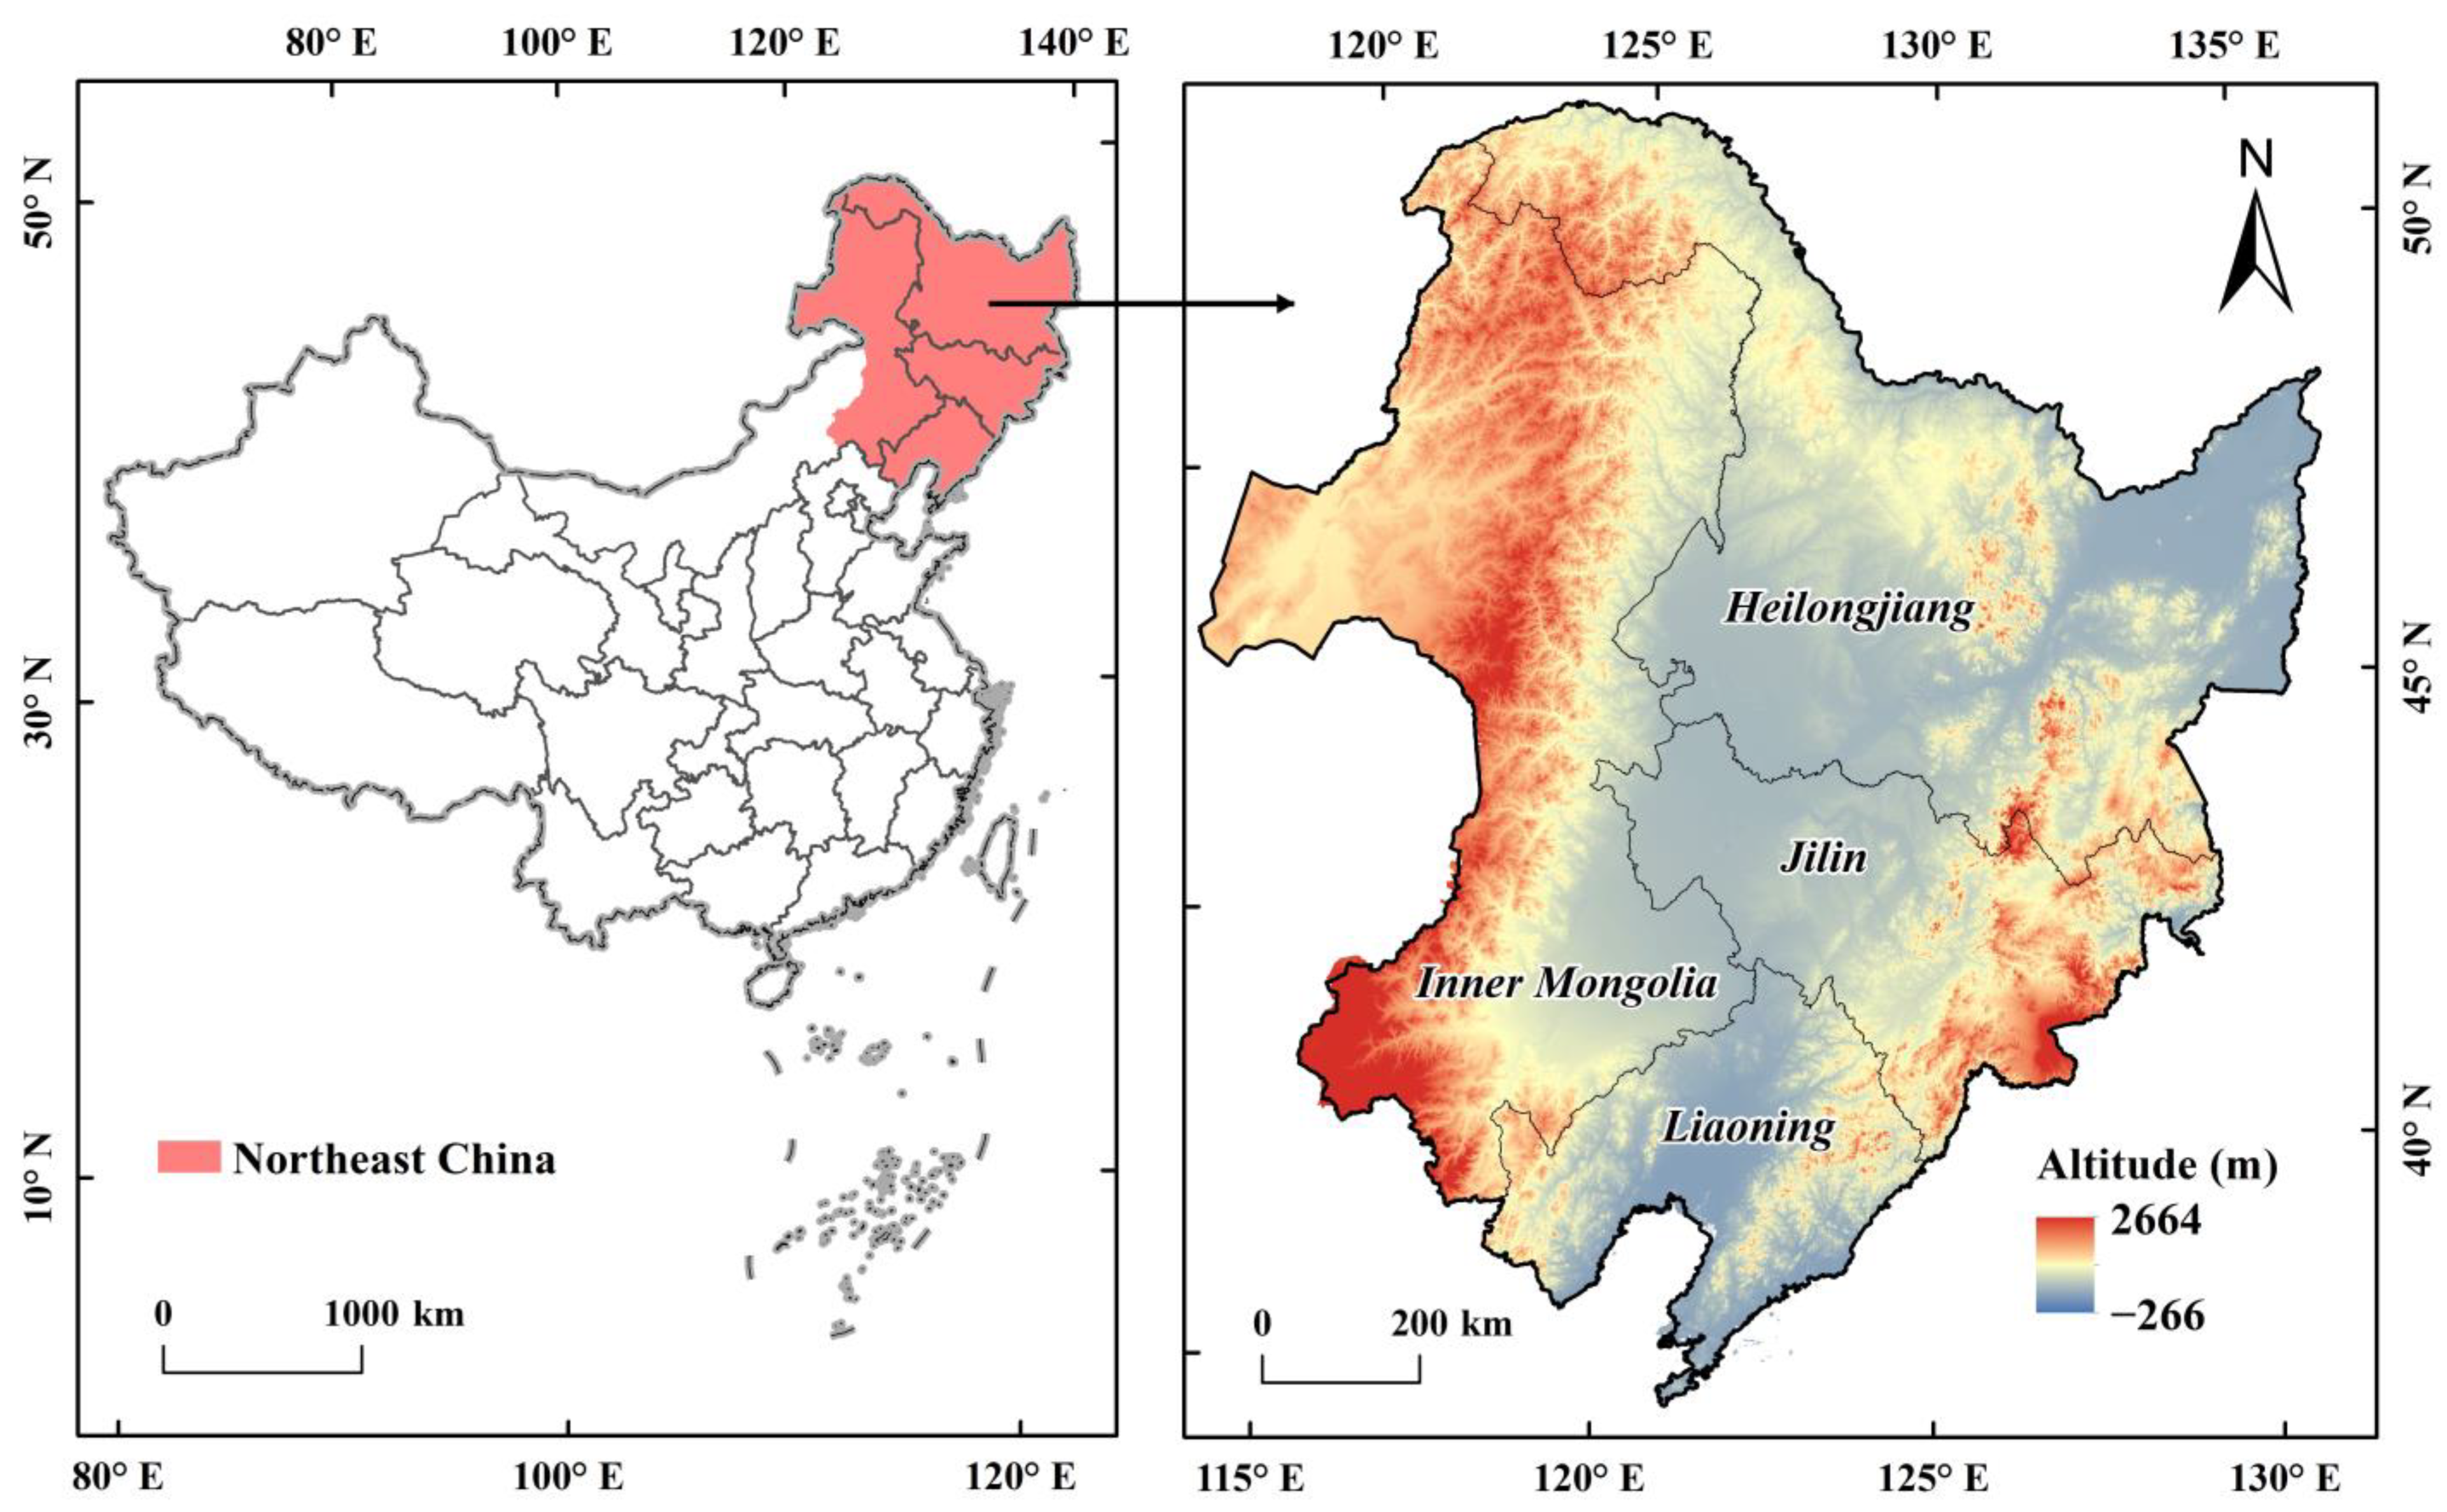
2.1. Study Area
2.2. Data Sources
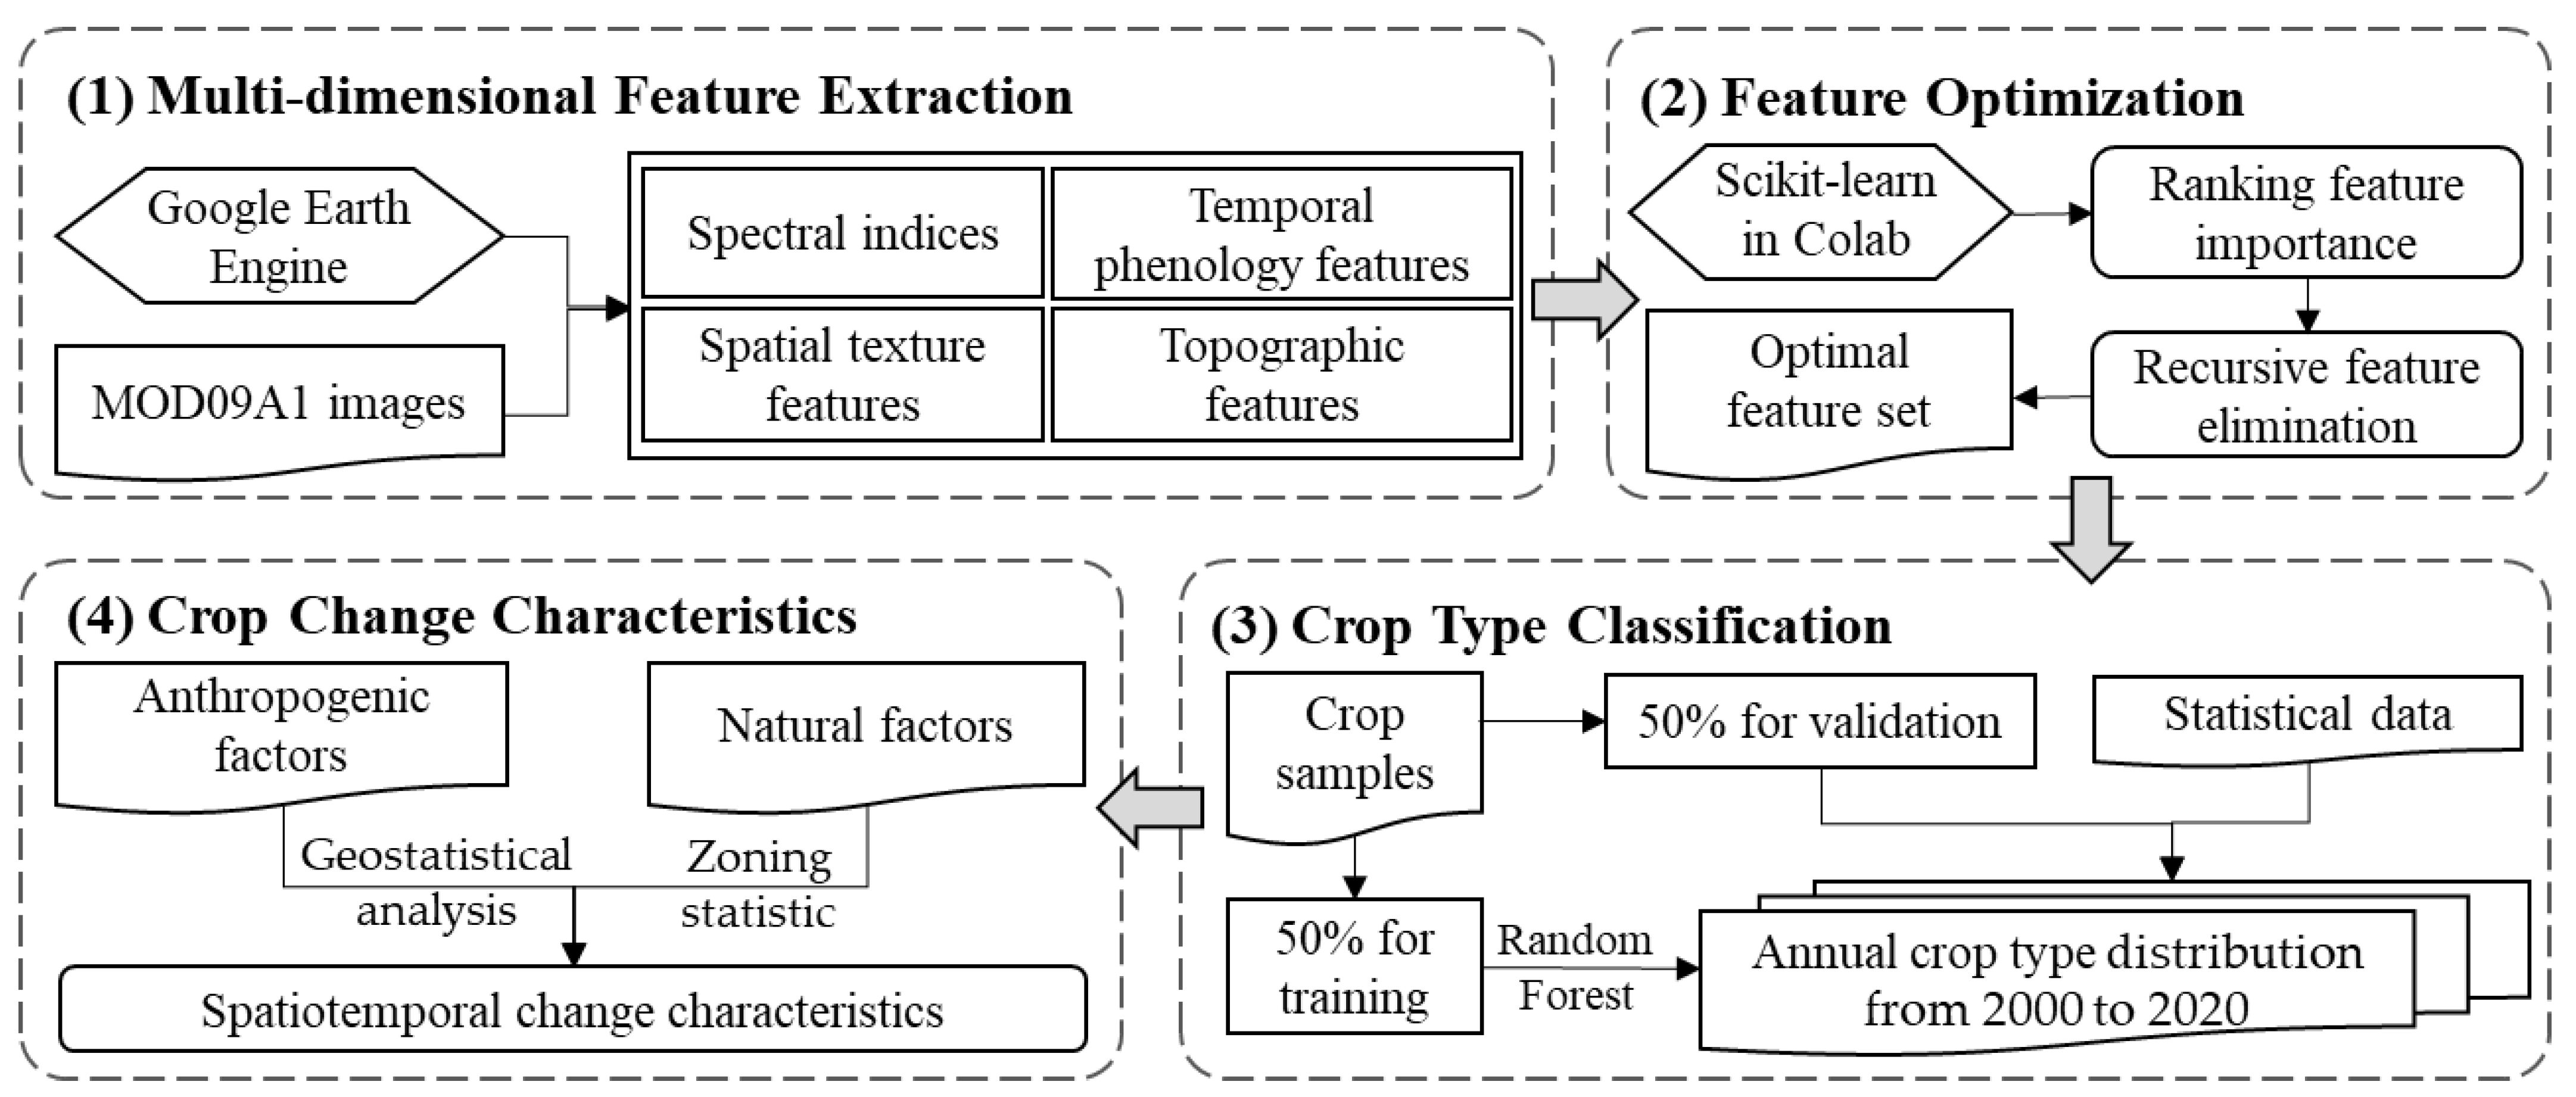
3. Methods
3.1. Multi-Dimensional Features’ Extraction
3.2. Feature Optimization Selection
3.3. Random Forest for Annual Crop Classification
3.4. Analysis of Crop Type Change Characteristics
4. Results
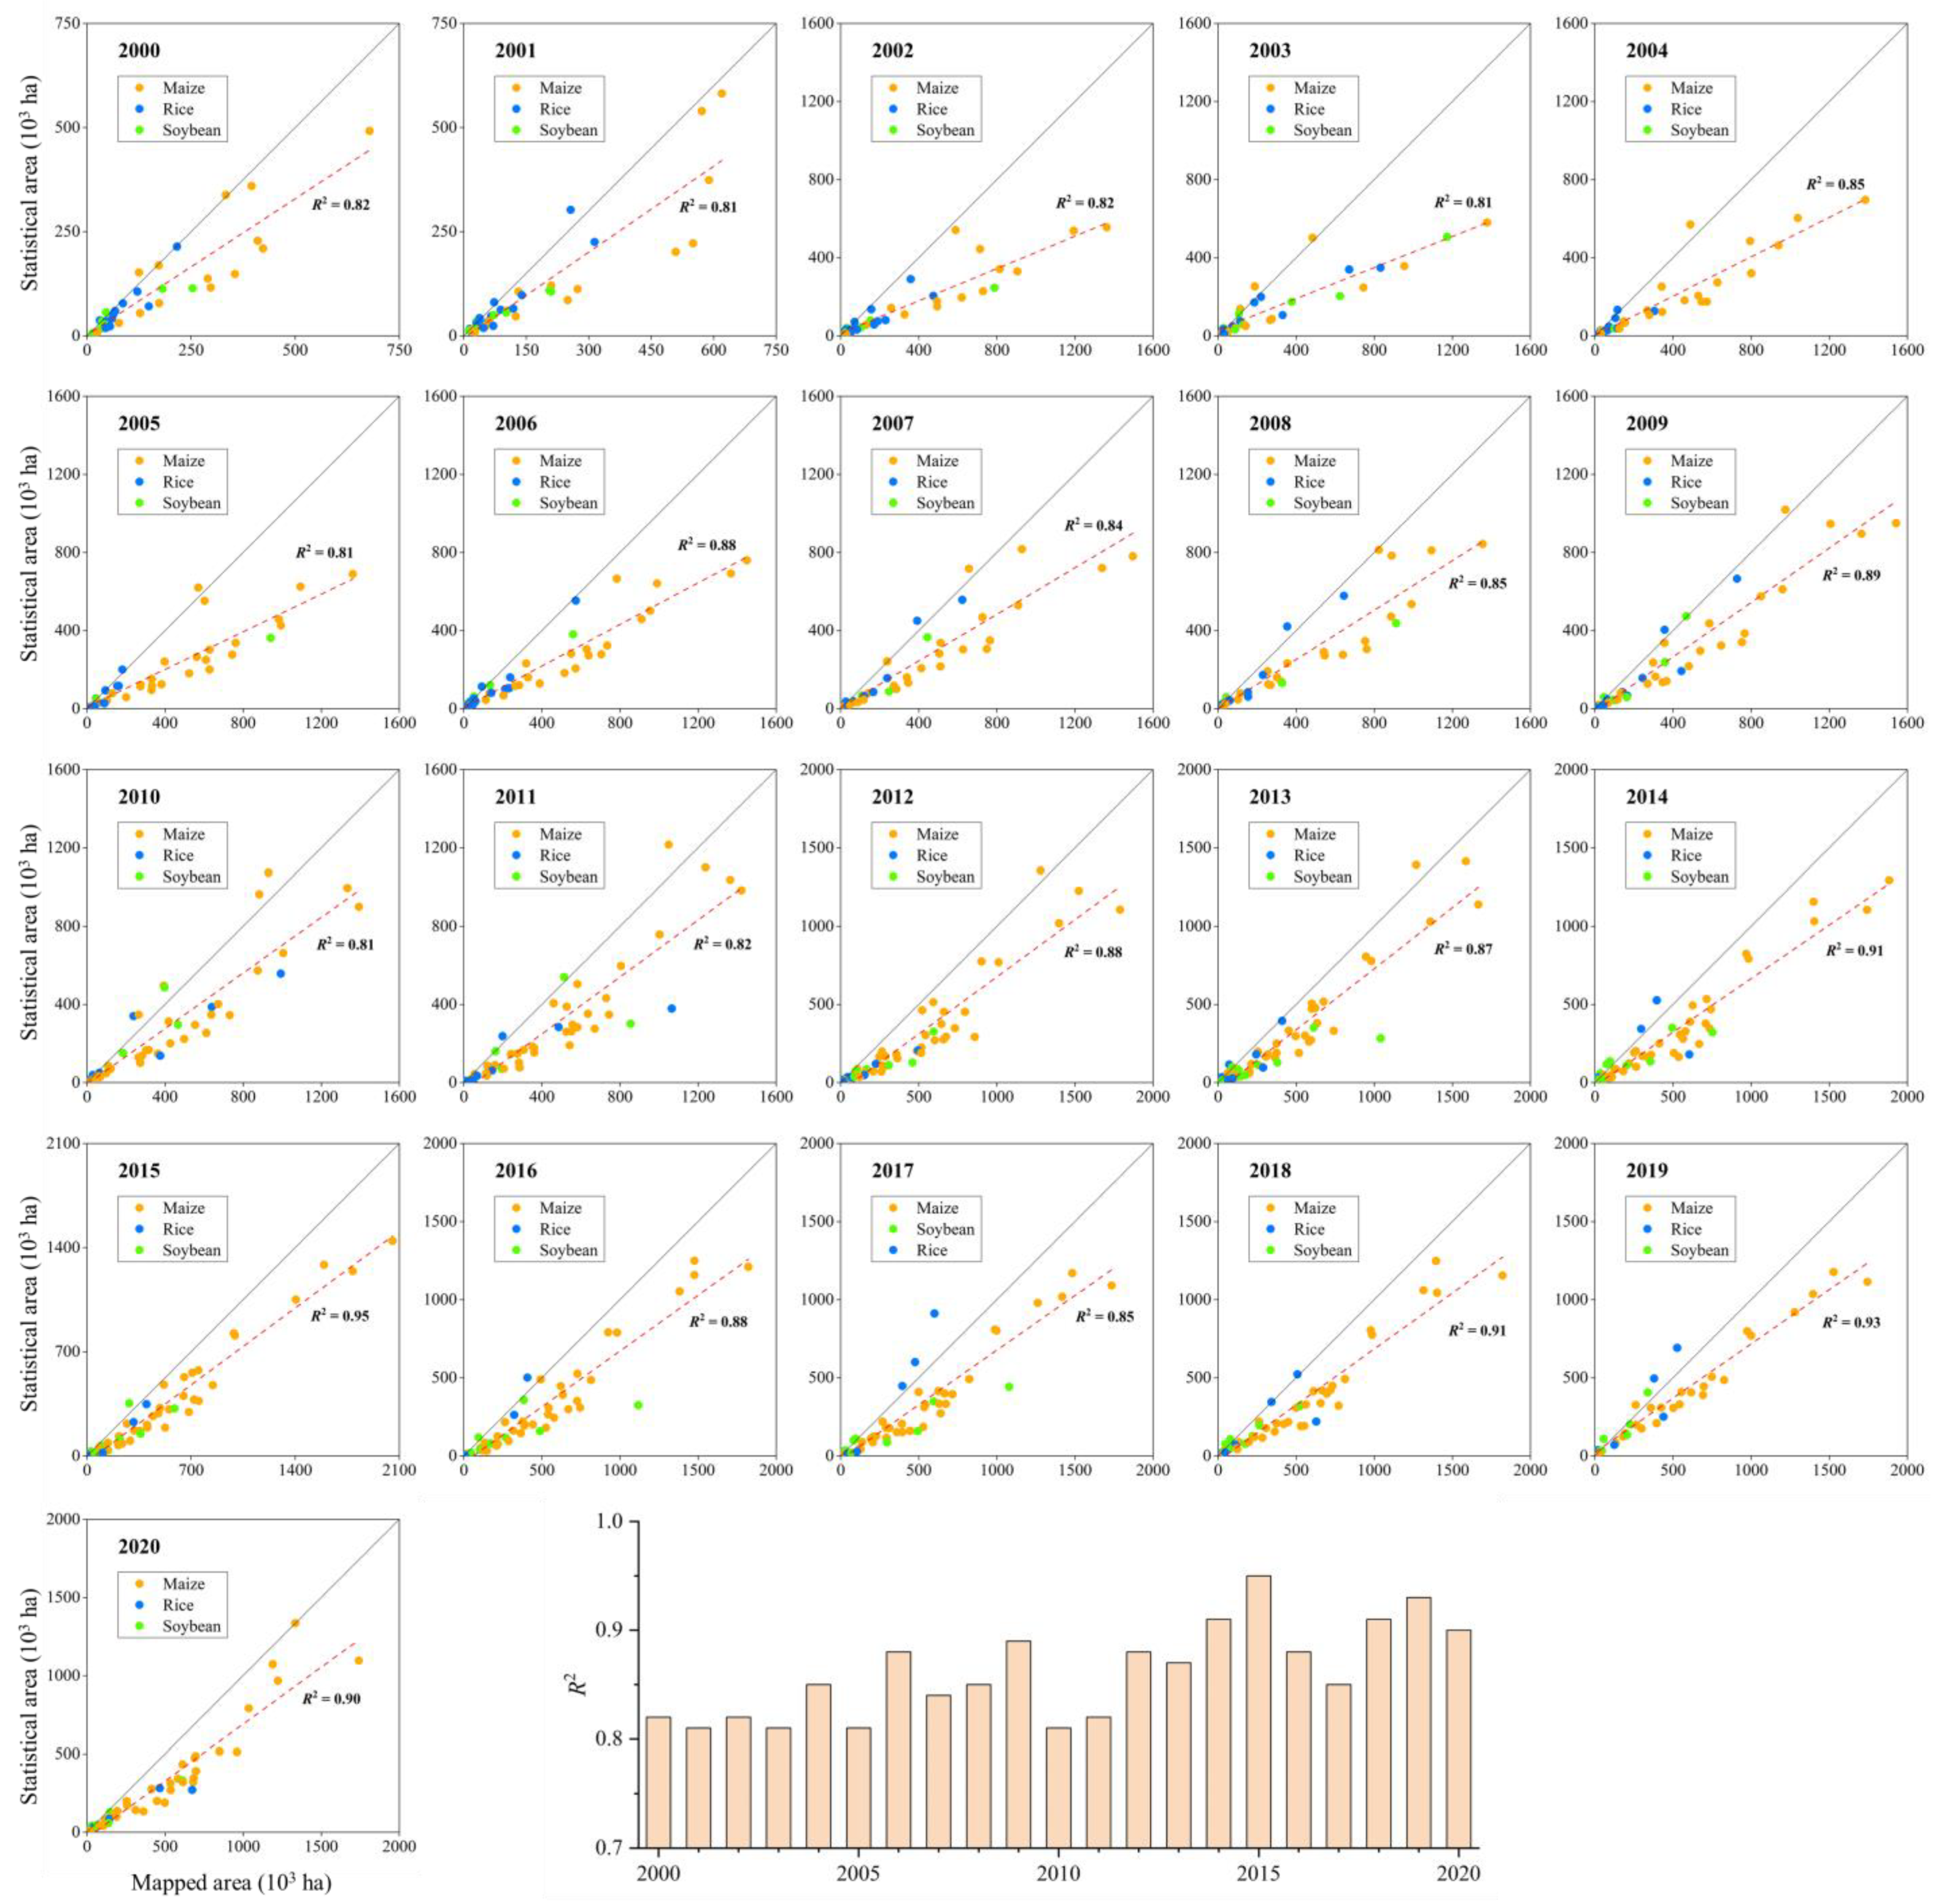
4.1. Classification Accuracy Assessment
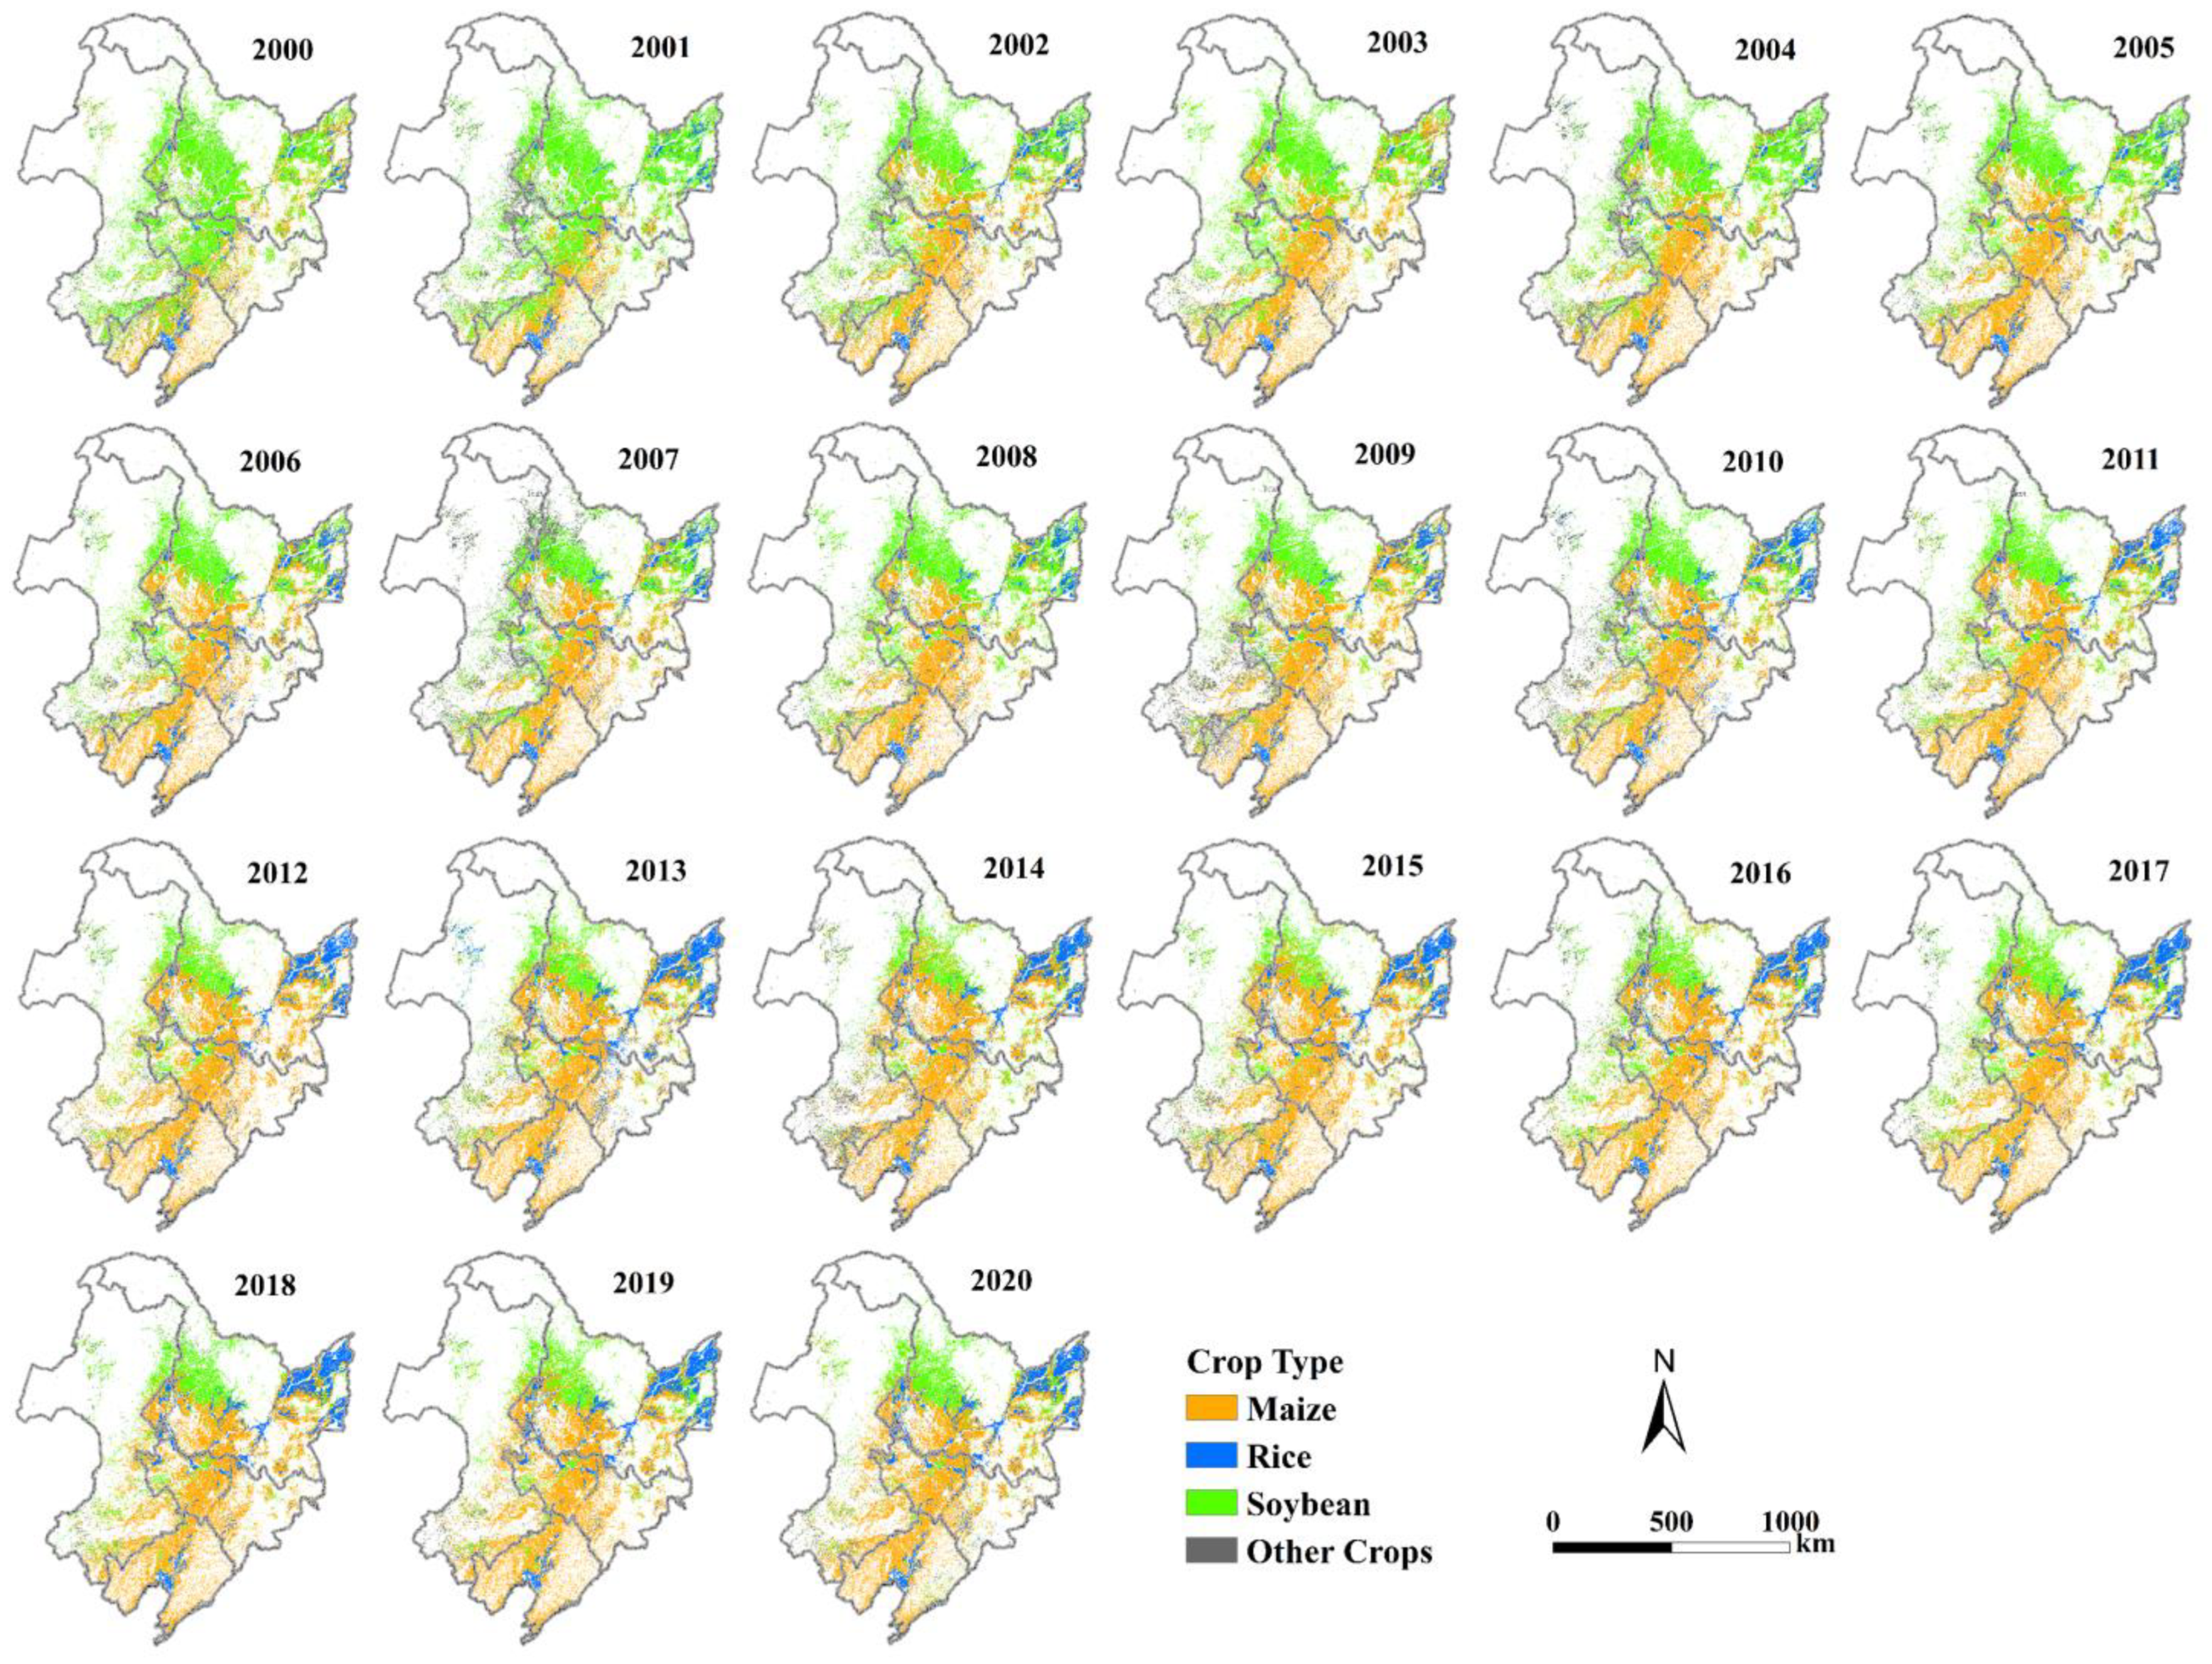
4.2. Annual Crop Type Distribution and Area Changes
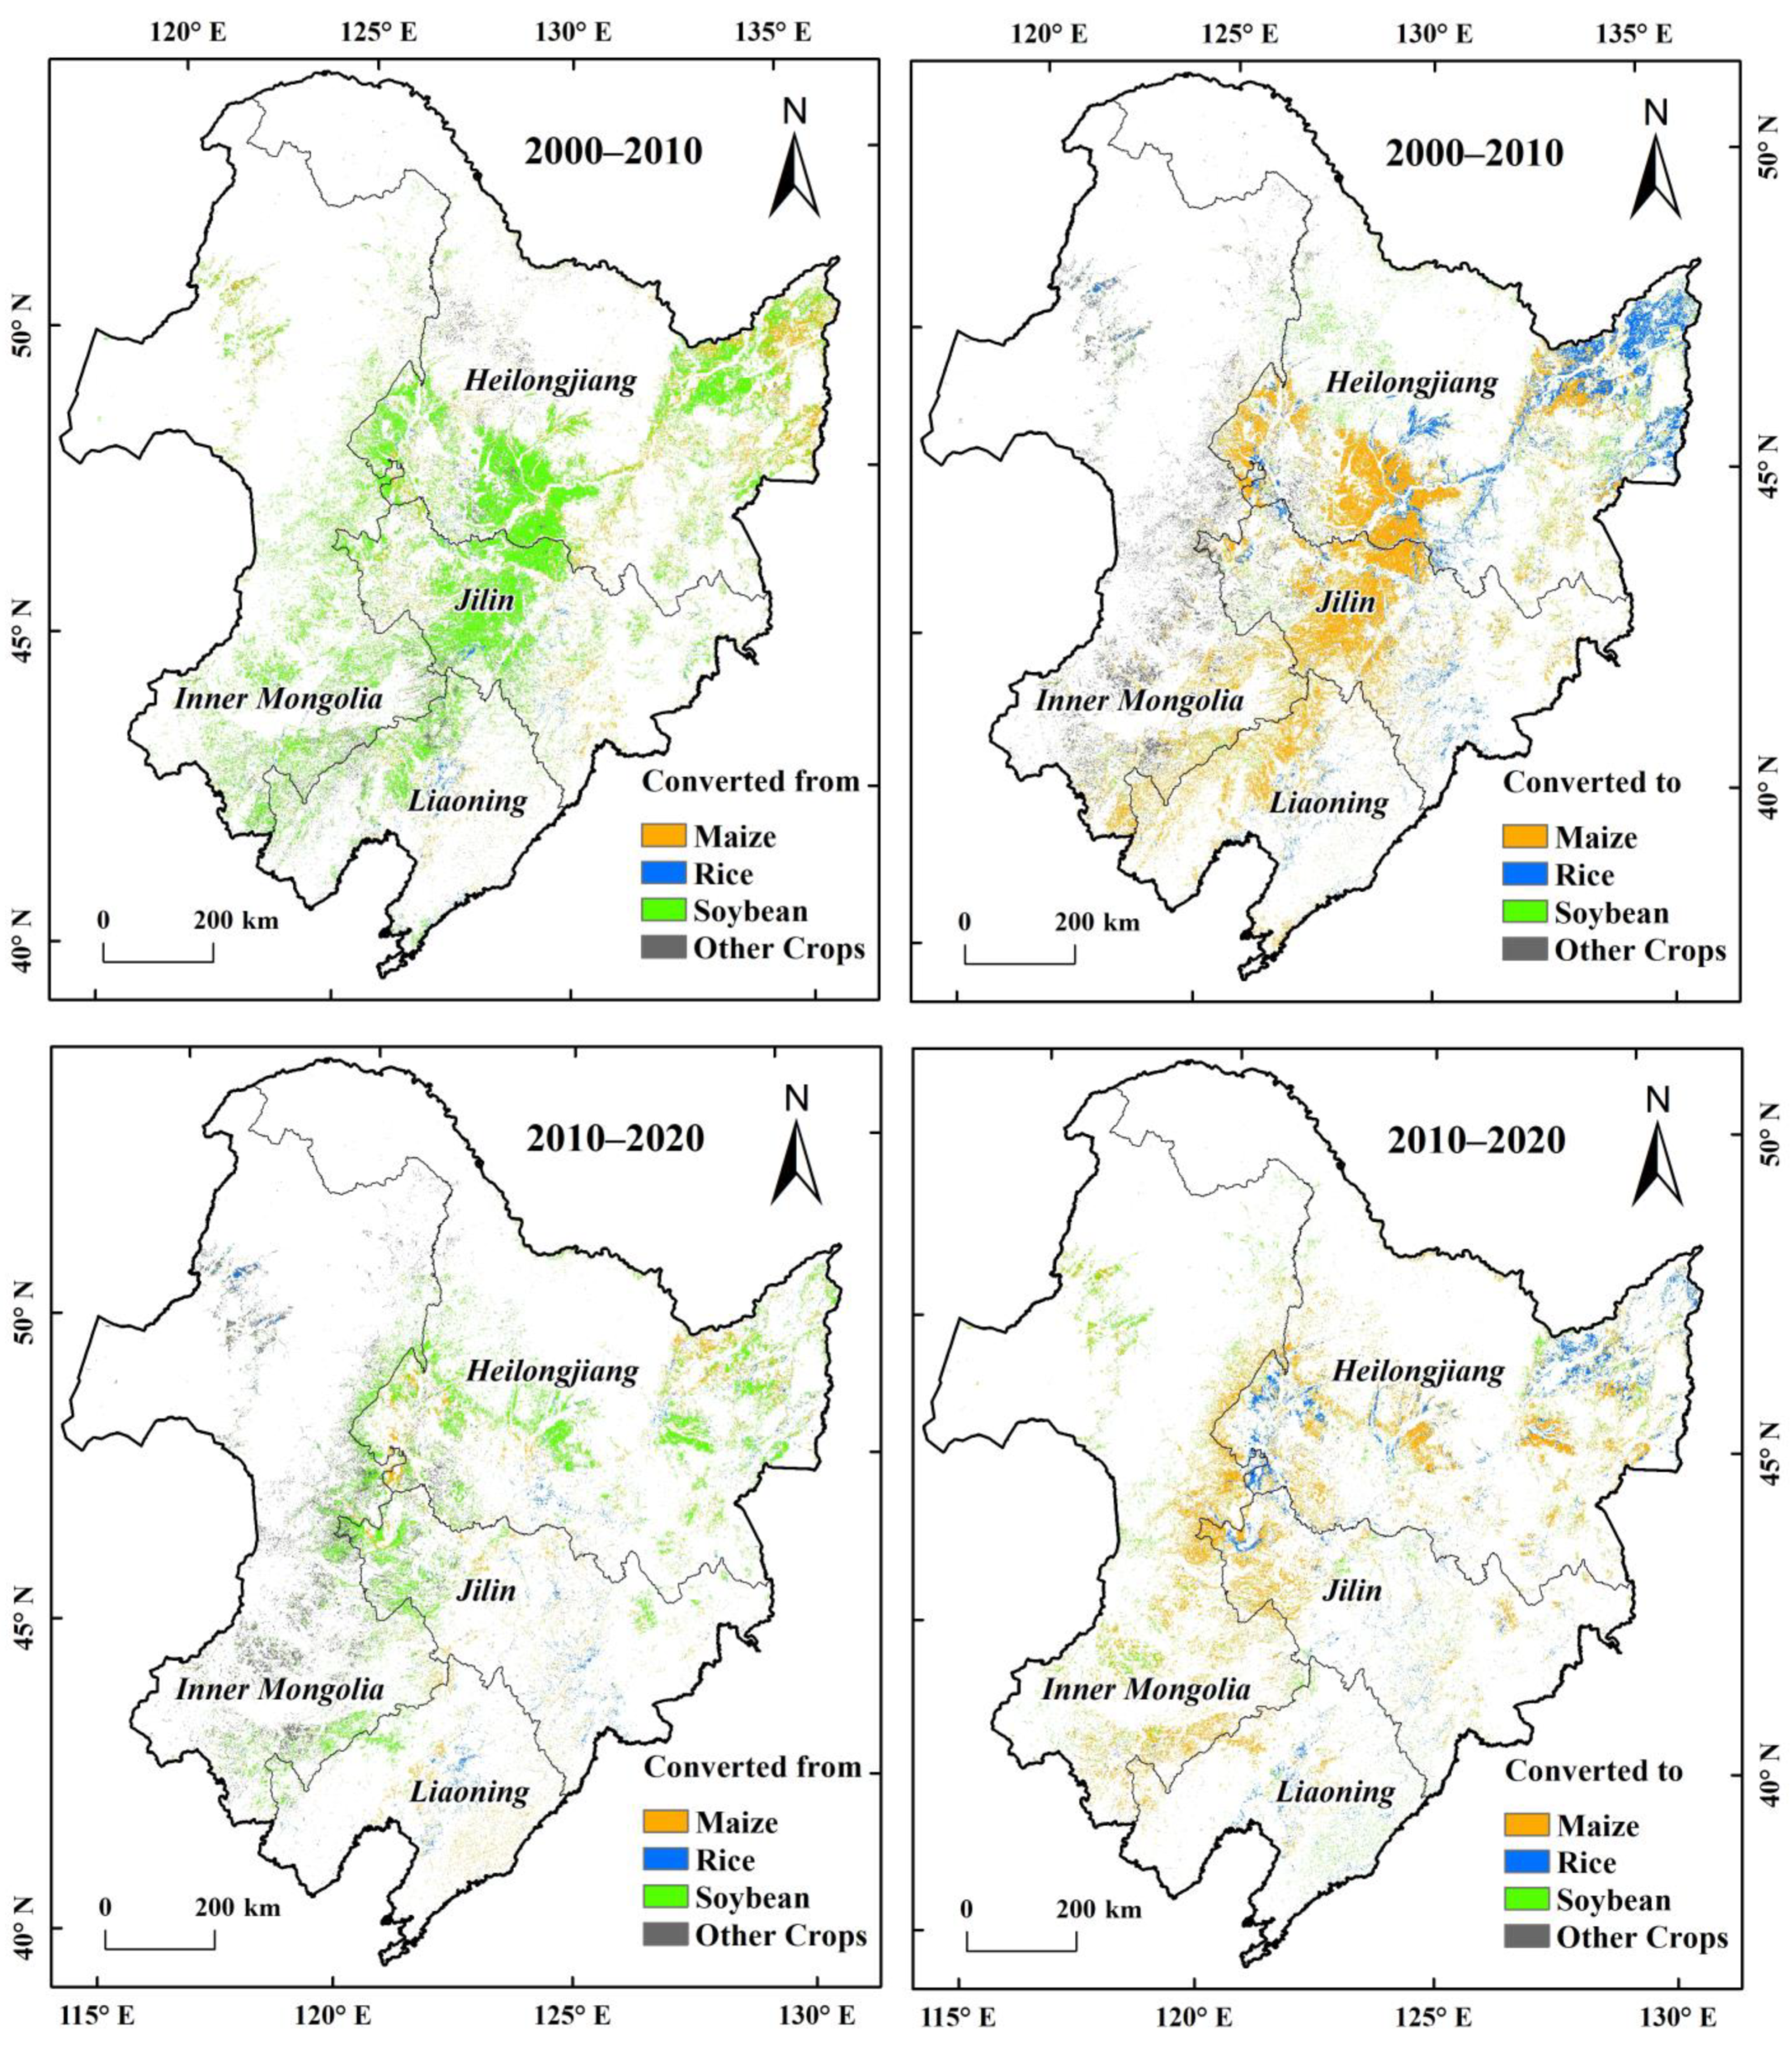
4.3. Spatiotemporal Conversions of Crop Types
4.4. Anthropogenic and Natural Characteristics of Crop Type Changes
5. Discussion
5.1. Limitations and Future Improvements of Annual Crop Classification
5.2. Potential Applications of GEE-Based Annual Crop Type Distribution
5.3. Causes, Effects, and Policy Implications of Crop Type Change
6. Conclusions
Author Contributions
Funding
Data Availability Statement
Acknowledgments
Conflicts of Interest
References
- Xiao, X.Y.; Shang, L.X.; Liu, Y.Q. Comparative Study on Farmland Circulation between Plains and Mountainous Areas in an Arid Region: A Case Study of Zhangye City in Northwest China. Land 2022, 11, 571. [Google Scholar] [CrossRef]
- Liu, Y.Q.; Song, W.; Mu, F.Y. Changes in ecosystem services associated with planting structures of cropland: A case study in Minle County in China. Phys. Chem. Earth 2017, 102, 10–20. [Google Scholar] [CrossRef]
- Liu, Y.Q.; Song, W. Mapping human appropriation of net primary production in agroecosystems in the Heihe River Basin, China. Agric. Ecosyst. Environ. 2022, 335, 107996. [Google Scholar] [CrossRef]
- Zhong, H.M.; Liu, Z.J.; Wang, J.Y. Understanding impacts of cropland pattern dynamics on grain production in China: A integrated analysis by fusing statistical data and satellite-observed data. J. Environ. Manag. 2022, 313, 114988. [Google Scholar] [CrossRef]
- Liu, Y.S.; Fang, F.; Li, Y.H. Key issues of land use in China and implications for policy making. Land Use Policy 2014, 40, 6–12. [Google Scholar] [CrossRef]
- Song, W. Decoupling cultivated land loss by construction occupation from economic growth in Beijing. Habitat Int. 2014, 43, 198–205. [Google Scholar] [CrossRef]
- Song, W.; Pijanowski, B.C.; Tayyebi, A. Urban expansion and its consumption of high-quality farmland in Beijing, China. Ecol. Indic. 2015, 54, 60–70. [Google Scholar] [CrossRef]
- Ewert, F.; Rotter, R.P.; Bindi, M.; Webber, H.; Trnka, M.; Kersebaum, K.C.; Olesen, J.E.; van Ittersum, M.K.; Janssen, S.; Rivington, M.; et al. Crop modelling for integrated assessment of risk to food production from climate change. Environ. Model. Softw. 2015, 72, 287–303. [Google Scholar] [CrossRef]
- Liu, Y.Q.; Song, W.; Deng, X.Z. Spatiotemporal Patterns of Crop Irrigation Water Requirements in the Heihe River Basin, China. Water 2017, 9, 616. [Google Scholar] [CrossRef]
- Zhang, Y.; Wang, J.Y.; Dai, C. The Adjustment of China’s Grain Planting Structure Reduced the Consumption of Cropland and Water Resources. Int. J. Environ. Res. Public Health 2021, 18, 7352. [Google Scholar] [CrossRef]
- Liu, Z.J.; Liu, Y.S.; Wang, J.Y. A global analysis of agricultural productivity and water resource consumption changes over cropland expansion regions. Agric. Ecosyst. Environ. 2021, 321, 107630. [Google Scholar] [CrossRef]
- Gelybo, G.; Barcza, Z.; Dencso, M.; Potyo, I.; Kasa, I.; Horel, A.; Pokovai, K.; Birkas, M.; Kern, A.; Hollos, R.; et al. Effect of tillage and crop type on soil respiration in a long-term field experiment on chernozem soil under temperate climate. Soil Tillage Res. 2022, 216, 105239. [Google Scholar] [CrossRef]
- Jiang, M.; Li, X.B.; Xin, L.J.; Tan, M.H. Paddy rice multiple cropping index changes in Southern China: Impacts on national grain production capacity and policy implications. J. Geogr. Sci. 2019, 29, 1773–1787. [Google Scholar] [CrossRef]
- Liu, Y.Q.; Song, W.; Deng, X.Z. Changes in crop type distribution in Zhangye City of the Heihe River Basin, China. Appl. Geogr. 2016, 76, 22–36. [Google Scholar] [CrossRef]
- Wu, B.F.; Li, Q.Z. Crop planting and type proportion method for crop acreage estimation of complex agricultural landscapes. Int. J. Appl. Earth Obs. Geoinf. 2012, 16, 101–112. [Google Scholar] [CrossRef]
- Pinter, P.J.; Ritchie, J.C.; Hatfield, J.L.; Hart, G.F. The agricultural research service’s remote sensing program: An example of interagency collaboration. Photogramm. Eng. Rem. Sens. 2003, 69, 615–618. [Google Scholar] [CrossRef]
- Houston, A.G.; Hall, F.G. Use of Satellite Data in Agricultural Surveys. Commun. Stat.-Theor. Methods 1984, 13, 2857–2880. [Google Scholar] [CrossRef]
- Boryan, C.; Yang, Z.W.; Mueller, R.; Craig, M. Monitoring US agriculture: The US Department of Agriculture, National Agricultural Statistics Service, Cropland Data Layer Program. Geocarto. Int. 2011, 26, 341–358. [Google Scholar] [CrossRef]
- PERDIGAO, V.; Vossen, P.; Gallego, J. In The Mars project: The European approach adaptable to national needs. In Proceedings of the Workshop on New Tools for Agriculture and Forestry Statistics, Oporto, Portugal, 19–20 October 1995; pp. 63–78. [Google Scholar]
- Whitcraft, A.K.; Becker-Reshef, I.; Justice, C.O. A Framework for Defining Spatially Explicit Earth Observation Requirements for a Global Agricultural Monitoring Initiative (GEOGLAM). Remote Sens. 2015, 7, 1461–1481. [Google Scholar] [CrossRef]
- Wu, B.F.; Meng, J.H.; Li, Q.Z.; Yan, N.N.; Du, X.; Zhang, M. Remote sensing-based global crop monitoring: Experiences with China’s CropWatch system. Int. J. Digit. Earth 2014, 7, 113–137. [Google Scholar] [CrossRef]
- Gorelick, N.; Hancher, M.; Dixon, M.; Ilyushchenko, S.; Thau, D.; Moore, R. Google Earth Engine: Planetary-scale geospatial analysis for everyone. Remote Sens. Environ. 2017, 202, 18–27. [Google Scholar] [CrossRef]
- Li, J.F.; Wang, L.Y.; Liu, S.Q.; Peng, B.A.; Ye, H.P. An automatic cloud detection model for Sentinel-2 imagery based on Google Earth Engine. Remote Sens Lett. 2022, 13, 196–206. [Google Scholar] [CrossRef]
- Li, H.; Wan, W.; Fang, Y.; Zhu, S.Y.; Chen, X.; Liu, B.J.; Hong, Y. A Google Earth Engine-enabled software for efficiently generating high-quality user-ready Landsat mosaic images. Environ. Model. Softw. 2019, 112, 16–22. [Google Scholar] [CrossRef]
- Zhang, C.; Di, L.P.; Yang, Z.W.; Lin, L.; Hao, P.Y. AgKit4EE: A toolkit for agricultural land use modeling of the conterminous United States based on Google Earth Engine. Env. Model. Softw. 2020, 129, 104694. [Google Scholar] [CrossRef]
- Liu, Y.Q.; Song, W.; Deng, X.Z. Understanding the spatiotemporal variation of urban land expansion in oasis cities by integrating remote sensing and multi-dimensional DPSIR-based indicators. Ecol. Indic. 2019, 96, 23–37. [Google Scholar] [CrossRef]
- Wang, S.; Azzari, G.; Lobell, D.B. Crop type mapping without field-level labels: Random forest transfer and unsupervised clustering techniques. Remote Sens. Environ. 2019, 222, 303–317. [Google Scholar] [CrossRef]
- You, N.S.; Dong, J.W.; Huang, J.X.; Du, G.M.; Zhang, G.L.; He, Y.L.; Yang, T.; Di, Y.Y.; Xiao, X.M. The 10-m crop type maps in Northeast China during 2017–2019. Sci. Data 2021, 8, 41. [Google Scholar] [CrossRef]
- Low, F.; Michel, U.; Dech, S.; Conrad, C. Impact of feature selection on the accuracy and spatial uncertainty of per-field crop classification using Support Vector Machines. ISPRS J. Photogram. 2013, 85, 102–119. [Google Scholar] [CrossRef]
- Hao, P.Y.; Zhan, Y.L.; Wang, L.; Niu, Z.; Shakir, M. Feature Selection of Time Series MODIS Data for Early Crop Classification Using Random Forest: A Case Study in Kansas, USA. Remote Sens. 2015, 7, 5347–5369. [Google Scholar] [CrossRef]
- Zhang, L.; Liu, Z.; Liu, D.Y.; Xiong, Q.; Yang, N.; Ren, T.W.; Zhang, C.; Zhang, X.D.; Li, S.M. Crop Mapping Based on Historical Samples and New Training Samples Generation in Heilongjiang Province, China. Sustainability 2019, 11, 5052. [Google Scholar]
- Blickensdorfer, L.; Schwieder, M.; Pflugmacher, D.; Nendel, C.; Erasmi, S.; Hostert, P. Mapping of crop types and crop sequences with combined time series of Sentinel-1, Sentinel-2 and Landsat 8 data for Germany. Remote Sens. Environ. 2022, 269, 112831. [Google Scholar] [CrossRef]
- Tong, C.L.; Hall, C.A.S.; Wang, H.Q. Land use change in rice, wheat and maize production in China (1961–1998). Agric. Ecosyst. Environ. 2003, 95, 523–536. [Google Scholar] [CrossRef]
- Wang, J.Y.; Zhang, Z.W.; Liu, Y.S. Spatial shifts in grain production increases in China and implications for food security. Land Use Policy 2018, 74, 204–213. [Google Scholar] [CrossRef]
- Chen, C.Q.; van Groenigen, K.J.; Yang, H.Y.; Hungate, B.A.; Yang, B.; Tian, Y.L.; Chen, J.; Dong, W.J.; Huang, S.; Deng, A.X.; et al. Global warming and shifts in cropping systems together reduce China’s rice production. Glob. Food Secur.-Agric. 2020, 24, 100359. [Google Scholar] [CrossRef]
- Liu, Y.S.; Zhou, Y. Reflections on China’s food security and land use policy under rapid urbanization. Land Use Policy 2021, 109, 105699. [Google Scholar] [CrossRef]
- Olesen, J.E.; Trnka, M.; Kersebaum, K.C.; Skjelvag, A.O.; Seguin, B.; Peltonen-Sainio, P.; Rossi, F.; Kozyra, J.; Micale, F. Impacts and adaptation of European crop production systems to climate change. Eur. J. Agron. 2011, 34, 96–112. [Google Scholar] [CrossRef]
- Liu, Y.Q.; Song, W. Modelling crop yield, water consumption, and water use efficiency for sustainable agroecosystem management. J. Clean. Prod. 2020, 253, 119940. [Google Scholar] [CrossRef]
- Liu, Y.S.; Liu, X.Q.; Liu, Z.J. Effects of climate change on paddy expansion and potential adaption strategies for sustainable agriculture development across Northeast China. Appl. Geogr. 2022, 141, 102667. [Google Scholar] [CrossRef]
- Liu, Z.J.; Yang, X.G.; Chen, F.; Wang, E.L. The effects of past climate change on the northern limits of maize planting in Northeast China. Clim. Chang. 2013, 117, 891–902. [Google Scholar] [CrossRef]
- Dong, J.; Xiao, X.; Zhang, G.; Menarguez, M.A.; Choi, C.Y.; Qin, Y.; Luo, P.; Zhang, Y.; Moore, B. Northward expansion of paddy rice in northeastern Asia during 2000–2014. Geophys. Res. Lett. 2016, 43, 3754–3761. [Google Scholar] [CrossRef]
- Yang, L.B.; Wang, L.M.; Huang, J.F.; Mansaray, L.R.; Mijiti, R. Monitoring policy-driven crop area adjustments in northeast China using Landsat-8 imagery. Int. J. Appl. Earth Obs. Geoinf. 2019, 82, 101982. [Google Scholar] [CrossRef]
- Zhang, S.; Sun, L.; Jamshidi, A.H.; Niu, Y.; Fan, Z.; Zhang, H.; Liu, X. Assessment of the degree of sloped cropland degradation in typical black soil regions. Land Degrad. Dev. 2021, 33, 2220–2230. [Google Scholar] [CrossRef]
- Yu, X.Y.; He, X.Y.; Zheng, H.F.; Guo, R.C.; Ren, Z.B.; Zhang, D.; Lin, J.X. Spatial and temporal analysis of drought risk during the crop-growing season over northeast China. Nat. Hazards 2014, 71, 275–289. [Google Scholar] [CrossRef]
- Liu, X.B.; Zhang, X.Y.; Wang, Y.X.; Sui, Y.Y.; Zhang, S.L.; Herbert, S.J.; Ding, G. Soil degradation: A problem threatening the sustainable development of agriculture in Northeast China. Plant Soil Environ. 2010, 56, 87–97. [Google Scholar] [CrossRef]
- Justice, C.O.; Townshend, J.R.G.; Vermote, E.F.; Masuoka, E.; Wolfe, R.E.; Saleous, N.; Roy, D.P.; Morisette, J.T. An overview of MODIS Land data processing and product status. Remote Sens. Environ. 2002, 83, 3–15. [Google Scholar] [CrossRef]
- Liu, J.Y.; Kuang, W.H.; Zhang, Z.X.; Xu, X.L.; Qin, Y.W.; Ning, J.; Zhou, W.C.; Zhang, S.W.; Li, R.D.; Yan, C.Z.; et al. Spatiotemporal characteristics, patterns, and causes of land-use changes in China since the late 1980s. J. Geogr. Sci. 2014, 24, 195–210. [Google Scholar] [CrossRef]
- Reuter, H.I.; Nelson, A.; Jarvis, A. An evaluation of void-filling interpolation methods for SRTM data. Int. J. Geogr. Inf. Sci. 2007, 21, 983–1008. [Google Scholar] [CrossRef]
- Liu, F.; Wu, H.; Zhao, Y.; Li, D.; Yang, J.L.; Song, X.; Shi, Z.; Zhu, A.X.; Zhang, G.L. Mapping high resolution National Soil Information Grids of China. Sci. Bull. 2022, 67, 328–340. [Google Scholar] [CrossRef]
- Heilongjiang Bureau of Statistics. Heilongjiang Statistical Yearbook; China Statistics Press: Beijing, China, 2001–2021.
- Jilin Bureau of Statistics. Jilin Statistical Yearbook; China Statistics Press: Beijing, China, 2001–2021.
- Liaoning Bureau of Statistics. Liaoning Statistical Yearbook; China Statistics Press: Beijing, China, 2001–2021.
- Defries, R.S.; Townshend, J.R.G. Ndvi-Derived Land-Cover Classifications at a Global-Scale. Int. J. Remote Sens. 1994, 15, 3567–3586. [Google Scholar] [CrossRef]
- Huete, A.; Didan, K.; Miura, T.; Rodriguez, E.P.; Gao, X.; Ferreira, L.G. Overview of the radiometric and biophysical performance of the MODIS vegetation indices. Remote Sens. Environ. 2002, 83, 195–213. [Google Scholar] [CrossRef]
- Gao, B.C. NDWI—A normalized difference water index for remote sensing of vegetation liquid water from space. Remote Sens. Environ. 1996, 58, 257–266. [Google Scholar] [CrossRef]
- Xiao, X.M.; Boles, S.; Liu, J.Y.; Zhuang, D.F.; Frolking, S.; Li, C.S.; Salas, W.; Moore, B. Mapping paddy rice agriculture in southern China using multi-temporal MODIS images. Remote Sens. Environ. 2005, 95, 480–492. [Google Scholar] [CrossRef]
- Qi, J.; Marsett, R.; Heilman, P.; Bieden-bender, S.; Moran, S.; Goodrich, D.; Weltz, M. RANGES improves satellite-based information and land cover assessments in southwest United States. Eos Trans. Am. Geophys. Union 2002, 83, 601–606. [Google Scholar] [CrossRef]
- van Deventer, A.P.; Ward, A.D.; Gowda, P.H.; Lyon, J.G. Using thematic mapper data to identify contrasting soil plains and tillage practices. Photogram. Eng. Remote Sens. 1997, 63, 87–93. [Google Scholar]
- Gitelson, A.A.; Vina, A.; Arkebauer, T.J.; Rundquist, D.C.; Keydan, G.; Leavitt, B. Remote estimation of leaf area index and green leaf biomass in maize canopies. Geophys. Res. Lett. 2003, 30, 1248. [Google Scholar] [CrossRef]
- Qi, J.; Chehbouni, A.; Huete, A.R.; Kerr, Y.H.; Sorooshian, S. A Modified Soil Adjusted Vegetation Index. Remote Sens. Environ. 1994, 48, 119–126. [Google Scholar] [CrossRef]
- Salomonson, V.V.; Appel, I. Estimating fractional snow cover from MODIS using the normalized difference snow index. Remote Sens. Environ. 2004, 89, 351–360. [Google Scholar] [CrossRef]
- Haralick, R.M.; Shanmugam, K.; Dinstein, I. Textural Features for Image Classification. IEEE Trans. Syst. Man Cybern. 1973, 6, 610–621. [Google Scholar] [CrossRef]
- Tachikawa, T.; Hato, M.; Kaku, M.; Iwasaki, A. Characteristics of ASTER GDEM version 2. In Proceedings of the 2011 IEEE International Geoscience and Remote Sensing Symposium, Vancouver, BC, Canada, 24–29 July 2011; pp. 3657–3660. [Google Scholar]
- Yin, Z.; Zhang, J.H. Operator functional state classification using least-square support vector machine based recursive feature elimination technique. Comput. Methods Prog. Biol. 2014, 113, 101–115. [Google Scholar] [CrossRef]
- Liu, Y.Q.; Lu, C.H. Quantifying Grass Coverage Trends to Identify the Hot Plots of Grassland Degradation in the Tibetan Plateau during 2000–2019. Int. J. Environ. Res. Public Health 2021, 18, 416. [Google Scholar] [CrossRef]
- Hao, P.Y.; Di, L.P.; Zhang, C.; Guo, L.Y. Transfer Learning for Crop classification with Cropland Data Layer data (CDL) as training samples. Sci. Total Environ. 2020, 733, 138869. [Google Scholar] [CrossRef] [PubMed]
- Behnke, G.D.; Zuber, S.M.; Pittelkow, C.M.; Nafziger, E.D.; Villamil, M.B. Long-term crop rotation and tillage effects on soil greenhouse gas emissions and crop production in Illinois, USA. Agric. Ecosyst. Environ. 2018, 261, 62–70. [Google Scholar] [CrossRef]
- Jarecki, M.; Grant, B.; Smith, W.; Deen, B.; Drury, C.; VanderZaag, A.; Qian, B.D.; Yang, J.Y.; Wagner-Riddle, C. Long-term Trends in Corn Yields and Soil Carbon under Diversified Crop Rotations. J. Environ. Qual. 2018, 47, 635–643. [Google Scholar] [CrossRef] [PubMed]
- Van Eerd, L.L.; Congreves, K.A.; Hayes, A.; Verhallen, A.; Hooker, D.C. Long-term tillage and crop rotation effects on soil quality, organic carbon, and total nitrogen. Can. J. Soil Sci. 2014, 94, 303–315. [Google Scholar] [CrossRef]
- Su, S.L.; Zhou, X.C.; Wan, C.; Li, Y.K.; Kong, W.H. Land use changes to cash crop plantations: Crop types, multilevel determinants and policy implications. Land Use Policy 2016, 50, 379–389. [Google Scholar] [CrossRef]
- Zheng, X.; Zhu, J.J.; Yan, Q.L.; Song, L.N. Effects of land use changes on the groundwater table and the decline of Pinus sylvestris var. mongolica plantations in southern Horqin Sandy Land, Northeast China. Agric. Water Manag. 2012, 109, 94–106. [Google Scholar] [CrossRef]
- Nie, T.Z.; Zhang, Z.X.; Qi, Z.J.; Chen, P.; Sun, Z.Y.; Liu, X.C. Characterizing Spatiotemporal Dynamics of CH4 Fluxes from Rice Paddies of Cold Region in Heilongjiang Province under Climate Change. Int. J. Environ. Res. Public Health 2019, 16, 692. [Google Scholar] [CrossRef]
- Yang, S.H.; Xiao, Y.N.; Sun, X.; Ding, J.; Jiang, Z.W.; Xu, J.Z. Biochar improved rice yield and mitigated CH4 and N2O emissions from paddy field under controlled irrigation in the Taihu Lake Region of China. Atmos. Environ. 2019, 200, 69–77. [Google Scholar] [CrossRef]
- Liu, S.; Yang, J.Y.; Zhang, X.Y.; Drury, C.F.; Reynolds, W.D.; Hoogenboom, G. Modelling crop yield, soil water content and soil temperature for a soybean-maize rotation under conventional and conservation tillage systems in Northeast China. Agric. Water Manag. 2013, 123, 32–44. [Google Scholar] [CrossRef]


| Feature Types | Metrics | Periods | Calculation | Dimensions |
|---|---|---|---|---|
| Spectral Indices | NDVI, EVI, NDWI, LSWI, NDSI, NDSVI, NDTI, GCVI, MSAVI2 | Growing season | Median, mean, maximum, Minimum, standard deviation | 9 × 1 × 5 = 45 |
| Temporal Phenology Features | Seeding stage, growth stage, harvest stage | median | 9 × 3 × 1 = 27 | |
| Spatial Texture Features | NDVI, LSWI | Growing season | Median and GLCM | 2 × 1 × 18 = 36 |
| Topographic Factors | Elevation, slope, aspect | 3 | ||
| Crop Types | Validation Samples in 2019 | User Accuracy (%) | |||||
| Maize | Rice | Soybean | Other Crops | Total | |||
| Classification Result in 2019 | Maize | 696 | 12 | 82 | 4 | 794 | 87.66 |
| Rice | 15 | 239 | 6 | 0 | 260 | 91.92 | |
| Soybean | 49 | 9 | 315 | 6 | 379 | 83.11 | |
| Other Crops | 5 | 3 | 5 | 54 | 67 | 80.60 | |
| Total | 765 | 263 | 408 | 64 | 1500 | ||
| Mapping Accuracy (%) | 90.98 | 90.87 | 77.21 | 84.38 | |||
| Crop Types | Validation Samples in 2018 | User Accuracy (%) | |||||
| Maize | Rice | Soybean | Other Crops | Total | |||
| Classification Result in 2018 | Maize | 703 | 21 | 70 | 5 | 799 | 87.98 |
| Rice | 17 | 218 | 4 | 3 | 242 | 90.08 | |
| Soybean | 61 | 4 | 299 | 1 | 365 | 81.92 | |
| Other Crops | 9 | 4 | 6 | 75 | 94 | 79.79 | |
| Total | 790 | 247 | 379 | 84 | 1500 | ||
| Mapping Accuracy (%) | 88.99 | 88.26 | 78.89 | 89.29 | |||
| Crop Types | Validation Samples in 2017 | User Accuracy (%) | |||||
| Maize | Rice | Soybean | Other Crops | Total | |||
| Classification Result in 2017 | Maize | 652 | 18 | 78 | 11 | 759 | 85.90 |
| Rice | 11 | 223 | 13 | 2 | 249 | 89.56 | |
| Soybean | 57 | 8 | 335 | 7 | 407 | 82.31 | |
| Other Crops | 5 | 9 | 10 | 61 | 85 | 71.76 | |
| Total | 725 | 258 | 436 | 81 | 1500 | ||
| Mapping Accuracy (%) | 89.93 | 86.43 | 76.83 | 75.31 | |||
| Gains in 2010 (106 ha) | ||||||
| Maize | Rice | Soybean | Other Crops | Total | ||
| Losses in 2000 (106 ha) | Maize | 1.68 | 0.91 | 0.30 | 2.90 | |
| Rice | 0.42 | 0.06 | 0.04 | 0.52 | ||
| Soybean | 8.68 | 1.38 | 2.23 | 12.29 | ||
| Other Crops | 0.78 | 0.03 | 0.48 | 1.30 | ||
| Total | 9.88 | 3.10 | 1.46 | 2.57 | 17.02 | |
| Gains in 2020 (106 ha) | ||||||
| Maize | Rice | Soybean | Other Crops | Total | ||
| Losses in 2010 (106 ha) | Maize | 1.11 | 0.72 | 0.07 | 1.91 | |
| Rice | 0.68 | 0.08 | 0.01 | 0.77 | ||
| Soybean | 4.15 | 0.50 | 0.10 | 4.75 | ||
| Other Crops | 1.51 | 0.04 | 0.86 | 2.41 | ||
| Total | 6.35 | 1.66 | 1.65 | 0.18 | 9.84 | |
Publisher’s Note: MDPI stays neutral with regard to jurisdictional claims in published maps and institutional affiliations. |
© 2022 by the authors. Licensee MDPI, Basel, Switzerland. This article is an open access article distributed under the terms and conditions of the Creative Commons Attribution (CC BY) license (https://creativecommons.org/licenses/by/4.0/).
Share and Cite
Liu, Y.; Wang, J. Revealing Annual Crop Type Distribution and Spatiotemporal Changes in Northeast China Based on Google Earth Engine. Remote Sens. 2022, 14, 4056. https://doi.org/10.3390/rs14164056
Liu Y, Wang J. Revealing Annual Crop Type Distribution and Spatiotemporal Changes in Northeast China Based on Google Earth Engine. Remote Sensing. 2022; 14(16):4056. https://doi.org/10.3390/rs14164056
Chicago/Turabian StyleLiu, Yaqun, and Jieyong Wang. 2022. "Revealing Annual Crop Type Distribution and Spatiotemporal Changes in Northeast China Based on Google Earth Engine" Remote Sensing 14, no. 16: 4056. https://doi.org/10.3390/rs14164056
APA StyleLiu, Y., & Wang, J. (2022). Revealing Annual Crop Type Distribution and Spatiotemporal Changes in Northeast China Based on Google Earth Engine. Remote Sensing, 14(16), 4056. https://doi.org/10.3390/rs14164056