Abstract
Feature-based target detection in synthetic aperture radar (SAR) images is required for monitoring situations where it is difficult to obtain a large amount of data, such as in tactical regions. Although many features have been studied for target detection in SAR images, their performance depends on the characteristics of the images, and both efficiency and performance deteriorate when the features are used indiscriminately. In this study, we propose a two-stage detection framework to ensure efficient and superior detection performance in TSX images, using previously studied features. The proposed method consists of two stages. The first stage uses simple features to eliminate misdetections. Next, the discrimination performance for the target and clutter of each feature is evaluated and those features suitable for the image are selected. In addition, the Karhunen–Loève (KL) transform reduces the redundancy of the selected features and maximizes discrimination performance. By applying the proposed method to actual TerraSAR-X (TSX) images, the majority of the identified clusters of false detections were excluded, and the target of interest could be distinguished.
1. Introduction
High-resolution synthetic aperture radar (SAR) systems have been widely used to monitor various regions for civilian and military purposes. In particular, because radar can monitor vast areas, regardless of day or night or weather conditions [1], the SAR system is very effective in surveilling targets of interest, such as tanks and transporter erector launchers (TEL), within a short time. However, SAR images have raised numerous false alarms owing to natural and cultural clutter as well as the targets of interest. Recently, a neural-network-based approach has been proposed for distinguishing only the objects of interest from wide-area SAR images [2]. However, teaching the neural network requires large amounts of training with SAR images against the objects of interest, which is expensive and time-consuming compared to the relatively easy-to-obtain optical images. Therefore, it is challenging to obtain sufficient training SAR images for the targets of interest in real-life situations, which demands a new paradigm for detecting the targets of interest from SAR images.
To discriminate targets from SAR images with heavy clutter responses, it is essential to remove false alarms owing to noise and speckle, as well as to discriminate the targets of interest from natural and artificial clutter. In general, the target detection process for SAR images consists of speckle reduction, constant false-alarm rate (CFAR) detection, clustering, and discrimination. Various techniques have been devised for preprocessing (i.e., speckle reduction, CFAR detection, and clustering) prior to the discriminator. In the discriminator, various features have been proposed and evaluated in terms of the detection performance of targets of interest from a SAR image with a reduced number of false alarms after preprocessing.
The speckle phenomenon causes many irregular pixels with high-intensity fluctuations, owing to interference between multiple scatterers in a single resolution cell. Strong speckles in a SAR image can produce many false alarms for conventional detectors that base their identifications on intensity [3]. Thus, speckle reduction must precede the detection of target pixels, and so various filters have been devised to reduce the speckles in SAR images. Local filters, such as the mean filter, median filter, Lee filter, and enhanced Lee filter, adjust the value of the target pixels by referring to the values of the neighboring pixels within a short calculation time [4,5]. In addition, a nonlocal mean filter or deep learning-based method enables precise speckle reduction by considering all pixels in the entire SAR image [6]. After speckle reduction, the pixels of the potential target can be detected. Scatterers on the desired targets in the SAR image are assumed to be stronger than those in background clutter scenes. Thus, these target pixels can be detected by the CFAR detector, based on pixel intensity. To date, various CFAR detectors have been proposed, including fixed threshold (FT), cell-averaging (CA), and ordered statistic (OS) CFAR, which can be easily extended to two dimensions for SAR images [7,8].
The detected pixels must be clustered into individual objects to calculate the features for discriminating targets from clutter. Therefore, the clustering process aims to construct a single cluster for each target. Various clustering algorithms have been developed, such as the K-nearest neighbor (KNN) and K-means algorithms. However, using them for SAR target detection is impractical because the number of clusters (i.e., targets) must be determined a priori [9,10]. Because the number of targets of interest is generally unknown in a real-life situation, the clustering stage should be able to identify the desired target clusters, even without such information. Hence, a suitable approach for target detection in SAR images may involve mean-shift algorithms or density-based spatial clustering of applications with noise (DBSCAN) [11,12].
To determine whether potential target clusters identified via a clustering algorithm originate from the desired targets of interest or from false alarms due to natural or artificial clutter, the discrimination stage should exploit some suitable features for this task. Features refer to the various qualities that can separate the target and clutter in the feature space. In other words, useful target-discriminating features should have similar values between targets, while targets and clutter should have different values. However, the features of artificial clutter are often similar to those of the targets, making them difficult to distinguish. To overcome this problem, several features with a good discrimination capability between targets and clutter have been introduced at the MIT Lincoln Laboratory [13]. In [14], some additional features based on the projected length (PL) of a target were also presented for a moving and stationary target acquisition and recognition (MSTAR) dataset. Even though all these features can be effective in terms of target detection, their performance significantly fluctuates depending on the specifications and configuration of the SAR system, such as the resolution and look-angle. Therefore, a detection framework that applies specifically to SAR images is required.
In this study, we propose a two-stage detection framework to ensure efficient and high detection performance in TSX images. We analyzed the performance of the features for distinguishing targets and clutter in TerraSAR-X (TSX) images and selected those features suitable for target discrimination. Moreover, we propose an efficient two-stage target discrimination scheme for clustered pixels in TSX images. In the proposed scheme, speckle reduction, based on the Lee filter, and pixel detection, based on FT-CFAR, are performed a priori, followed by building clusters of targets using the DBSCAN algorithm in the SAR image. Although the SAR image is designed, there are many clusters owing to the false alarms related to the remaining speckles, background noise, and clutter. Subsequently, a discrimination stage was required to reduce the number of false alarms. The proposed discrimination stage consists of two sequential steps: a coarse discrimination step (CDS) and a fine discrimination step (FDS). The CDS quickly finds the desired clusters corresponding to the targets of interest and results in reducing the majority of the false-alarm clusters. Then, FDS is performed only against those clusters that passed the CDS based on the selected features with good discrimination performance. In FDS, feature generation based on the Karhunen–Loève (KL) transform is adopted to maximize the discriminatory performance in the feature space [15].
The remainder of this paper is organized as follows. In Section 2, the proposed two-stage target-discrimination scheme is presented. In Section 3, the experimental results are provided using real TSX images, and they are analyzed in terms of detection performance. Finally, Section 4 and Section 5 present the discussion and conclusions, respectively.
2. Proposed Method
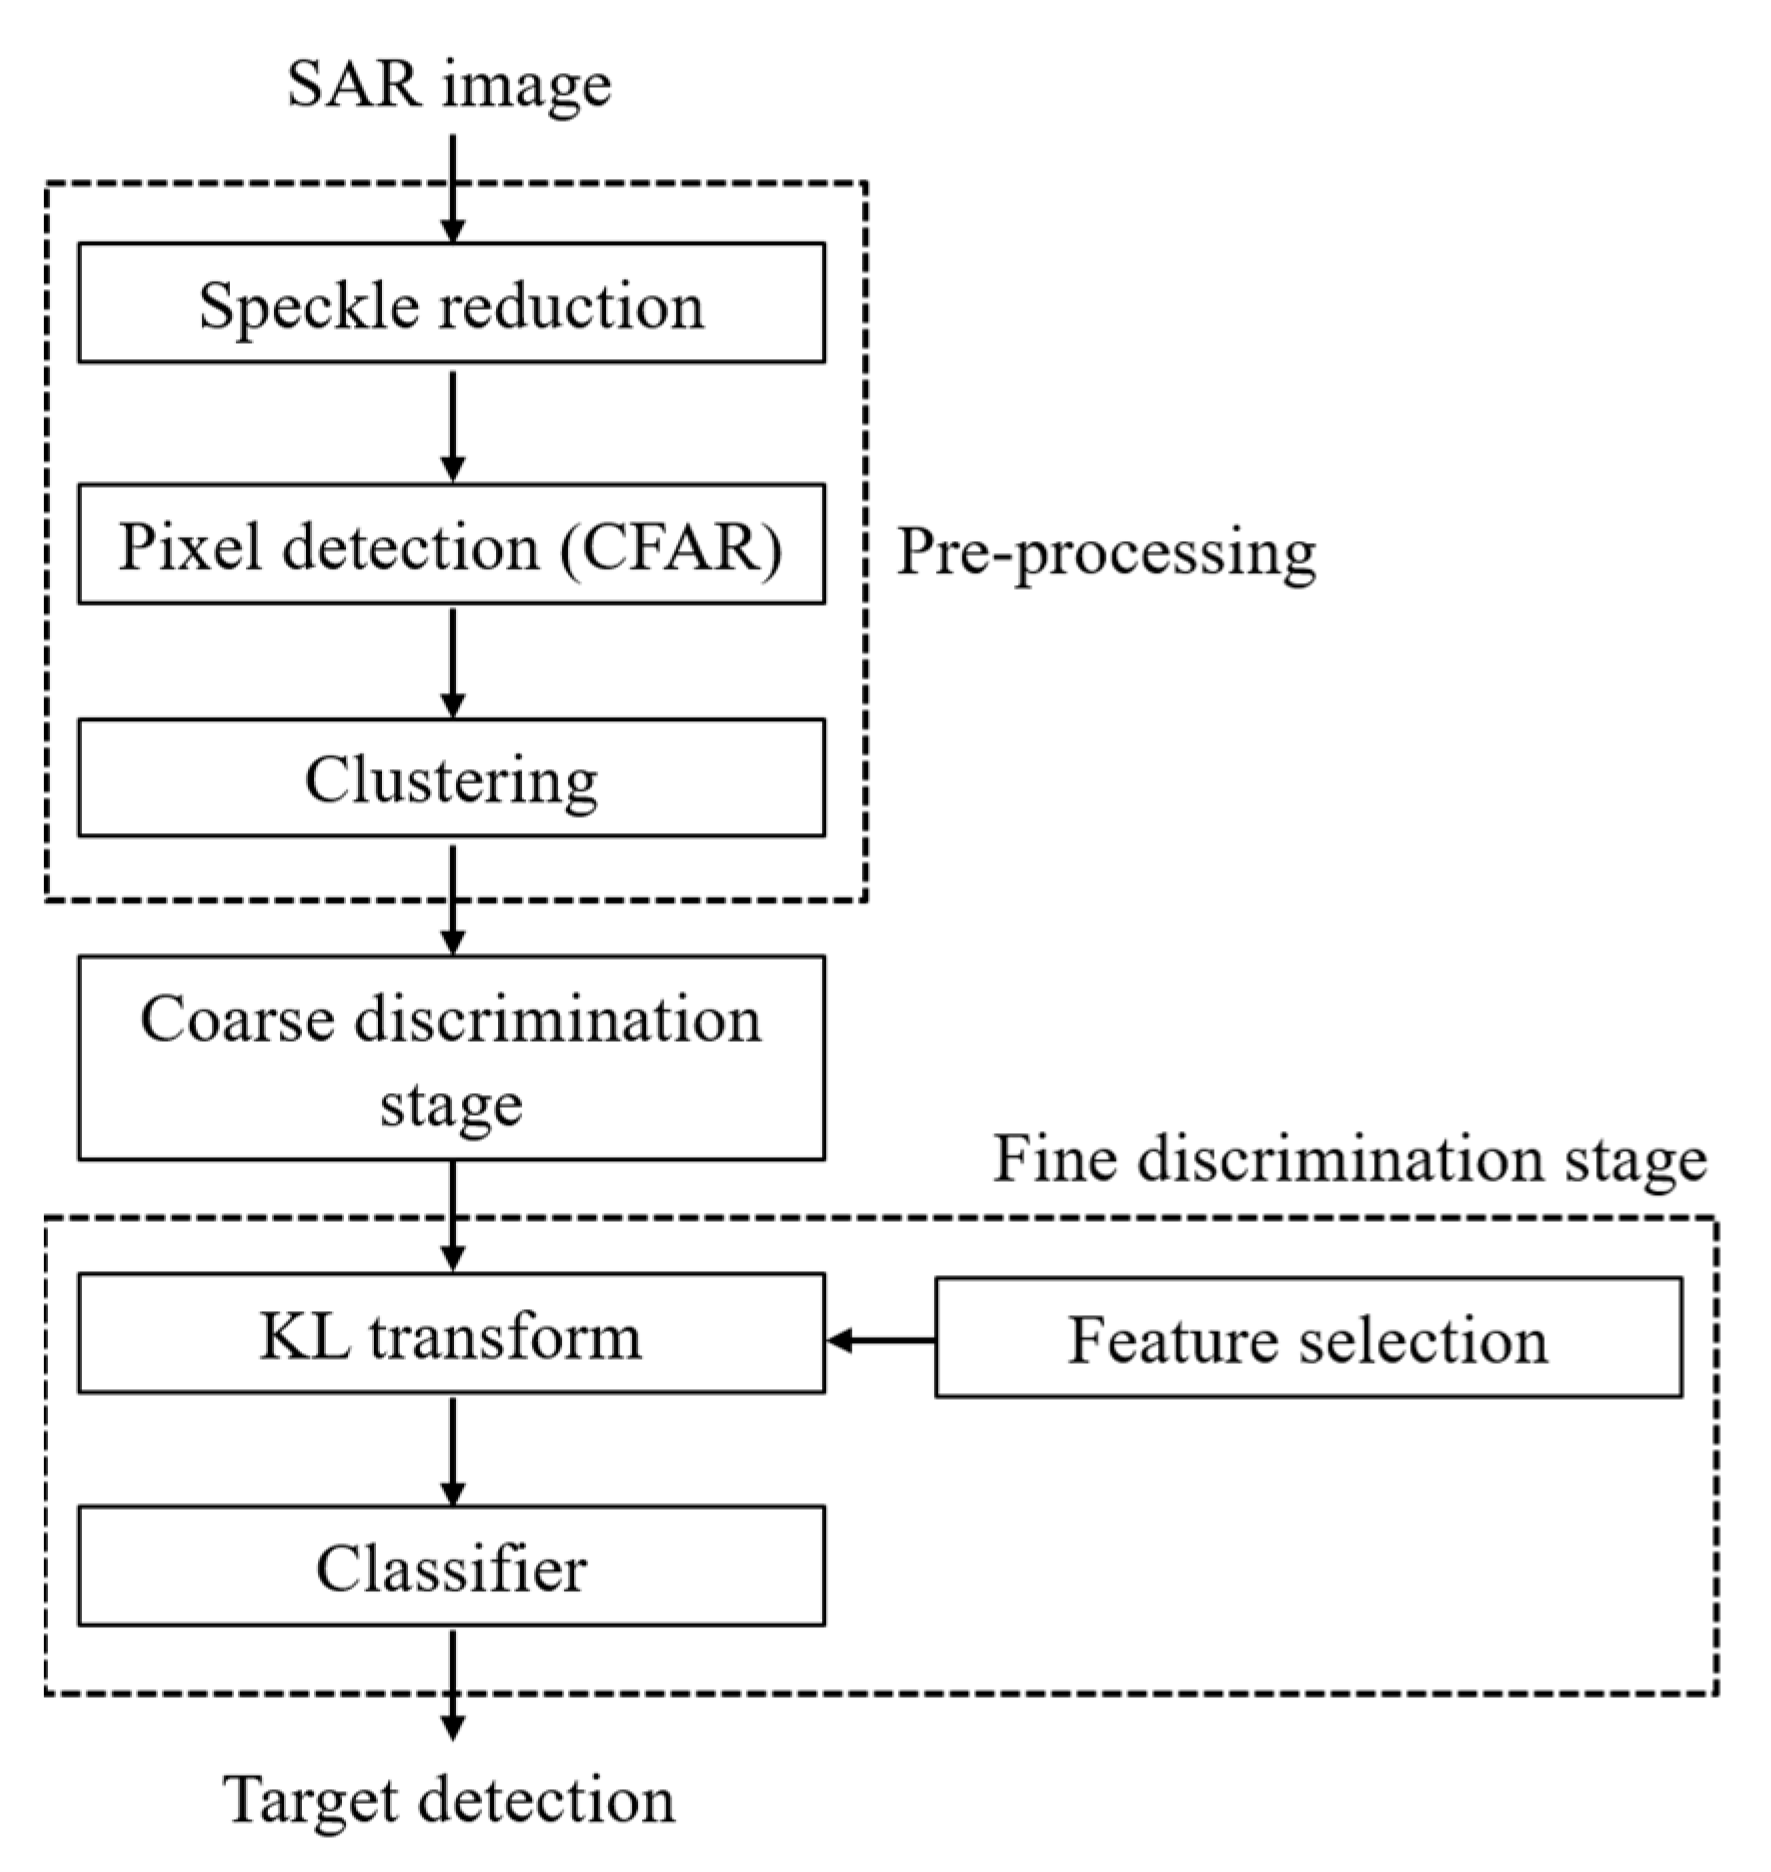
The overall process of the proposed method is illustrated in Figure 1. The preprocessing stage aims to form clusters of target candidates as soon as possible and consists of three steps: speckle reduction, pixel detection, and clustering. Any speckle reduction filter is applicable, and the Lee filter [4], which does not require much computation, was used in this study. Two-dimensional (2D) CFAR methods, such as CA-CFAR and OS-CFAR, are generally used to find the peaks in SAR images. However, these 2D CFAR methods are relatively time-consuming, and many targets are irregularly present in the image of interest. Therefore, applying a fixed threshold value to an entire scene is the most efficient solution. TCFAR, the threshold for the FT-CFAR method, is obtained based on the Rayleigh distribution, as follows [15]:
where PFA is the false alarm probability and E(I) is the average magnitude of the image. In addition, because DBSCAN does not require the number of clusters in advance, it is suitable as a clustering technique [12].
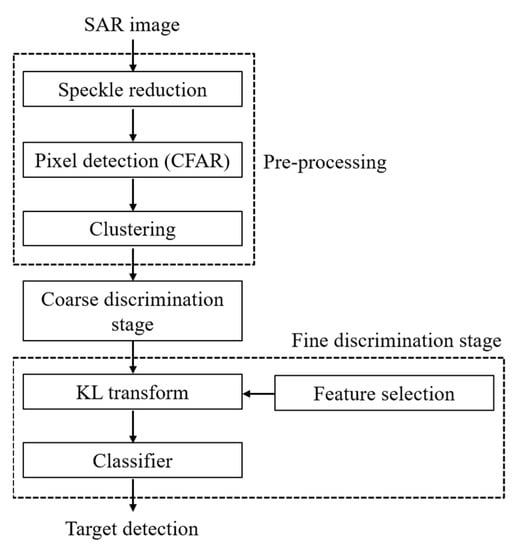
Figure 1.
Flowchart of the proposed target detection scheme, consisting of the coarse discrimination step and the fine target-discrimination step.
After the preprocessing stage, the proposed target detection scheme consists of CDS and FDS. As shown in Figure 1, the targets of interest are represented by large clusters. Speckle and natural clutter clusters, consisting of a small number of pixels, exist in the entire scene. Therefore, in the first step of the target detection scheme, the number of pixels constituting the cluster feature mass is used to filter the false alarms from the clusters. The threshold of mass, is determined by considering the resolution of the image and the size of the target of interest, and the clusters consisting of fewer pixels than the threshold are excluded from the target candidate:
where is the expected ratio of detected pixels in the target of interest, lh and lv are the horizontal and vertical lengths of the target, respectively, and Rr and Ra are the range and azimuth resolution of the SAR image, respectively. For example, if the smallest target of interest is a D7 Caterpillar bulldozer (2.4 m × 4.1 m), if the image resolution is 0.5 m × 0.2 m, and is 0.3, then Tmass becomes 29.5. Because the mass of a cluster is measured without a separate calculation process, the amount of computation required to measure the features of the incorrectly detected clusters can be significantly reduced.
Even though speckle reduction is performed before detecting target pixels using the CFAR detector, many pixels are incorrectly detected because of the natural clutter. Therefore, not only target clusters but also numerous clusters of false detections are formed due to clustering the detected pixels using DBSCAN. Because the clutter has different scattering characteristics and shapes from the targets, these clusters of false alarms can be distinguished using certain features. According to [13,14], various features for distinguishing the target of interest from the clutter have been studied, and the features considered in this study are standard deviation (STD), weighted-rank fill-ratio (WRFR), fractal dimension, mass, diameter, normalized rotational inertia, max CFAR, mean CFAR, percentage of bright CFAR, count, minimum projected length (MINPL), maximum PL (MAXPL), contrast of PL (CPL), average of min and max PL (AMMPL), average of PL (APL), error between the reference and PL (ERPL), squared error between the reference and PL (SERPL), energy of PL in the frequency domain (EPLF), squared energy of PL in the frequency domain (SEPLF), average of detected pixels (ADP), sum of detected pixels (SDP), and standard deviation of detected pixels (STDDP).
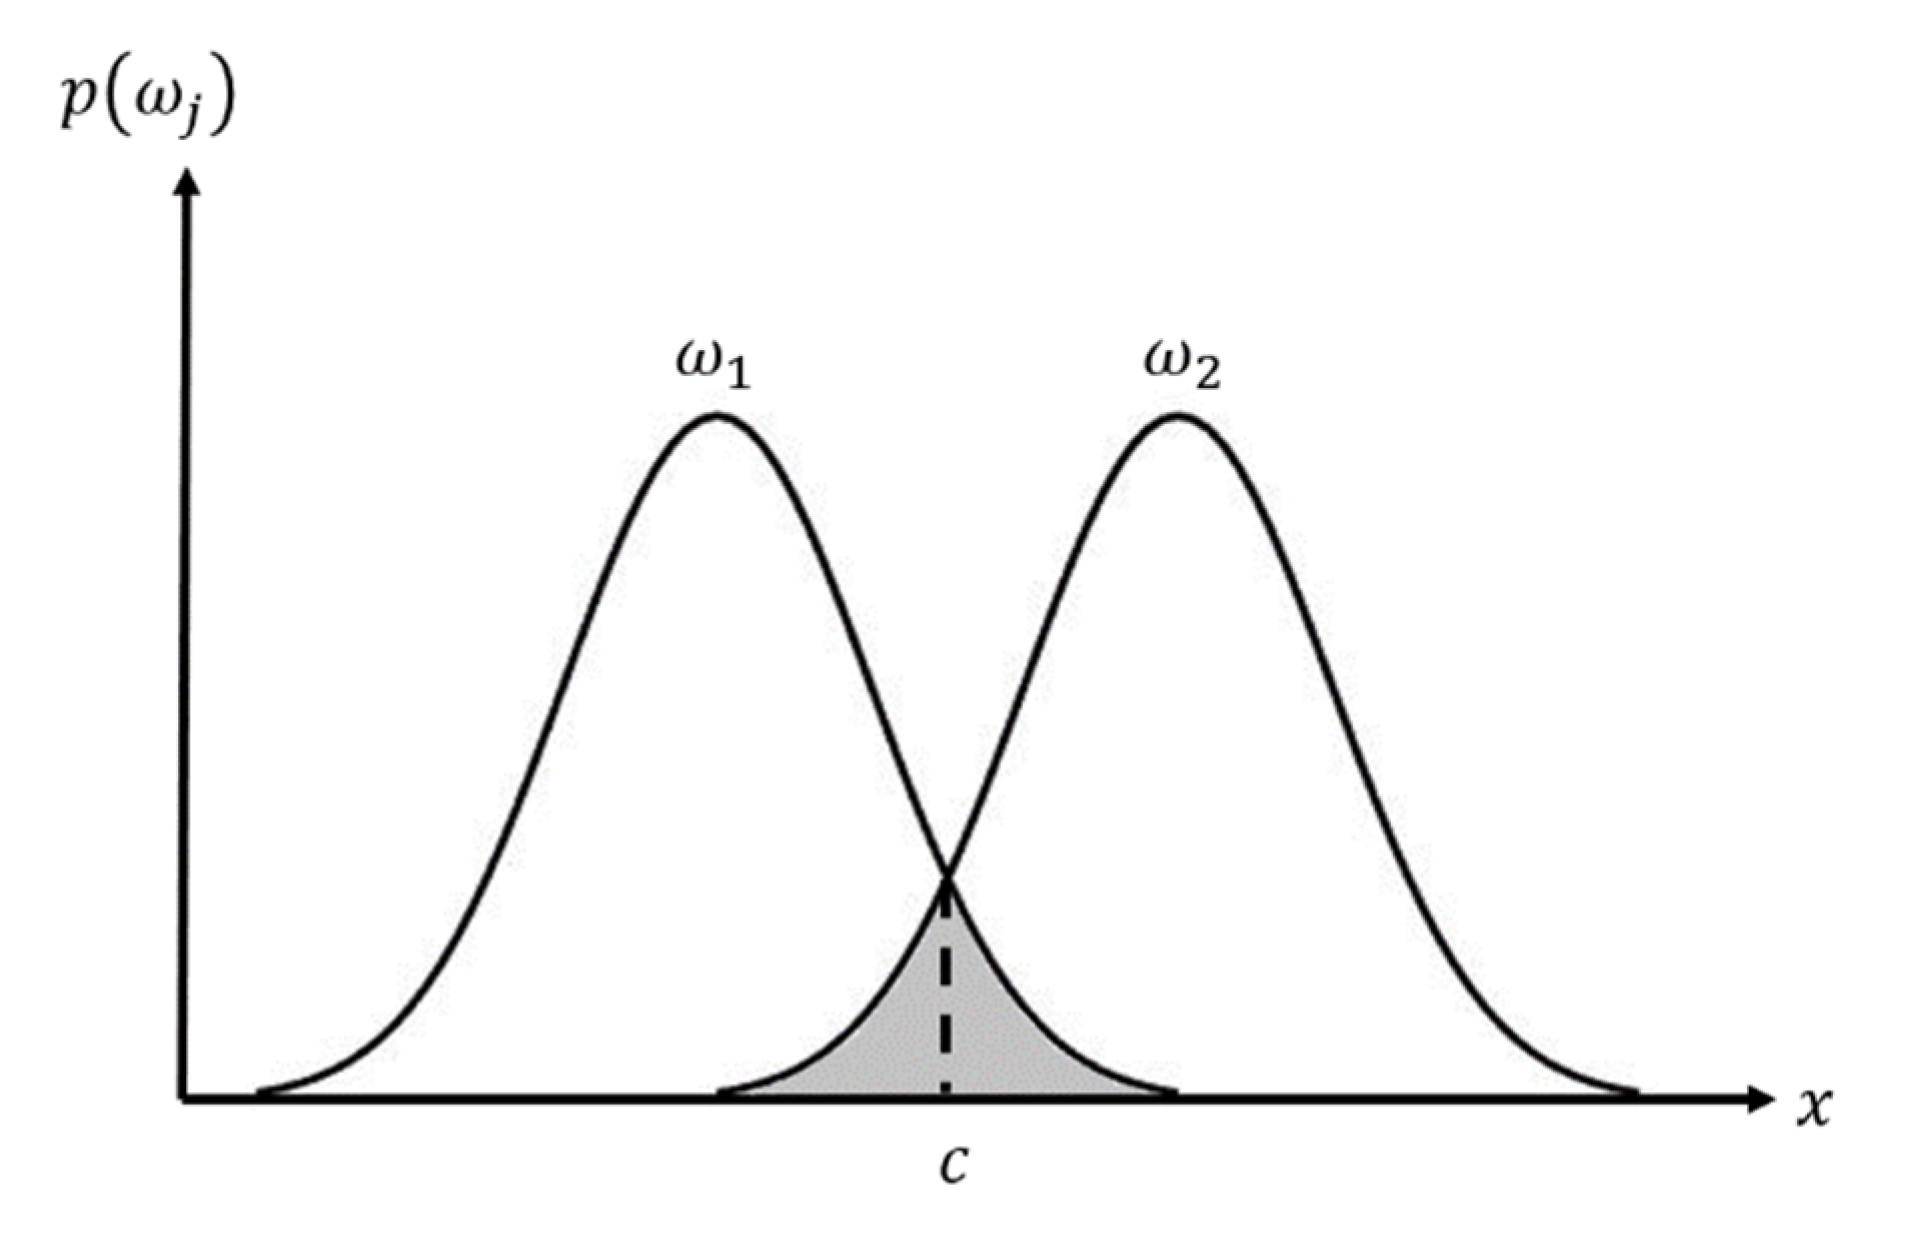
For the coarse discrimination result, clusters larger than Tmass are distinguished using FDS. In this step, the targets of interest and the clutter are discriminated against, based on the features introduced in [13,14]. However, the distribution of each feature differs according to the characteristics of the image. Thus, those features that effectively discriminate the targets of the TSX image should be selected. Therefore, to evaluate the discriminating performance of each feature, the overlap between the distributions of feature values for targets and the distribution of feature values for clutter is measured, as shown in Figure 2. The smaller the overlapped area between the two distributions, the better the distinguishing performance. The overlap l can be obtained as follows:
where is the feature value of class j, and c is a feature value in which the probabilities of the two distributions are equal.

Figure 2.
Overlap between the distributions of feature values for targets and the distributions of feature values for clutters.
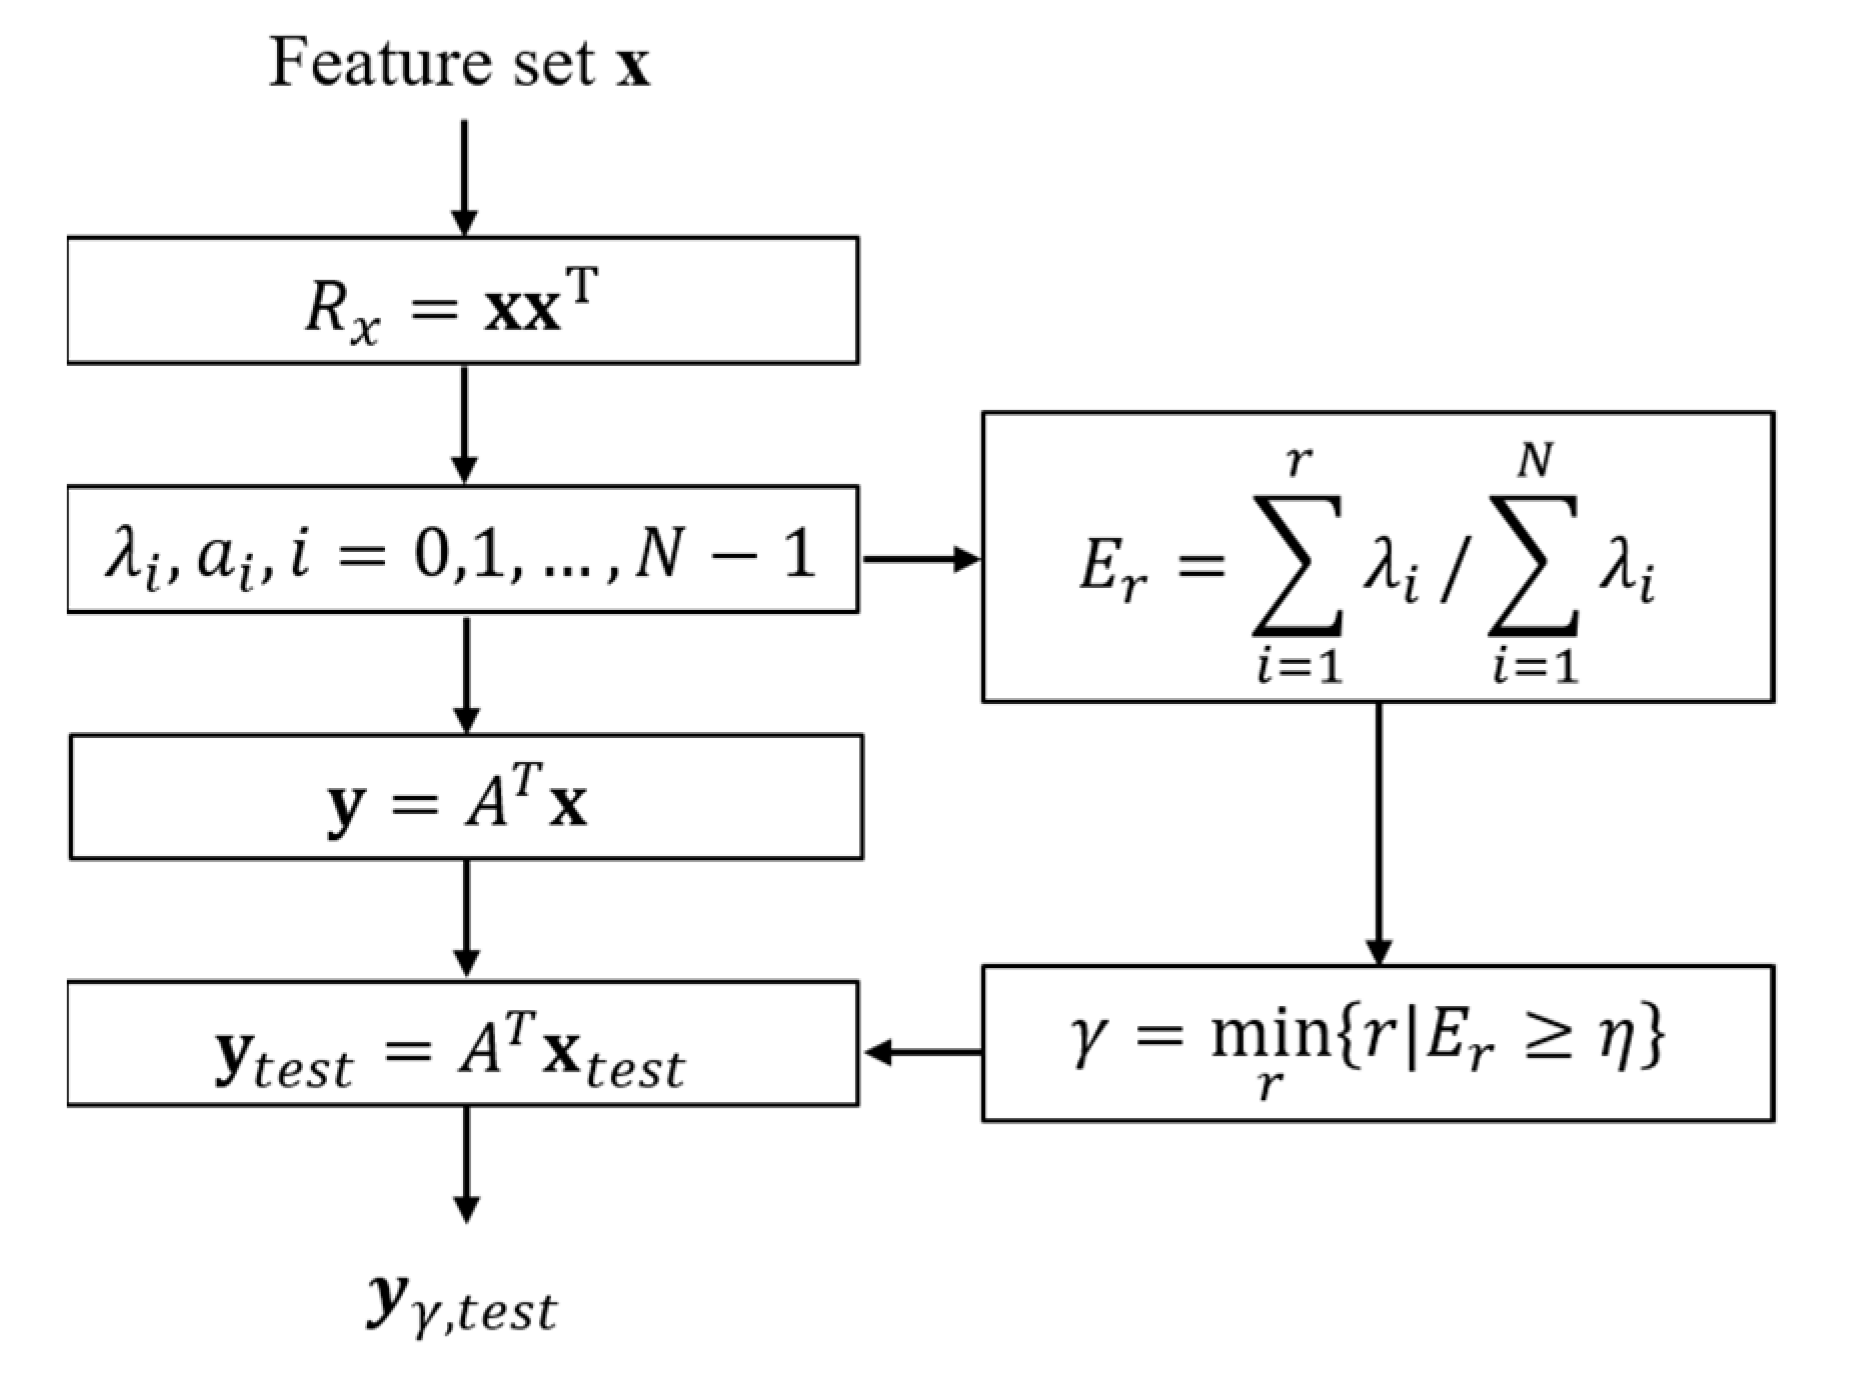
When multiple features are used, the separation ability of the features deteriorates if there is a dependency between them. In this situation, the KL transform is used to improve the separation performance by selecting independent features and removing the redundancy between the selected features [16,17]. For the feature set x, which was extracted from the training data, the feature set y, transformed to be mutually uncorrelated, is expressed as follows:
where A is an N × N transformation matrix. In addition, the correlation matrix of y, Ry, is given by:
where Rx is the correlation matrix of x. Because Rx is a symmetrical matrix, if the columns of matrix A are chosen as the orthonormal eigenvectors of Rx, ai, i = 0, 1, …, N − 1, then the resulting Ry is:
is a diagonal matrix with eigenvalues , corresponding to ai as the elements. Additionally, to exclude redundant features, the normalized sum of the top r eigenvalues Er is calculated thus, as in a previous paper [18]:
Then, the number of features utilized, , is determined as follows:
where is a constant between zero and one. Then, a generated feature set yr, composed of the features corresponding to the upper eigenvalues can be obtained. The feature values extracted from the detected clusters, xtest, can also be transformed by A to ytest on the same axis as y:
In addition, , which is composed of the features corresponding to the upper eigenvalues in , exists in the same feature space as ytest, allowing the discrimination of the target and clutter to be performed using a classifier. The process of performing KL transform and obtaining is described in detail in Figure 3.

Figure 3.
Flowchart of the proposed target detection scheme, consisting of the coarse discrimination step and the fine target discrimination step.
3. Results
3.1. Experimental Settings
In this study, target detection is performed on TSX images of Sejong Lake Park and the surrounding areas located in Sejong-si, Korea, with a resolution of 0.5 m × 0.2 m. Instead of military targets, such as tanks and TELs, large vehicles commonly found in urban areas are defined as the targets of interest. The training dataset consisted of 2420 target chips and 2705 artificial clutter chips extracted from the TSX images for different regions, each with a size of 128 × 128 pixels.
To evaluate the performance of detection and discrimination, precision, recall, and the F1-score are used, which can be defined as follows:
where TP is the true positive and represents the number of detected clusters corresponding to the target of interest. FP is the false positive and represents the number of detected clusters corresponding to the clutter. FN is the false negative and is the number of target clusters mistaken for clutter at each processing step. Moreover, to evaluate the clutter discrimination performance of each step, the probability of removing false detection, Pc, is defined as follows:
where Nc is the total number of clusters that are not targets of interest and Dc is the number of false detected clusters remaining after each detection step.
The experiments were conducted using a computer with an Intel i7-6700 CPU, with 3.4 GHz and 64 GB of memory.
3.2. Preprocessing and Coarse Discrimination Step
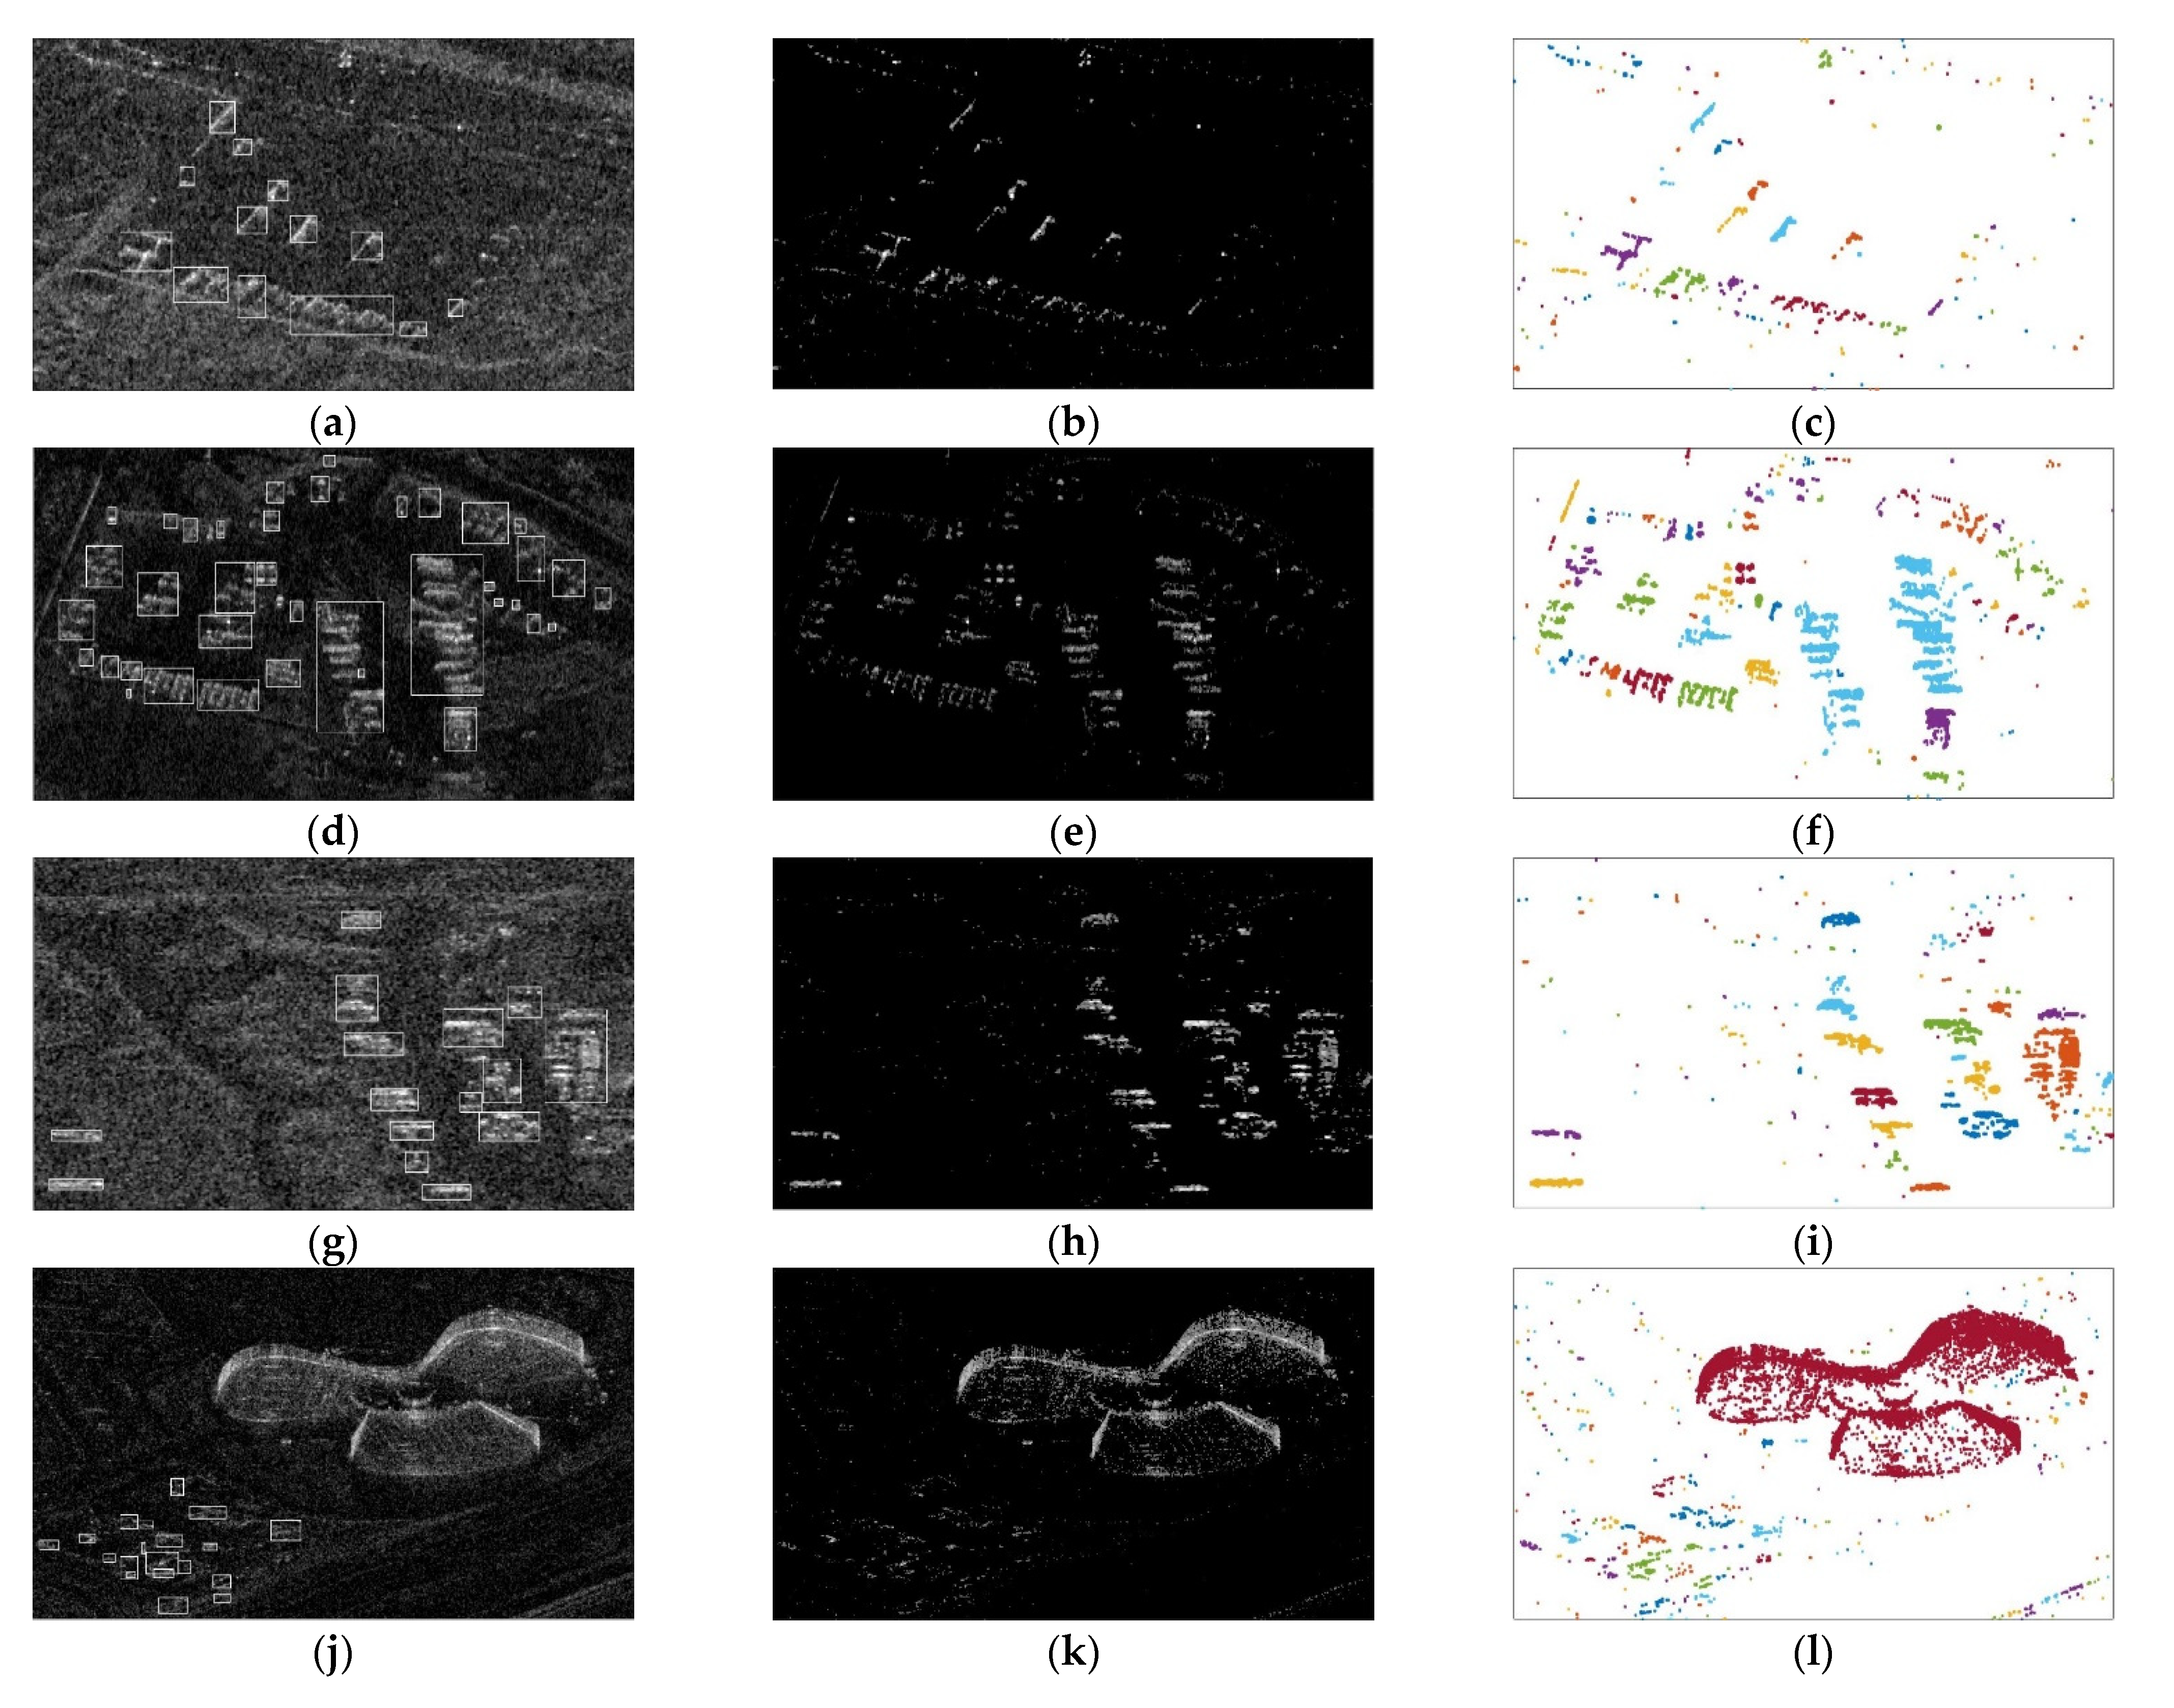
The proposed method was applied to four TSX images with the targets of interest. Figure 3 shows the original SAR image for which the target detection was performed, along with the preprocessing results for each image. A Lee filter with a 3 × 3 window was applied for despeckling, and an FT-CFAR detector with a false alarm probability of 10−2 was applied for pixel detection. The detected pixels were clustered using DBSCAN, then the clusters corresponding to different objects were expressed in different colors. As parameters of DBSCAN, the neighborhood range, , was set to 10, and the minimum number of points in the neighborhood, MinPts, was set to 3. As shown in Figure 4, there are many clusters of false detections owing to the clutter, as well as the targets of interest in the image.
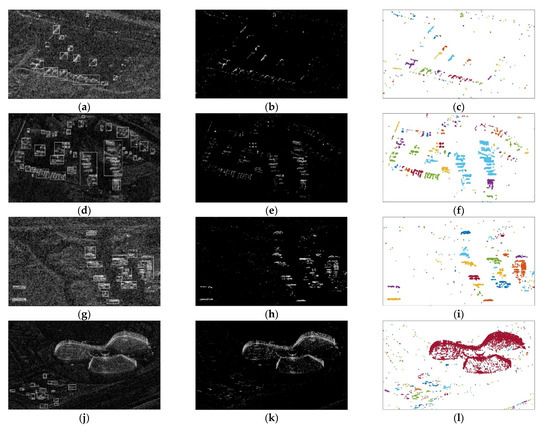
Figure 4.
Original SAR images and their corresponding detection and clustering results: (a,d,g,j) original SAR images and ground truths (white boxes) of the targets; (b,e,h,k) despeckling and pixel detection results using Lee filter and FT-CFAR; (c,f,i,l) clustering results using DBSCAN.
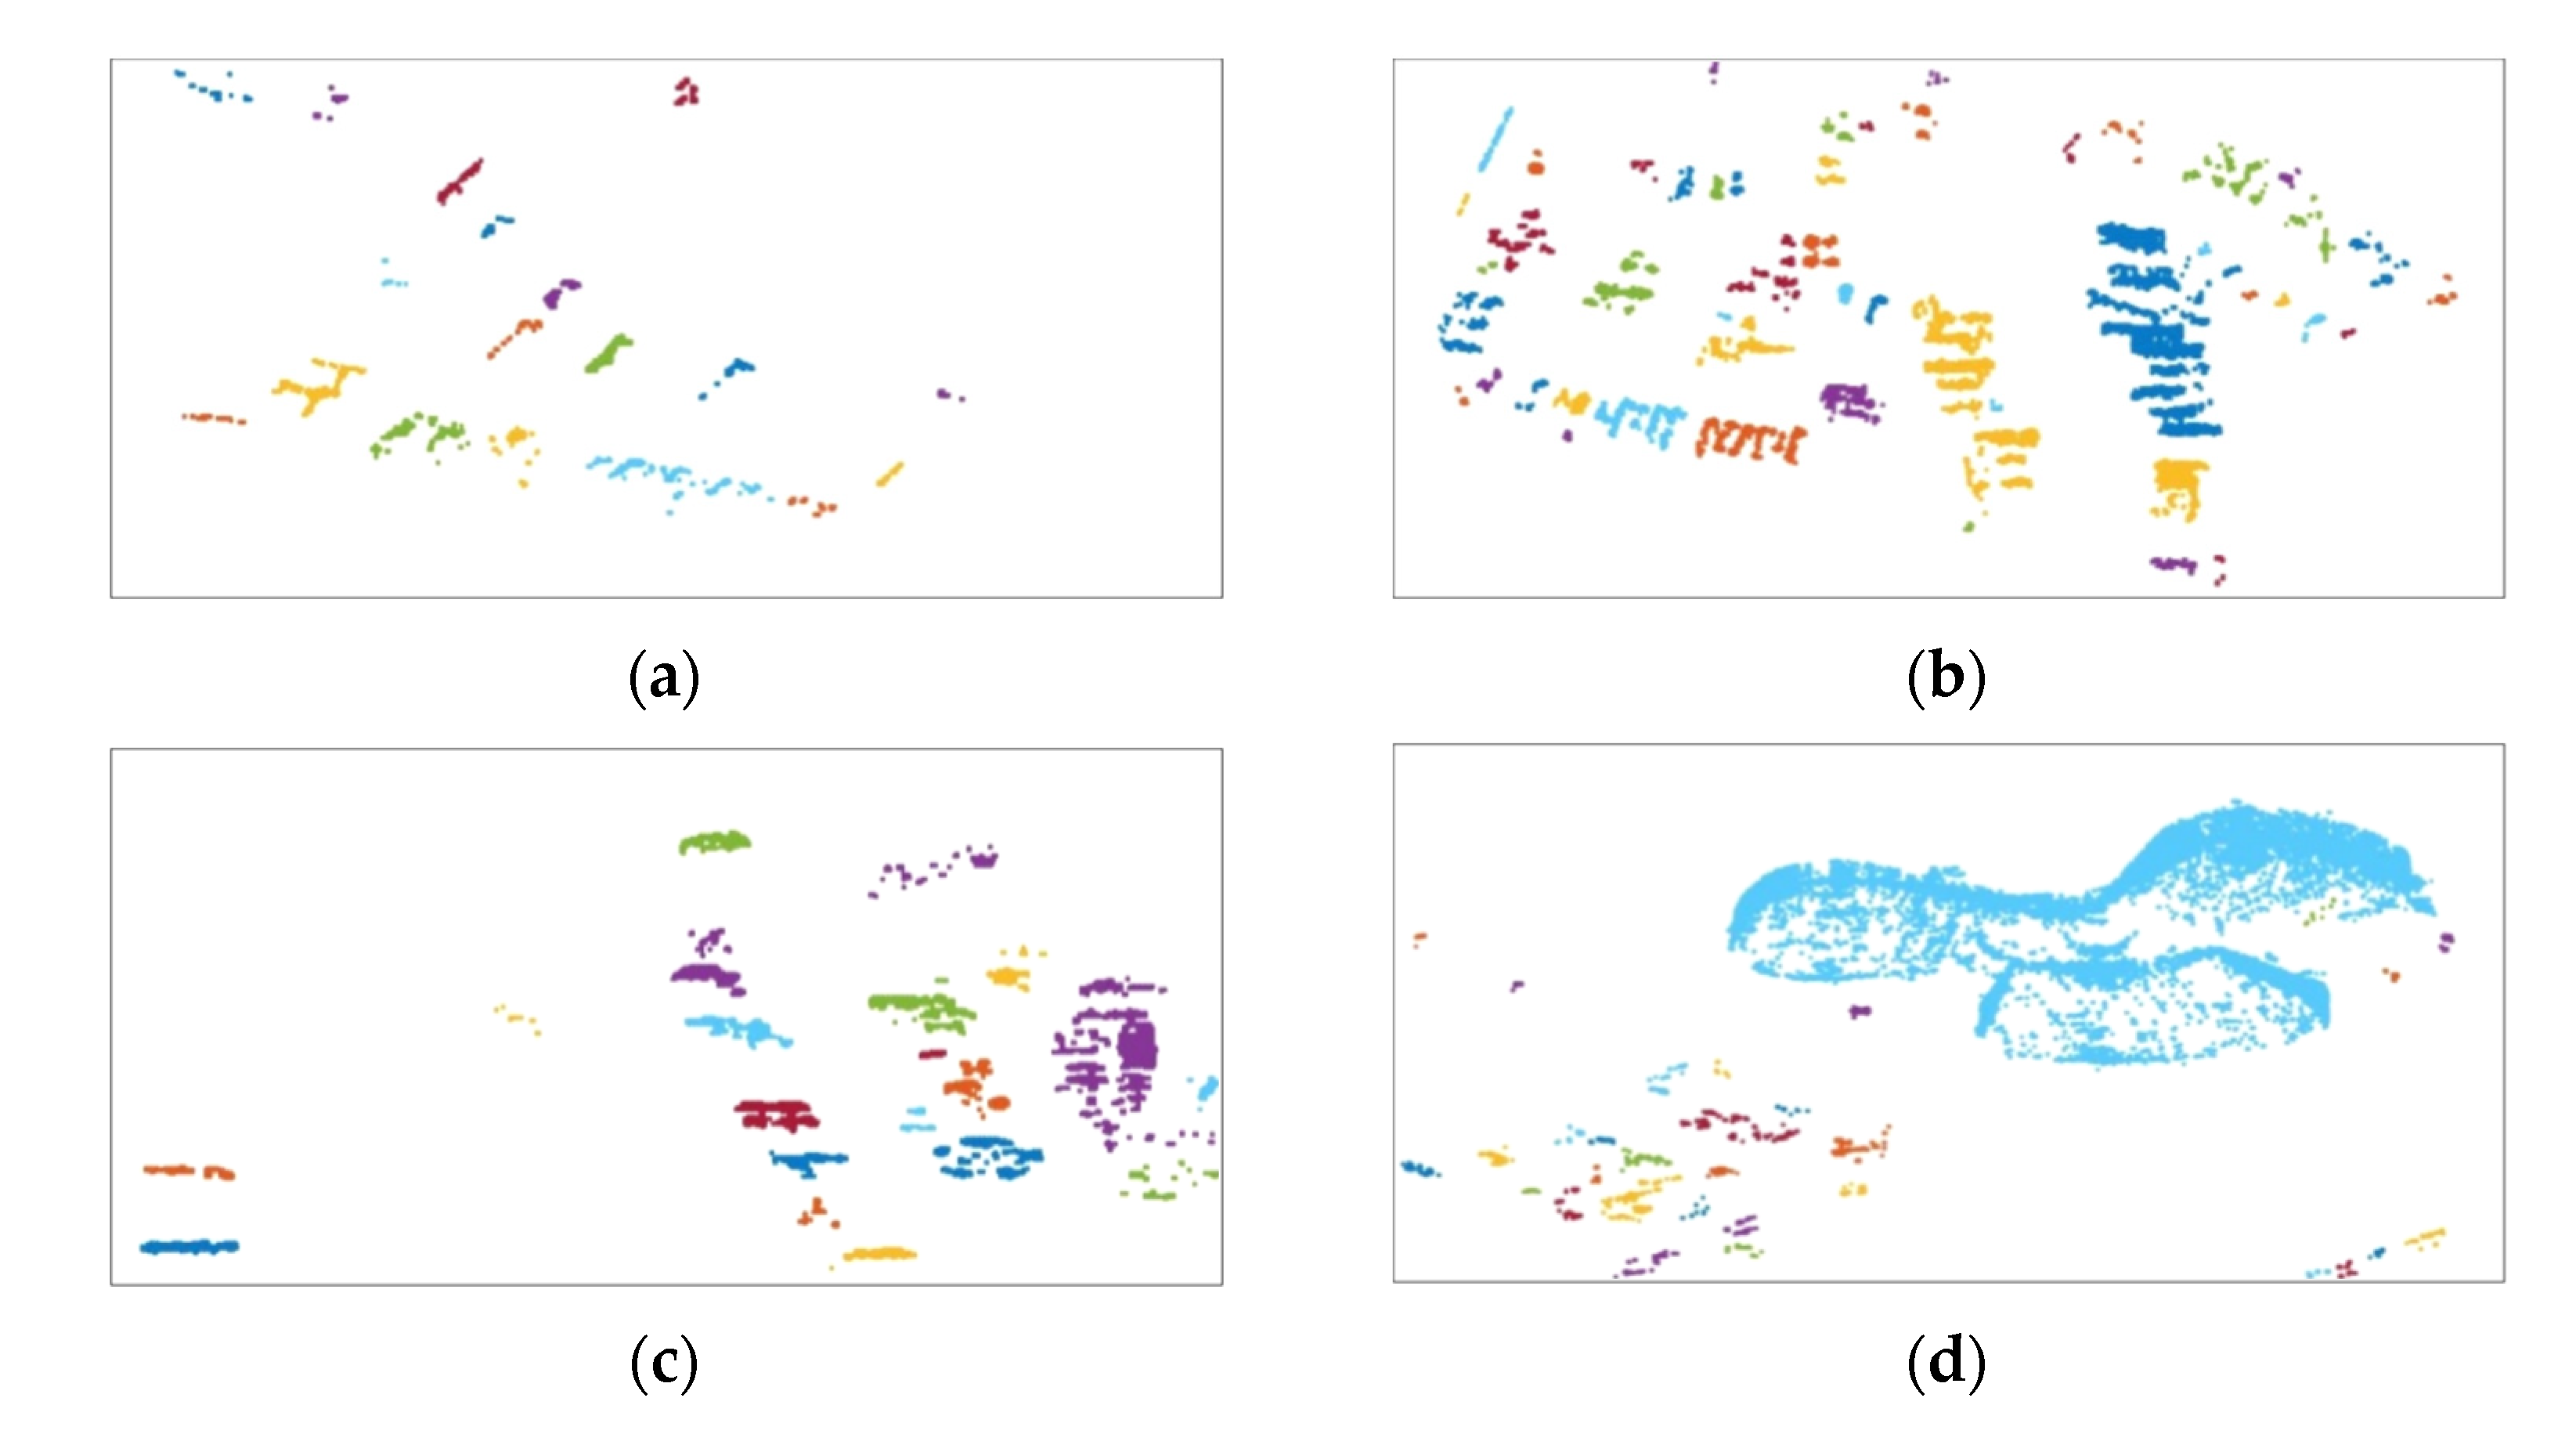
After preprocessing, CDS was performed, based on the mass feature. The threshold, , was set to 29.5, and the results of the clutter exclusion are shown in Figure 5. In all images, the number of small false detection clusters was significantly reduced, and all the clusters removed at this stage had been incorrectly detected. The average probability of clutter exclusion is 0.9196, and the specific detection performance is presented in Table 1.

Figure 5.
Results after the coarse discrimination step. Each cluster is indicated by a different color. (a) Scene 1; (b) Scene 2; (c) Scene 3; (d) Scene 4.

Table 1.
Performance of the coarse discrimination step.
3.3. Fine Discrimination Step
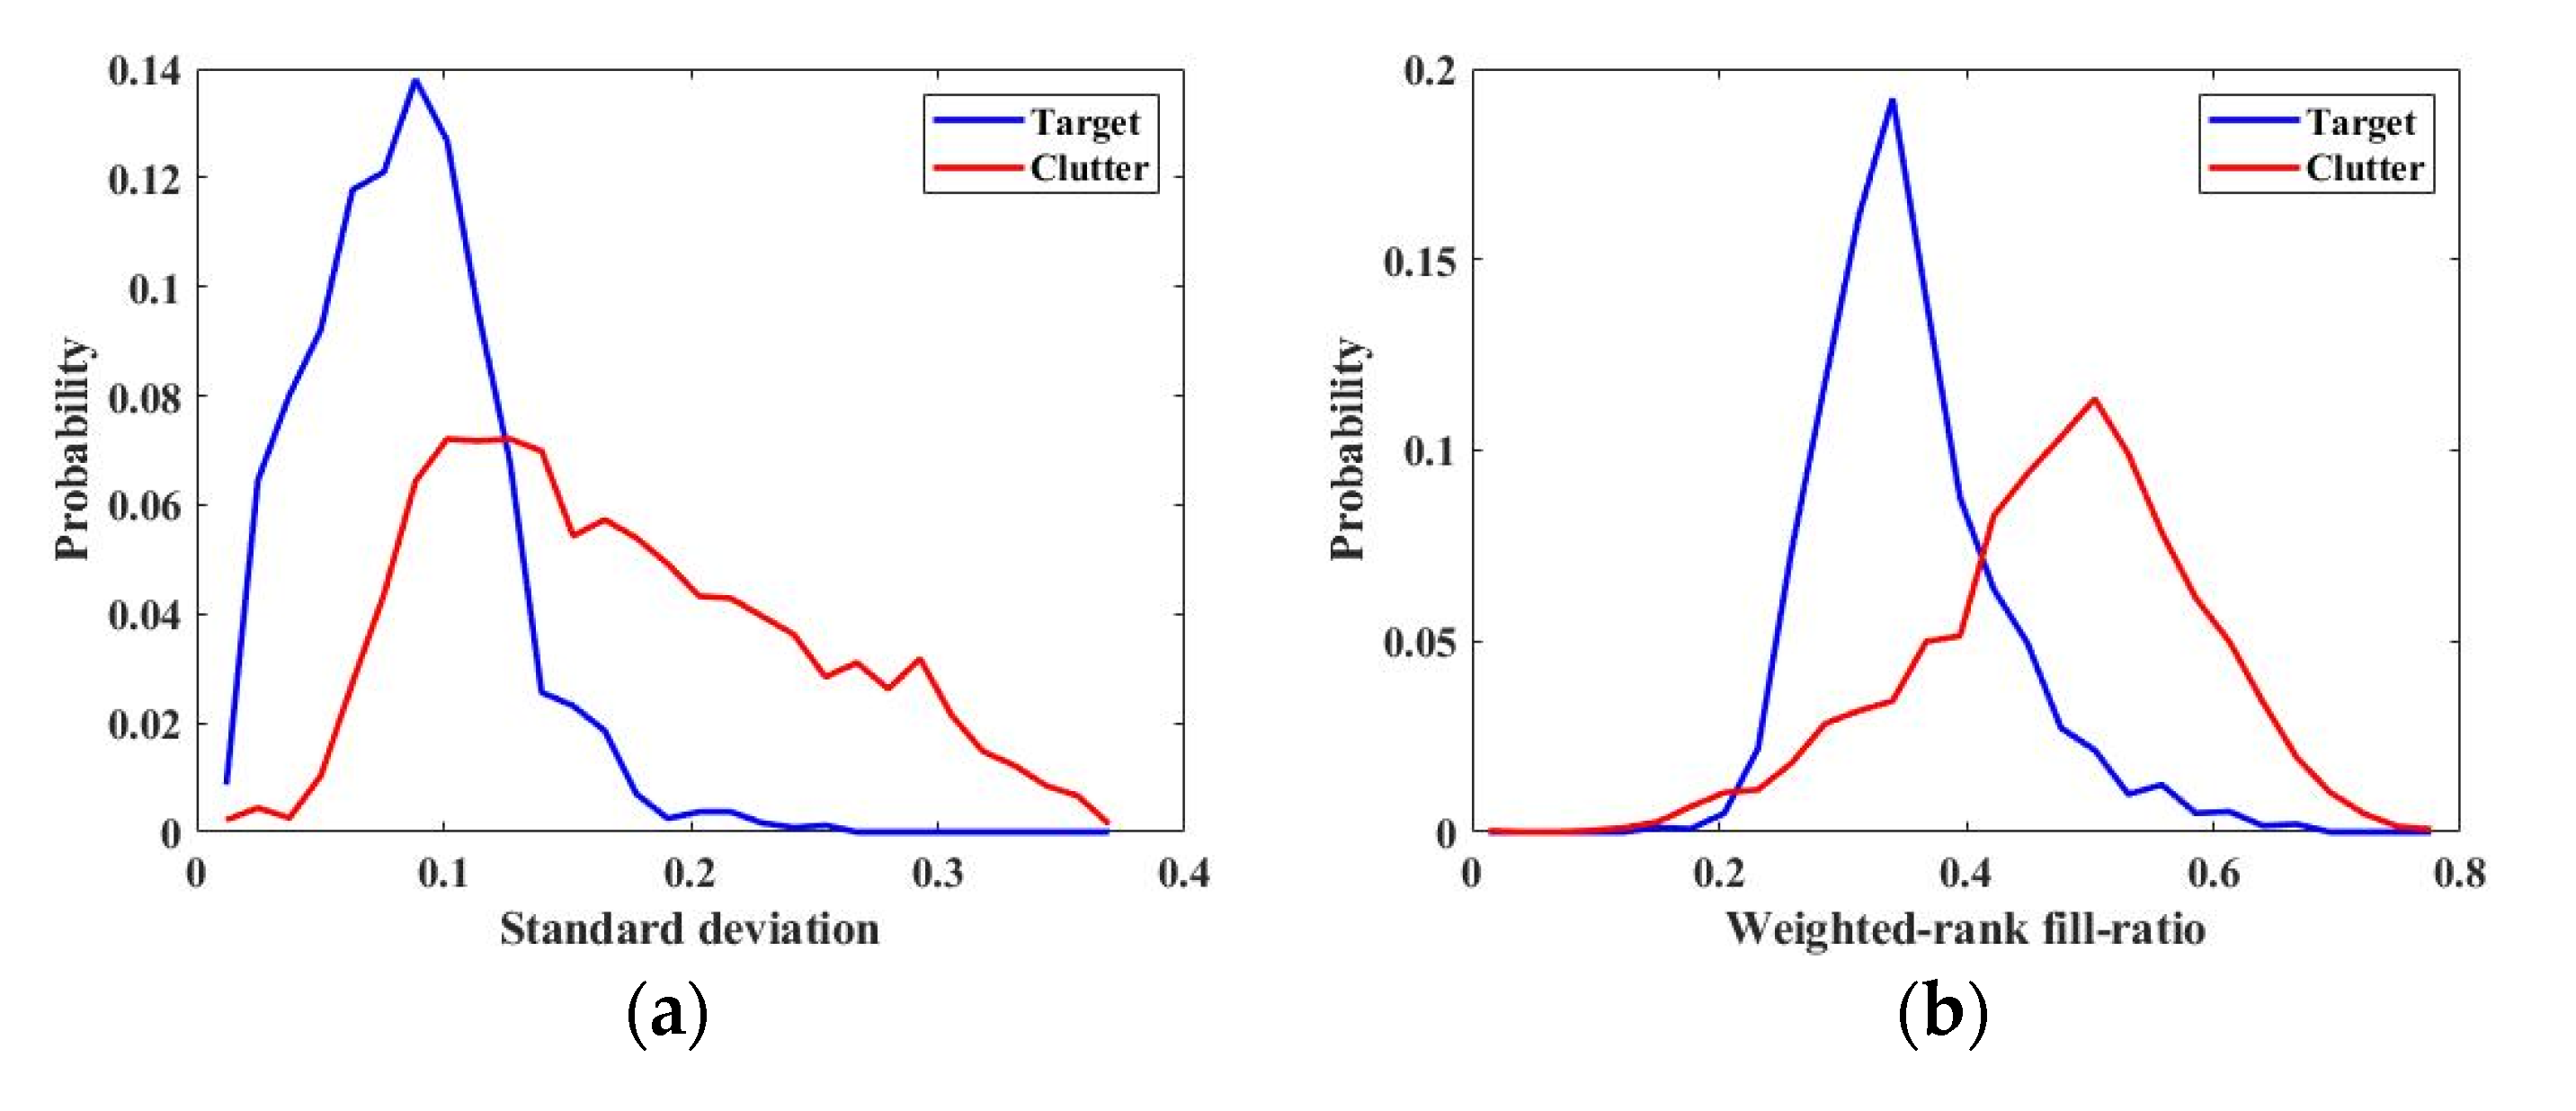
To select the features that are effective in distinguishing the target from clutter, the separation performance of the features was evaluated based on the training data. The values of all features were extracted for each chip of the training data, and the distributions of targets and clutters for each feature were obtained using a normalized histogram. Figure 6 shows the distributions of standard deviation and weighted-rank fill-ratio as an example. In addition, for all features, the area overlapping the distributions of the target and clutter, l, was measured (Table 2). It is considered that the feature with a lower overlapping area, l, has better separation performance, and features with l less than 0.6 were selected based on Table 2. As a result, seven features (standard deviation, weighed-rank fill-ratio, max CFAR, mean CFAR, ADP, SDP, and STDDP) were available for target-clutter discrimination.

Figure 6.
Examples of distributions obtained from training data. (a) Distributions with respect to standard deviation; (b) distributions with respect to the weighted-rank fill-ratio.
Table 2.
Measured overlapping area between distributions of the target and clutter with respect to each feature.
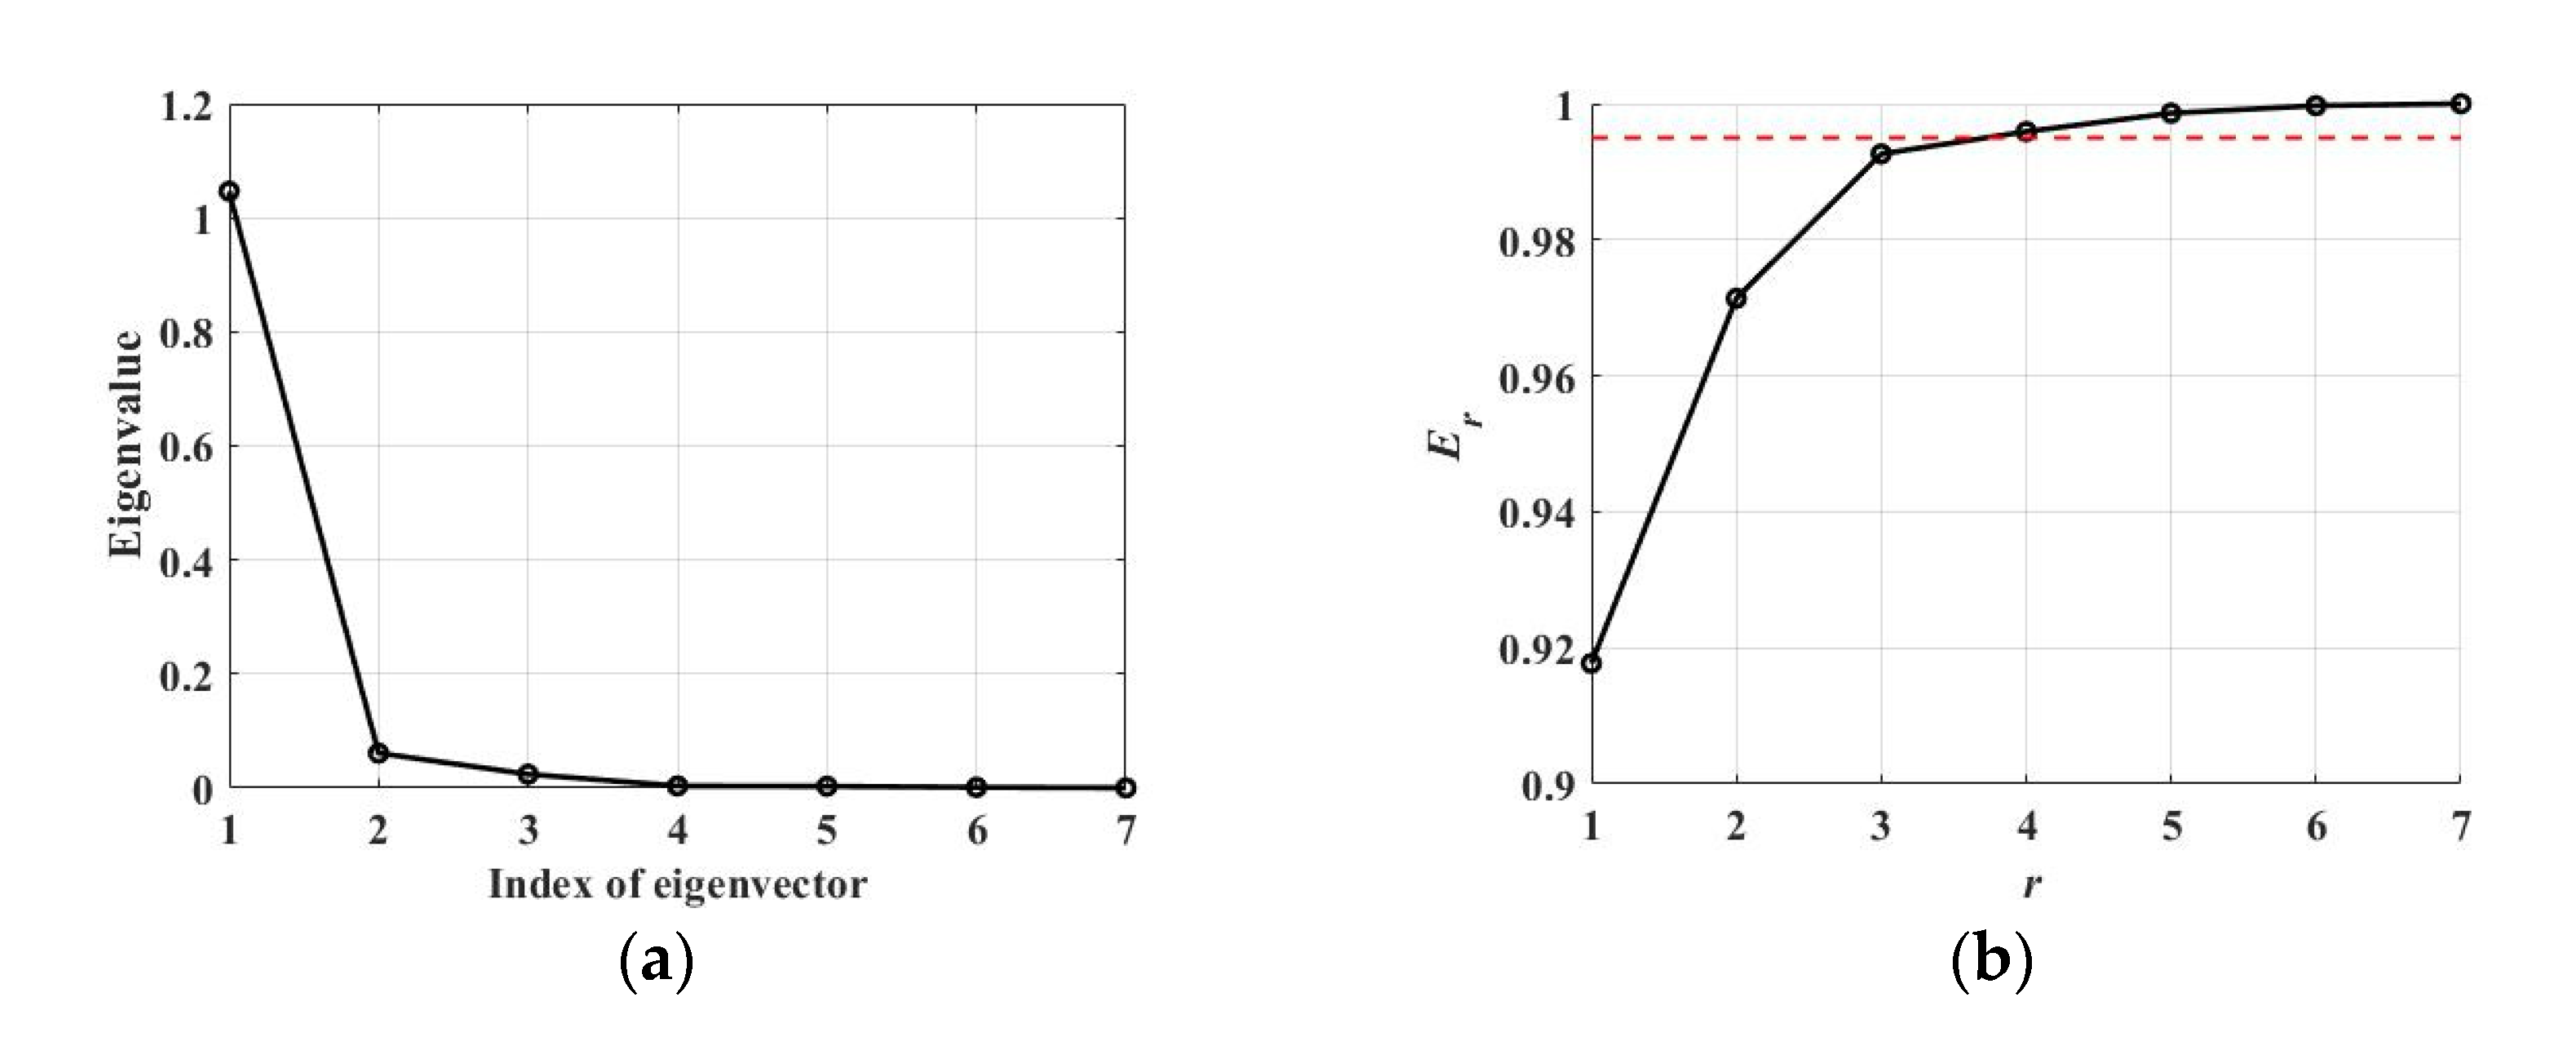
Although features with excellent separation performance have been selected, using all these features is ineffective because of their redundancy. Therefore, from the training feature set, x, the feature space was conducted with significant features by using the KL transform. was set to 0.995, and the eigenvalues and normalized sum of the top r eigenvalues Er are shown in Figure 7. Then, as shown in Figure 7b, the number of features utilized, , was determined to be three by Equation (8). In other words, three features are sufficient to discriminate between the target of interest and the clutter, and the features corresponding to the top three eigenvalues are standard deviation, weighed-rank fill ratio, and STDDP. Therefore, a feature space is formed using vectors corresponding to the features in set y that are transformed by A.
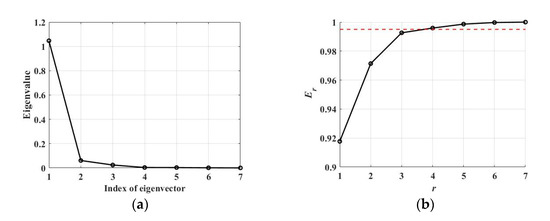
Figure 7.
Eigenvalues and normalized sum of the eigenvalues. (a) Magnitude of eigenvalues corresponding to eigenvectors of matrix A; (b) normalized sum of top r eigenvalues. The threshold, is indicated in red dotted line.
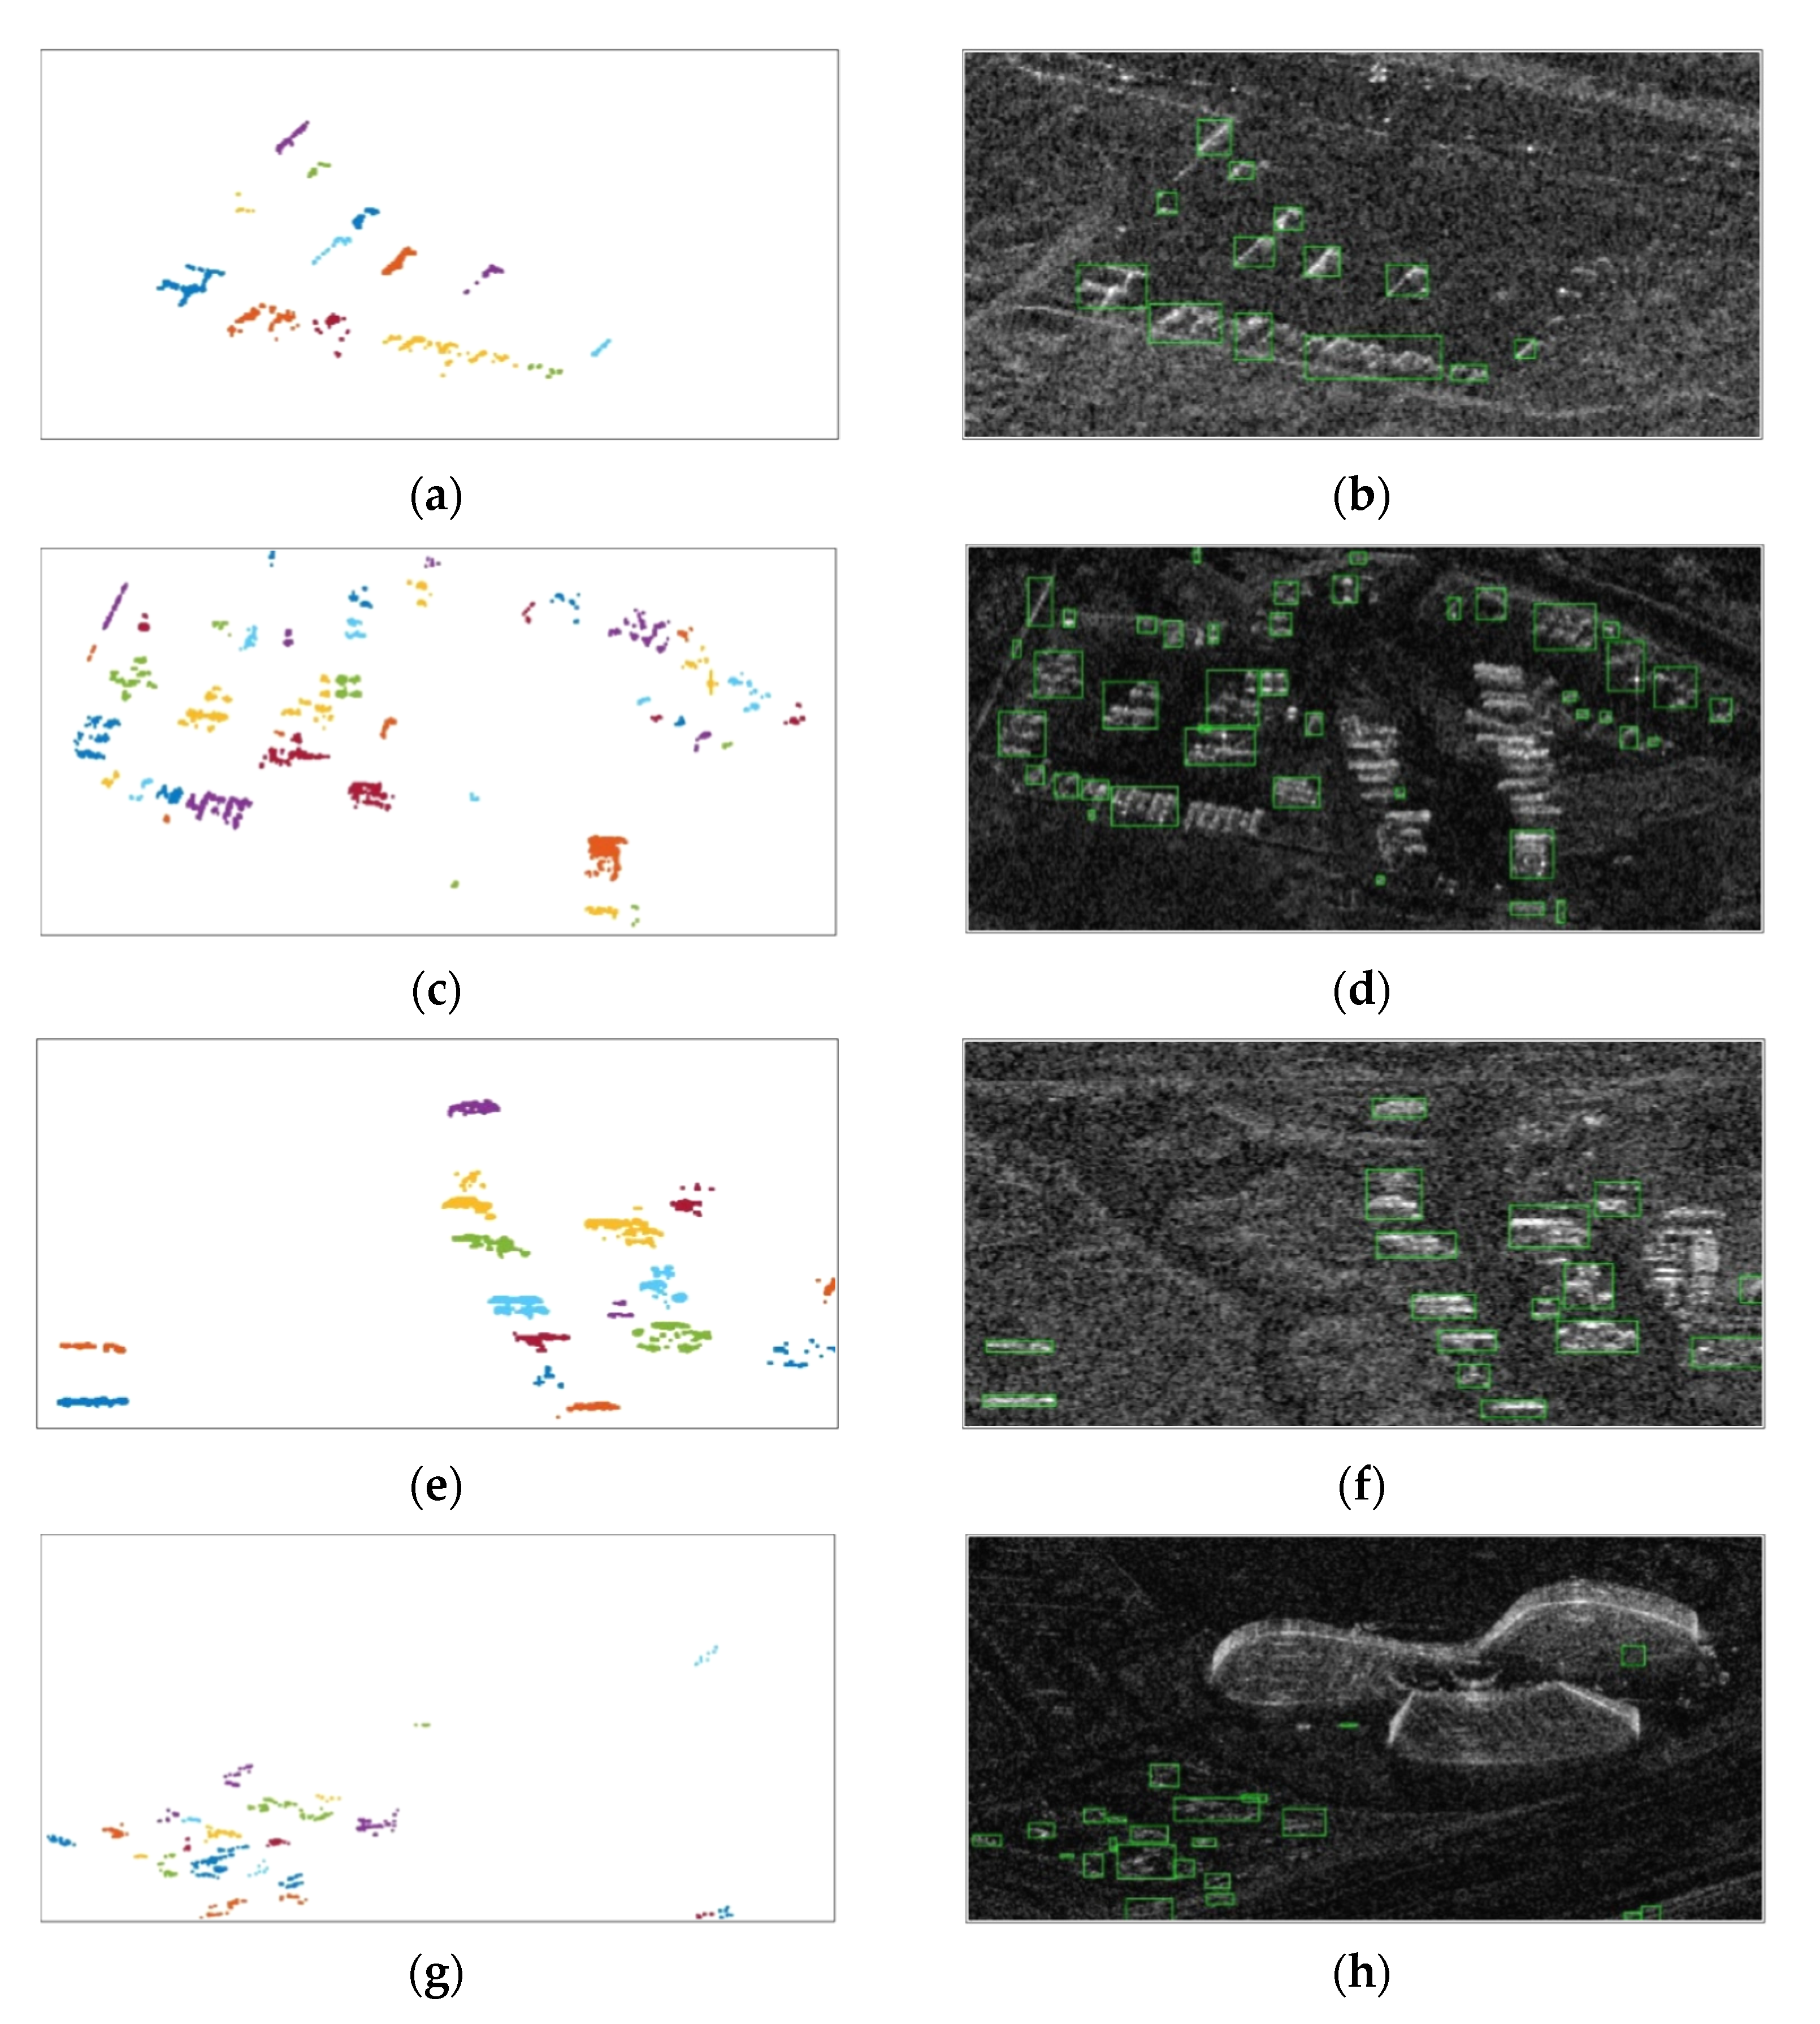
The same features can be extracted from the clusters of the test images and similarly transformed by A to the project yr,test into the feature space. Figure 8 shows the results of target detection performed using the proposed method. The KNN algorithm is used to determine the test data in the feature space. As shown in Figure 8, compared to the results in Figure 5, the clusters of natural and artificial clutter were removed. The discrimination performance of the proposed method for each scene is presented in Table 3. As a result, more than 97% of the initially detected false detection clusters could be excluded with the proposed method. In addition, although a few structures that were similar in shape and scattering characteristics to the targets of interest were also detected, most of the targets of interest that were present in the image were detected, resulting in a comprehensive F1-score of 0.9061.
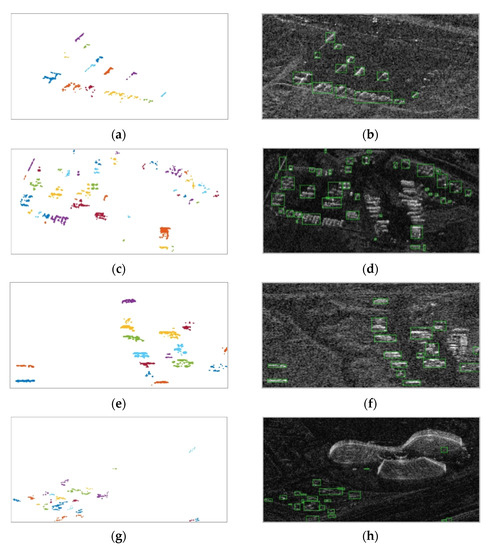
Figure 8.
Results of target discrimination and subsequent target detection results for SAR Scenes 1 to 4. (a,c,e,g) Target discrimination results. Each discriminated cluster is indicated by a different color. (b,d,f,h) Target detection results based on discrimination results in the original SAR image Detected targets are indicated by green boxes.
Table 3.
Performance of the fine discrimination step.
To compare the processing time of the proposed method with that of the previous method, which does not include coarse steps, fifty Monte Carlo simulations for each scene were performed, and the average processing time was measured. The measured processing times for each method are listed in Table 4. The average processing time of the proposed method was 3.9136 s, and that of the single-step method was 13.6664 s. Therefore, it can be seen that the proposed method can reduce the calculation load in the feature extraction step and efficiently detect the targets of interest.
Table 4.
Processing time of the proposed method and the previous single-step method.
Finally, the proposed detection scheme was compared with other detection approaches. The proposed scheme used a combination of selected features after the CDS. For comparison, detection performance was measured when only a single feature was applied after CDS. The features used are STD, WRFR, and STDDP, with the best separation performance in Table 2. In addition, target detection was performed by using the redundancy elimination scheme (RES) and Haar-like (HL) features to the same images [14,19,20]. Table 5 shows the average values of Precision, Recall, and F1 score measured for Scenes 1 to 4 using each method. As a result, detection performance was degraded when a single feature was applied in the FDS, even though the CDS was preceded. Furthermore, it can be seen that the proposed scheme is more effective than the other approaches.
Table 5.
Comparison of detection performance with other target detection approaches.
4. Discussion
Based on the experimental results in Section 3, we can see that the proposed method effectively removed incorrectly detected pixels owing to natural and artificial clutter from the TSX images. In addition, with a high F1-score of more than 0.9, it seems that most of the targets of interest present in the image were detected.
Meanwhile, some of the adjacent targets were clustered into one object because of the poor resolution of the image. In this case, the clusters of dense targets have features that are significantly different from those of the targets included in the training data and are sometimes not detected. In reality, as shown in the middle of Figure 8d and the right side of Figure 8f, some clusters of multiple targets were mistaken for clutter. Therefore, a follow-up study is required to address the problems associated with these dense targets. In future research, the features of distinguishing clusters composed of dense targets in the image will first be established. Then, an image segmentation technique will be applied to separate the dense target clusters into single-object units. Finally, it is expected that a higher detection performance can be obtained by applying the proposed method to images in which dense clusters of targets are separated.
5. Conclusions
In this study, a two-stage detection framework is proposed to ensure efficient and high-quality detection performance in TSX images, using previously studied features. In the examples, the image was preprocessed and the natural clutters were coarsely removed, based on the number of pixels in each cluster in the first step. Many incorrectly detected clusters were excluded at this stage, and accurate discrimination was performed on the remaining artificial clutter in the next step. In the fine discrimination step, the most appropriate features were selected based on the evaluated target-clutter separation performance among various features, and the feature space for the most effective utilization of these features was constructed using the KL transform. As a result, the targets of interest and clutter may be clearly differentiated in the feature space. In addition, given the training data, it is expected that target detection can be performed using the proposed method in other types of SAR images.
Author Contributions
Conceptualization, N.-H.J.; methodology, N.-H.J.; software, N.-H.J. and G.L.; validation, N.-H.J.; data curation, J.-H.P.; writing—original draft preparation, N.-H.J.; writing—review and editing, N.-H.J. and K.-T.K.; visualization, N.-H.J.; supervision, J.-H.C.; project administration, K.-T.K. All authors have read and agreed to the published version of the manuscript.
Funding
This research was funded by the Agency for Defense Development (ADD), grant number UD200002FD.
Data Availability Statement
Not applicable.
Acknowledgments
This research was supported by the Agency for Defense Development (ADD), grant number UD200002FD.
Conflicts of Interest
The authors declare no conflict of interest.
References
- Moreira, A.; Prats-Iraola, P.; Younis, M.; Kreiger, G.; Hajnsek, I.; Papathanassiou, K.P. A Tutorial on Synthetic Aperture Radar. IEEE Geosci. Remote Sens. Mag. 2013, 1, 6–43. [Google Scholar] [CrossRef]
- Wei, D.; Du, Y.; Du, L.; Li, L. Target Detection Network for SAR Images Based on Semi-Supervised Learning and Attention Mechanism. Remote Sens. 2021, 13, 2686. [Google Scholar] [CrossRef]
- Fabrizio, A.; Lapini, A.; Bianchi, T.; Alparone, L. A Tutorial on Speckle Reduction in Synthetic Aperture Radar Images. IEEE Geosci. Remote Sens. Mag. 2013, 1, 6–35. [Google Scholar] [CrossRef]
- Lee, J.-S. A simple speckle smoothing algorithm for synthetic aperture radar images. IEEE Trans. Syst. Man Cybern. 1983, 13, 85–89. [Google Scholar] [CrossRef]
- Lee, J.-S.; Wen, J.-H.; Ainsworth, T.L.; Chen, K.-S.; Chen, A.J. Improved Sigma Filter for Speckle Filtering of SAR Imagery. IEEE Trans. Geosci. Remote Sens. 2009, 47, 202–213. [Google Scholar] [CrossRef]
- Buades, A.; Coll, B.; Morel, J.M. A Non-local Algorithm for Image Denoising. In Proceedings of the 2005 IEEE Computer Society Conference on Computer Vision and Pattern Recognition (CVPR’05), San Diego, CA, USA, 20–25 June 2005; pp. 60–65. [Google Scholar]
- Shrivathsa, V. Cell Averaging-constant False Alarm Rate Detection in Radar. Int. Res. J. Eng. Technol. 2018, 7, 2433–2438. [Google Scholar]
- Villar, S.A.; Menna, B.V.; Torcida, S.; Acosta, G.G. Efficient Approach for OS-CFAR 2D Technique Using Distributive Histo-grams and Breakdown Point Optimal Concept Applied to Acoustic Images. IET Radar Sonar Navig. 2019, 13, 2071–2082. [Google Scholar] [CrossRef]
- Altman, N.S. An Introduction to Kernel and Nearest-neighbor Nonparametric Regression. Am. Stat. 1992, 46, 175–185. [Google Scholar]
- Forgy, E.W. Cluster Analysis of Multivariate Data: Efficiency versus Interpretability of Classifications. Biometrics 1965, 21, 768–769. [Google Scholar]
- Cheng, Y. Mean Shift, Mode Seeking, and Clustering. IEEE Trans. Pattern Anal. Mach. Intell. 1995, 17, 790–799. [Google Scholar] [CrossRef]
- Ester, M.; Kriegel, H.P.; Sander, J.; Xu, X. A Density-based Algorithm for Discovering Clusters in Large Spatial Databases with Noise. In Proceedings of the Second International Conference on Knowledge Discovery and Data Mining (KDD-96), Portland, OR, USA; 1996; pp. 226–231. [Google Scholar]
- Kreithen, D.E.; Halversen, S.D.; Owirka, G.J. Discriminating Targets from Clutter. Linc. Lab. J. 1993, 6, 25–52. [Google Scholar]
- Park, J.-I.; Park, S.-H.; Kim, K.-T. New Discrimination Features for SAR Automatic Target Recognition. IEEE Geosci. Remote Sens. Lett. 2012, 10, 476–480. [Google Scholar] [CrossRef]
- Hou, Y.; Wang, J.; Liu, X.; Wang, K.; Gao, Y. An Automatic SAR-GMTI Algorithm Based on DPCA. In Proceedings of the 2014 IEEE Geoscience Remote Sensing Symposium, Montreal, QC, Canada, 13–18 July 2014; pp. 592–595. [Google Scholar] [CrossRef]
- Theodoridis, S.; Koutroumbas, K. Pattern Recognition; Academic Press: San Diego, CA, USA, 1999. [Google Scholar]
- Abdi, H.; Williams, L.J. Principal Component Analysis. Wiley Interdiscip. Rev. Comput. Stat. 2010, 2, 433–459. [Google Scholar] [CrossRef]
- Lee, S.-H.; Bae, J.-H.; Kang, M.-S.; Kim, K.-T. Efficient ISAR Autofocus Technique Using Eigenimages. IEEE J. Sel. Top. Appl. Earth Obs. Remote Sens. 2016, 10, 605–616. [Google Scholar] [CrossRef]
- Schewegmann, C.P.; Kleynhans, W.; Salmon, B.P. Synthetic Aperture Radar Ship Detection Using Haar-Like Features. IEEE Geosci. Remote Sens. Lett. 2017, 14, 154–158. [Google Scholar] [CrossRef]
- Ai, J.; Tian, R.; Luo, Q.; Jin, J.; Tang, B. Multi-Scale Rotation-Invariant Haar-Like Feature Integrated CNN-Based Ship Detection Algorithm of Multiple-Target Environment in SAR Imagery. IEEE Trans. Geosci. Remote Sens. 2019, 57, 10070–10087. [Google Scholar] [CrossRef]
Publisher’s Note: MDPI stays neutral with regard to jurisdictional claims in published maps and institutional affiliations. |
© 2022 by the authors. Licensee MDPI, Basel, Switzerland. This article is an open access article distributed under the terms and conditions of the Creative Commons Attribution (CC BY) license (https://creativecommons.org/licenses/by/4.0/).