Abstract
The main challenge in extracting coastal aquaculture ponds is how to weaken the influence of the “same-spectrum foreign objects” effect and how to improve the definition of the boundary and accuracy of the extraction results of coastal aquaculture ponds. In this study, a recognition model based on the U2-Net deep learning model using remote sensing images for extracting coastal aquaculture ponds has been constructed. Firstly, image preprocessing is performed to amplify the spectral features. Second, samples are produced by visual interpretation. Third, the U2-Net deep learning model is used to train and extract aquaculture ponds along the coastal region. Finally, post-processing is performed to optimize the extraction results of the model. This method was validated in experiments in the Zhoushan Archipelago, China. The experimental results show that the average F-measure of the method in the study for the four study cases reaches 0.93, and the average precision and average recall rate are 92.21% and 93.79%, which is suitable for extraction applications in aquaculture ponds along the coastal region. This study can quickly and accurately carry out the mapping of coastal aquaculture ponds and can provide technical support for marine resource management and sustainable development.
1. Introduction
Aquaculture is a traditional fishery production method. Since the 1990s, the production of edible aquatic products that are provided by the fast-growing aquaculture industry has increased significantly. According to FAO data, global aquaculture production increased from 15,000 tons in the 1990s to 82,000 tons in 2018 []. As the largest producer, China’s aquaculture contributes 16.3% to the total global fish production, and aquaculture production accounts for 76.5% of the total domestic fish production. Aquaculture ponds along the coastal region are an important part of aquaculture facilities, usually located in coastal areas with rich biodiversity and high ecological value. In 2020, the pond aquaculture area of China accounted for 43% of the national aquaculture area. The breeding ponds are completely or partially man-made, and the breeding environment is easily affected by seasonal changes. The use of chemicals such as antibiotics and pesticides in the breeding process can easily cause environmental degradation [,,,,] and biodiversity damage [,,]. According to Sustainable Development Goal 14 of the “2030 Agenda for Sustainable Development” “Conservation and sustainable use of oceans and marine resources for sustainable development”, the scientific management of aquaculture facilities is an important link in promoting the sustainable development of fishery ecology and means. Therefore, the accurate acquisition of aquaculture pond information is of great significance for the scientific management of fishery resources and coastal environmental governance [,,].
Usually, the acquisition of information on coastal aquaculture ponds is carried out in the form of statistical surveys [,]. The results are accurate, but time-consuming and labor-intensive, and the statistics are often disturbed by human factors. Remote sensing technology has become the main means of information extraction and target recognition due to its fast imaging speed, wide observation range [,,], multiple imaging spectrum [,,,,,], long practical sequence [,,,], and good economic benefits [,]. The information extraction of coastal aquaculture ponds that is based on remote sensing technology can broadly be grouped into five categories including threshold segmentation, region growth segmentation, pixel-based classification, object-oriented classification, and deep learning approaches. The threshold segmentation is a method by truncating the interval of a single attribute value to separate the target recognition object from the image [,,]. This kind of method is simple to implement and has a small amount of calculation, but this method only considers the information of a single waveband of the image, and the anti-interference performance is poor. The region growing method is a segmentation method that forms a larger region by aggregating pixels or sub-regions with similar properties near the growing point []. This kind of method is simple to calculate and has a better segmentation effect for relatively uniform connected objects []. However, it is necessary to manually determine the growth points, and the segmentation results are seriously affected by noise points. The pixel-based classification method divides category attributes based on the performance characteristics of similar objects on remote sensing images [], based on the maximum likelihood classifier [], random forest classifier [], etc. [,,,,,]. Although such methods are convenient to calculate, the classification results are easily affected by the phenomenon of “same-spectrum foreign objects”. It is also necessary to select an appropriate threshold for segmentation during classification []. However, the segmentation threshold is difficult to define, and the segmentation results are prone to blurred boundaries or exceeding the boundaries. The object-oriented method comprehensively considers the spectral statistical characteristics, shape, size, texture, adjacent relationship, and other factors []. The classification results are not based on individual pixels but form homogeneous image objects [,]. It not only effectively suppresses the “pepper salt effect” that is caused by spectral variation, but also reduces the misclassification of ground objects that is caused by “foreign objects of the same spectrum”. The classification results of such methods improve with the increase of image resolution, but the scale and parameters of segmentation are difficult to determine and need to be adjusted repeatedly [].
Deep learning methods build neural networks by combining different convolutional layers [,,,]. As an important research tool of artificial intelligence, deep learning has achieved major breakthroughs in computer vision [,,,], natural language processing, medical image processing [], and so on [,,]. In the deep learning method, as long as the samples are selected in advance and the model parameters are continuously updated and iterated, the target features can be automatically learned to identify the target object. Lu et al. used a method that was based on U-Net by improving the ASPP structure and up-sampling structure to avoid ’adhere’ and extracted the aquaculture areas in Fujian []. Zeng et al. proposed a method by combining FCN and RSCA and fusing water index to distinguish ponds and cropland []. Cheng et al. utilized HDC and U-Net to further expand the receptive field and weaken the ‘gridding’ problem []. Such methods effectively improved the problem of the blurred boundaries in the traditional method, and also suppressed the influence of the ‘same-spectrum foreign objects’ phenomenon. It also realizes the application of pond extraction for images of different scales and different resolutions.
At present, the main factors affecting the identification results of coastal aquaculture ponds are as follows: (1) How to reduce the interference of other types of land cover in extracting aquaculture pond information? There are multiple sources of interference in complex environments, and the phenomenon of “same spectrum foreign objects” is serious. The types of ground objects such as paddy fields, salt fields, and river canals are similar to the spectral characteristics of coastal aquaculture ponds. It is usually difficult to find suitable thresholds for segmentation using traditional identification methods. (2) How to improve the accuracy of extracting coastal aquaculture ponds, especially the boundaries? The spectral characteristics of coastal aquaculture ponds are unstable. The characteristics of different production stages of coastal aquaculture ponds are different. The periodic changes in their characteristics can affect our judgment of coastal aquaculture ponds. Although the internal spectral characteristics of coastal aquaculture ponds are unstable, the edge composition is single and the characteristics are relatively stable. It is useful for improving the accuracy of extracting coastal aquaculture ponds by using the context information in the image and comprehensively considering the internal features and boundary features of coastal aquaculture ponds. Therefore, due to the low accuracy and poor integrity of the information extraction of coastal aquaculture ponds in complex geographical environments, this study proposes a remote sensing information extraction method for coastal aquaculture ponds based on the U2-Net deep learning model. The research in this study can provide important data support and technical support for the survey of coastal resources, scientific management of marine resources, and the sustainable development of humans.
2. Study Area and Data Sources
2.1. Study Area
The study areas that were selected in this paper were Zhoushan Archipelago and the three representative islands in the Zhoushan Archipelago. Zhoushan Archipelago is located in the East China Sea on the outer edge of Hangzhou Bay. The cold and warm currents along the coast of the archipelago meet, and the seawater disturbance is obvious [,,]. Figure 1 shows the exact location of the Zhoushan Archipelago. With the favorable natural environment and excellent port resources, many large islands in the Zhoushan Archipelago have vigorously developed aquaculture since the last century. In recent years, in order to improve productivity and reduce unnecessary production pollution, the degree of intensification of coastal aquaculture ponds in Zhoushan Archipelago has increased significantly. Intensive coastal aquaculture ponds have become one of the main production methods in the archipelago.
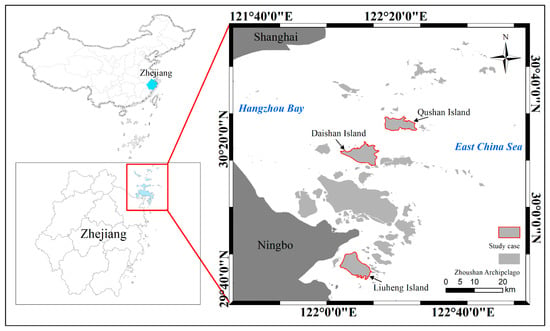
Figure 1.
The left of the map is the location of Zhejiang Province in China and the location of the Zhoushan archipelago in Zhejiang Province. The right of the map is the specific geographic coordinates of the Zhoushan archipelago. The red line areas were the study areas in this study.
Liuheng Island is located in the southern part of the Zhoushan Archipelago, with an area of 93 km2, making it the third largest island in the Zhoushan Archipelago. The warm currents in the Taiwan Strait and the cold currents along the coast of Zhejiang have formed natural fishing grounds, and marine fishery resources are very rich. The aquaculture area of the pond in Liuheng Town ranks first in Zhoushan City and is one of the most important aquaculture towns in Zhoushan.
Daishan Island is located in the middle of the Zhoushan Archipelago, with a total area of about 105 km2, and is the second largest island in Zhoushan. The location of Daishan Island is shown in the figure below. The waters near Daishan Island are fertile, broad, and rich in fishery resources. Daishan County is also one of the ten key fishery counties in China.
Qushan Island is located in the north-central part of Zhoushan Archipelago, with an island area of 59 km2. The interior of the island is more mountainous and less plain. In the past, salt pans were used as the main production method. The island is also narrow and long with many bays, and the coastline can be used for more than 30 km. Many bays have geographic advantages for developing aquaculture. In recent years, Qushan Island has vigorously developed aquaculture, and both pond aquaculture and marine aquaculture have begun to be scaled up.
2.2. Data Sources
The data that were used in this study were Landsat 8/9 Collection 2 Level 2. The USGS (United States Geological Survey) provides two collections and two levels data products according to different processing procedures. The Landsat Collection 2 Surface Reflectance dataset has atmospheric correction and radiometric calibration by Land Surface Reflectance Code (LaSRC) [,,]. These images contain 5 visible and near-infrared (VNIR) bands and 2 short-wave infrared (SWIR) bands which have been processed to orthorectified surface reflectance. We also filtered ‘CLOUD_COVER’ under 20. The details of the data are shown in the Table 1. The technical indicators of Landsat images that were used in this study. The images from Landsat 8 were used for model training and from Landsat 9 for model testing.

Table 1.
The technical indicators of Landsat images that were used in this study.
3. Methodology
The specific steps of the model are shown in Figure 2, the overall workflow of the coastal aquaculture ponds extraction using the U2-Net deep learning model from remote sensing images can be divided into several steps: (a) making samples, (b) image augmentation, (c) coastal aquaculture ponds extraction based on U2-Net deep learning model, and (d) accuracy assessment.
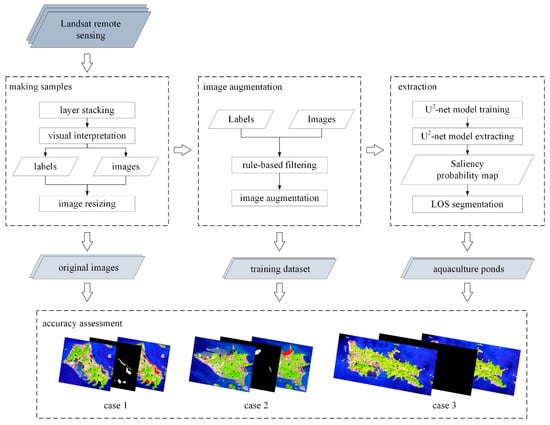
Figure 2.
The workflow of the study.
3.1. Making Samples
Although it is convenient for us to directly sample the surface reflectance data, the reflectance data of coastal aquaculture ponds in different bands express different characteristics. We still need to store the data to color maps. Firstly, we performed spectral analysis on some samples, and the results (Figure 3) showed that in the short-wave infrared, near-infrared, and red bands, coastal aquaculture ponds were best distinguished from other types of ground objects except the sea. So, we chose to combine the three bands as the input of the Red, Green, and Blue channels for layer stacking. Secondly, based on expert experience, the samples are labeled on the stacking images. Finally, the labeled images are cropped into a subgraph of size 581 pixels × 581 pixels.
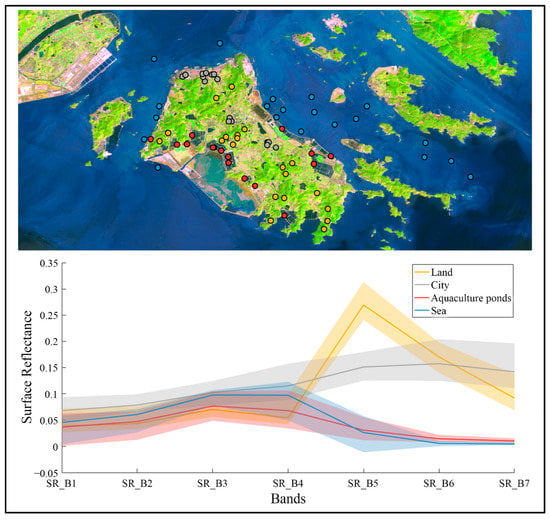
Figure 3.
In the top of the picture, we used yellow points, gray points, red points, and blue points to represent land, city, aquaculture pond, and sea type sampling points, respectively. In the bottom plot, we used light-colored regions to roughly represent the distribution of the sampling set and used the solid line to describe the sample median.
3.2. Image Augmentation
The training effect of the model is greatly affected by the quality of the training samples. The cropped image can be divided into three categories: the pixel point is the type of coastal aquaculture ponds in each image, the pixel point is the type of coastal aquaculture ponds in part of images, and the pixel point is not the type of coastal aquaculture ponds in all images. However, the number of pixels in non-aquaculture ponds in the image is much larger than the number of pixels in the coastal aquaculture ponds. In order to improve the quality of training samples, we analyzed the cropped image dataset by a rule method and performed data augmentation on it. The rule was: if all the pixels in an image were of the third category, the image would be removed from the dataset. If all the pixels in an image were non-aquaculture pond pixels (only in this image are determined as non-aquaculture pond types), but there was a pixel belonging to this image in other images that was determined as the type of aquaculture pond, the image would be retained. In order to enlarge the dataset, we augmented all the images by zooming in, zooming out, rotating, and flipping [].
3.3. Extraction of Coastal Aquaculture Ponds Using U2-Net Deep Learning Model
Olaf proposed a deep learning model, the U-Net network model, which is different from the traditional deep convolutional neural network model, which continuously deepens the convolutional structure [,]. The U-Net network model consists of three parts: encoding, decoding, and feature fusion. In the encoding process, multi-layer down-sampling is used to extract more comprehensive features; in the decoding process, multi-layer up-sampling is used to restore the feature results; and in the feature fusion stage, the feature results are generated in the fully connected encoding and decoding process generate a saliency probability map. Qin [] proposed a two-level nested U-structure model on the basis of U-Net network. The U2-Net network model inherits the idea of encoding and decoding the U-Net network model, but no longer uses a single convolution layer or deconvolution layer for each sample, but embeds a complete U-structure residual block structure (Figure 4. Residual U-blocks (RSU)) to replace a single convolution operation. The U-structure residual block solves the defect that the receptive field is too narrow due to the use of small convolution kernels in the past, and only local details can be extracted. At the same time, the problem of excessive calculation that is caused by the use of hole convolution is reduced. The U2-Net network model can extract multi-scale features layer by layer by designing a simple framework, thereby improving the recognition efficiency.
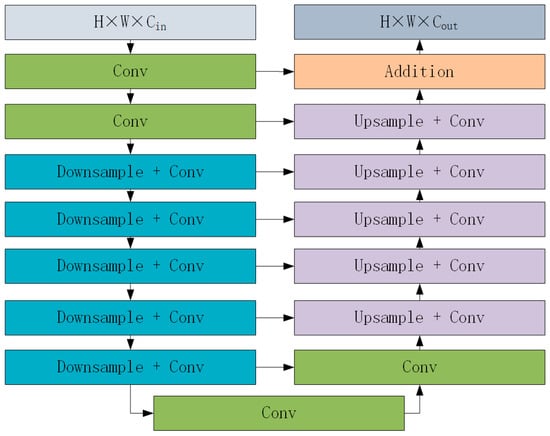
Figure 4.
Residual U-blocks (RSU) [].
The U2-Net network model (Figure 5. The construction of U2-Net) consists of three parts: six-layer encoding layer, five-layer decoding layer, and a fully connected layer. Each layer contains a U-shaped residual block for extracting multi-scale features. Each time the training sample passes through an encoding layer, the sampled training sample is passed down, and the training result of this layer is passed to the decoding layer of the same level and the loss function is calculated. After traversing all the encoding layers and decoding layers, six extraction results that are restored to the same size as the training samples will be obtained. Finally, all the feature results are aggregated in the fully connected layer to obtain the final recognition result and loss function. By iterating continuously to reduce the value of the loss function, the recognition effect of the model is improved.
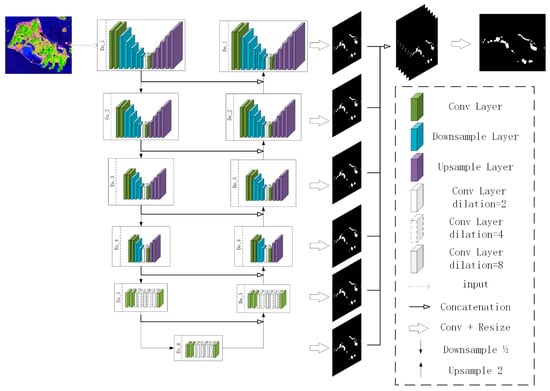
Figure 5.
The construction of U2-Net [].
3.4. Accuracy Evaluation
Accuracy evaluation is an important step that cannot be obtained in remote sensing information extraction. It can not only evaluate the accuracy and reliability of the obtained results, but is also an important basis for optimizing the process and adjusting parameters. In this study, three precision indicators, precision, recall, and F-measure were used to evaluate the precision of the extraction results of the breeding ponds.
where represents the value of the pixel point in the binarized label image, and represents the value of the pixel point in the binarized result image. When is greater than 0, it means that the pixel is true, but the classification result is false, and the pixel belongs to “missing points”. When is greater than 0, it means that the pixel is false, but the classification result is true, and the pixel is “misclassified”. TP is the number of correctly identified pond extraction result pixels. FP is the number of misidentified pond extraction result pixels. FN is the number of unidentified pond pixels.
4. Results and Analysis
In this study, we selected four study cases using a Landsat 9 image shooting on 8 April 2022 in the Zhoushan archipelago to illustrate the validation of our approach. Qualitative and quantitative evaluation was used to assess the accuracy of our model.
4.1. Case Study in Liuheng Island, China
In this case, we select Liuheng Island as a study case (Figure 6).
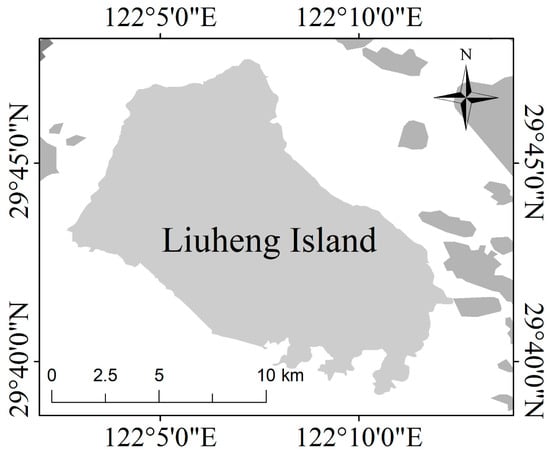
Figure 6.
Location of Liuheng Island, China.
As shown in Figure 7, we successfully extracted 19 aquaculture areas from the image, with a total area of 9.7 km2. The coastal aquaculture ponds on Liuheng Island are highly intensive, and there are few independent large-scale coastal aquaculture ponds. The coastal aquaculture ponds are concentrated on the north and south sides of the island. The location of the recognition result was accurate, the recognition accuracy reached 94.47%, and the recall rate reached 93.86% (Table 2).
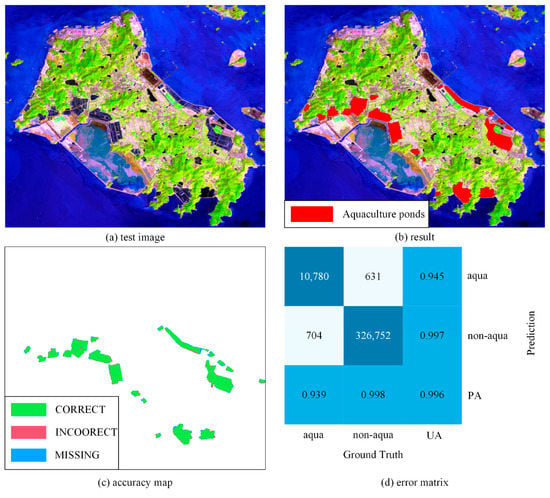
Figure 7.
The extraction results of Liuheng Island: (a) original image, (b) extraction result, (c) accuracy map, (d) error matrix.

Table 2.
Accuracy evaluation of coastal aquaculture ponds extraction in Liuheng Island, China.
4.2. Case Study in Daishan Island, China
In the second study case, we selected Daishan Island as a study case (Figure 8).
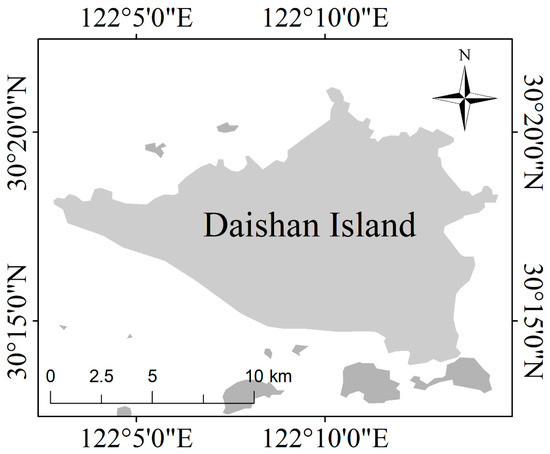
Figure 8.
Location of Daishan Island, China.
As shown in Figure 9, we successfully extracted eight aquaculture areas from the image, with a total area of 5.41 km2. The main aquaculture bases in Daishan Island are located in the northern part of the island. There are also scattered coastal aquaculture ponds along the east and west coasts of the island. Different from the intensive coastal aquaculture ponds, scattered coastal aquaculture ponds are often of different shapes and scattered, and there are still engineering legacy along the coast of the island. These factors all present challenges for the identification of coastal aquaculture ponds. Although we accurately identified the distribution locations of all the ponds, the accuracy of the area was slightly insufficient. The accuracy of the identification results of the coastal aquaculture ponds on Daishan Island was 91.10%, and the recall rate was 93.18% (Table 3).
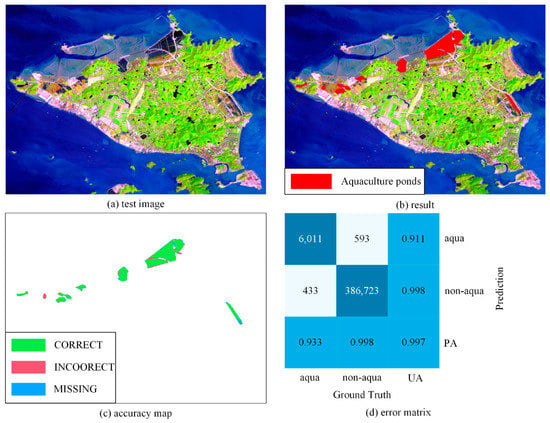
Figure 9.
The extraction results of Daishan Island: (a) original image, (b) extraction result, (c) accuracy map, (d) error matrix.

Table 3.
Accuracy evaluation of coastal aquaculture ponds extraction in Daishan Island, China.
4.3. Case Study in Qushan Island, China
In the third case study, we selected Qushan Island as a study case (Figure 10).
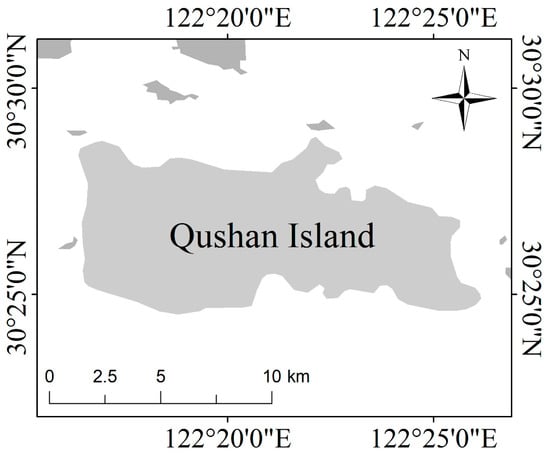
Figure 10.
Location of Qushan Island, China.
As shown in Figure 11, we successfully extracted two farming areas from the image, with a total area of 3.43 km2. The two aquaculture areas are located in the northern bay and the southern bay. The location of the recognition result is accurate and the precision is high. The recognition accuracy of the coastal aquaculture ponds on Qushan Island was 92.79%, and the recall rate was 96.45% (Table 4).
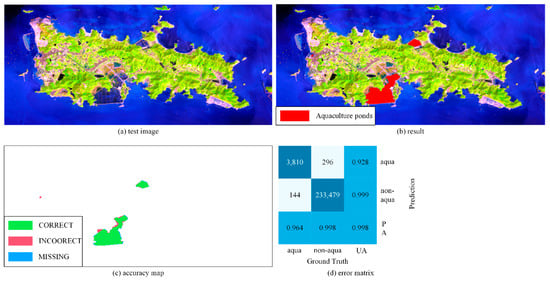
Figure 11.
The extraction results of Qushan Island: (a) original image, (b) extraction result, (c)accuracy map, (d) error matrix.

Table 4.
Accuracy evaluation of coastal aquaculture ponds extraction in Qushan Island, China.
4.4. Case Study in Zhoushan Archipelago, China
In the last case, we analyzed the extraction of the Zhoushan Archipelago. As shown in Figure 12. The extraction result in the Zhoushan Archipelago, China, we extracted a total of 43 coastal aquaculture ponds (including intensive aquaculture ponds and non-intensive aquaculture ponds). The total area is 36.45 km2. On the whole, the coastal aquaculture ponds that were extracted by the model have accurate positioning, clear boundaries, and accurate areas. The recognition accuracy of coastal aquaculture ponds in Zhoushan Archipelago was 90.49%, and the recall rate was 91.67% (Table 5). Coastal aquaculture ponds in the Zhoushan Archipelago are widespread but scattered. Most of the large islands in the archipelago have a significant distribution of intensive aquaculture ponds. At the same time, coastal aquaculture ponds are mostly distributed in the bays on the edge of the islands or where the currents converge. Such terrains usually have abundant marine fishery resources, which can provide a material basis for the construction and development of coastal aquaculture ponds.
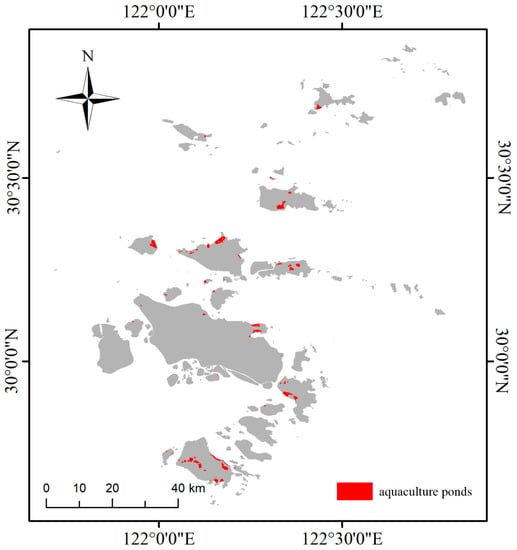
Figure 12.
The extraction result in the Zhoushan Archipelago, China.

Table 5.
Accuracy evaluation of coastal aquaculture ponds extraction in the Zhoushan Archipelago, China.
5. Discussion
In this study, a method for the extraction of coastal aquaculture ponds along coastal region using U2-Net deep learning model from remote sensing images has been proposed, and the experiments on three islands that are located in the Zhoushan Archipelago and the whole Zhoushan Archipelago were carried out. The extracted coastal aquaculture pond areas are 9.7 km2 on Liuheng Island, 5.41 km2 on Daishan Island, 3.43 km2 on Qushan Island, and 36.45 km2 on the Zhoushan Archipelago.
5.1. Feasibility Analysis of the Method
The use of remote sensing images to extract information from coastal aquaculture ponds is often affected by the same-spectrum foreign objects effect. Salt pans, rivers, and lakes are all approximate features that are easily confused with coastal aquaculture ponds, thus affecting the extraction accuracy. The U2-Net network can effectively weaken the influence of different water bodies on the information extraction of coastal aquaculture ponds and extract the coastal aquaculture ponds more completely. The experimental results show that this method can meet the requirements of coastal aquaculture pond extraction.
In order to verify the feasibility of the algorithm, we compared and analyzed the U2-Net deep learning model-based method with the SVM-based method and U-Net deep learning model-based method. The classification results of each method on the test data are shown in Figure 13 and Table 6. It can be seen from the classification results that the classification results of the SVM-based method are significantly worse than the classification results of U-Net deep learning model-based method and U2-Net deep learning model-based method. A large amount of coastal area is misidentified as aquaculture ponds. Compared with the SVM-based method, the U-Net deep learning model-based method significantly reduces the situation that the coastal areas are wrongly divided into aquaculture ponds. However, there are still some coastal marine and inland lakes that are incorrectly classified as aquaculture ponds. The results of the accuracy metrics for each model are shown in the table below. It can be seen that the F-measure value of the U2-Net deep learning model-based method is 0.93, which is significantly higher than that of other algorithms, followed by the U-Net deep learning model-based method with an F-measure value of 0.90, and the worst is the SVM-based method. Combining the classification results, it is not difficult to find that the coastal seawater and the lakes on the island are the key areas that affect the classification results, and they are also typical “same-spectrum foreign objects” phenomena. Compared with the SVM-based method and U-Net deep learning model-based method, U2-Net deep learning model-based method has stronger adaptability to this problem. In summary, the U2-Net deep learning model-based method that was used in this study can better obtain multi-level features and multi-scale information, and the classification results are significantly better than the SVM-based method and U-Net deep learning model-based method.
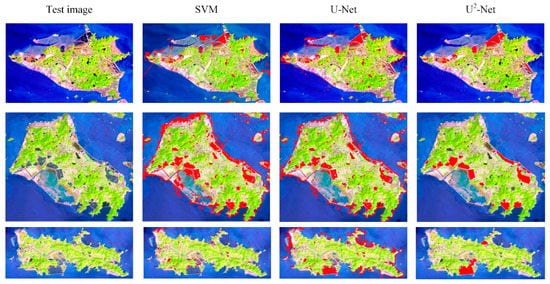
Figure 13.
The extraction results using the SVM-based method, U-Net deep learning model-based method, and the U2-Net deep learning model-based method, and the red area represents the coastal aquaculture ponds.

Table 6.
Accuracy evaluation of the SVM-based method, U-Net deep learning model-based method, and U2-Net deep learning model-based method, and the best value is represented in bold.
5.2. Error Analysis
The convenience of remote sensing image acquisition and the large scale of the image are the guarantee for the rapid extraction of breeding ponds. But the extraction results are still affected by other factors. The spatial resolution is the main reason for image recognition accuracy. The low resolution makes the images less expressive, and it is difficult to manually mark each aquaculture pond one by one in the Landsat 30 m image, and some of the small coastal aquaculture ponds cannot even be visually interpreted. Secondly, insufficient feature expression will also lead to low recognition accuracy and poor generalization performance of the model.
6. Conclusions
Based on the moderate resolution of the Landsat 8/9 OLI satellite remote sensing data, this study uses the U2-Net deep learning model to achieve remote sensing information extraction of aquaculture ponds along the coastal region in complex geographical environments. Experiments in four cases of the Zhoushan Archipelago show that the method that was used in this study can accurately extract the information of coastal aquaculture ponds, and the extraction results are accurate in the location and clear in the boundaries. The averages of the method’s precision, recall, and F-measure are 92.21%, 93.79%, and 0.93, respectively.
Aquaculture is one of the main human activities in coastal areas. With the continuous development of the aquaculture industry, the ecological environment pollution that is caused by the coastal aquaculture ponds is also increasing. Based on the coastal aquaculture pond information that is extracted from remote sensing images, we can continuously monitor the mechanism of action of the aquaculture ponds impact on the coastal environment over the years. We also can scientifically plan the production cycle of aquaculture ponds, cultivated varieties, sustainable development models, and eco-friendly industrial structures, etc. Although this study has achieved the accurate extraction of remote sensing information of aquaculture ponds along the Zhoushan Archipelago, there are still some problems that need further research: (1) to verify the validity and applicability of the model on higher spatial resolution remote sensing images. (2) For key areas, an analysis of the temporal and spatial pattern evolution of aquaculture ponds in coastal areas was carried out based on long-term satellite remote sensing images.
Author Contributions
Conceptualization, Z.Z. (Zhaohui Zou), C.C. and Z.L.; methodology, Z.Z. (Zhaohui Zou) and C.C.; software, Z.Z. (Zili Zhang); validation, Z.Z. (Zili Zhang); investigation, C.C. and Z.Z. (Zhaohui Zou); resources, Z.Z. (Zhaohui Zou); data curation, Z.Z. (Zhaohui Zou); writing—original draft preparation, Z.Z. (Zhaohui Zou); writing—review and editing, C.C., Z.Z. (Zhaohui Zou), J.L., H.C. and L.W. All authors have read and agreed to the published version of the manuscript.
Funding
This research was funded by the National Natural Science Foundation of China (42171311).
Data Availability Statement
The satellite remote sensing images of Landsat were provided by the United States Geological Survey (https://www.usgs.gov/).
Conflicts of Interest
The authors declare no conflict of interest.
References
- FAO. The State of World Fisheries and Aquaculture 2022. In Towards Blue Transformation; FAO: Rome, Italy, 2022. [Google Scholar]
- Ottinger, M.; Clauss, K.; Kuenzer, C. Aquaculture: Relevance, distribution, impacts and spatial assessments—A review. Ocean Coast. Manag. 2016, 119, 244–266. [Google Scholar] [CrossRef]
- Xu, Z.; Wu, S.; Christie, P.; Gao, X.; Xu, J.; Xu, S.; Liang, P. Impacts of estuarine dissolved organic matter and suspended particles from fish farming on the biogeochemical cycling of mercury in Zhoushan island, eastern China Sea. Sci. Total Environ. 2020, 705, 135921. [Google Scholar] [CrossRef] [PubMed]
- Zhang, H.; Xiao, Y.; Deng, Y. Island ecosystem evaluation and sustainable development strategies: A case study of the Zhoushan Archipelago. Glob. Ecol. Conserv. 2021, 28, e01603. [Google Scholar] [CrossRef]
- Ju, Y.-R.; Chen, C.-F.; Wang, M.-H.; Chen, C.-W.; Dong, C.-D. Assessment of polycyclic aromatic hydrocarbons in seafood collected from coastal aquaculture ponds in Taiwan and human health risk assessment. J. Hazard. Mater. 2022, 421, 126708. [Google Scholar] [CrossRef]
- Zhao, J.; Zhang, M.; Xiao, W.; Jia, L.; Zhang, X.; Wang, J.; Zhang, Z.; Xie, Y.; Pu, Y.; Liu, S. Large methane emission from freshwater aquaculture ponds revealed by long-term eddy covariance observation. Agric. For. Meteorol. 2021, 308, 108600. [Google Scholar] [CrossRef]
- Higgins, S.; Overeem, I.; Tanaka, A.; Syvitski, J.P.M. Land subsidence at aquaculture facilities in the Yellow River delta, China. Geophys. Res. Lett. 2013, 40, 3898–3902. [Google Scholar] [CrossRef]
- Zhang, H.; Chen, Y.; Li, D.; Yang, C.; Zhou, Y.; Wang, X.; Zhang, Z. PAH residue and consumption risk assessment in four commonly consumed wild marine fishes from Zhoushan Archipelago, East China Sea. Mar. Pollut. Bull. 2021, 170, 112670. [Google Scholar] [CrossRef]
- Zhou, S.; Zhu, H.; Huang, S.; Zhou, J.; Zhang, S.; Wang, C. Biomagnification and risk assessment of polychlorinated biphenyls in food web components from Zhoushan fishing ground, China. Mar. Pollut. Bull. 2019, 142, 613–619. [Google Scholar] [CrossRef]
- Gentry, R.R.; Froehlich, H.E.; Grimm, D.; Kareiva, P.; Parke, M.; Rust, M.; Gaines, S.D.; Halpern, B.S. Mapping the global potential for marine aquaculture. Nat. Ecol. Evol. 2017, 1, 1317–1324. [Google Scholar] [CrossRef]
- Abd-Elrahman, A.; Croxton, M.; Pande-Chettri, R.; Toor, G.S.; Smith, S.; Hill, J. In situ estimation of water quality parameters in freshwater aquaculture ponds using hyperspectral imaging system. ISPRS J. Photogramm. Remote Sens. 2011, 66, 463–472. [Google Scholar] [CrossRef]
- Wang, D.; Song, C.; Zhang, B.; Chen, J.; Luo, A.; Wang, X.; Wu, S.; Ye, Y. Deciphering dissolved organic matter from freshwater aquaculture ponds in Eastern China based on optical and molecular signatures. Process Saf. Environ. Prot. 2021, 155, 122–130. [Google Scholar] [CrossRef]
- Ottinger, M.; Clauss, K.; Kuenzer, C. Large-scale assessment of coastal aquaculture ponds with Sentinel-1 time series data. Remote Sens. 2017, 9, 440. [Google Scholar] [CrossRef]
- Hardin, P.J.; Jensen, R.R. Small-scale unmanned aerial systems for environmental remote sensing. GIScience Remote Sens. 2011, 48, 99–111. [Google Scholar] [CrossRef]
- Duan, Y.; Li, X.; Zhang, L.; Liu, W.; Liu, S.A.; Chen, D.; Ji, H. Detecting spatiotemporal changes of large-scale aquaculture ponds regions over 1988–2018 in Jiangsu Province, China using Google Earth Engine. Ocean. Coast. Manag. 2020, 188, 105144. [Google Scholar] [CrossRef]
- Chen, C.; Liang, J.; Xie, F.; Hu, Z.; Sun, W.; Yang, G.; Yu, J.; Chen, L.; Wang, L.H.; Wang, L.Y.; et al. Temporal and spatial variation of coastline using remote sensing images for Zhoushan archipelago, China. Int. J. Appl. Earth Obs. Geoinf. 2022, 107, 102711. [Google Scholar] [CrossRef]
- Wang, L.; Chen, C.; Xie, F.; Hu, Z.; Zhang, Z.; Chen, H.; He, X.; Chu, Y. Estimation of the value of regional ecosystem services of an archipelago using satellite remote sensing technology: A case study of Zhoushan Archipelago, China. Int. J. Appl. Earth Obs. Geoinf. 2021, 105, 102616. [Google Scholar] [CrossRef]
- Ottinger, M.; Clauss, K.; Huth, J.; Eisfelder, C.; Leinenkugel, P.; Kuenzer, C. Time series sentinel-1 SAR data for the mapping of aquaculture ponds in coastal Asia. In Proceedings of the IGARSS 2018-2018 IEEE International Geoscience and Remote Sensing Symposium, Valencia, Spain, 22–27 July 2018; pp. 9371–9374. [Google Scholar]
- Peterson, K.T.; Sagan, V.; Sloan, J.J. Deep learning-based water quality estimation and anomaly detection using Landsat-8/Sentinel-2 virtual constellation and cloud computing. GIScience Remote Sens. 2020, 57, 510–525. [Google Scholar] [CrossRef]
- Ottinger, M.; Bachofer, F.; Huth, J.; Kuenzer, C. Mapping Aquaculture Ponds for the Coastal Zone of Asia with Sentinel-1 and Sentinel-2 Time Series. Remote Sens. 2021, 14, 153. [Google Scholar] [CrossRef]
- Jia, M.; Wang, Z.; Mao, D.; Ren, C.; Wang, C.; Wang, Y. Rapid, robust, and automated mapping of tidal flats in China using time series Sentinel-2 images and Google Earth Engine. Remote Sens. Environ. 2021, 255, 112285. [Google Scholar] [CrossRef]
- Sun, Z.; Luo, J.; Yang, J.; Yu, Q.; Zhang, L.; Xue, K.; Lu, L. Nation-scale mapping of coastal aquaculture ponds with sentinel-1 SAR data using google earth engine. Remote Sens. 2020, 12, 3086. [Google Scholar] [CrossRef]
- Stiller, D.; Ottinger, M.; Leinenkugel, P. Spatio-Temporal Patterns of Coastal Aquaculture Derived from Sentinel-1 Time Series Data and the Full Landsat Archive. Remote Sens. 2019, 11, 1707. [Google Scholar] [CrossRef]
- Tran, H.; Tran, T.; Kervyn, M. Dynamics of land cover/land use changes in the Mekong Delta, 1973–2011: A remote sensing analysis of the Tran Van Thoi District, Ca Mau Province, Vietnam. Remote Sens. 2015, 7, 2899–2925. [Google Scholar] [CrossRef]
- Kang, J.; Sui, L.; Yang, X.; Liu, Y.; Wang, Z.; Wang, J.; Yang, F.; Liu, B.; Ma, Y. Sea surface-visible aquaculture spatial-temporal distribution remote sensing: A case study in Liaoning province, China from 2000 to 2018. Sustainability 2019, 11, 7186. [Google Scholar] [CrossRef]
- Ren, C.; Wang, Z.; Zhang, Y.; Zhang, B.; Chen, L.; Xi, Y.; Xiao, X.; Doughty, R.B.; Liu, M.; Jia, M. Rapid expansion of coastal aquaculture ponds in China from Landsat observations during 1984–2016. Int. J. Appl. Earth Obs. Geoinf. 2019, 82, 101902. [Google Scholar] [CrossRef]
- Cheng, B.; Liang, C.; Liu, X.; Liu, Y.; Ma, X.; Wang, G. Research on a novel extraction method using Deep Learning based on GF-2 images for aquaculture areas. Int. J. Remote Sens. 2020, 41, 3575–3591. [Google Scholar] [CrossRef]
- Chen, C.; Chen, H.; Liang, J.; Huang, W.; Xu, W.; Li, B.; Wang, J. Extraction of water body information from remote sensing imagery while considering greenness and wetness based on Tasseled Cap transformation. Remote Sens. 2022, 14, 3001. [Google Scholar] [CrossRef]
- Han-Qiu, X.U. A Study on Information Extraction of Water Body with the Modified Normalized Difference Water Index (MNDWI). J. Remote Sens. 2005, 9, 589–595. [Google Scholar]
- McFEETERS, S.K. The use of the Normalized Difference Water Index (NDWI) in the delineation of open water features. Int. J. Remote Sens. 1996, 17, 7. [Google Scholar] [CrossRef]
- Wang, Z.; Yang, X.; Liu, Y.; Lu, C. Extraction of coastal raft cultivation area with heterogeneous water background by thresholding object-based visually salient NDVI from high spatial resolution imagery. Remote Sens. Lett. 2018, 9, 839–846. [Google Scholar] [CrossRef]
- Zhang, T.; Yang, X.; Hu, S.; Su, F. Extraction of Coastline in Aquaculture Coast from Multispectral Remote Sensing Images: Object-Based Region Growing Integrating Edge Detection. Remote Sens. 2013, 5, 4470–4487. [Google Scholar] [CrossRef]
- Peng, Y.; Sengupta, D.; Duan, Y.; Chen, C.; Tian, B. Accurate mapping of Chinese coastal aquaculture ponds using biophysical parameters based on Sentinel-2 time series images. Mar. Pollut. Bull. 2022, 181, 113901. [Google Scholar] [CrossRef] [PubMed]
- Hou, Y.; Zhao, G.; Chen, X.; Yu, X. Improving Satellite Retrieval of Coastal Aquaculture Pond by Adding Water Quality Parameters. Remote Sens. 2022, 14, 3306. [Google Scholar] [CrossRef]
- Zhang, L.; Zhang, L.; Tao, D.; Huang, X. On Combining Multiple Features for Hyperspectral Remote Sensing Image Classification. IEEE Trans. Geosci. Remote Sens. 2012, 50, 879–893. [Google Scholar] [CrossRef]
- Xia, Z.; Guo, X.; Chen, R. Automatic extraction of aquaculture ponds based on Google Earth Engine. Ocean Coast. Manag. 2020, 198, 105348. [Google Scholar] [CrossRef]
- SABJAN, A.; LEE, L.K.; SEE, K.F.; WEE, S.T. Comparison of Three Water Indices for Tropical Aquaculture Ponds Extraction using Google Earth Engine. Sains Malays. 2022, 51, 369–378. [Google Scholar]
- Duan, Y.; Li, X.; Zhang, L.; Chen, D.; Ji, H. Mapping national-scale aquaculture ponds based on the Google Earth Engine in the Chinese coastal zone. Aquaculture 2020, 520, 734666. [Google Scholar] [CrossRef]
- Kolli, M.K.; Opp, C.; Karthe, D.; Pradhan, B. Automatic extraction of large-scale aquaculture encroachment areas using Canny Edge Otsu algorithm in Google Earth Engine–the case study of Kolleru Lake, South India. Geocarto Int. 2022, 1–17. [Google Scholar] [CrossRef]
- Luo, J.; Pu, R.; Ma, R.; Wang, X.; Lai, X.; Mao, Z.; Zhang, L.; Peng, Z.; Sun, Z. Mapping long-term spatiotemporal dynamics of pen aquaculture in a shallow lake: Less aquaculture coming along better water quality. Remote Sens. 2020, 12, 1866. [Google Scholar] [CrossRef]
- Al Sayah, M.J.; Nedjai, R.; Abdallah, C.; Khouri, M. On the use of remote sensing to map the proliferation of aquaculture ponds and to investigate their effect on local climate, perspectives from the Claise watershed, France. Environ. Monit. Assess. 2020, 192, 301. [Google Scholar] [CrossRef]
- Hou, T.; Sun, W.; Chen, C.; Yang, G.; Meng, X.; Peng, J. Marine floating raft aquaculture extraction of hyperspectral remote sensing images based decision tree algorithm. Int. J. Appl. Earth Obs. Geoinf. 2022, 111, 102846. [Google Scholar] [CrossRef]
- Zhou, J.; Zhou, W.; Zhou, Q.; Zhu, Y.; Xie, F.; Liang, S.; Hu, Y. The Impact of Multiple Pond Conditions on the Performance of Dike-Pond Extraction. Fishes 2022, 7, 144. [Google Scholar] [CrossRef]
- Meng, F.; Fan, Q.; Li, Y. Self-supervised learning for seismic data reconstruction and denoising. IEEE Geosci. Remote Sens. Lett. 2021, 19, 7502805. [Google Scholar] [CrossRef]
- Aslan, A.; Rahman, A.F.; Robeson, S.M.; Ilman, M. Land-use dynamics associated with mangrove deforestation for aquaculture and the subsequent abandonment of ponds. Sci. Total Environ. 2021, 791, 148320. [Google Scholar] [CrossRef] [PubMed]
- Duan, Y.; Tian, B.; Li, X.; Liu, D.; Sengupta, D.; Wang, Y.; Peng, Y. Tracking changes in aquaculture ponds on the China coast using 30 years of Landsat images. Int. J. Appl. Earth Obs. Geoinf. 2021, 102, 102383. [Google Scholar] [CrossRef]
- Liu, T.; Abd-Elrahman, A.; Morton, J.; Wilhelm, V.L. Comparing fully convolutional networks, random forest, support vector machine, and patch-based deep convolutional neural networks for object-based wetland mapping using images from small unmanned aircraft system. GIScience Remote Sens. 2018, 55, 243–264. [Google Scholar] [CrossRef]
- Feizizadeh, B.; Mohammadzade Alajujeh, K.; Lakes, T.; Blaschke, T.; Omarzadeh, D. A comparison of the integrated fuzzy object-based deep learning approach and three machine learning techniques for land use/cover change monitoring and environmental impacts assessment. GIScience Remote Sens. 2021, 58, 1543–1570. [Google Scholar] [CrossRef]
- Tan, A.; Liang, J.; Wu, W.-Z.; Zhang, J.; Sun, L.; Chen, C. Fuzzy rough discrimination and label weighting for multi-label feature selection. Neurocomputing 2021, 465, 128–140. [Google Scholar] [CrossRef]
- Natan, O.; Gunawan, A.I.; Dewantara, B.S.B. A New Feature Extraction Algorithm to Extract Differentiate Information and Improve KNN-based Model Accuracy on Aquaculture Dataset. Int. J. Adv. Sci. Eng. Inf. Technol. IJASEIT 2019, 9, 999–1007. [Google Scholar] [CrossRef]
- Liu, G.; Liu, B.; Li, X.; Zheng, G. Classification of Multi-Channel SAR Data Based on MB-U 2-ACNet Model for Shanghai Nanhui Dongtan Intertidal Zone Environment Monitoring. In Proceedings of the 2021 IEEE International Geoscience and Remote Sensing Symposium IGARSS, Brussels, Belgium, 11–16 July 2021; pp. 7366–7369. [Google Scholar]
- Ye, Z.; Wei, J.; Lin, Y.; Guo, Q.; Zhang, J.; Zhang, H.; Deng, H.; Yang, K. Extraction of Olive Crown Based on UAV Visible Images and the U2-Net Deep Learning Model. Remote Sens. 2022, 14, 1523. [Google Scholar] [CrossRef]
- Ma, Y.; Qu, X.; Feng, D.; Zhang, P.; Huang, H.; Zhang, Z.; Gui, F. Recognition and statistical analysis of coastal marine aquacultural cages based on R3Det single-stage detector: A case study of Fujian Province, China. Ocean. Coast. Manag. 2022, 225, 106244. [Google Scholar] [CrossRef]
- Yu, X.; Wu, X.; Luo, C.; Ren, P. Deep learning in remote sensing scene classification: A data augmentation enhanced convolutional neural network framework. GIScience Remote Sens. 2017, 54, 741–758. [Google Scholar] [CrossRef]
- Tran, S.-T.; Cheng, C.-H.; Liu, D.-G. A multiple layer U-Net, Un-Net, for liver and liver tumor segmentation in CT. IEEE Access 2020, 9, 3752–3764. [Google Scholar] [CrossRef]
- Zeng, Z.; Wang, D.; Tan, W.; Huang, J. Extracting aquaculture ponds from natural water surfaces around inland lakes on medium resolution multispectral images. Int. J. Appl. Earth Obs. Geoinf. 2019, 80, 13–25. [Google Scholar] [CrossRef]
- Lateef, F.; Ruichek, Y. Survey on Semantic Segmentation using Deep Learning Techniques. Neurocomputing 2019, 338, 321–348. [Google Scholar] [CrossRef]
- Fang, Z.; Ren, J.; Sun, H.; Marshall, S.; Zhao, H. SAFDet: A Semi-Anchor-Free Detector for Effective Detection of Oriented Objects in Aerial Images. Remote Sens. 2020, 12, 3225. [Google Scholar] [CrossRef]
- Lu, Y.; Shao, W.; Sun, J. Extraction of Offshore Aquaculture Areas from Medium-Resolution Remote Sensing Images Based on Deep Learning. Remote Sens. 2021, 13, 3854. [Google Scholar] [CrossRef]
- Zeng, Z.; Wang, D.; Tan, W.; Yu, G.; You, J.; Lv, B.; Wu, Z. RCSANet: A Full Convolutional Network for Extracting Inland Aquaculture Ponds from High-Spatial-Resolution Images. Remote Sens. 2020, 13, 92. [Google Scholar] [CrossRef]
- Chen, H.; Chen, C.; Zhang, Z.; Lu, C.; Wang, L.; He, X.; Chu, Y.; Chen, J. Changes of the spatial and temporal characteristics of land-use landscape patterns using multi-temporal Landsat satellite data: A case study of Zhoushan Island, China. Ocean Coast. Manag. 2021, 213, 105842. [Google Scholar] [CrossRef]
- Chen, C.; Chen, H.; Liao, W.; Sui, X.; Wang, L.; Chen, J.; Chu, Y. Dynamic monitoring and analysis of land-use and land-cover change using Landsat multitemporal data in the Zhoushan Archipelago, China. IEEE Access 2020, 8, 210360–210369. [Google Scholar] [CrossRef]
- Chen, C.; Wang, L.; Chen, J.; Liu, Z.; Liu, Y.; Chu, Y. A seamless economical feature extraction method using Landsat time series data. Earth Sci. Inform. 2021, 14, 321–332. [Google Scholar] [CrossRef]
- Vermote, E.; Justice, C.; Claverie, M.; Franch, B. Preliminary analysis of the performance of the Landsat 8/OLI land surface reflectance product. Remote Sens. Environ. 2016, 185, 46–56. [Google Scholar] [CrossRef] [PubMed]
- Wulder, M.A.; Roy, D.P.; Radeloff, V.C.; Loveland, T.R.; Anderson, M.C.; Johnson, D.M.; Healey, S.; Zhu, Z.; Scambos, T.A.; Pahlevan, N.; et al. Fifty years of Landsat science and impacts. Remote Sens. Environ. 2022, 280, 113195. [Google Scholar] [CrossRef]
- Dubovik, O.; Schuster, G.L.; Xu, F.; Hu, Y.; Bösch, H.; Landgraf, J.; Li, Z. Grand challenges in satellite remote sensing. Front. Remote Sens. 2021, 2, 619818. [Google Scholar] [CrossRef]
- Buslaev, A.; Iglovikov, V.I.; Khvedchenya, E.; Parinov, A.; Druzhinin, M.; Kalinin, A.A. Albumentations: Fast and flexible image augmentations. Information 2020, 11, 125. [Google Scholar] [CrossRef]
- Giang, T.L.; Dang, K.B.; Le, Q.T.; Nguyen, V.G.; Tong, S.S.; Pham, V.M. U-Net convolutional networks for mining land cover classification based on high-resolution UAV imagery. IEEE Access 2020, 8, 186257–186273. [Google Scholar] [CrossRef]
- Qin, X.; Zhang, Z.; Huang, C.; Dehghan, M.; Jagersand, M. U2-Net: Going deeper with nested U-structure for salient object detection. Pattern Recognit. 2020, 106, 107404. [Google Scholar] [CrossRef]
Publisher’s Note: MDPI stays neutral with regard to jurisdictional claims in published maps and institutional affiliations. |
© 2022 by the authors. Licensee MDPI, Basel, Switzerland. This article is an open access article distributed under the terms and conditions of the Creative Commons Attribution (CC BY) license (https://creativecommons.org/licenses/by/4.0/).