Article

Distribution and Mobility of Coseismic Landslides Triggered by the 2018 Hokkaido Earthquake in Japan

1
Graduate School of Chinese Academy of Geological Sciences, Beijing 100037, China
2
Chinese Academy of Geological Sciences, China University of Geosciences, Beijing 100083, China
3
State Key Laboratory of Geohazard Prevention and Geoenvironment Protection, Chengdu University of Technology, Chengdu 610059, China
4
Chengdu Center of Geological Survey, China Geological Survey, Chengdu 610081, China
5
Department of Civil and Environmental Engineering, Tufts University, Medford, MA 02155, USA
*
Author to whom correspondence should be addressed.
Remote Sens. 2022, 14(16), 3957; https://doi.org/10.3390/rs14163957
Submission received: 28 June 2022 / Revised: 4 August 2022 / Accepted: 12 August 2022 / Published: 15 August 2022

Abstract

:
At 3:08 on 6 September 2018 (UTC +9), massive landslides were triggered by an earthquake of Mw 6.6 that occurred in Hokkaido, Japan. In this paper, a coseismic landslide inventory that covers 388 km2 of the earthquake-impacted area and includes 5828 coseismic landslides with a total landslide area of 23.66 km2 was compiled by using visual interpretations of various high-resolution satellite images. To analyze the spatial distribution and characteristics of coseismic landslides, five factors were considered: the peak ground acceleration (PGA), elevation, slope gradient, slope aspect, and lithology. Results show more than 87% of the landslides occurred at 100 to 200 m elevations. Slopes in the range of 10~20°are the most susceptible to failure. The landslide density of the places with peak ground acceleration (PGA) greater than 0.16 g is obviously larger than those with PGA less than 0.02 g. Compared with the number and scale of coseismic landslides caused by other strong earthquakes and the mobility of the coseismic landslides caused by the Haiyan and Wenchuan earthquakes, it was found that the distribution of coseismic landslides was extremely dense and that the mobility of the Hokkaido earthquake was greater than that of the Wenchuan earthquake and weaker than that of the Haiyuan earthquake, and is described by the following relationship: L = 18.454 ∗ H0.612. Comparative analysis of coseismic landslides with similar magnitude has important guiding significance for disaster prevention and reduction and reconstruction planning of landslides in affected areas.

1. Introduction

Hundreds, or even tens of thousands, of landslides can be triggered when a large earthquake occurs. Coseismic landslide is a common geological disaster, which causes various degrees of catastrophic damage worldwide by burying buildings, destroying roads and blocking rivers [1,2,3,4,5,6,7,8,9]. The Haiyuan Ms 8.6 earthquake (1920), Wenchuan Ms 8.0 earthquake (2008), Lushan Ms 7.0 earthquake (2013) and Jiuzhaigou Ms 7.0 earthquake (2017) in China triggered more than 3700 landslides, 60,000 landslides, 4000 landslides and 1800 landslides, respectively [6,7,10,11,12,13,14]. These earthquakes destroyed human life and property.
The Hokkaido earthquake occurred in southwest Hokkaido, Japan at 3:08 a.m. on September 6, 2018 (UTC +9). The epicenter of the main shock (Mw 6.6) was located at 42.671°N, 141.933°E and the focal depth was 33.4 km (United States Geological Survey, 2018). This earthquake resulted in thousands of landslides [15]. yphoon Jebi, the strongest typhoon in Japan in 25 years, struck the earthquake-affected area one day before the 2018 Hokkaido earthquake. The heavy rainfalls from the typhoon Jebi weakened geomaterials and the later earthquake-induced strong shaking further disturbed the slope stability, which made the Hokkaido earthquake induce more landslides than other earthquakes with comparable magnitudes. The combination of the Hokkaido earthquake and Typhoon Jebi caused total economic losses of 2 billion USD. Slope stability is affected by multiple external factors, such as earthquakes, heavy rainfalls associated with typhoons, water fluctuation, snow melt, and human activities [16,17,18,19,20,21,22,23]. The 2018 Hokkaido earthquake provides an exceptional example to study how the pre-earthquake saturation induced by heavy rainfalls of a typhoon affects the coseismic landslide occurrence and mobility.
Detailed inventories of coseismic landslides play an important role in regional landslide hazard assessment. Only 13 inventories of coseismic landslides were completed before 2008. However, after the Wenchuan earthquake, the number of coseismic landslide inventories for strong earthquakes has increased to 42 [24]. After the Hokkaido earthquake, scholars have conducted several studies on the secondary disasters triggered by the Hokkaido earthquake, including focal mechanisms and seismic site responses [25,26,27,28,29,30], and the spatial distribution characteristics and susceptibility analysis of coseismic landslides [9,31,32,33,34,35]. For the 2018 Hokkaido earthquake, Yamagishi et al. (2018) reported that the shallow landslides induced by the 2018 Hokkaido earthquake concentrated in a geological layer mainly consisted of air-fall pumice originated from the eruption of the Tarumai Volcano 9000 years ago [15]. Wang et al., 2019 studied the spatial distribution of coseismic landslides triggered by the earthquake within an area of 700 km2 and found that the rainfall and the influence of typhoon Jebi were of secondary importance, but Zhao et al., 2020 concluded that the coseismic landslide was most affected by rainfall factors [9,36]. Shao et al. (2019) interpreted 9295 landslides after the event and analyzed the spatial distribution law of landslides by considering the 10 factors of elevation, slope angle, aspect, curvature, fault, distances to the epicenter, PGA, rivers, road and lithology. Then, they analyzed the coseismic landslide susceptibility based on the LR and SVM method and argued that the performance of the SVM is slightly better than the LR mode [37]. The number of coseismic landslides triggered by the 2018 Hokkaido earthquake is significantly larger than that triggered by other earthquakes of a strong magnitude. It remains important to study the distribution of coseismic landslides triggered by the 2018 Hokkaido earthquake.
Mobility is another important element of landslide hazard and risk assessments yet has been seldom studied for the coseismic landslide. Landslide mobility is often characterized by the ratio of landslide-fall height (H) to travel length (L), H/L [38], where low values of H/L indicate high mobility and high H/L values indicate low mobility. Landslide mobility has been of widespread concern for scientists and practitioners for a long time because of its potential direct impact on the people and infrustracture downslope [38,39,40].
In this paper, we analyzed the spatial distribution and mobility characteristics of the coseismic landslides triggered by the 2018 Hokkaido Earthquake based on a newly-compiled landslide inventory surrounding the earthquake epicenter. The data and methods used to compile the coseismic landslide inventory are described in the next section. The spatial landslide density is correlated with PGA, elevation, slope gradient, slope aspect, and lithology. The landslide area and mobility statistics are compared with the coseismic landslide inventories for other earthquakes.

2. Materials and Methods

2.1. Study Area

2.1.1. The 2018 Hokkaido Earthquake and Regional Tectonics

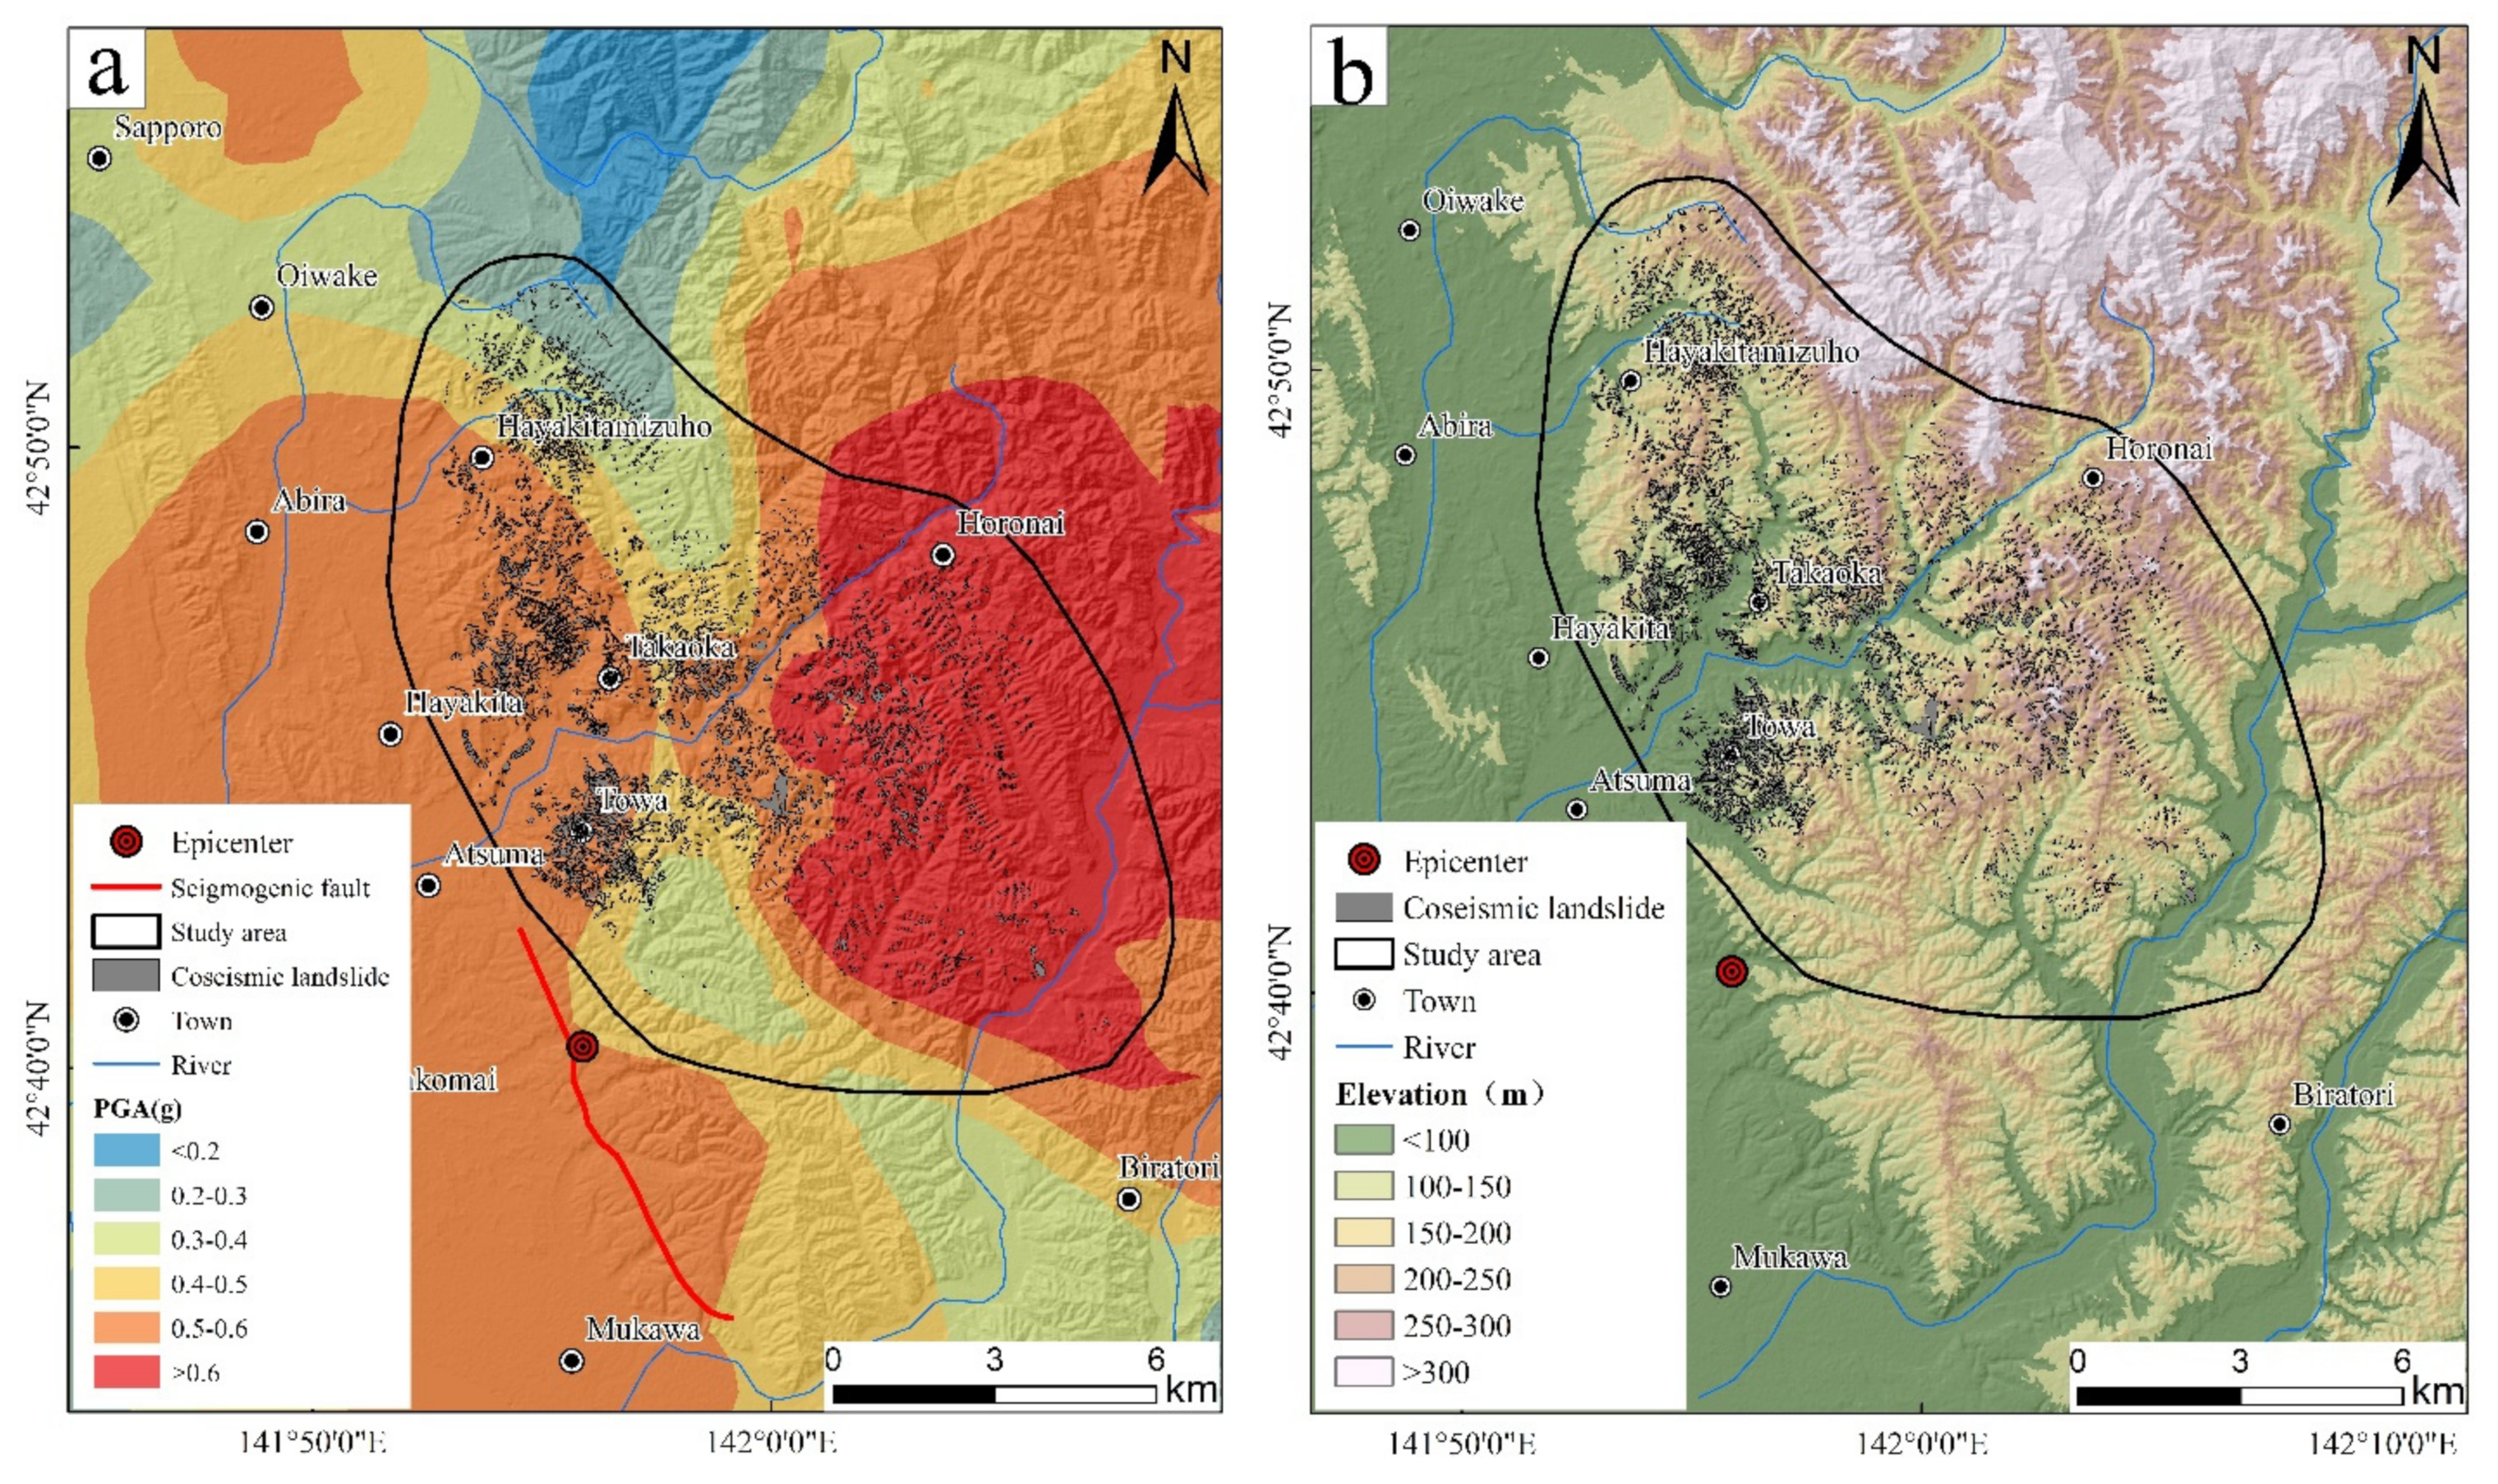
The Hokkaido earthquake occurred in the North-Kyuryo seismic belt, which is subducted under Japan and the Kuril-Kamchatka Trench, where the Pacific plate moves northwest relative to the North American Plate at a rate of approximately 87 mm/year (United States Geological Survey 2019). Focal mechanism solutions indicate that the Hokkaido earthquake occurred on a reverse fault with an NW-SE strike (Figure 1). The 2018 Hokkaido Earthquake caused intense shaking in the central region of Hokkaido(Figure 2). The study area is about 400 km2 in extent and is located in the eastern Iburi region of Hokkaido, 50 km southeast of Sapporo and 30 km northeast of Tomakomai; it includes the towns of Abira, Atsuma, and Mukawa, where landslides were densely distributed. The maximum measured peak ground acceleration (PGA) during the 2018 Hokkaido earthquake was 0.84 g, which was recorded 8 km away from the epicenter. Approximately 70% of the study area experienced PGAs above 0.5 g. The 2018 Hokkaido earthquake induced extensive landslides, some of which caused casualties and severe damage to transportation, power, and communication facilities. Seven aftershocks above Mw 4.3 were located by the USGS within 14 h after the major shock, two of which were larger than Mw 5 (the largest was Mw 5.4). The study area is a seismically active area. Central Hokkaido has several active seismic zones, including the Fuliangye and Shishou fault zones. According to USGS statistics of historical earthquakes, two earthquakes with magnitudes greater than Mw 6.0 have occurred in the study area; one Mw 6.0 earthquake occurred on 8 November 1974, and one Mw 6.3 earthquake occurred on 23 January 1981.

2.1.2. Geological Setting

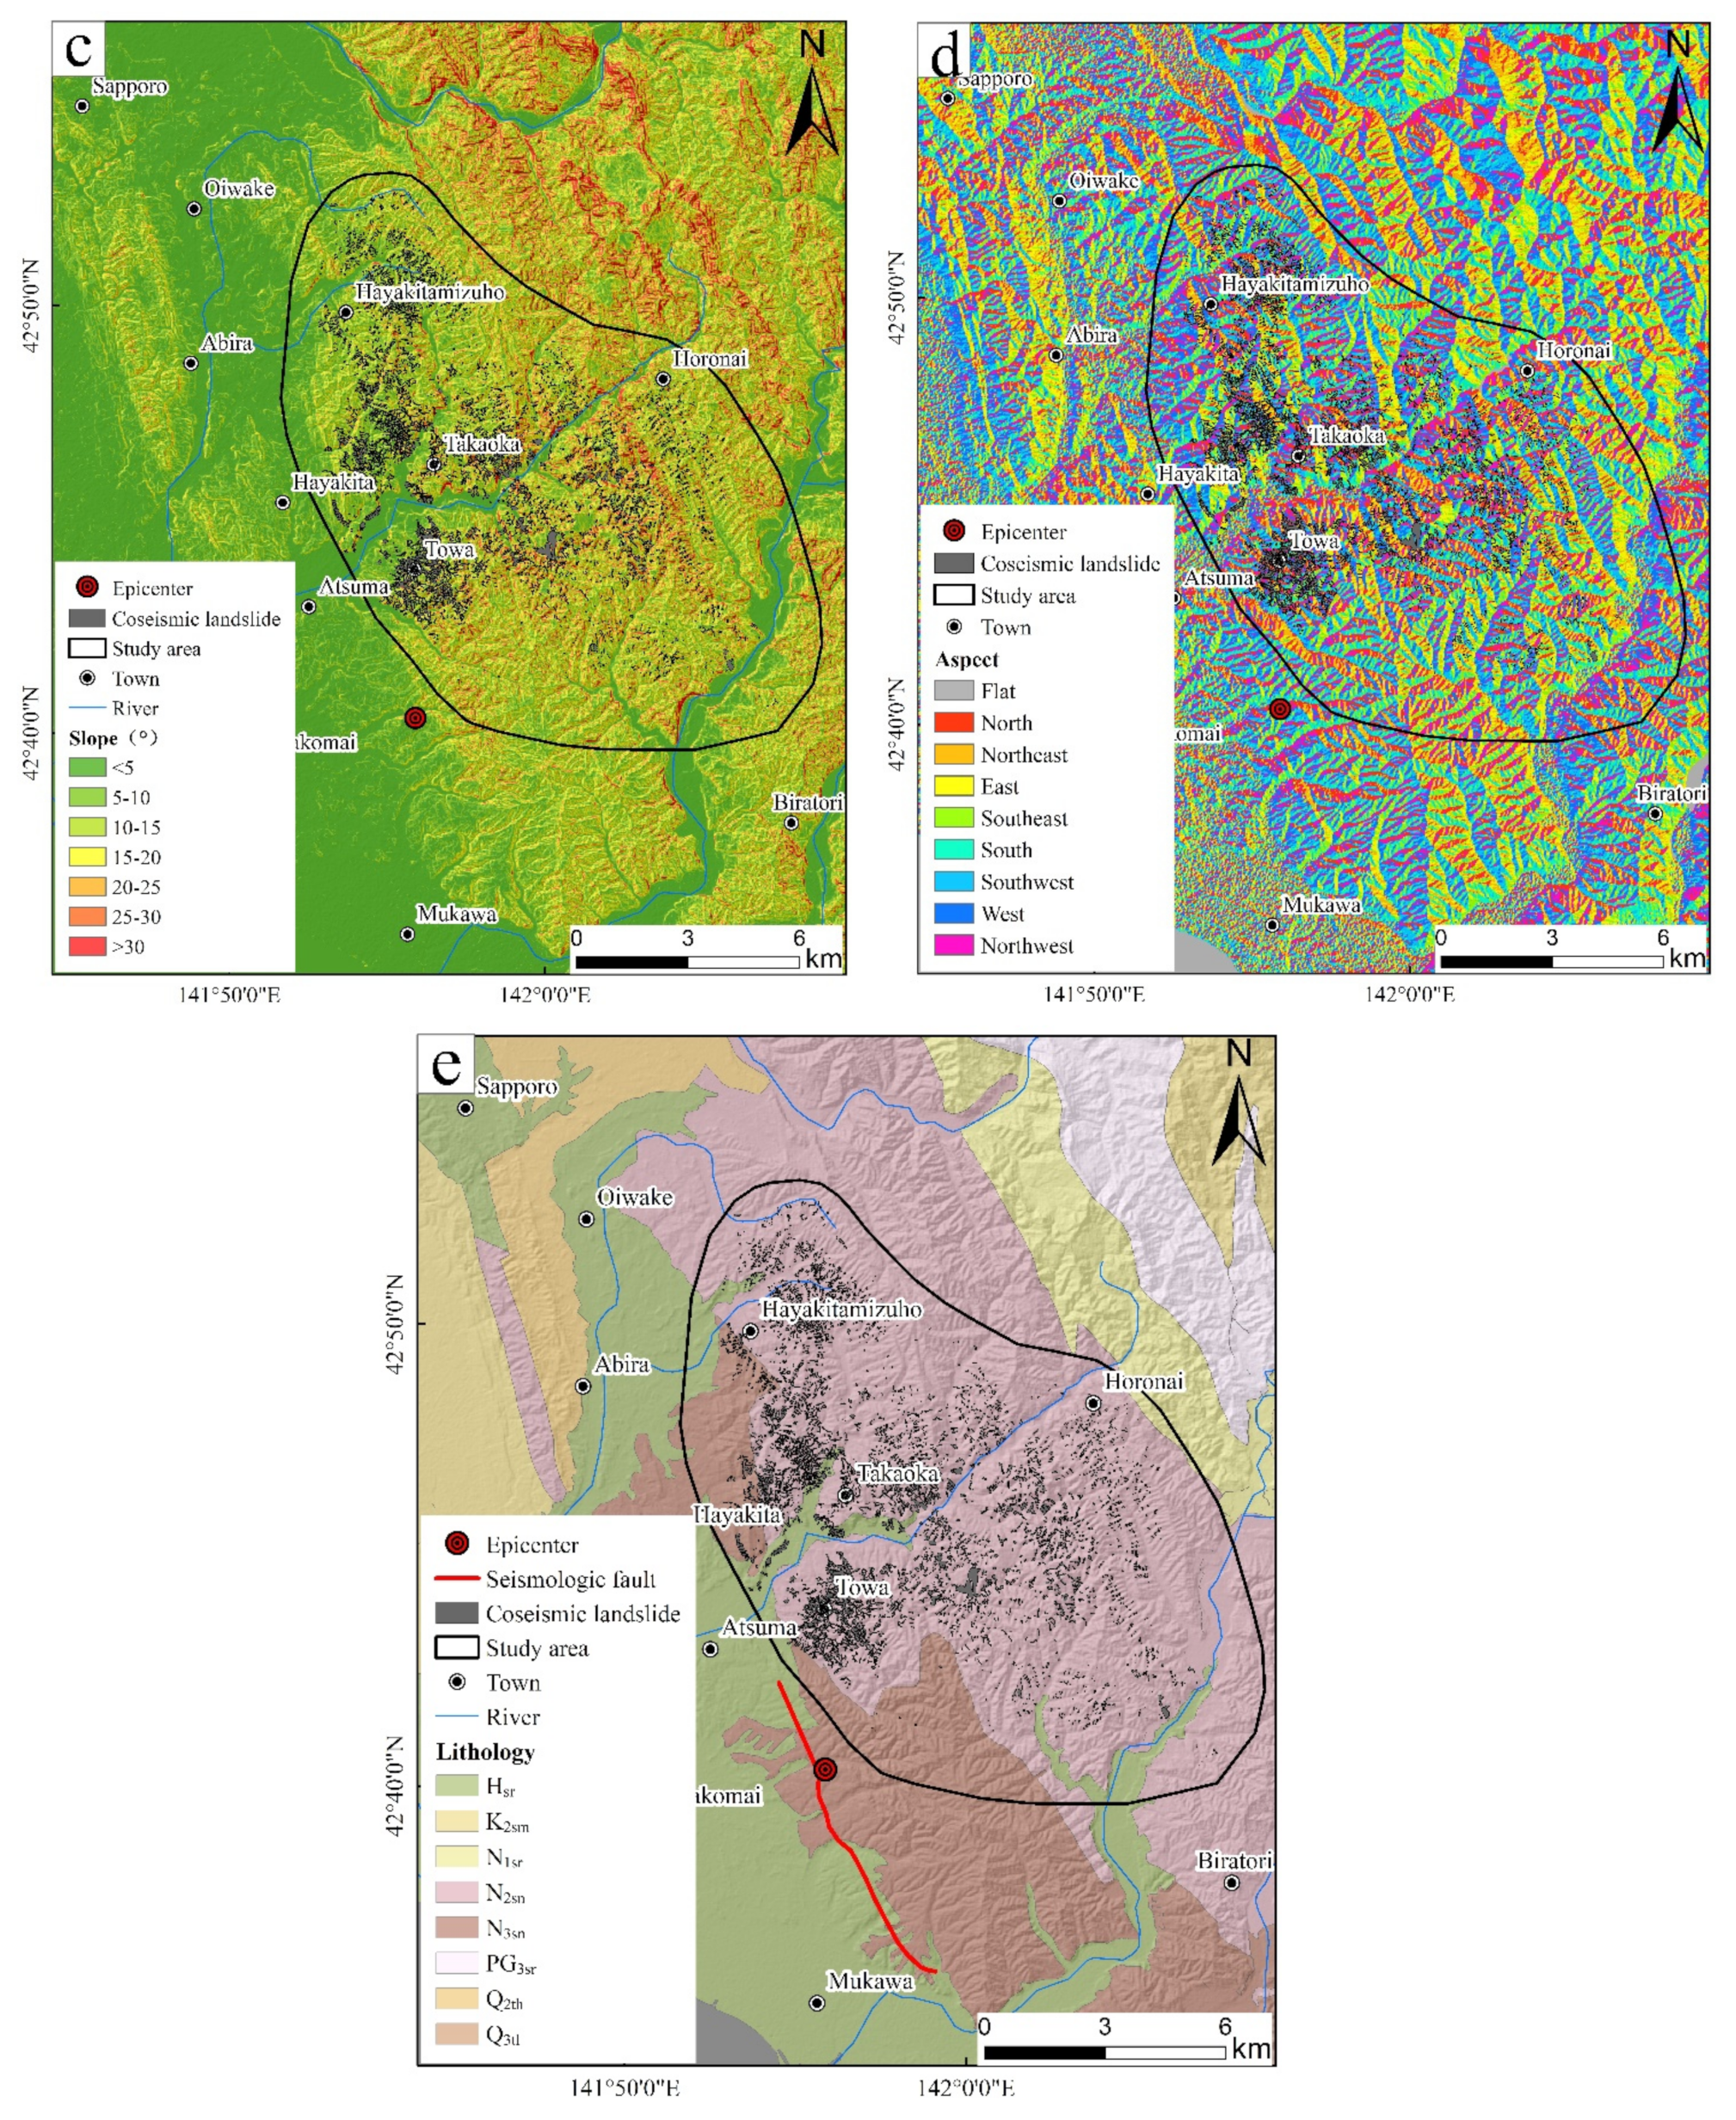
The geological map of the earthquake-impacted area of the 2018 Hokkaido earthquake is collected from the Geological Survey of Japan (GSJ). The study area mainly includes eight types of lithology (Figure 1): Hsr, Q3tl, Q2th, N3sn, N2sn, N1sr, K2sm and PG3sr. There are many active and dormant volcanoes in the study area where porous volcanic materials absorb water easily and become very slippery.The study area had been hit by heavy rains from the Typhoon Jebi on 4 September, which may adversely affected the strength of the porous volcanic materials before the earthquake occurrence.

2.2. Data and Methodology

Landslide inventories play an important role in the spatial distribution analysis and risk management of coseismic geological disasters. This work conducted visual interpretations of satellite images to build the coseismic landslide inventory for the 2018 Hokkaido earthquake. A wide variety of pre- and post-earthquake satellite images were used to cover the broad earthquake-impacted area. Pre-earthquake remote sensing images were mainly from Google Earth, Planet, and Sentinel-2 images. These pre-earthquake images were obtained one year before the earthquake and covered the entire earthquake-affected area. There were five sources of remote sensing images after the earthquake: (a) Google Earth platform, (b) SuperView-1, (c) Planet, images from http://www.planet.com/explore (last accessed on 20 June 2022), (d) Sentinel-2, and (e) WorldView-3, images from https://google.org/crisismap (accessed on 16 September 2018). The details and coverage of these images are shown in Table 1 and Figure 2. Landslide boundaries were accurately delineated through visual interpretation of pre- and post-earthquake images on the ArcGIS platform. If a landslide existed before the earthquake and its shape did not change after the earthquake, the landslide was judged as a pre-existing landslide. If a landslide did not exist before the earthquake or its shape changed after the earthquake, the landslide was judged as a coseismic landslide.
The spatial distributions of coseismic landslides are strongly related to seismic, geologic, and topographic factors [3,8]. Five parameters, including PGA, elevation, slope gradient, slope aspect, and lithology, were selected to analyze the controlling factors of the coseismic landslides triggered by the Hokkaido earthquake. First, factors such as terrain, geology, and seismology were categorized into various discrete classes on the GIS platform according to the classification rules shown in Table 2. The eight lithologic classes are displayed in Figure 1. A PGA map provided by the USGS was used to present the seismic shaking intensity. Three terrain factors, namely elevation, slope angle, and slope aspect, were considered in this work and were derived using a 30-m resolution pre-earthquake digital elevation model (DEM). Then, the spatial distributions of coseismic landslides for each class of each factor were quantified through three different indexes: landslide area (LA), landslide number density (LND), and landslide areal percentage (LAP). Statistical analysis was applied to investigate the correlation of each factor with the landslide occurrence. As the study area was subjected to a severe typhoon and a strong earthquake within a few days, most landslides exhibited strong mobility. Therefore, this paper provides a preliminary analysis of the mobility of shallow landslides of the 2018 Hokkaido earthquake. The equivalent friction coefficient, which is the ratio between the maximum height H and maximum horizontal movement distance L of a landslide, is applied to evaluate landslide mobility.

3. Result

3.1. Coseismic Landslide Inventory

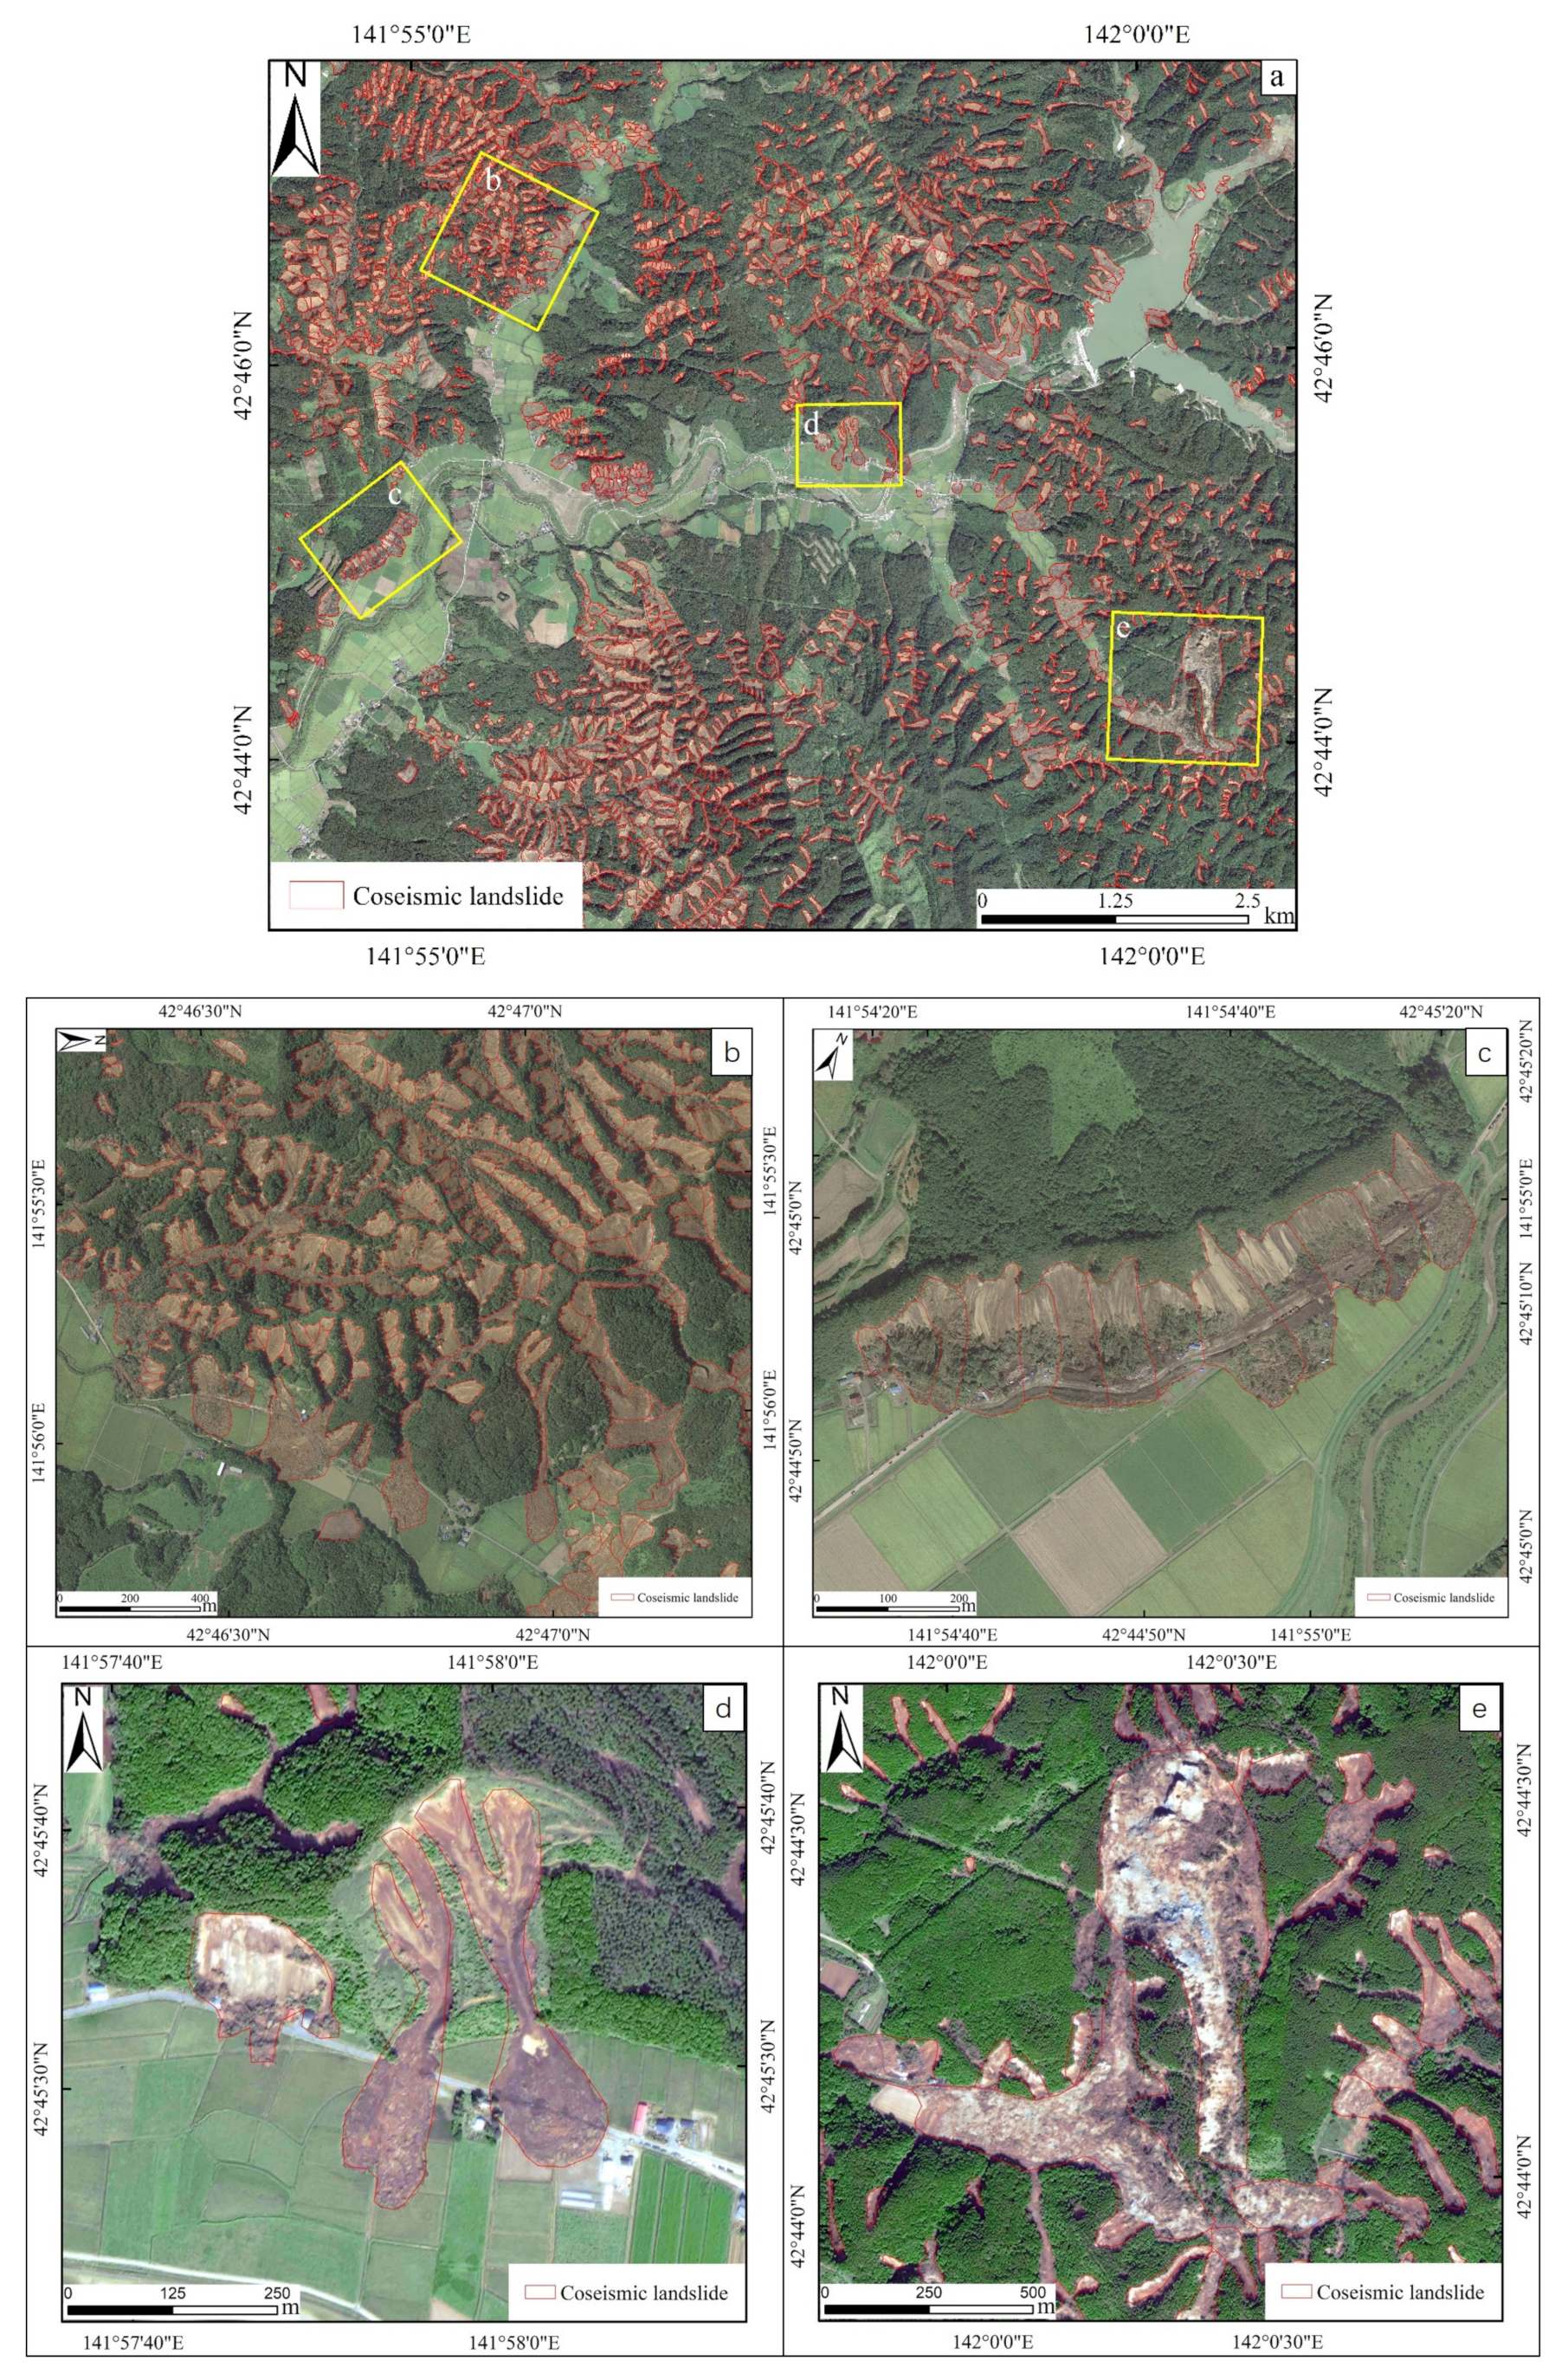
The inventory of the coseismic landslides induced by the 2018 Hokkaido earthquake is shown in Figure 2. In total, 5828 coseismic landslides were documented in our landslide inventory. The total area of these landslides is 23.66 km2, and the areas of individual landslides range from 87 m2 to 530,000 m2. The 2018 Hokkaido earthquake triggered a large number of landslides that took place on small hillsides. Most landslides triggered by the 2018 Hokkaido earthquake were small- and medium-sized shallow landslides developed in the Late Pleistocene to Holocene sediments. Landslides triggered by the 2018 Hokkaido earthquake are characterized by a very high spatial density of landslides in the earthquake-impacted area (Figure 3). Some landslides also showed long-runout characteristics and damaged the road and houses (Figure 3b,d). The 2018 Hokkaido earthquake only induced one rock landslide (Figure 3e), which was located in an area with a PGA of 0.5–0.6 g. The rock landslide has an area of ~0.53 km2 and a sliding distance of ~350 m. This landslide area is mainly composed of N2sn rock mass.

3.2. Spatial Distribution of Coseismic Landslides

This section describes the statistical correlations between the three landslide distribution parameters (landslide area, landslide number density, and landslide area percentage) and the five factors (PGA, elevation, slope gradient, slope aspect, and lithology).

3.2.1. Seismic Factors

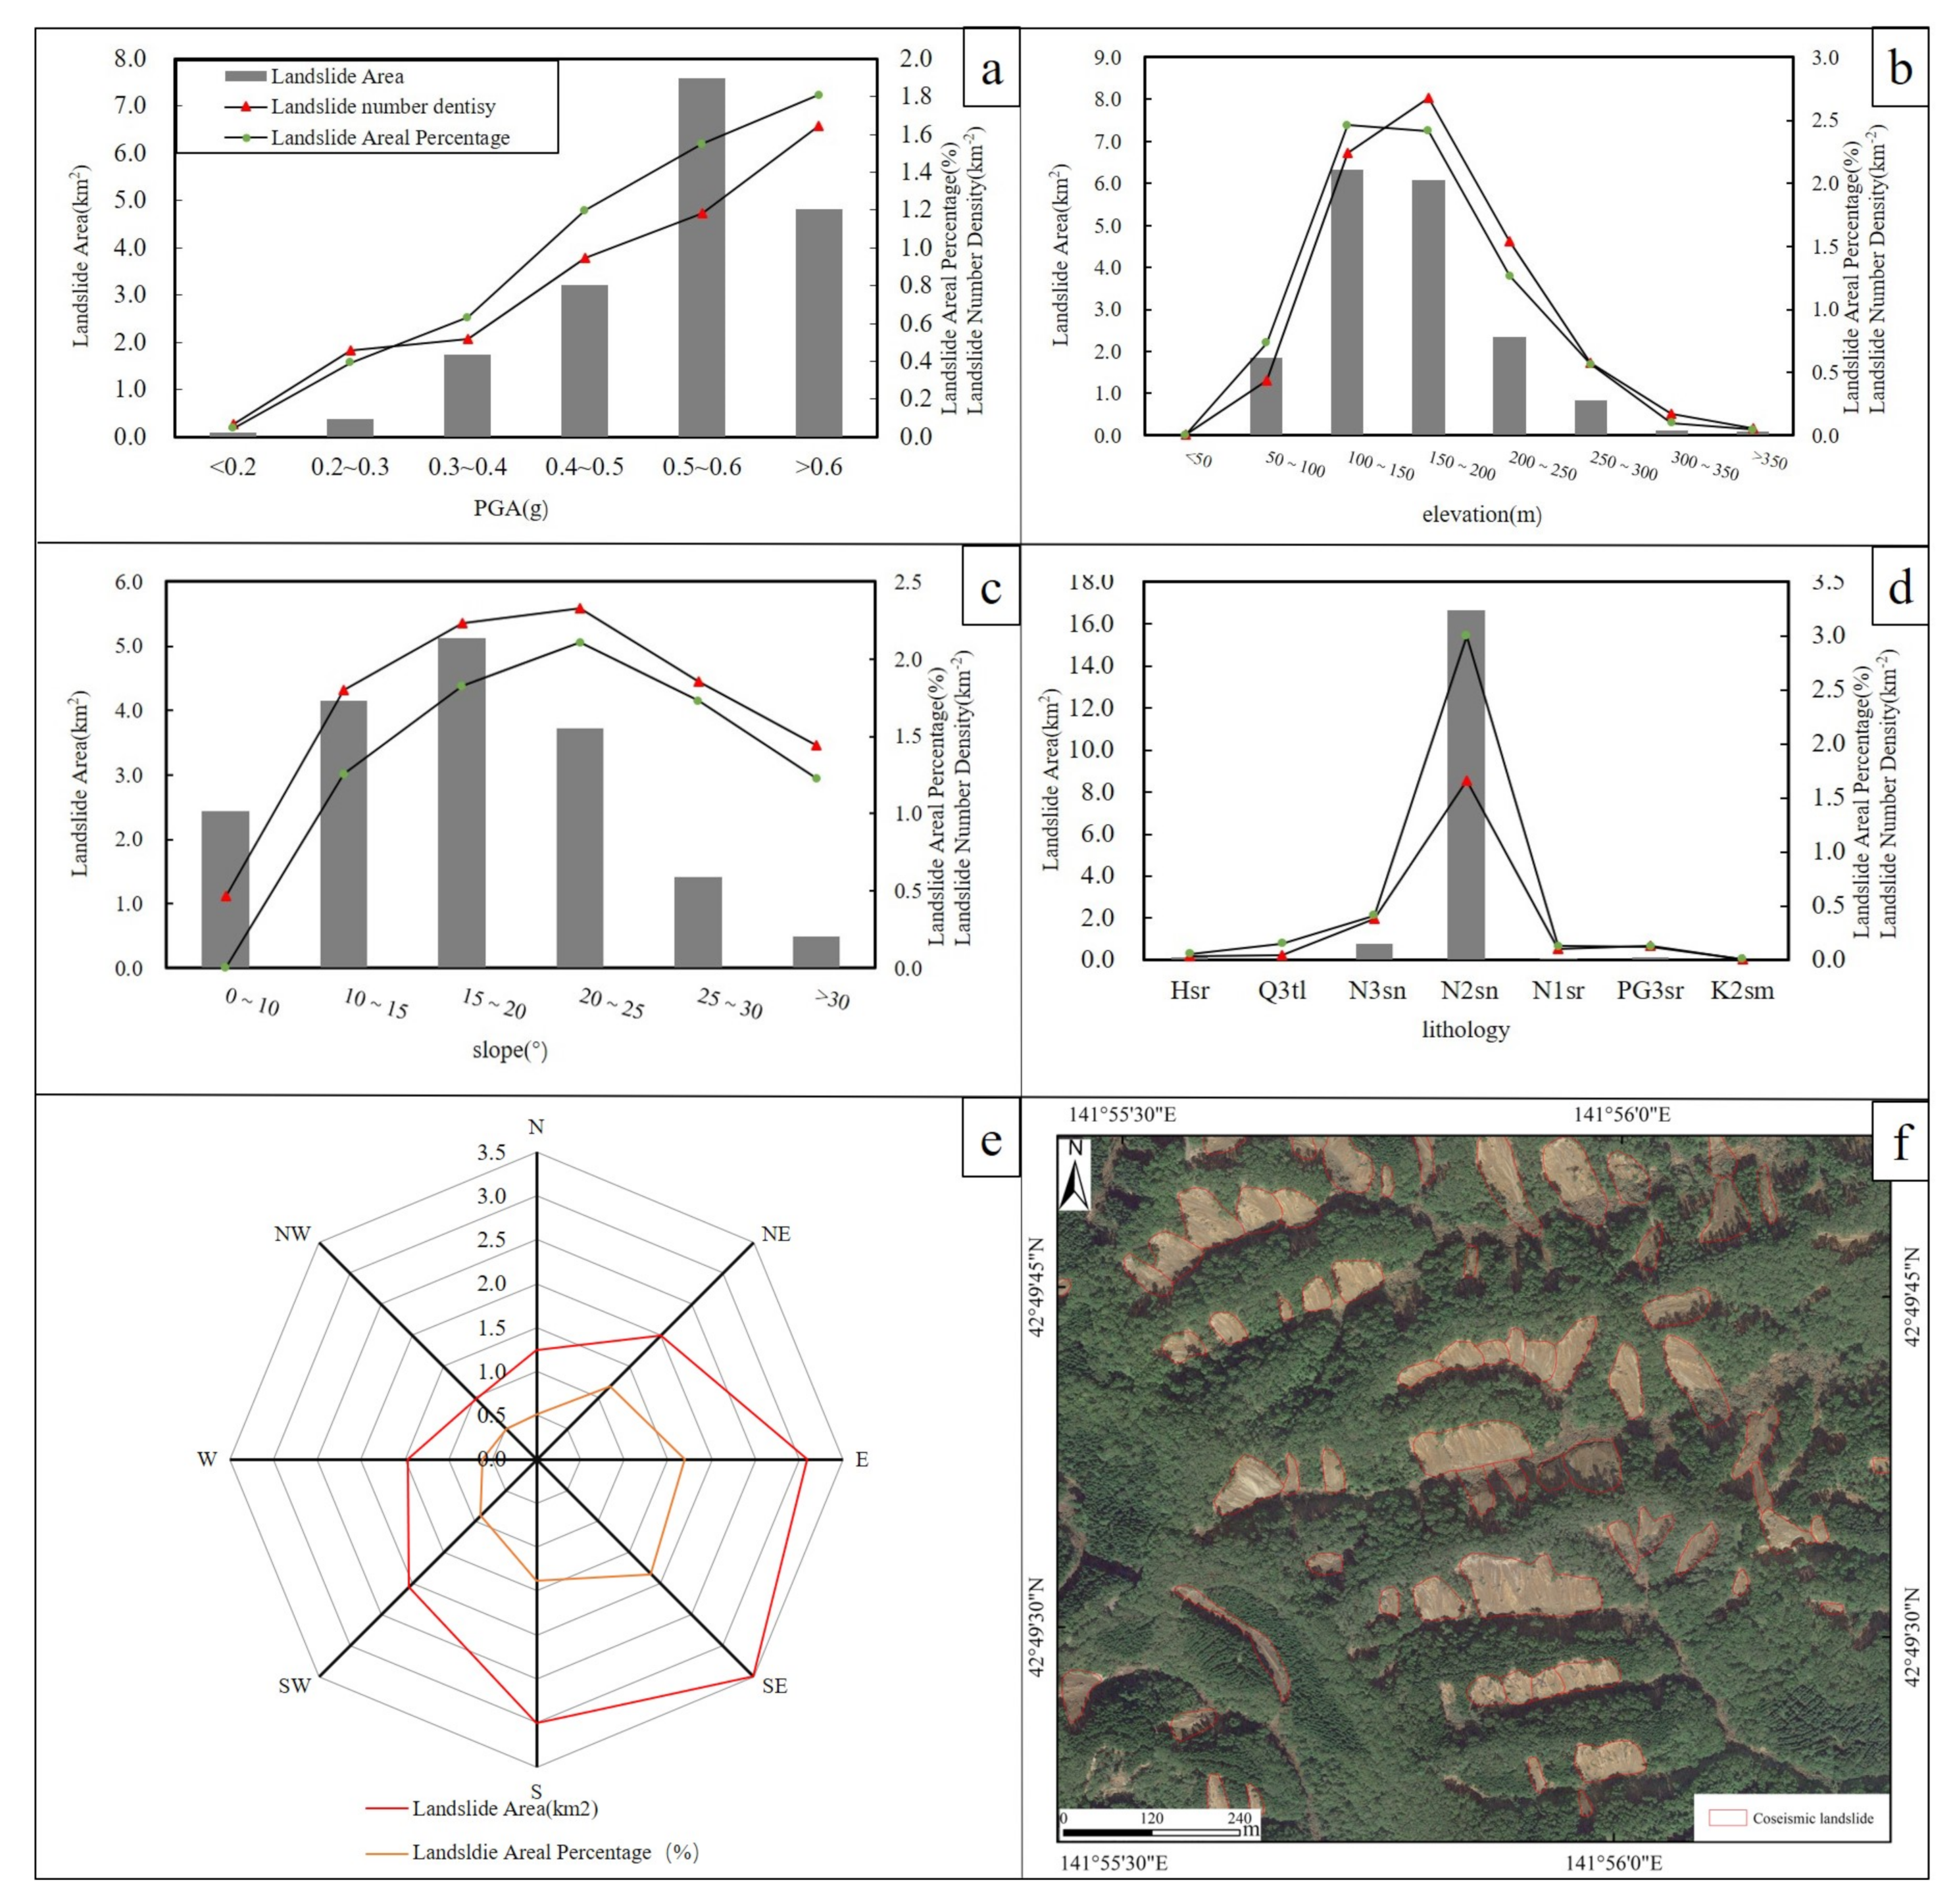
PGA is an important parameter to reflect ground motion intensity during earthquakes. About 87.6% of coseismic landslides of the 2018 Hokkaido earthquake occurred in areas with estimated PGA greater than 0.4 g and most of these landslides concentrated in an area with PGA of 0.5~0.6 g (Figure 4a and Figure 5a). Both landslide number density and landslide areal density increase steadily with increases in PGA (Figure 5a), which is in accordance with the general statistical law for spatial distributions of coseismic landslides.

3.2.2. Terrain Factors

This study investigated the correlation between landslide occurrence with three terrain factors, such as altitude, slope and aspect. Landslide area, landslide number density, and landslide area percentage showed consistent relationships with elevation. Figure 4b and Figure 5b show that most coseismic landslides of the 2018 Hokkaido earthquake were distributed at elevations from 100 m to 200 m. Relatively few landslides were located on slopes with elevations less than 100 m or greater than 200 m. Loose materials, vegetation types, and human activity intensities at different elevations may be the causes of different landslide intensities.
Slope gradients can affect slope stability by changing the slope stress distributions and presiding accumulations of loose surface materials. Approximately 53.5% of the coseismic landslides were distributed over a slope range from 10° to 20° (Figure 4c and Figure 5c). 90.7% of coseismic landslides occurred on slopes less than 25°. The coseismic landslides of the 2018 Hokkaido earthquake were relatively small, which may be due to the different types of landslides. However, over a larger slope range, the number density and areal density of coseismic landslides were smaller, which may have resulted from soil moisture saturation before the earthquake and the occurrence of low-angle soil liquefaction and landslides in strong earthquakes. Compared with the loess landslides triggered by the Haiyuan earthquake and the rock landslides triggered by the Wenchuan, Lushan and Jiuzhaigou earthquakes, shallow soil landslides were the main type of disaster that was triggered by the Hokkaido earthquake and the statistical results of the spatial distributions for coseismic landslides were similar to those of the Haiyuan earthquake (Figure 6). The landslide areal percentage usually increases with increasing slope angle for coseismic landslide inventories mainly consisted of rockslides, such as those for the 2008 Wenchuan, 2013 Lushan, and 2017 Jiuzhaigou earthquakes (Figure 6).The potential reason is that steep slopes generally tend to have higher shear stress and lower stability than gentle slopes before the earthquake disturbance. The landslide areal density shows a parabola relationship with slope (i.e., first increase and then decrease with the rise of slope) for the coseismic landslides of the 2018 Hokkaido earthquake and the 1920 Haiyuan earthquake (Figure 6). We hypothesize that the slope gradients can affect the hydrological properties and processes (i.e., groundwater flow and depth) and then affect the slope’s dynamic stability.
The slope aspect has a certain influence on the failure of rock and soil slopes.First, the slope aspect influences slope stability through inconsistent rainfall distribution on the slopes. Second, the slope aspect can affect seismic wave propagation, which will also lead to uneven distributions of coseismic landslides on slopes. Based on the statistical results, the coseismic landslides triggered by the 2018 Hokkaido earthquake had significantly uneven densities for different slope aspects. Most landslides occurred on southeast slopes, which is consistent with the strike of the seismogenic fault (Figure 4e and Figure 5e).

3.2.3. Geological Factor

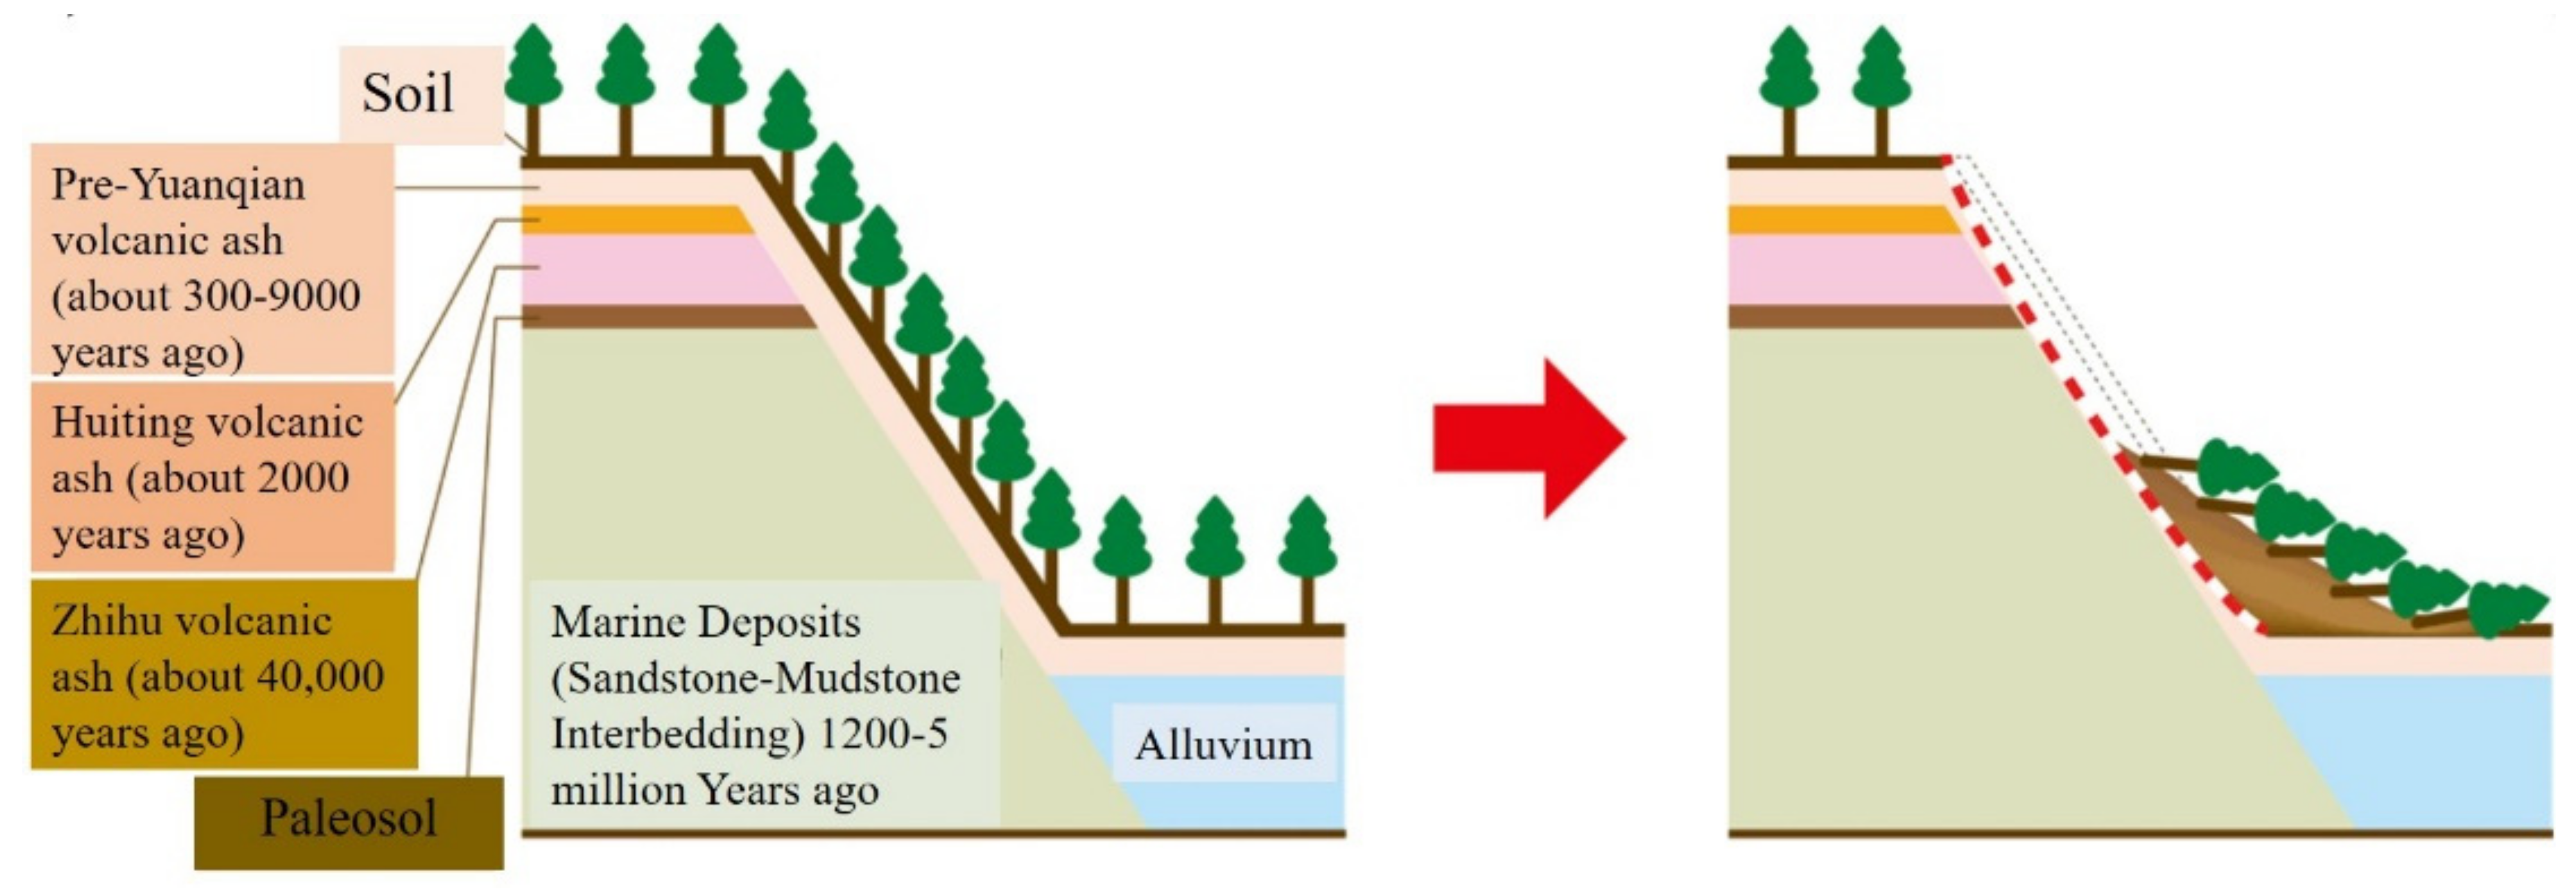
Lithology is an intrinsic factor that controls slope stability. The parent rock controls rocky slope stability by affecting rock structures, weathering degrees, and the physical and mechanical characteristics. Soil slope stability is impacted by material type, consolidation degree, deposition age, and water contents. Since most of the landslides triggered by the Hokkaido earthquake were shallow debris slides and flows, the type of sediments that covered the slope surfaces was more important than the underlying bedrock (Figure 7). Based on our statistics, nonmarine sediments from the Middle to Late Miocene non-marine sediments (N2sn) are the most developed lithologic zone for coseismic landslides and 93.1% of seismic landslides were distributed in this zone. According to Fan et al. (2019), this zone is covered by thick, volcanic pumice deposits (Figure 7), which may be subject to liquefaction failures when they are fully or partially saturated [11]. The Hokkaido area experienced a strong typhoon (Jebi) one day before the earthquake. The heavy rainfalls caused by Typhoon Jebi contributed to the saturation of slope materials and massive slope failures in the Hokkaido earthquake. Considering the extremely high susceptibility to landslides for this type of slope (see Figure 6), we suggest that more effort should be made on studies of the dynamic behaviors of volcanic ash (especially pumice) and the dynamic failure mechanisms of this type of slope.

4. Discussion

4.1. Comparisons of the Number and Scale of Coseismic Landslides with Other Strong Earthquakes

The scale and number of coseismic landslides are closely related to earthquake magnitudes, geological and geomorphological settings [41]. This section first compares total landslide areas, landslide-affected areas, and landslide numbers for the Hokkaido earthquake with other earthquakes of varying magnitudes (Figure 8a–c, respectively). The 2018 Hokkaido earthquake seems to have a moderate landslide effects as its landslide area, landslide-affected area, landslide number are close to the general trend lines. Both the total landslide area and landslide-affected area of the Hokkaido earthquake is on the general trend lines which implies that this earthquake had moderate impacts at coseismic landslide scales. The landslide number for the Hokkaido earthquake was greater than the trend value for earthquakes with Mw 6.6 magnitude. Generally, the scale and number of coseismic landslides in the Hokkaido earthquake (Mw 6.6) were closest to those of the Lushan earthquake (Mw 6.6) as the total landslide areas and landslide numbers for these two earthquakes were the most consistent. A clear difference between these two earthquakes is that the landslide-affected area of the Lushan earthquake was almost two times larger than that of the Hokkaido earthquake. The most frequent landslide type in the Lushan earthquake was rockslides [12], while debris slides dominated the Hokkaido earthquake. Although the landslide-affected area of an earthquake is easily determined by researchers, the great difference in this value between these two earthquakes implies that earthquakes can affect larger areas when the slope stability in an area is dominated by rocks rather than by soils. The largest landslide area density shown in Table 3 may also support this conclusion.
Figure 8d compared distributions of individual area densities of coseismic landslides in the four selected earthquakeswith similar magnitudes: the 2013 Lushan earthquake (Mw 6.6), 2017 Jiuzhaigou earthquake (Mw 6.5), and 2017 Nyingchi earthquake (Mw 6.4), and 2018 Hokkaido earthquake(Mw 6.6). Coseismic landslides of the four selected earthquakes generally followed an inverse gamma distribution in which a turning point (peak value point correspondings to the landslide area with the highest frequency) separates large-scale landslides (right side of the distribution) and small-scale landslides (left side of the distribution). The most common landslide area in the Hokkaido earthquake was approximately 1000 m2, which is consistent with the Nyingchi earthquake in which landslides mainly occurred in the Grand Canyon region and consisted of rock falls, rock avalanches, and deposit failures [8]. The most common landslide areas in both the Lushan and Jiuzhaigou earthquakes were approximately 100 m2, while landslides occurred mainly in the Aipline area.

4.2. Comparisons of the Mobility of Coseismic Landslides with Other Strong Earthquakes

Landslide mobility is influenced by slope materials, landslide type and size, hydrological conditions, landslide triggers, and local topography. Hydromechanical principles fully explain why most landslides occur in wet weather and produce high groundwater pressures [40,45,46]. The most common types of landslides triggered by the Hokkaido earthquake were shallow debris slides and flows. These landslides were small- or medium-sized but characterized as high mobility. Spatial analysis based on the landslide inventory and DEM was conducted to derive maximum horizontal travel distances (L) and height differences (H) for coseismic landslides in the Hokkaido earthquake. The H/L ratio (called the reach angle or apparent coefficient of friction) is a well-known index for expressing landslide mobility [47]. The density curves of H/L ratios of selected unblocked landslides triggered by the 1920 Haiyuan, 2008 Wenchuan, and 2018 Hokkaido earthquakes are shown in Figure 9. The apparent coefficient of friction of the selected 50 unblocked landslides triggered by the 2018 Hokkaido earthquake ranged from 0.04 to 0.44 with a mean value of 0.25 (equivalent to a friction angle of 14°). The H/L ratios of 57 loess landslides that were triggered by the 1920 Haiyuan earthquake [13] were 0.01–0.52, with an average value of 0.17 (equivalent to a friction angle of 10°). The 31 rock landslides triggered by the 2018 Wenchuan earthquake [13] had H/L ratios from 0.1–0.75 and an average value of 0.42 (equivalent to a friction angle of 23°). It was determined that the mobility of typical soil slides/flows in the Hokkaido earthquake was stronger than typical rockslides in the Wenchuan earthquake but was weaker than typical loess slides in the Haiyuan earthquake by comparing the mean values of apparent friction ratios (Figure 9). The soil slopes which were composed of mostly volcanic ash in the Hokkaido earthquake and loess in the Haiyuan earthquake exhibited higher mobility and lower variation than the rockslides in the Wenchuan earthquake.
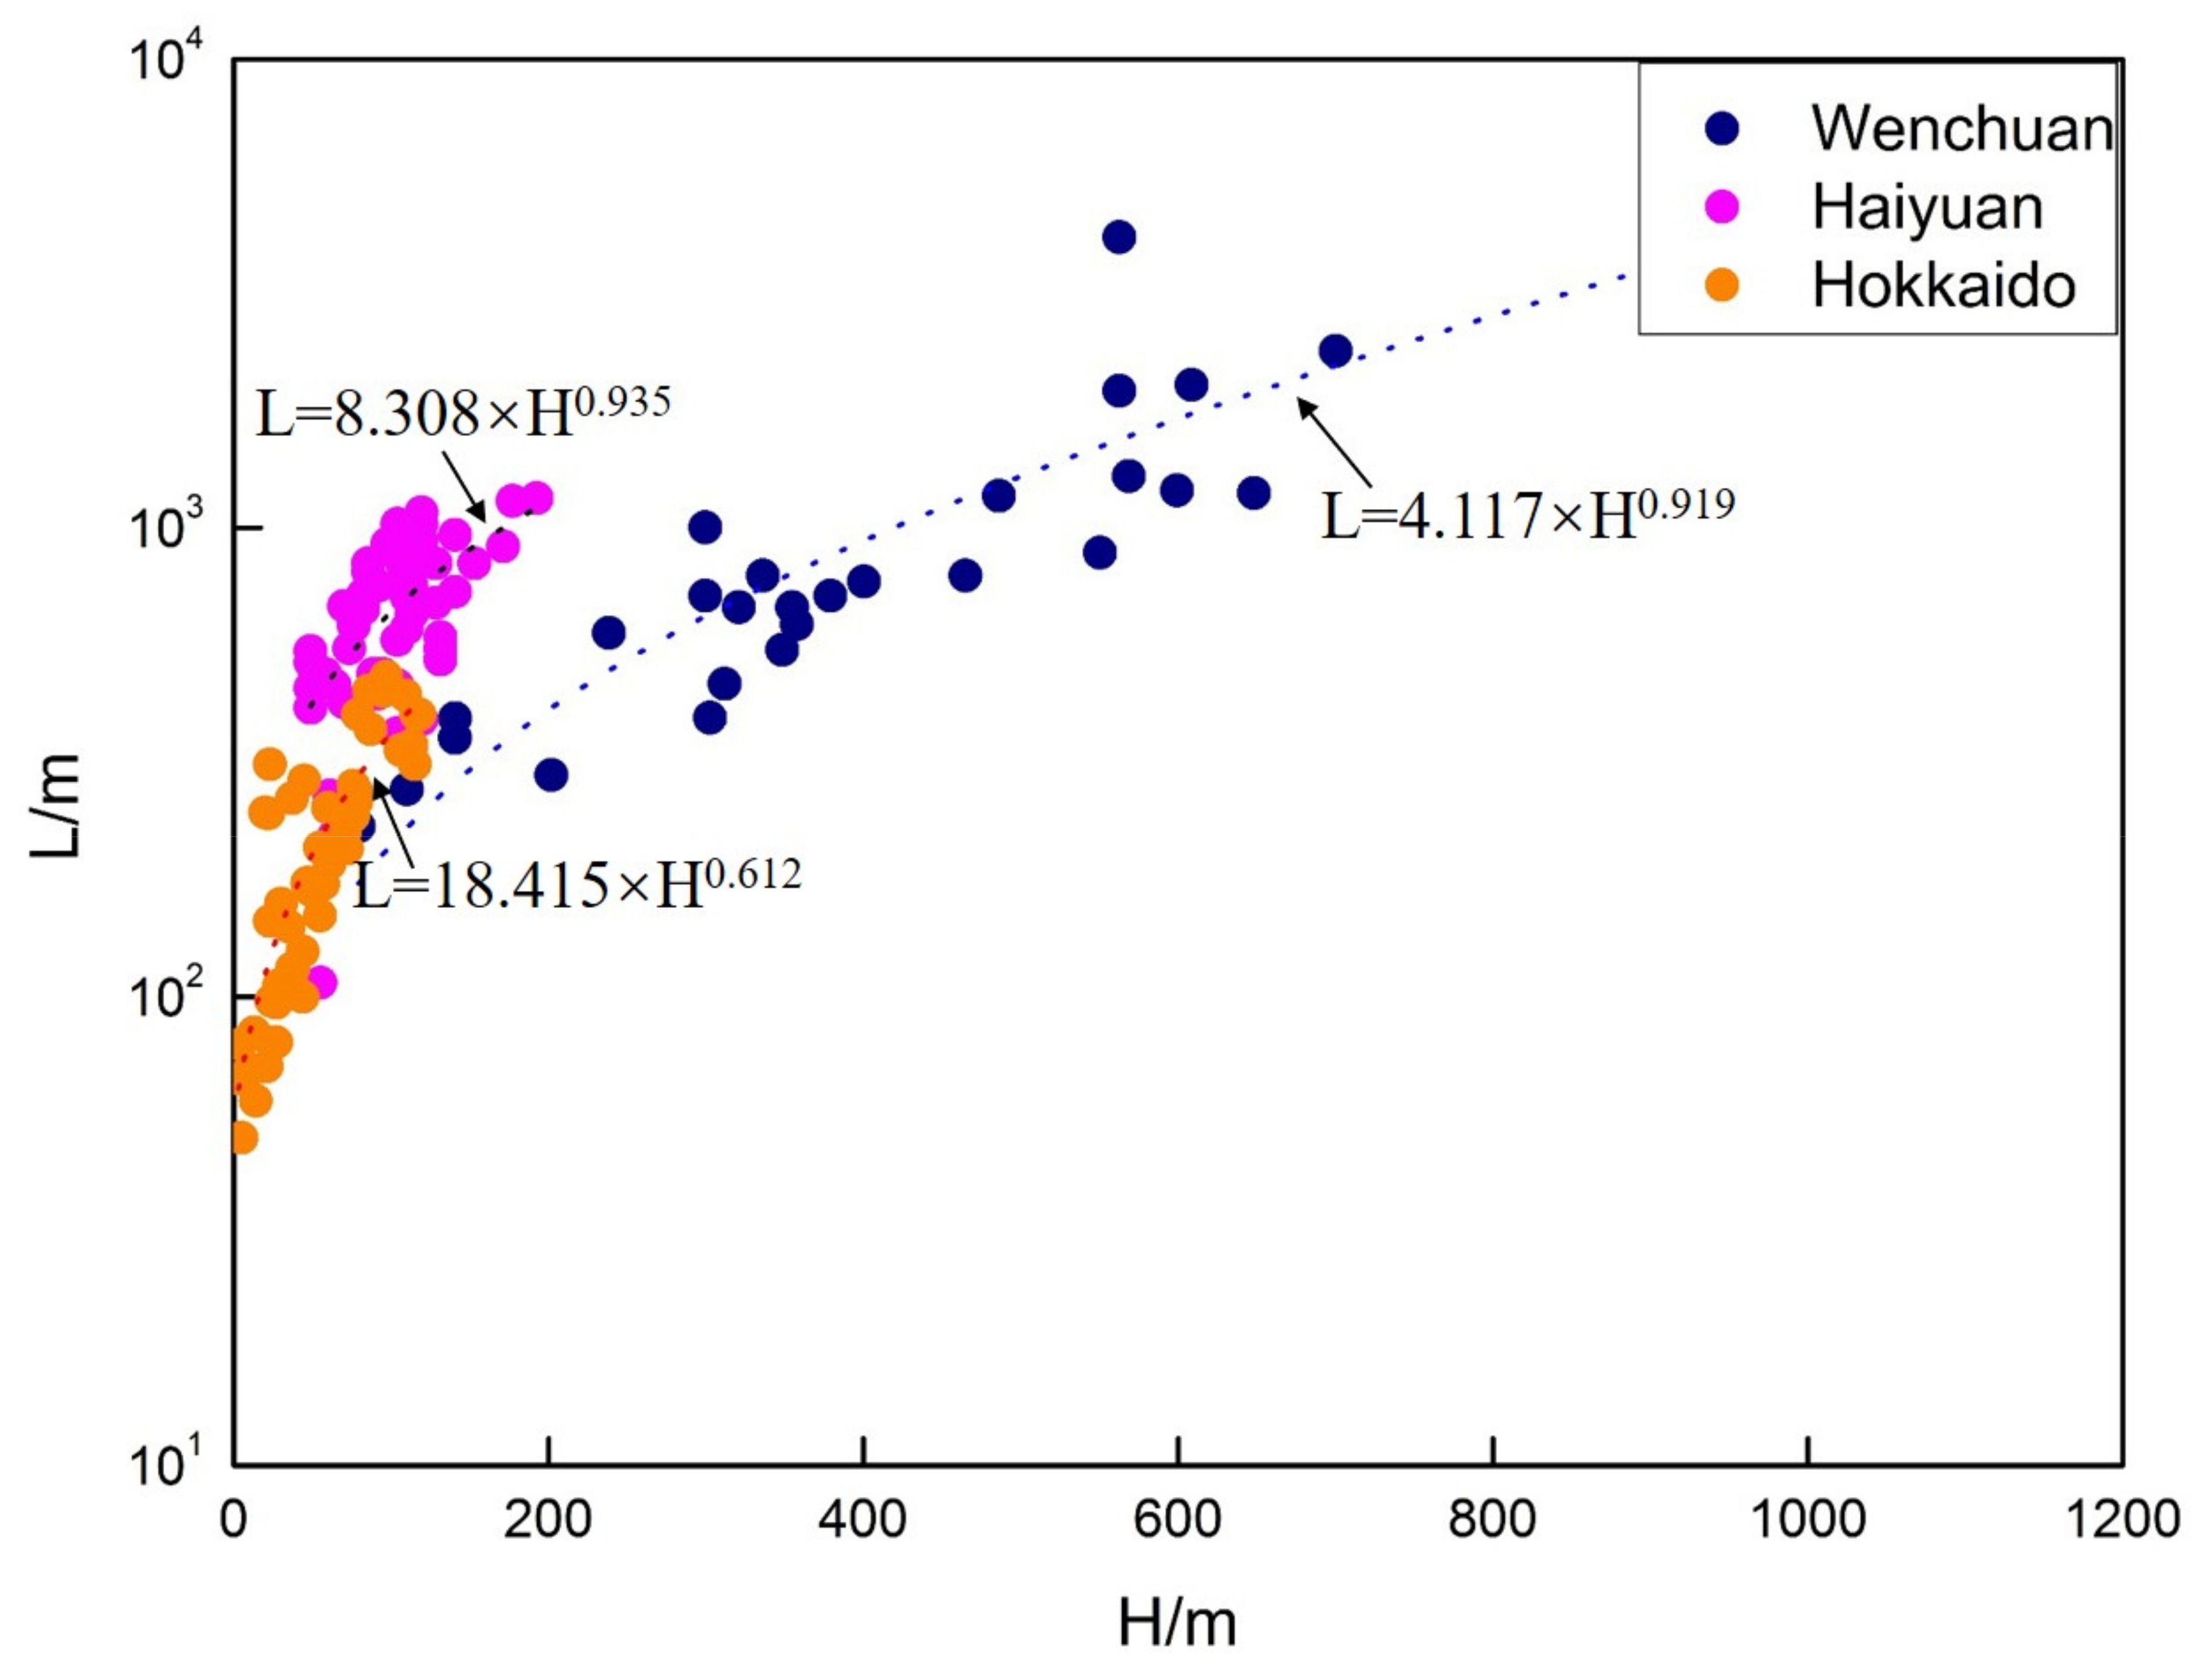
Figure 10 shows the exponential relationship between landslide height differences and the maximum horizontal travel distance of coseismic landslides for the 2008 Wenchuan, 1920 Haiyuan, and 2018 Hokkaido earthquake. The maximum horizontal travel distance increases exponentially with the increase of landslide height difference. The best-fit regression models for L-H relationships are L = 8.308 ∗ H0.935, L = 4.117 ∗ H0.919 and L = 18.415 ∗ H0.612, for the 2008 Wenchuan, 1920 Haiyuan, and 2018 Hokkaido earthquakes, respectively. Figure 10 also shows that the mobility of soil landslides/flows triggered by the Hokkaido earthquake is greater than that of rock landslides triggered by the 2008 Wenchuan earthquake, but lower than that of the loess landslides induced by the 1920 Haiyuan earthquake.
This phenomenon is likely associated with a combination of many factors. The study area is a gently rolling hills area, at an altitude of 200 to 400 m [9,48]. Landslides induced by the Hokkaido earthquake are mainly shallow landslides and relevant studies also revealed that the study area was covered with pyroclastic deposits. In addition to intermittent rainfall in the weeks before the earthquake, Typhoon Jebi caused heavy rainfall in the area on 4 September, which may have soaked and weakened the volcanic soil [15,25,49,50,51]. The subsequent seismic ground motion may trigger the sudden failure of the entire slope. Landslides in volcanic deposits generally have higher mobility than those in non-volcanic deposits due to differences in material properties such as particle size, collapsibility, and water content. Special lithology and heavy rainfall before the earthquake are the main reasons for the severity of landslides compared with other events of similar magnitudes.

5. Conclusions

The Hokkaido earthquake (Mw 6.6) struck Iburi subprefecture in southern Hokkaido, Japan on 6 September 2018, and triggered massive coseismic landslides. This paper first builds an inventory of coseismic landslides in the Hokkaido earthquake through visual interpretations of many high-resolution, pre- and post-earthquake satellite images. Based on this landslide inventory and other supplementary information, the relationships between the spatial distribution of coseismic landslides and five influencing factors, including PGA, elevation, slope, aspect, and lithology, were analyzed using a GIS platform. The mobility characteristics of these coseismic landslides were studied and compared with those from other earthquakes. The major conclusions are as follows:
(1)
The basic statistics of the Hokkaido landslide inventory show that the total number, total landslide area, and landslide-affected area of coseismic landslides in the Hokkaido earthquake are 5828, 23.66 km2 and 388 km2, respectively. The average landslide area density (e.g., the ratio between total landslide area and landslide-affected area) was 6.1%, which indicates that these coseismic landslides were concentrated in a certain region near the epicenter. Additionally, the most common landslide types were small- and medium-sized shallow soil slides/flows which consisted of volcanic ash.
(2)
A spatial distribution analysis of these landslides shows that the landslides mainly occurred on slopes at elevations from 100 to 200 m a.s.l. with a southeast aspect and slope of 20–25°. There is a rollover point on the slope angle versus landslide areal density plot (Figure 6), which is quite unique when compared with other coseismic landslide inventories of recent major earthquakes. This phenomenon suggests that in addition to earthquake loading, the hydrological slope process may have had crucial importance for slope failures, especially on slopes that were mostly composed of soil or debris.
(3)
The landslide number, landslide area and landslide-affected area of coseismic landslides triggered by the Hokkaido earthquake are consistent with trend of coseismic landslides for other strong earthquakes. The most frequent landslide area in the Hokkaido earthquake was approximately 1000 m2.
(4)
The apparent coefficient of friction for coseismic landslides in the Hokkaido earthquake ranged from 0.04 to 0.44 with a mean value of 0.25, which was higher than that for the rockslides in the Wenchuan earthquake (Mw 7.9) and lower than that for the loess landslides in the Haiyuan earthquake (M 8.0). The mobility of typical soil slides/flows in the Hokkaido earthquake was greater than that for typical rockslides in the Wenchuan earthquake but weaker than for typical loess slides in the Haiyuan earthquake, as was determined through a comparison of the mean values of apparent friction ratios.
For the analysis of coseismic landslide mobility, this paper is limited to the macro analysis on the ArcGIS platform. In the next step, the physical and mechanical parameters of rock and soil bodies can be analyzed by field sampling and numerical simulation to further accurately analyze the coseismic landslide fluidity triggered by the same earthquake magnitude in different regions.

Author Contributions

Conceptualization, J.L. and W.L.; methodology, W.L.; software, J.L. and W.L.; validation, J.L., W.L., W.Z. and Y.T.; formal analysis, J.L., W.L. and W.Z.; investigation, J.L., W.L., W.Z. and Y.T.; resources, W.L.; data curation, J.L.; writing—original draft preparation, J.L.; writing—review and editing, J.L., W.L. and W.Z.; visualization, W.Z.; supervision, W.L.; project administration, W.L.; funding acquisition, W.L. All authors have read and agreed to the published version of the manuscript.

Funding

The work was financially supported by the National Key Research and Development Program of China (Grant No. 2021YFC3000401), and the National Natural Science Foundation of China (Grant Nos. 41941019).

Institutional Review Board Statement

Not applicable.

Informed Consent Statement

Not applicable.

Data Availability Statement

The datasets generated during and/or analyzed during the current study are available from the corresponding author on reasonable request.

Conflicts of Interest

The authors declare no conflict of interest.

References

  1. Keeper, D.K. Landslides caused by earthquakes. Geol. Soc. Am. Bull. 1984, 95, 406. [Google Scholar]
  2. Harp, E.L.; Jibson, R.W. Landslides triggered by the 1994 northridge, california, earthquake. Bull. Seism. Soc. Am. 1996, 86, S319–S332. [Google Scholar]
  3. Keefer, D.K. Investigating Landslides Caused by Earthquakes—A Historical Review. Surv. Geophys. 2002, 23, 473–510. [Google Scholar] [CrossRef]
  4. Khazai, B.; Sitar, N. Evaluation of factors controlling earthquake-induced landslides caused by Chi-Chi earthquake and comparison with the Northridge and Loma Prieta events. Eng. Geol. 2004, 71, 79–95. [Google Scholar] [CrossRef]
  5. Owen, L.; Kamp, U.; Khattak, G.A.; Harp, E.L.; Keefer, D.K.; Bauer, M.A. Landslides triggered by the 8 October 2005 Kashmir earthquake. Geomorphology 2008, 94, 1–9. [Google Scholar] [CrossRef]
  6. Xu, Q.; Fan, X.-M.; Huang, R.-Q.; Van Westen, C. Landslide dams triggered by the Wenchuan Earthquake, Sichuan Province, south west China. Bull. Eng. Geol. Environ. 2009, 68, 373–386. [Google Scholar] [CrossRef]
  7. Xu, Q.; Zhang, S.; Li, W. Spatial distribution of large-scale landslides induced by the 5.12 Wenchuan Earthquake. J. Mt. Sci. 2011, 8, 246–260. [Google Scholar] [CrossRef]
  8. Zhao, B.; Li, W.; Wang, Y.; Lu, J.; Li, X. Landslides triggered by the Ms 6.9 Nyingchi earthquake, China (18 November 2017): Analysis of the spatial distribution and occurrence factors. Landslides 2019, 16, 765–776. [Google Scholar] [CrossRef]
  9. Zhao, B.; Wang, Y.; Feng, Q.; Guo, F.; Zhao, X.; Ji, F.; Liu, J.; Ming, W. Preliminary analysis of some characteristics of coseismic landslides induced by the Hokkaido Iburi-Tobu earthquake (5 September 2018), Japan. Catena 2020, 189, 104502. [Google Scholar] [CrossRef]
  10. Xu, C.; Xu, X.; Yao, X.; Dai, F. Three (nearly) complete inventories of landslides triggered by the May 12, 2008 Wenchuan Mw 7.9 earthquake of China and their spatial distribution statistical analysis. Landslides 2013, 11, 441–461. [Google Scholar] [CrossRef]
  11. Fan, X.; Scaringi, G.; Xu, Q.; Zhan, W.; Dai, L.; Li, Y.; Pei, X.; Yang, Q.; Huang, R. Coseismic landslides triggered by the 8th August 2017 Ms 7.0 Jiuzhaigou earthquake (Sichuan, China): Factors controlling their spatial distribution and implications for the seismogenic blind fault identification. Landslides 2018, 15, 967–983. [Google Scholar] [CrossRef]
  12. Xu, C.; Xu, X.; Shyu, J.B.H. Database and spatial distribution of landslides triggered by the Lushan, China Mw 6.6 earthquake of 20 April 2013. Geomorphology 2015, 248, 77–92. [Google Scholar] [CrossRef]
  13. Zhuang, J.; Peng, J.; Xu, C.; Li, Z.; Densmore, A.; Milledge, D.; Iqbal, J.; Cui, Y. Distribution and characteristics of loess landslides triggered by the 1920 Haiyuan Earthquake, Northwest of China. Geomorphology 2018, 314, 1–12. [Google Scholar] [CrossRef]
  14. Dai, F.; Xu, C.; Yao, X.; Xu, L.; Tu, X.; Gong, Q. Spatial distribution of landslides triggered by the 2008 Ms 8.0 Wenchuan earthquake, China. J. Southeast Asian Earth Sci. 2011, 40, 883–895. [Google Scholar] [CrossRef]
  15. Yamagishi, H.; Yamazaki, F. Landslides by the 2018 Hokkaido Iburi-Tobu Earthquake on September 6. Landslides 2018, 15, 2521–2524. [Google Scholar] [CrossRef]
  16. Elgharbawi, T.; Tamura, M. Estimating deformation due to soil liquefaction in Urayasu city, Japan using permanent scatterers. ISPRS J. Photogramm. Remote Sens. 2015, 109, 152–164. [Google Scholar] [CrossRef]
  17. Fukuoka, H.; Wang, G.; Sassa, K.; Wang, F.; Matsumoto, T. Earthquake-induced rapid long-traveling flow phenomenon: May 2003 Tsukidate landslide in Japan. Landslides 2004, 1, 151–155. [Google Scholar] [CrossRef]
  18. Seed, H.B. Landslides during earthquakes due to soil liquefaction. J. Soil Mech. Found. Div. ASCE 1996, 94, 1055–1122. [Google Scholar] [CrossRef]
  19. Linnerooth-Bayer, J.; Amendola, A. Global Change, Natural Disasters and Loss-sharing: Issues of Efficiency and Equity. Geneva Pap. Risk Insur. Issues Pract. 2000, 25, 203–219. [Google Scholar] [CrossRef]
  20. Miyagi, T.; Higaki, D.; Yagi, H.; Doshida, S.; Chiba, N.; Umemura, J.; Sato, G. Reconnaissance report on landslide disasters in northeast Japan following the M 9 Tōhoku earthquake. Landslides 2011, 8, 339–342. [Google Scholar] [CrossRef]
  21. Sidle, R.C.; Gomi, T.; Akasaka, M.; Koyanagi, K. Ecosystem changes following the 2016 Kumamoto earthquakes in Japan: Future perspectives. Ambio 2017, 47, 721–734. [Google Scholar] [CrossRef]
  22. Tobita, T.; Miyajima, M.; Fallahi, A.; Alaghebandian, R.; Ghayamghamian, M.R. Seismic Intensity Estimation through Questionnaire Survey and Collapse Rates of Various Building Types in the 2003 Bam, Iran, Earthquake. Earthq. Spectra 2007, 23, 841–865. [Google Scholar] [CrossRef]
  23. Yagi, H.; Sato, G.; Higaki, D.; Yamamoto, M.; Yamasaki, T. Distribution and characteristics of landslides induced by the Iwate–Miyagi Nairiku Earthquake in 2008 in Tohoku District, Northeast Japan. Landslides 2009, 6, 335–344. [Google Scholar] [CrossRef]
  24. Tanyas, H.; Rossi, M.; Alvioli, M.; van Westen, C.J.; Marchesini, I. A global slope unit-based method for the near real-time prediction of earthquake-induced landslides. Geomorphology 2018, 327, 126–146. [Google Scholar] [CrossRef]
  25. Ishikawa, T.; Yoshimi, M.; Isobe, K.; Yokohama, S. Reconnaissance report on geotechnical damage caused by 2018 Hokkaido Eastern Iburi earthquake with JMA seismic intensity 7. Soils Found. 2021, 61, 1151–1171. [Google Scholar] [CrossRef]
  26. Ji, K.; Wen, R.; Ren, Y.; Dhakal, Y.P. Nonlinear seismic site response classification using k-means clustering algorithm: Case study of the 6 September 2018 mw6.6 hokkaido iburi-tobu earthquake, Japan. Soil Dyn. Earthq. Eng. 2020, 128, 105907. [Google Scholar] [CrossRef]
  27. Nakamura, R.; Shiina, T. Three-dimensional S-wave attenuation structure in and around source area of the 2018 Hokkaido Eastern Iburi Earthquake, Japan. Earth Planets Space 2019, 71, 114. [Google Scholar] [CrossRef]
  28. Kumazawa, T.; Ogata, Y.; Tsuruoka, H. Characteristics of seismic activity before and after the 2018 M6.7 Hokkaido Eastern Iburi earthquake. Earth Planets Space 2019, 71, 130. [Google Scholar] [CrossRef]
  29. Susukida, Y.; Katsumata, K.; Ichiyanagi, M.; Ohzono, M.; Aoyama, H.; Tanaka, R.; Takada, M.; Yamaguchi, T.; Okada, K.; Takahashi, H.; et al. Focal mechanisms and the stress field in the aftershock area of the 2018 hokkaido eastern iburi earthquake (mjma = 6.7). Earth Planets Space 2021, 73, 1. [Google Scholar] [CrossRef]
  30. Iwasaki, T.; Tsumura, N.; Ito, T.; Arita, K.; Matsubara, M.; Sato, H.; Kurashimo, E.; Hirata, N.; Abe, S.; Noda, K.; et al. Correction to: Structural heterogeneity in and around the fold-and-thrust belt of the Hidaka Collision zone, Hokkaido, Japan and its relationship to the aftershock activity of the 2018 Hokkaido Eastern Iburi Earthquake. Earth Planets Space 2020, 72, 1. [Google Scholar] [CrossRef]
  31. Zhou, H.X.; Che, A.L.; Wang, L.M.; Wang, L. Investigation and mechanism analysis of disasters under Hokkaido Eastern Iburi earthquake. Geometics Nat. Hazards Risk 2021, 12, 1–28. [Google Scholar] [CrossRef]
  32. Li, R.; Wang, F.; Zhang, S. Controlling role of Ta-d pumice on the coseismic landslides triggered by 2018 Hokkaido Eastern Iburi Earthquake. Landslides 2020, 17, 1233–1250. [Google Scholar] [CrossRef]
  33. Wu, Y.C.; Zhou, H.X.; Che, A.L. Susceptibility of landslides caused by IBURI earthquake based on rough set-neural network. Chin. J. Rock Mech. Eng. 2021, 40, 1226–1235. [Google Scholar]
  34. Chang, M.; Zhou, Y.; Zhou, C.; Hales, T.C. Coseismic landslides induced by the 2018 Mw 6.6 Iburi, Japan, Earthquake: Spatial distribution, key factors weight, and susceptibility regionalization. Landslides 2020, 18, 755–772. [Google Scholar] [CrossRef]
  35. Liu, Y.; Zhang, W.; Zhang, Z.; Xu, Q.; Li, W. Risk Factor Detection and Landslide Susceptibility Mapping Using Geo-Detector and Random Forest Models: The 2018 Hokkaido Eastern Iburi Earthquake. Remote Sens. 2021, 13, 1157. [Google Scholar] [CrossRef]
  36. Wang, F.; Fan, X.; Yunus, A.P.; Subramanian, S.S.; Alonso-Rodriguez, A.; Dai, L.; Xu, Q.; Huang, R. Coseismic landslides triggered by the 2018 Hokkaido, Japan (Mw 6.6), earthquake: Spatial distribution, controlling factors, and possible failure mechanism. Landslides 2019, 16, 1551–1566. [Google Scholar] [CrossRef]
  37. Shao, X.Y.; Ma, S.Y.; Xu, C. Planet Image-Based Inventorying and Machine Learning-Based Susceptibility Mapping for the Landslides Triggered by the 2018 Mw6.6 Tomakomai, Japan Earthquake. Remote Sens. 2019, 11, 978. [Google Scholar] [CrossRef]
  38. Corominas, J. The angle of reach as a mobility index for small and large landslides. Can. Geotech. J. 1996, 33, 260–271. [Google Scholar] [CrossRef]
  39. Evans, S.G.; Roberts, N.J.; Ischuk, A.; Delaney, K.B.; Morozova, G.S.; Tutubalina, O. Landslides triggered by the 1949 Khait earthquake, Tajikistan, and associated loss of life. Eng. Geol. 2009, 109, 195–212. [Google Scholar] [CrossRef]
  40. Iverson, R.M.; George, D.L.; Allstadt, K.; Reid, M.E.; Collins, B.D.; Vallance, J.W.; Magirl, C.S. Landslide mobility and hazards: Implications of the 2014 Oso disaster. Earth Planet. Sci. Lett. 2015, 412, 197–208. [Google Scholar] [CrossRef]
  41. Keefer, D.K. The importance of earthquake-induced landslides to long-term slope erosion and slope-failure hazards in seismically active regions. Geomorphology 1994, 10, 265–284. [Google Scholar] [CrossRef]
  42. Xu, C.; Xu, X.; Shyu, J.B.H.; Gao, M.; Tan, X.; Ran, Y.; Zheng, W. Landslides triggered by the 20 April 2013 Lushan, China, Mw 6.6 earthquake from field investigations and preliminary analyses. Landslides 2015, 12, 365–385. [Google Scholar] [CrossRef]
  43. Xu, C.; Ma, S.; Tan, Z.; Xie, C.; Toda, S.; Huang, X. Landslides triggered by the 2016 Mj 7.3 Kumamoto, Japan, earthquake. Landslides 2017, 15, 551–564. [Google Scholar] [CrossRef]
  44. Hu, K.; Zhang, X.; You, Y.; Hu, X.; Liu, W.; Li, Y. Landslides and dammed lakes triggered by the 2017 Ms6.9 Milin earthquake in the Tsangpo gorge. Landslides 2019, 16, 993–1001. [Google Scholar] [CrossRef]
  45. Chen, G.; Tang, M.; Zhou, H.; Feixing, Q.U.; Li, Y.; Xin, Y. Dynamic Risk Assessment Method of Geological Hazard of Linear Engineering in Mountainous Area and Its Application. J. Disaster Prev. Mitig. Eng. 2019, 39, 524–532. [Google Scholar]
  46. Lu, N.; Godt, J.W. Hillslope Hydrology and Stability. Environ. Eng. Geosci. 2014, 40, 407–408. [Google Scholar]
  47. Zhan, W.; Fan, X.; Huang, R.; Pei, X.; Xu, Q.; Li, W. Empirical prediction for travel distance of channelized rock avalanches in the Wenchuan earthquake area. Nat. Hazards Earth Syst. Sci. 2017, 17, 833–844. [Google Scholar] [CrossRef]
  48. Zhao, B.; Su, L.; Wang, Y.; Ji, F.; Li, W.; Tang, C. Insights into the mobility characteristics of seismic earthflows related to the Palu and Eastern Iburi earthquakes. Geomorphology 2021, 391, 107886. [Google Scholar] [CrossRef]
  49. Osanai, N.; Yamada, T.; Hayashi, S.-I.; Kastura, S.; Furuichi, T.; Yanai, S.; Murakami, Y.; Miyazaki, T.; Tanioka, Y.; Takiguchi, S.; et al. Characteristics of landslides caused by the 2018 Hokkaido Eastern Iburi Earthquake. Landslides 2019, 16, 1517–1528. [Google Scholar] [CrossRef]
  50. Kameda, J.; Kamiya, H.; Masumoto, H.; Morisaki, T.; Hiratsuka, T.; Inaoi, C. Fluidized landslides triggered by the liquefaction of subsurface volcanic deposits during the 2018 iburi–tobu earthquake, hokkaido. Sci. Rep. 2019, 9, 13119. [Google Scholar] [CrossRef]
  51. Kasai, M.; Yamada, T. Topographic effects on frequency-size distribution of landslides triggered by the hokkaido eastern iburi earthquake in 2018. Earth Planets Space 2019, 71, 89. [Google Scholar] [CrossRef]
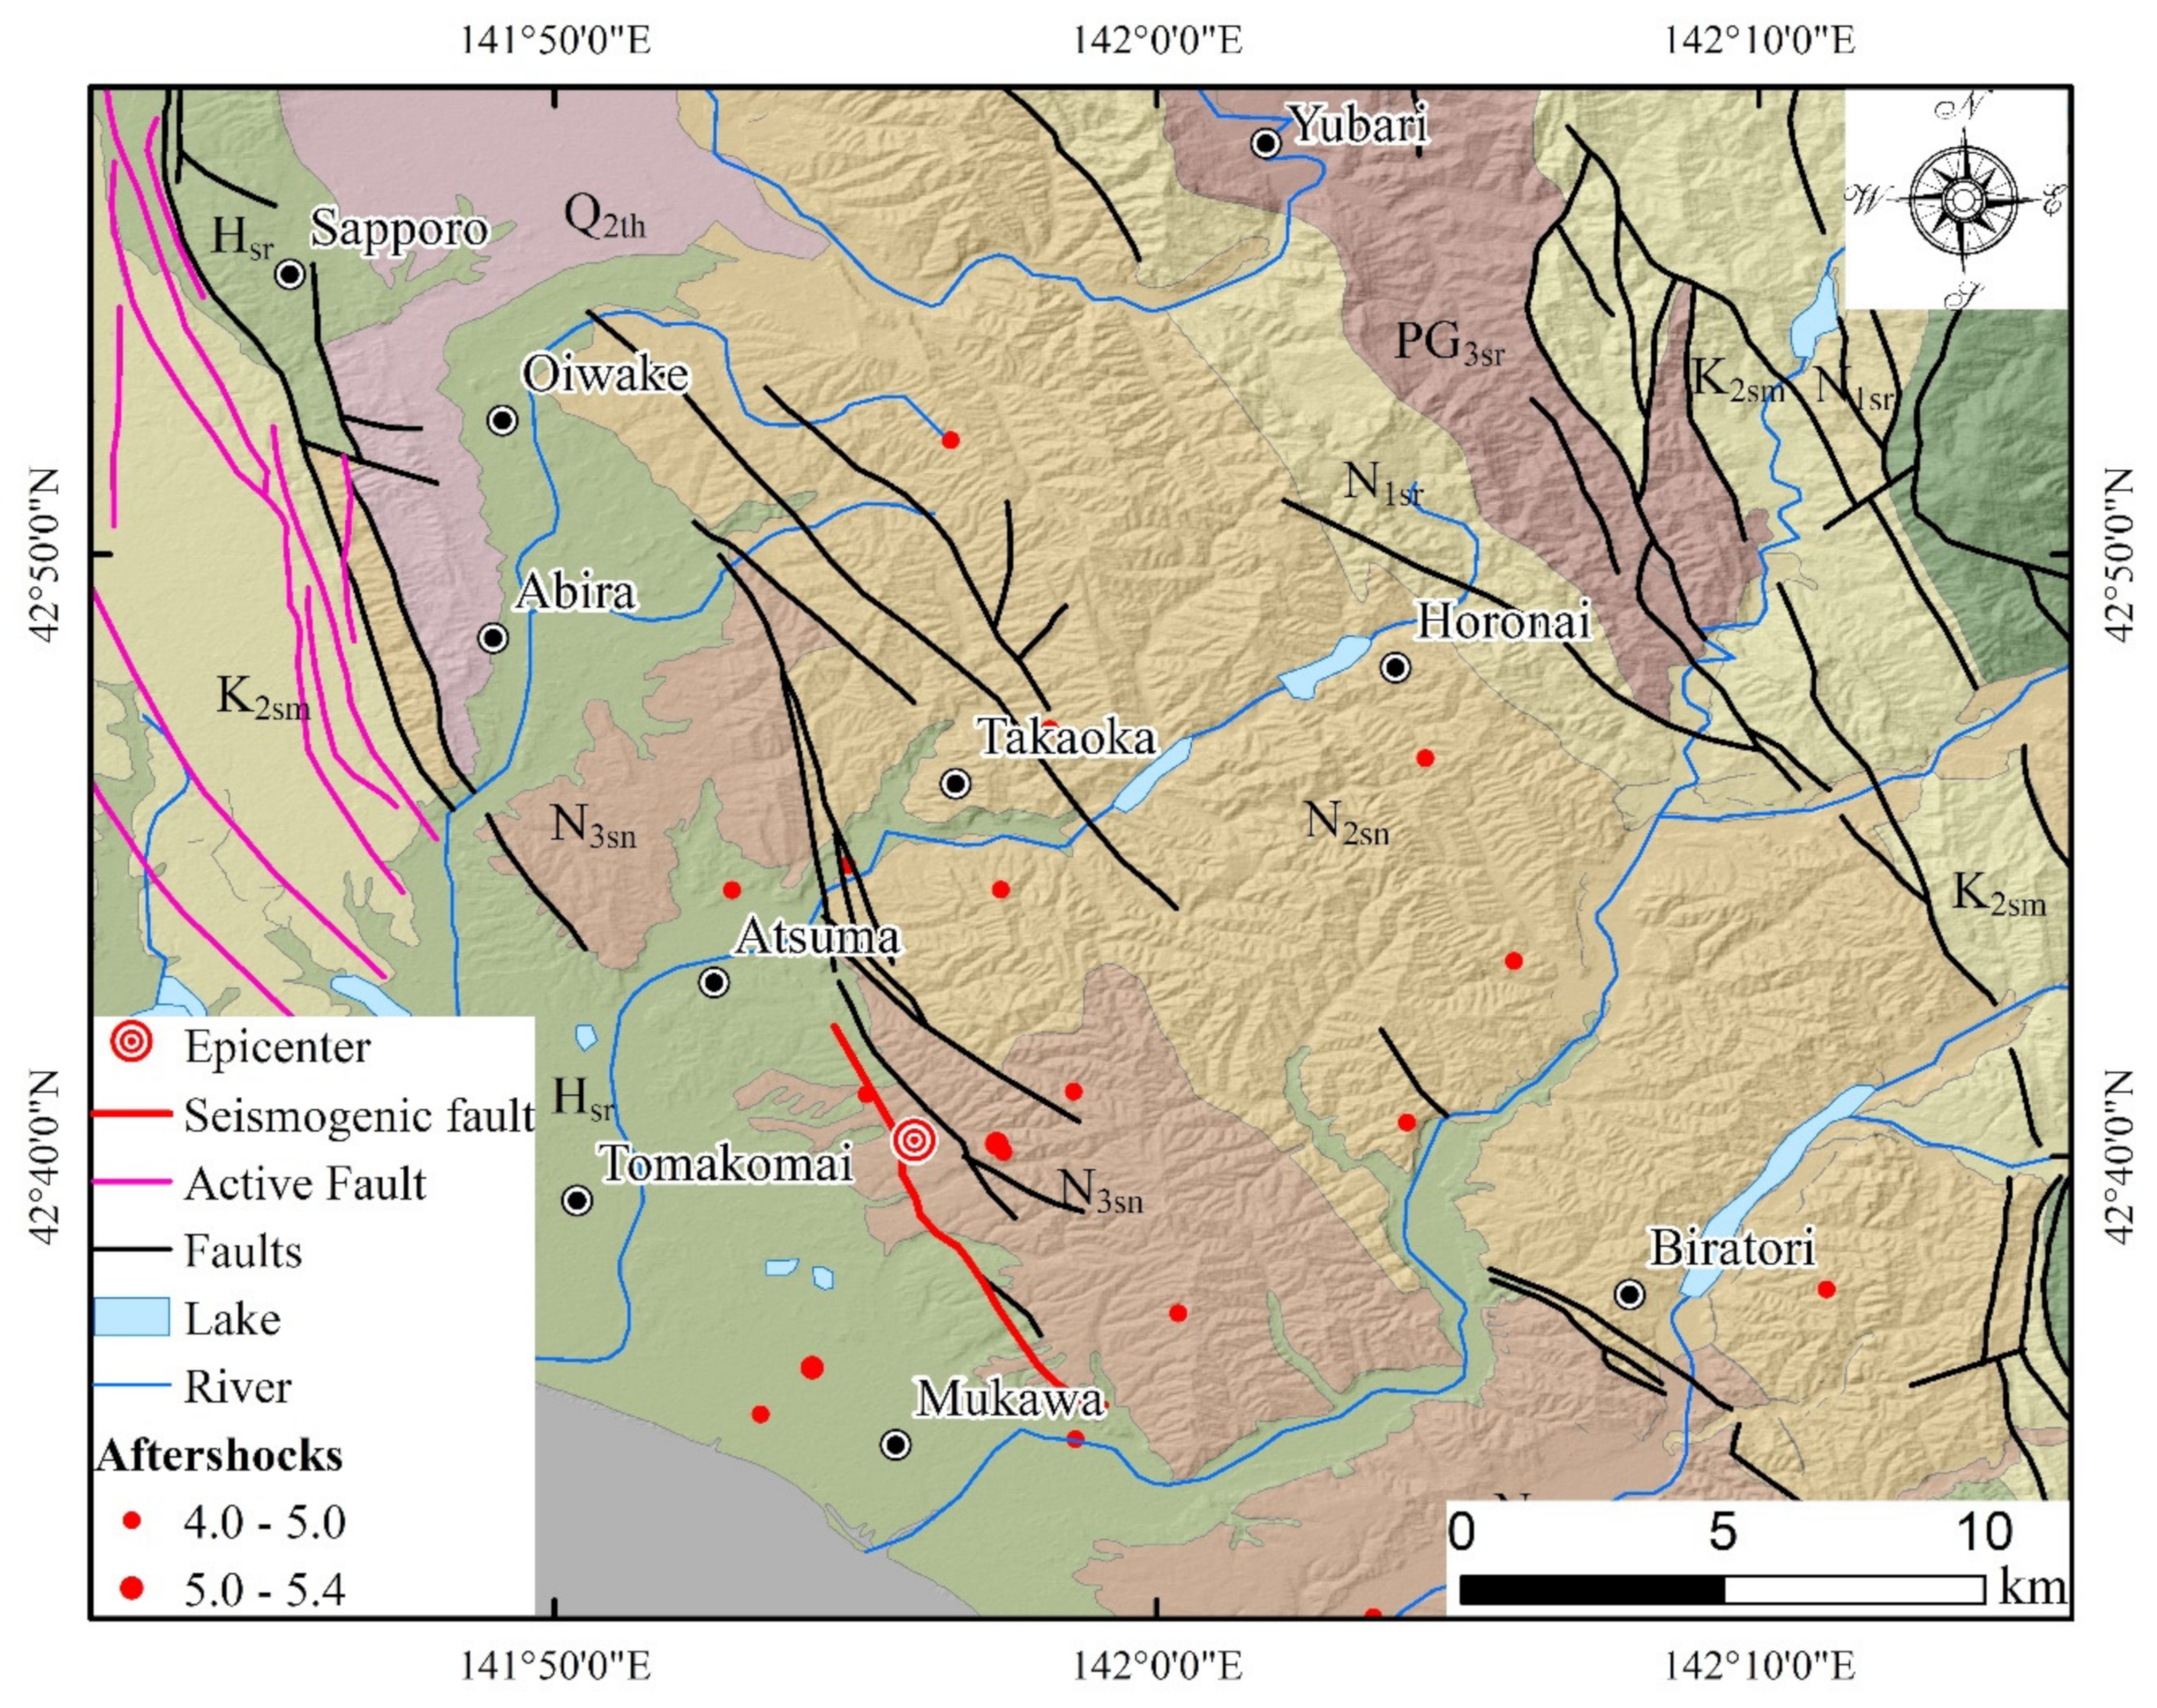
Figure 1. Geological structure map of the Hokkaido earthquake area (red points represent aftershocks and blue point represents rivers. Red lines represent seismogenic faults, pink lines represent active faults, and black lines represent general faults. Hsr: Late Pleistocene to Holocene marine and nonmarine sediments, Q3tl: Late Pleistocene lower stage, Q2th: Middle Pleistocene high terrace, N3sn: Late Miocene to Pliocene nonmarine sediments, N2sn: Middle to Late Miocene nonmarine sediments, N1sr: Early Miocene to Middle Miocene marine and nonmarine sediments, K2sm: Late Cretaceous marine muddy turbidite, and PG3sr: Late Eocene to Early Oligocene marine and nonmarine sediments).
Remotesensing 14 03957 g001
Figure 2. Coverage of post-earthquake satellite images and coseismic landslides triggered by the 2018 Hokkaido earthquake.
Remotesensing 14 03957 g002
Figure 3. Characteristics of coseismic landslides triggered by the Hokkaido earthquake. (a) The overall distribution of coseismic landslides, (b) Panorama of earthquake landslides, (c) Characteristics of earthquake landslides, (d) Houses and farmlands destroyed by earthquake landslides, (e) The only rock landslide in this earthquake. Images in (a) is from Google Earth, (b,c) are from WorldView-3, and (d,e) are from SuperView-1.
Remotesensing 14 03957 g003
Figure 4. Relationships between influencing factors and landslides ((a) PGA, (b) elevation, (c) slope, (d) lithology, and (e) aspect).
Remotesensing 14 03957 g004aRemotesensing 14 03957 g004b
Figure 5. Possible controlling factors for the coseismic landslides triggered by the Hokkaido earthquake: (a) PGA, (b) elevation, (c) slope, (d) lithology, (e) aspect, and (f) typical landslide aspect distribution.
Remotesensing 14 03957 g005
Figure 6. Relationships between landslide areal percentage and slope in different earthquakes.
Remotesensing 14 03957 g006
Figure 7. Synseismic geological profile of a typical landslide induced by the 2018 Hokkaido earthquake modified from https://www.gsj.jp/hazards/earthquake/hokkaido2018/hokkaido2018-03.html (accessed on 20 June 2022).
Remotesensing 14 03957 g007
Figure 8. The comparison of the coseismic landslide inventories of the 2018 Hokkaido earthquake and other earthquakes. (a) Landslide-affected area and the earthquake magnitude for earthquakes occurring before 1980 (modified from [1]. (b) Total landslide area and the earthquake magnitude for earthquakes occurring between 1980 and 2013 (modified from [42]. (c) Landslide number and earthquake magnitudes for earthquakes occurring between 1980 and 2013 (from [11,42]. (d) Landslide area frequency relationships for the 2018 Hokkaido, 2014 Lushan, 2017 Jiuzhaigou, and 2017 Nyingchi earthquakes.
Remotesensing 14 03957 g008
Figure 9. Probability densities of equivalent coefficients of fraction (revised from [13]).
Remotesensing 14 03957 g009
Figure 10. The empirical relationship between landslide height difference and the maximum horizontal travel distance (revised from [13]).
Remotesensing 14 03957 g010
Table 1. Remote sensing images and other geographical information data.
Data TypeDateSourceResolution/m
Pre-earthquake image17 Aprial 2018Planet3.0
5 September 2017Sentinel-210.0
Post-earthquake image11 September 2018Planet3.0
11 September 2018SuperView-10.5
13 September 2018WolrdView-30.3
DEMPre-earthquakehttps://dwtkns.com/srtm30m SRTMGL1.003 (accessed on 20 June 2022).30.0
Earthquake parametersSeptember 2018United States Geological Survey
Geological mapPre-earthquakeGeological Survey of Japan
Table 2. Classification of seismic, terrain, and geologic controlling factors used in the spatial distribution analysis.
No.TypeFactorClassification
1Seismic dataPGA(1) <0.2; (2) 0.2~0.3; (3) 0.3~0.4; (4) 0.4~0.5; (5) 0.5~0.6; (6) >0.6.
2Terrain DataElevation (m)(1) <50; (2) 50~100; (3) 100~150; (4) 150~200; (5) 200~250;
(6) 250~300; (7) 300~350; (8) >350.
3Slope gradient (°)(1) 0~10; (2) 10~15; (3) 15~20; (4) 20~25; (5) 25~30; (6) >30.
4Slope aspect(1) Flat; (2) North; (3) NorthEast; (4) East; (5) SouthEast;
(6) South; (7) SouthWest; (8) West; (9) NorthWest
5Geologic dataLithology(1) Hsr: Late Pleistocene to Holocene marine and non-marine sediments
(2) Q3tl: Late Pleistocene lower stage
(3) Q2th: Middle Pleistocene high terrace
(4) N3sn: Late Miocene to Pliocene non-marine sediments
(5) N2sn: Middle to Late Miocene non-marine sediments
(6) N1sr: Early Miocene to Middle Miocene marine and non-marine sediments
(7) K2sm: Late Cretaceous marine muddy turbidite
(8) PG3sr: Late Eocene to Early Oligocene marine and non-marine sediments
Table 3. Comparison of coseismic landslide inventories of the 2018 Hokkaido earthquake and other strong earthquakes.
LocationDataMagnitude
(Mw)
Landslide Area
(km2)
Area Affect by
Landslides (km2)
Landslide Area
Percentage (%)
Reference Study
Lushan, Sichuan Provence, China20 April 20136.618.954000. 35[12]
Kumamoto, Japan15 April 201676.960000. 115[43]
Jiuzhaigou, Sichuan Provence, China8 August 20176.58.118400. 965[11]
Nyingchi, Tibet, China18 September 20176.633.6120501.639[44]
Hokkaido, Japan6 September 20186.623.663886.098This paper
Publisher’s Note: MDPI stays neutral with regard to jurisdictional claims in published maps and institutional affiliations.