
Integration of Vertical and Horizontal Deformation Derived by SAR Observation for Identifying Landslide Motion Patterns in a Basaltic Weathered Crust Region of Guizhou, China

 ,
,
Abstract
:1. Introduction
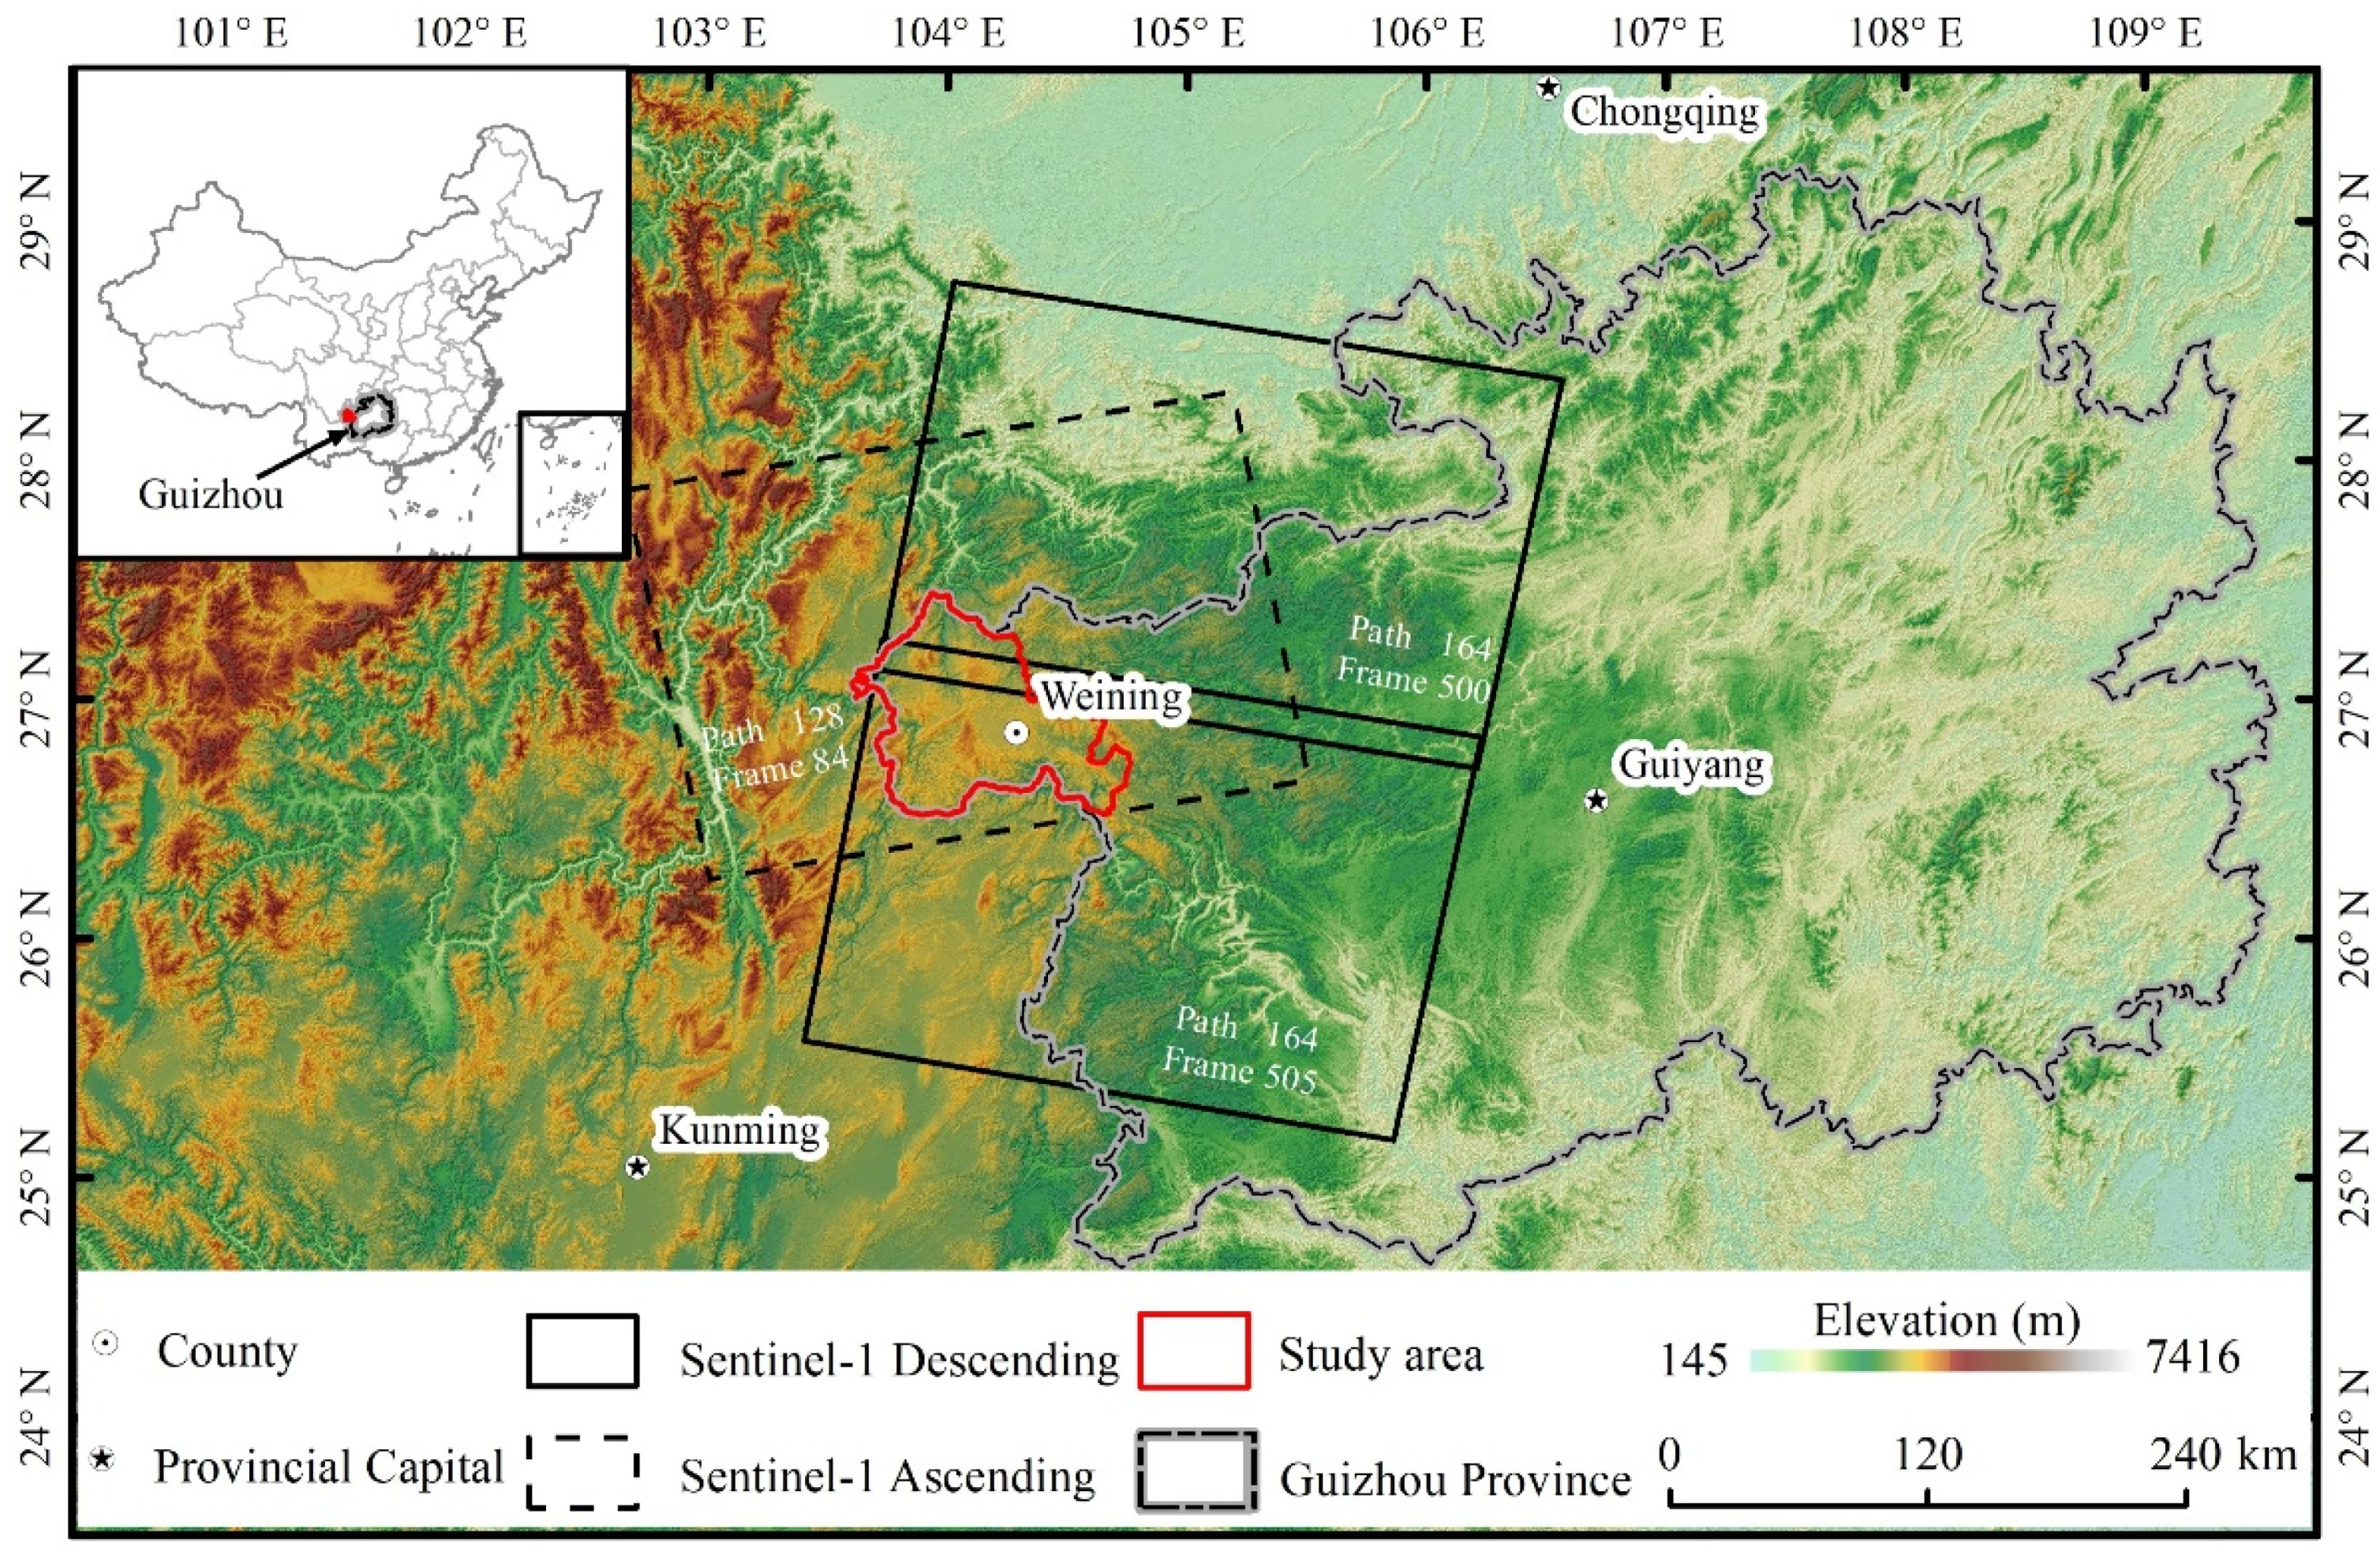
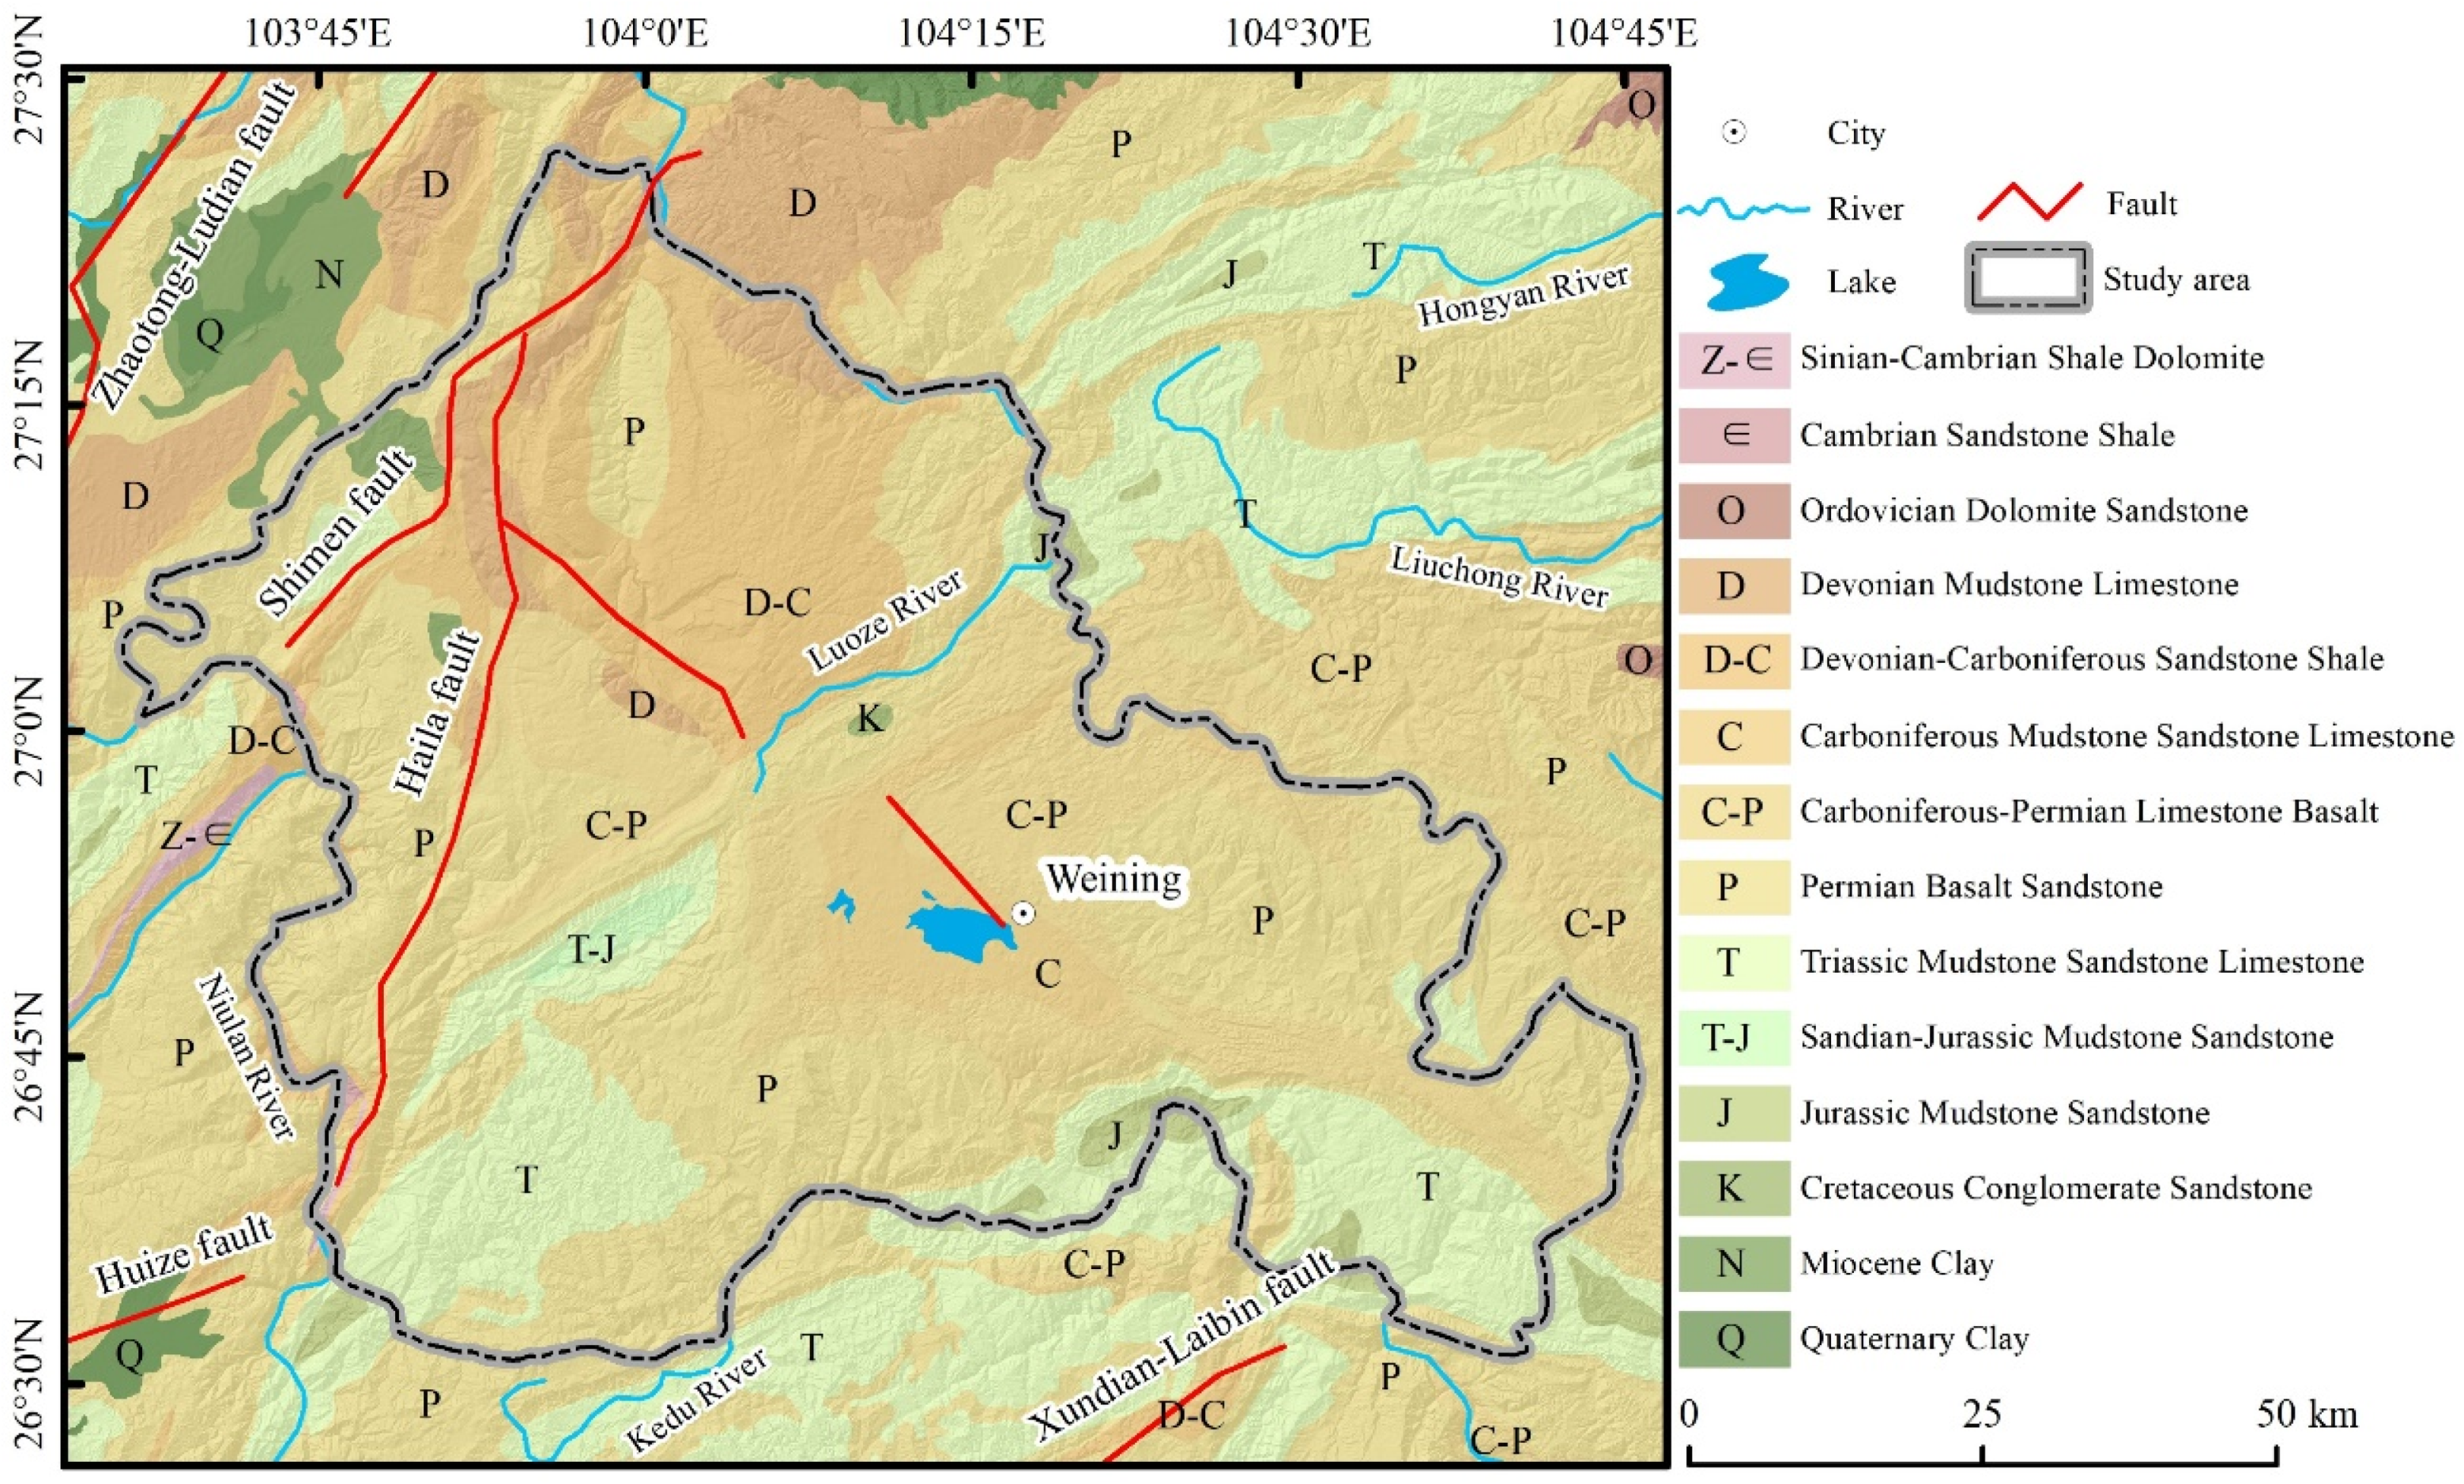
2. Study Area
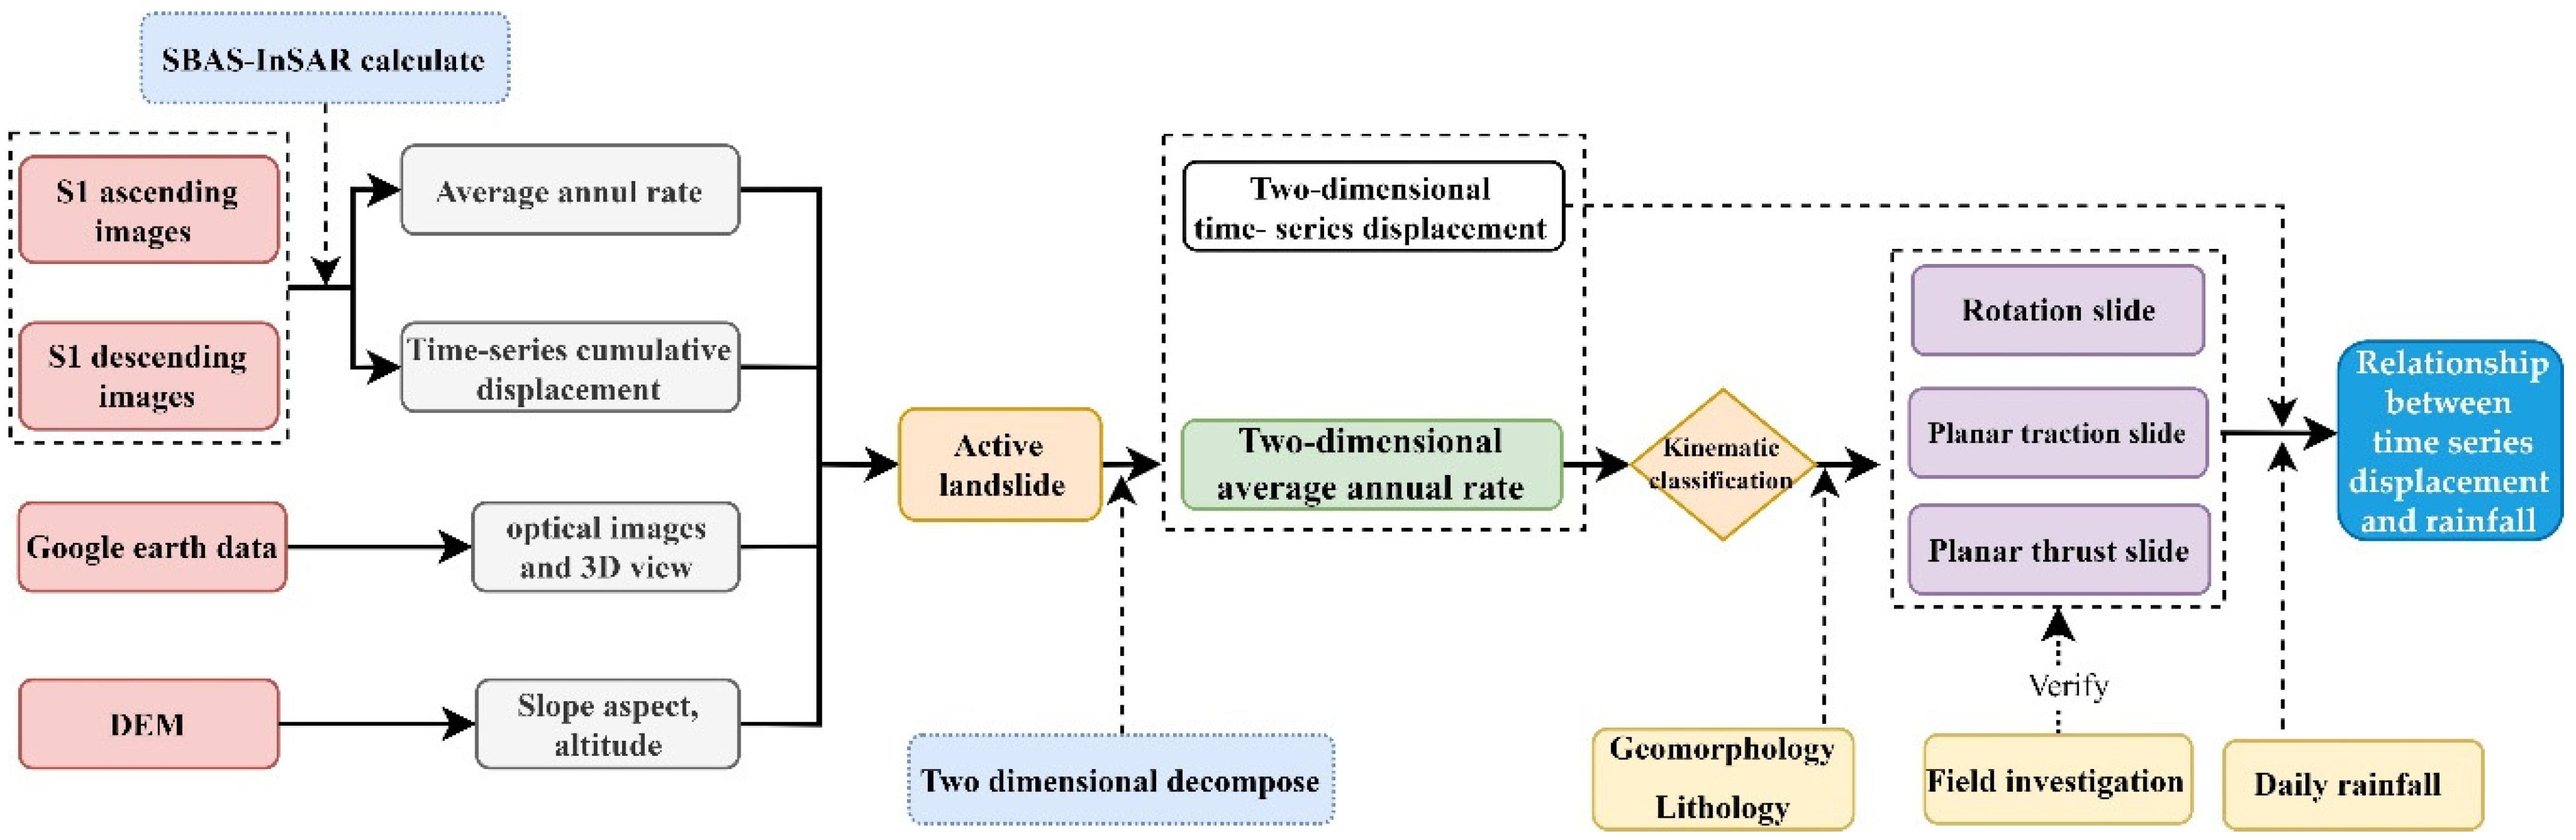
3. Datasets and Methodology
3.1. Datasets
3.2. Methodology
3.2.1. SBAS-InSAR Processing
3.2.2. Two-Dimensional Displacement Decomposition
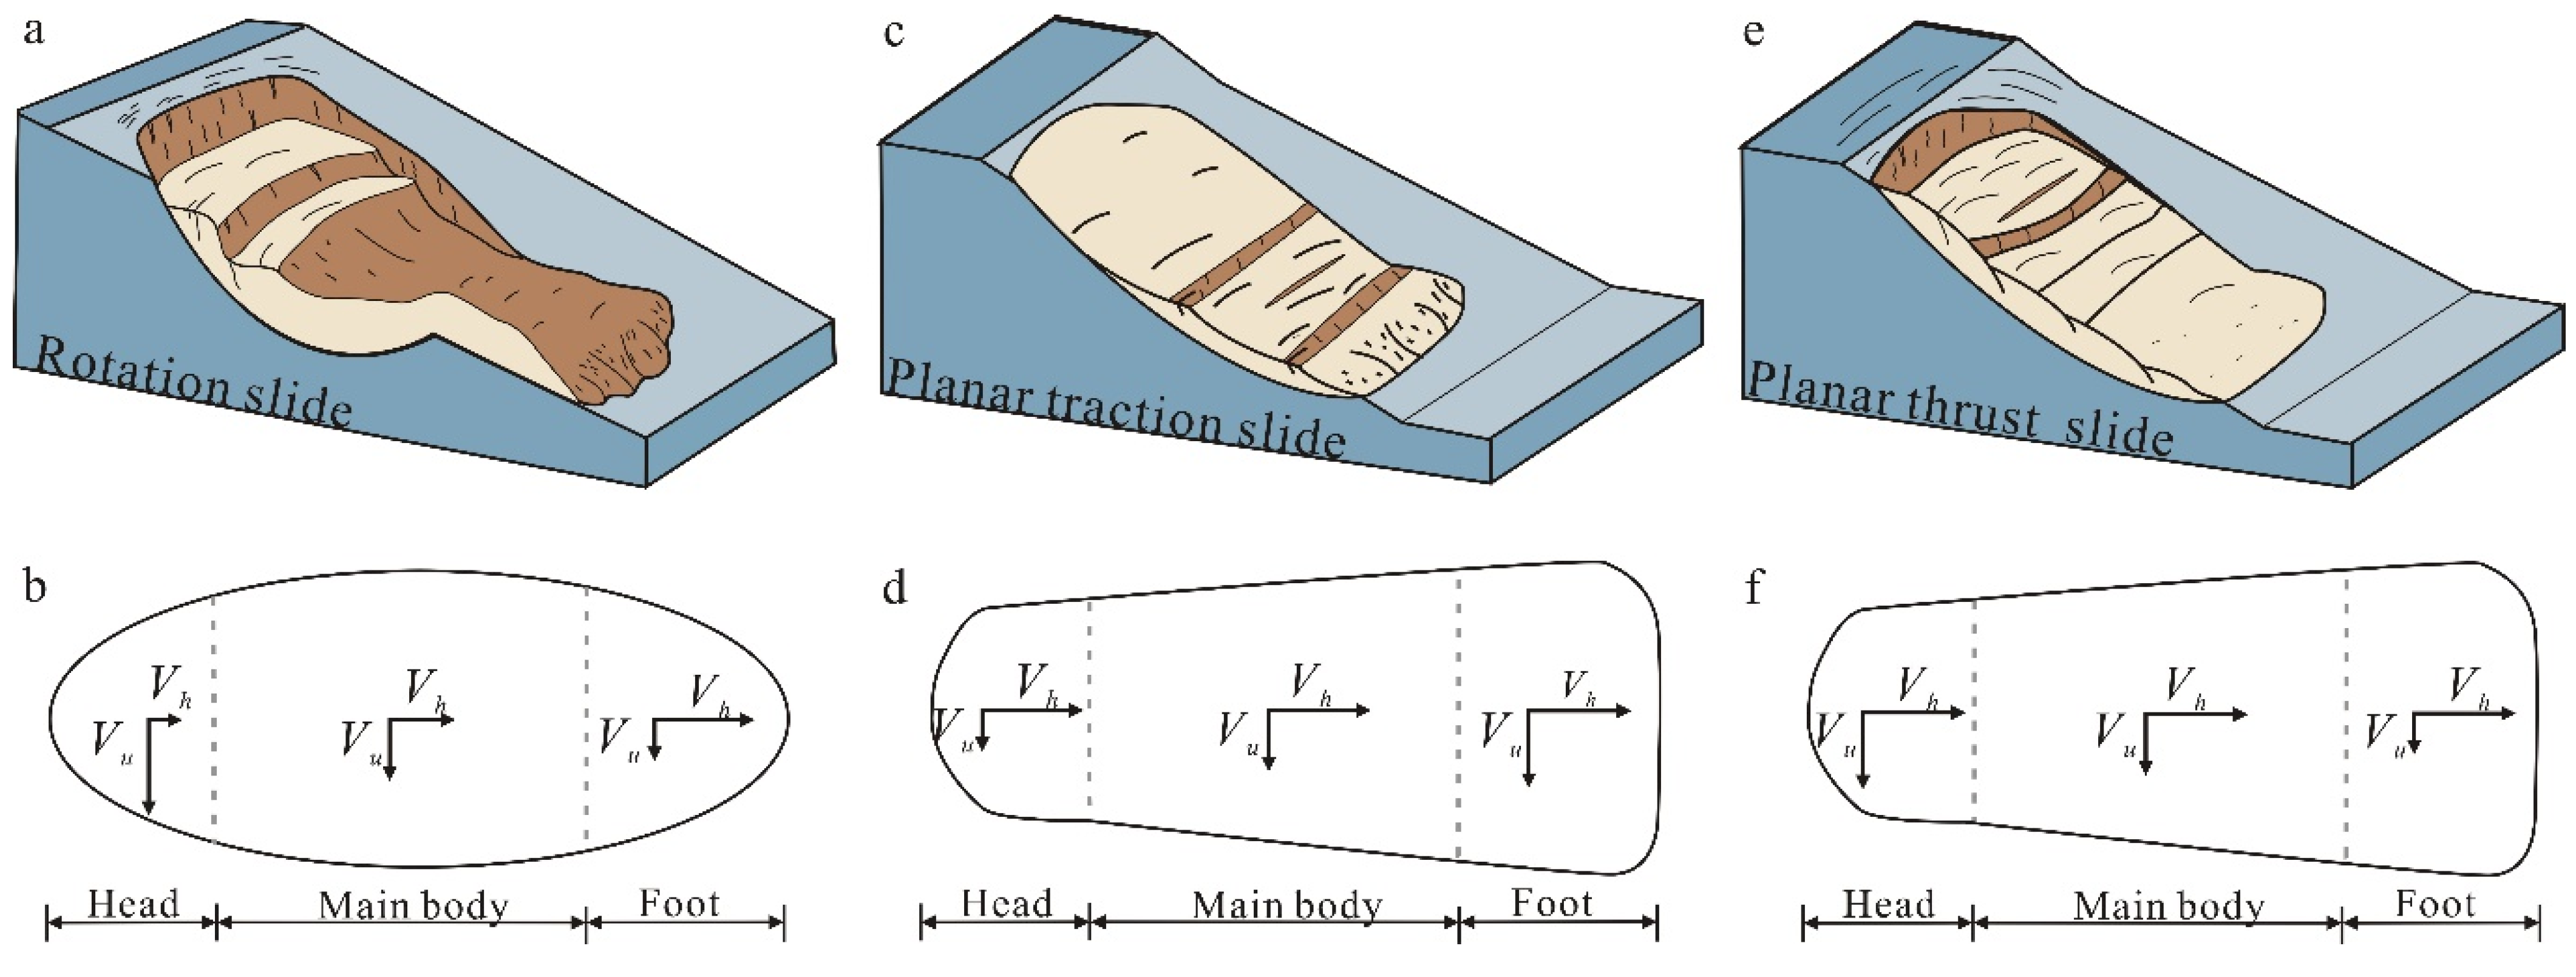
3.2.3. Classification of Landslide Motion Pattern
4. Results and Analysis
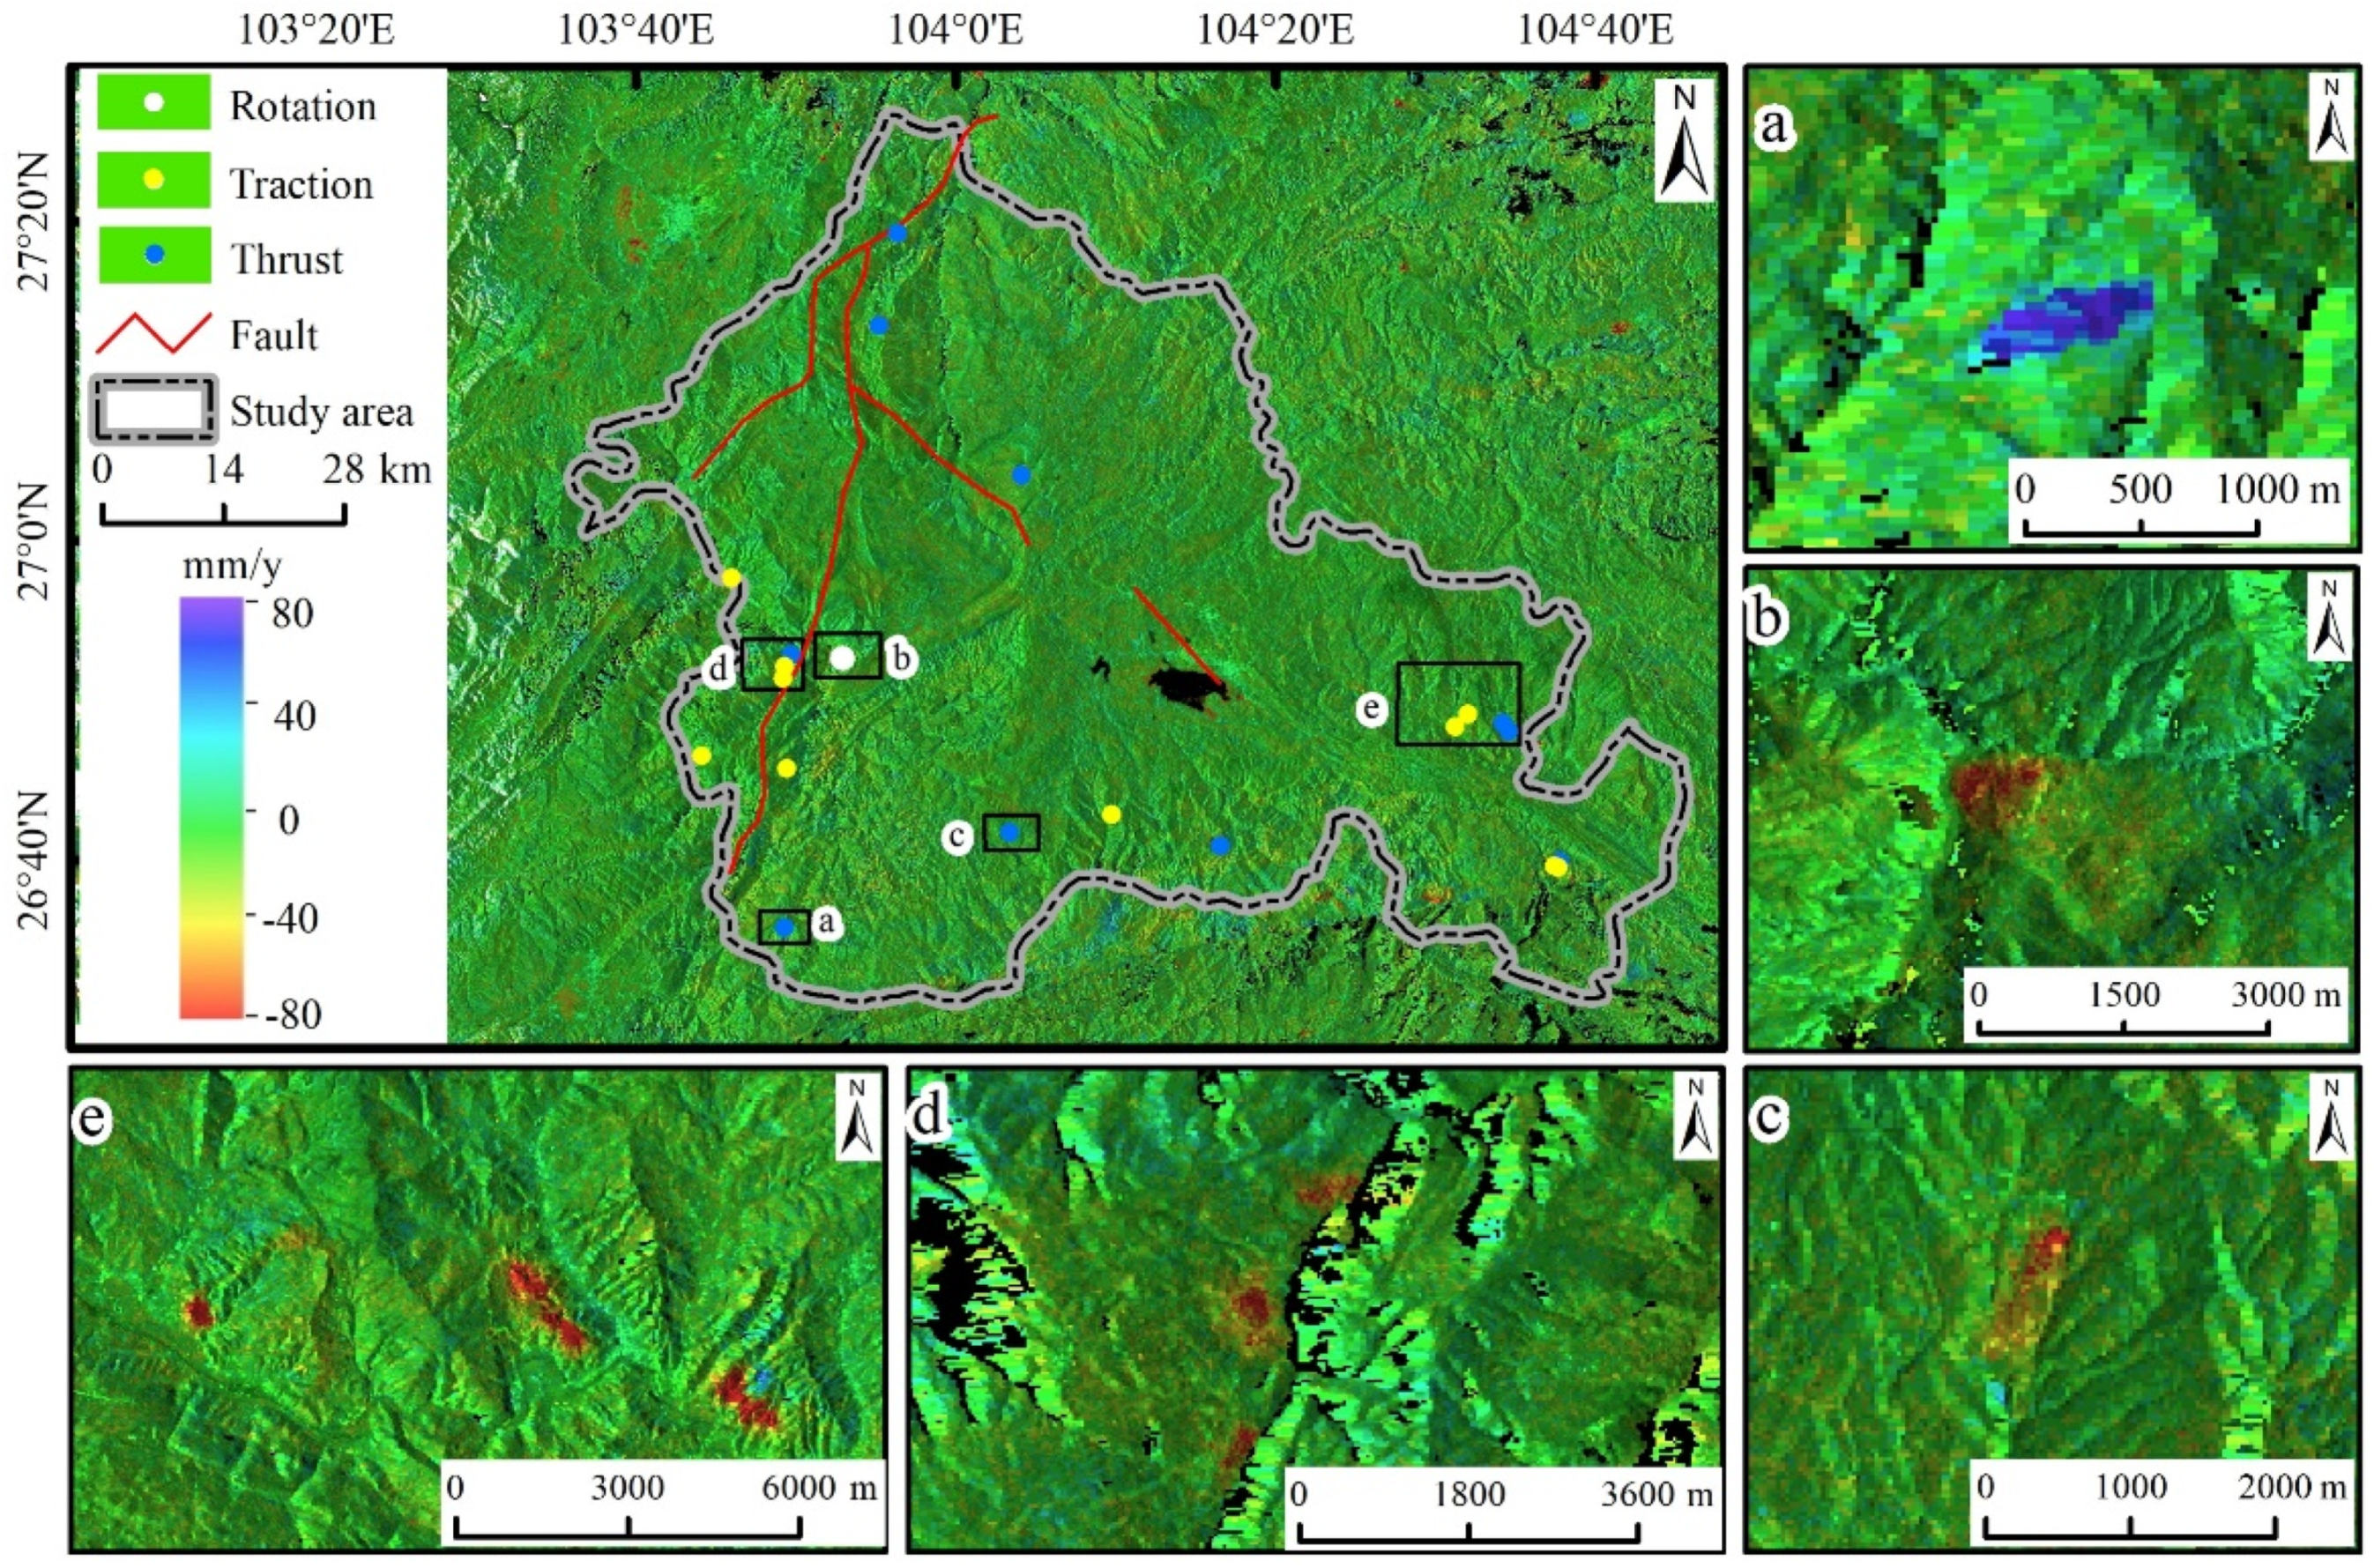
4.1. Active Landslide Identification
4.2. Validation of Landslide Motion Pattern
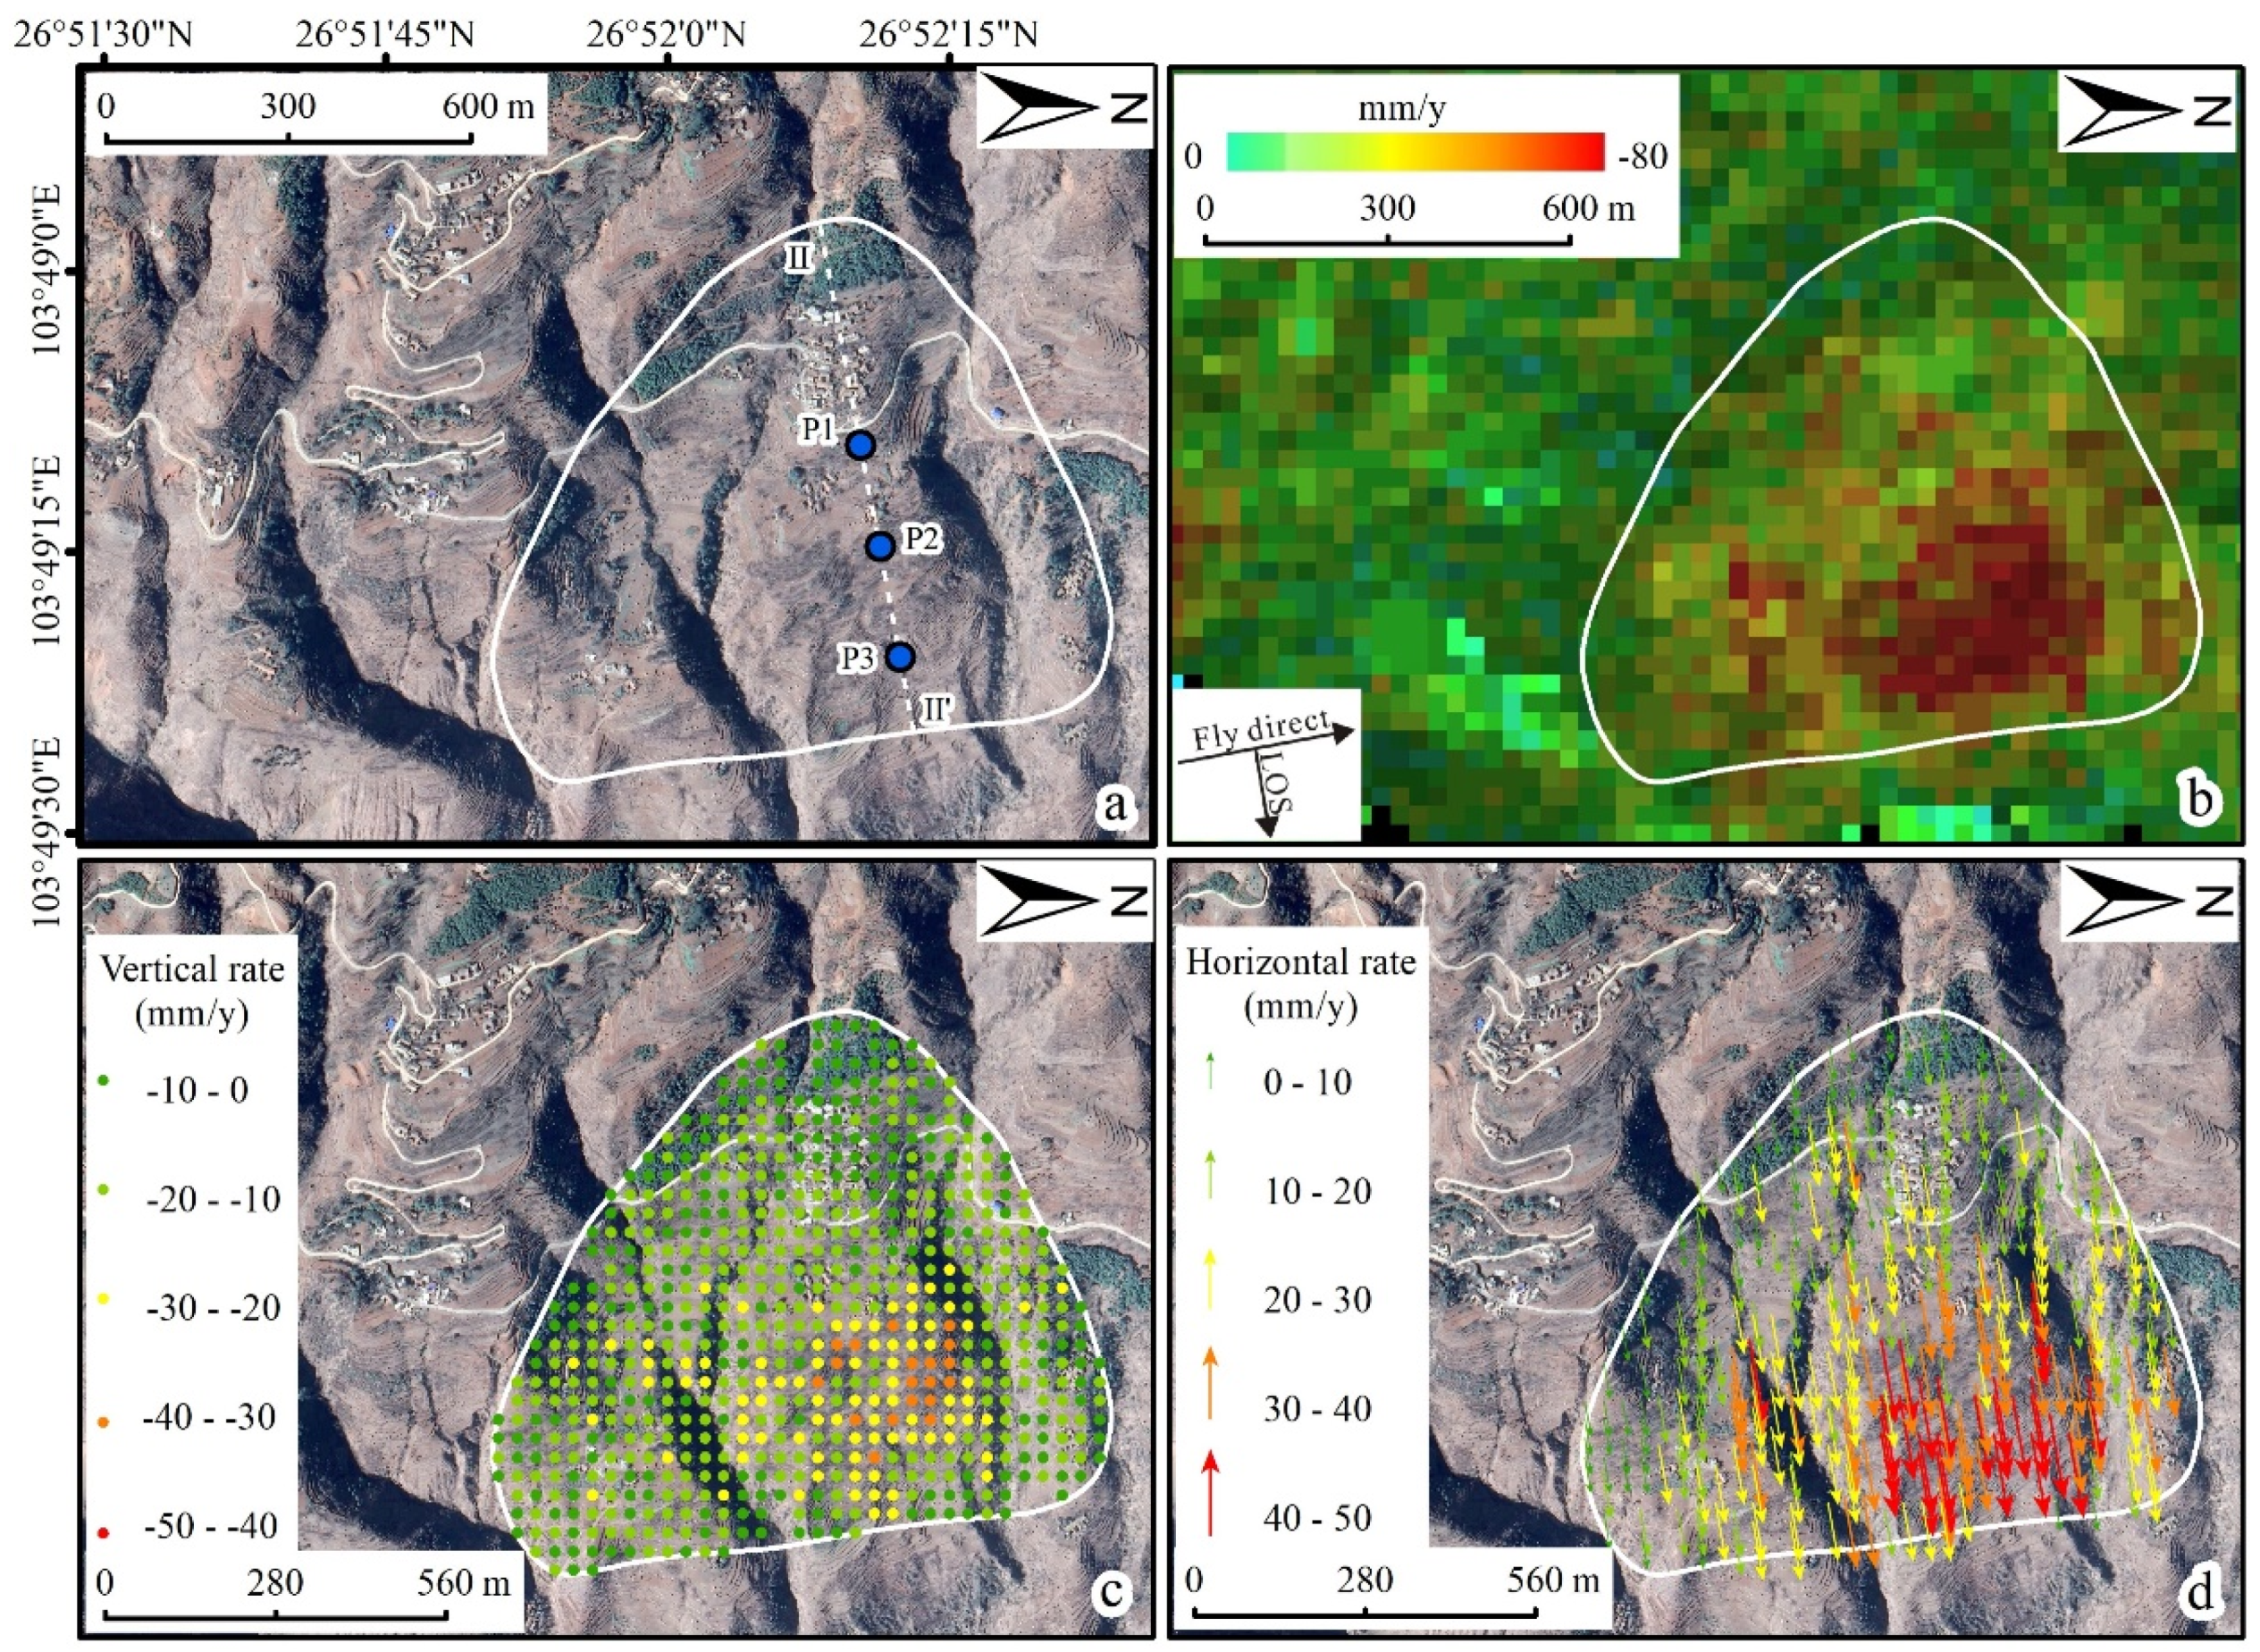
4.2.1. Rotational Slide
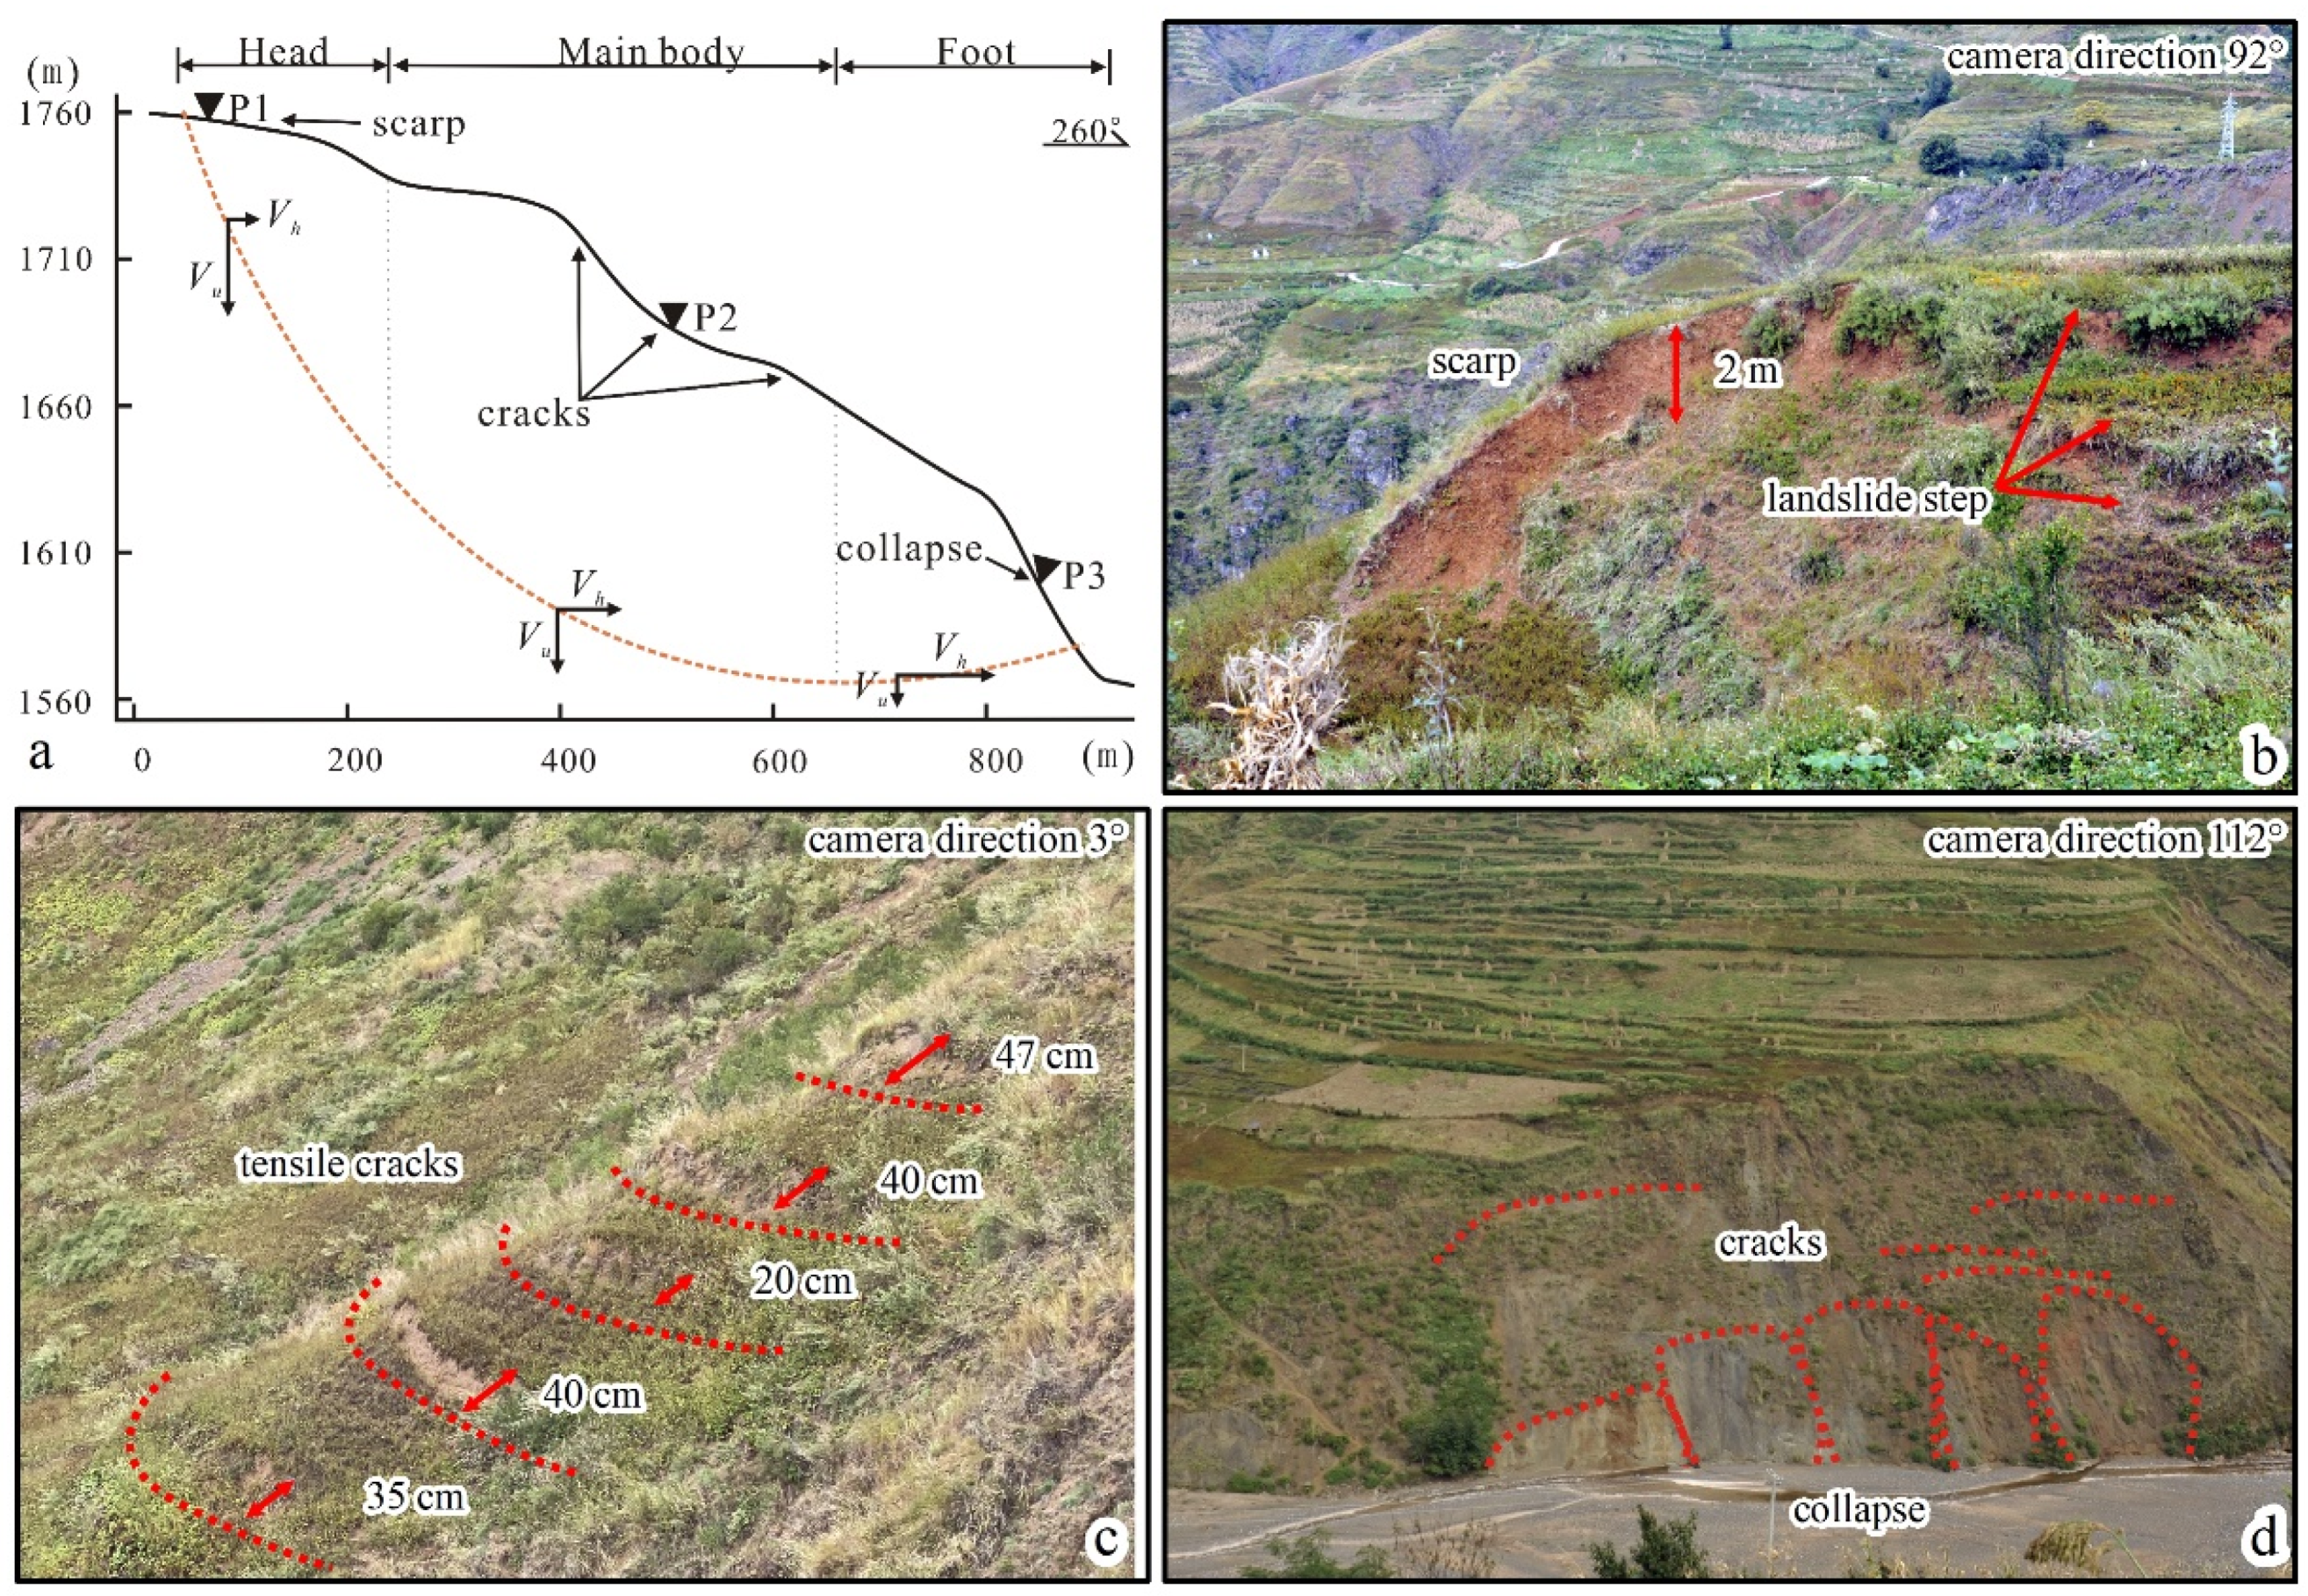
4.2.2. Planar Traction Slide
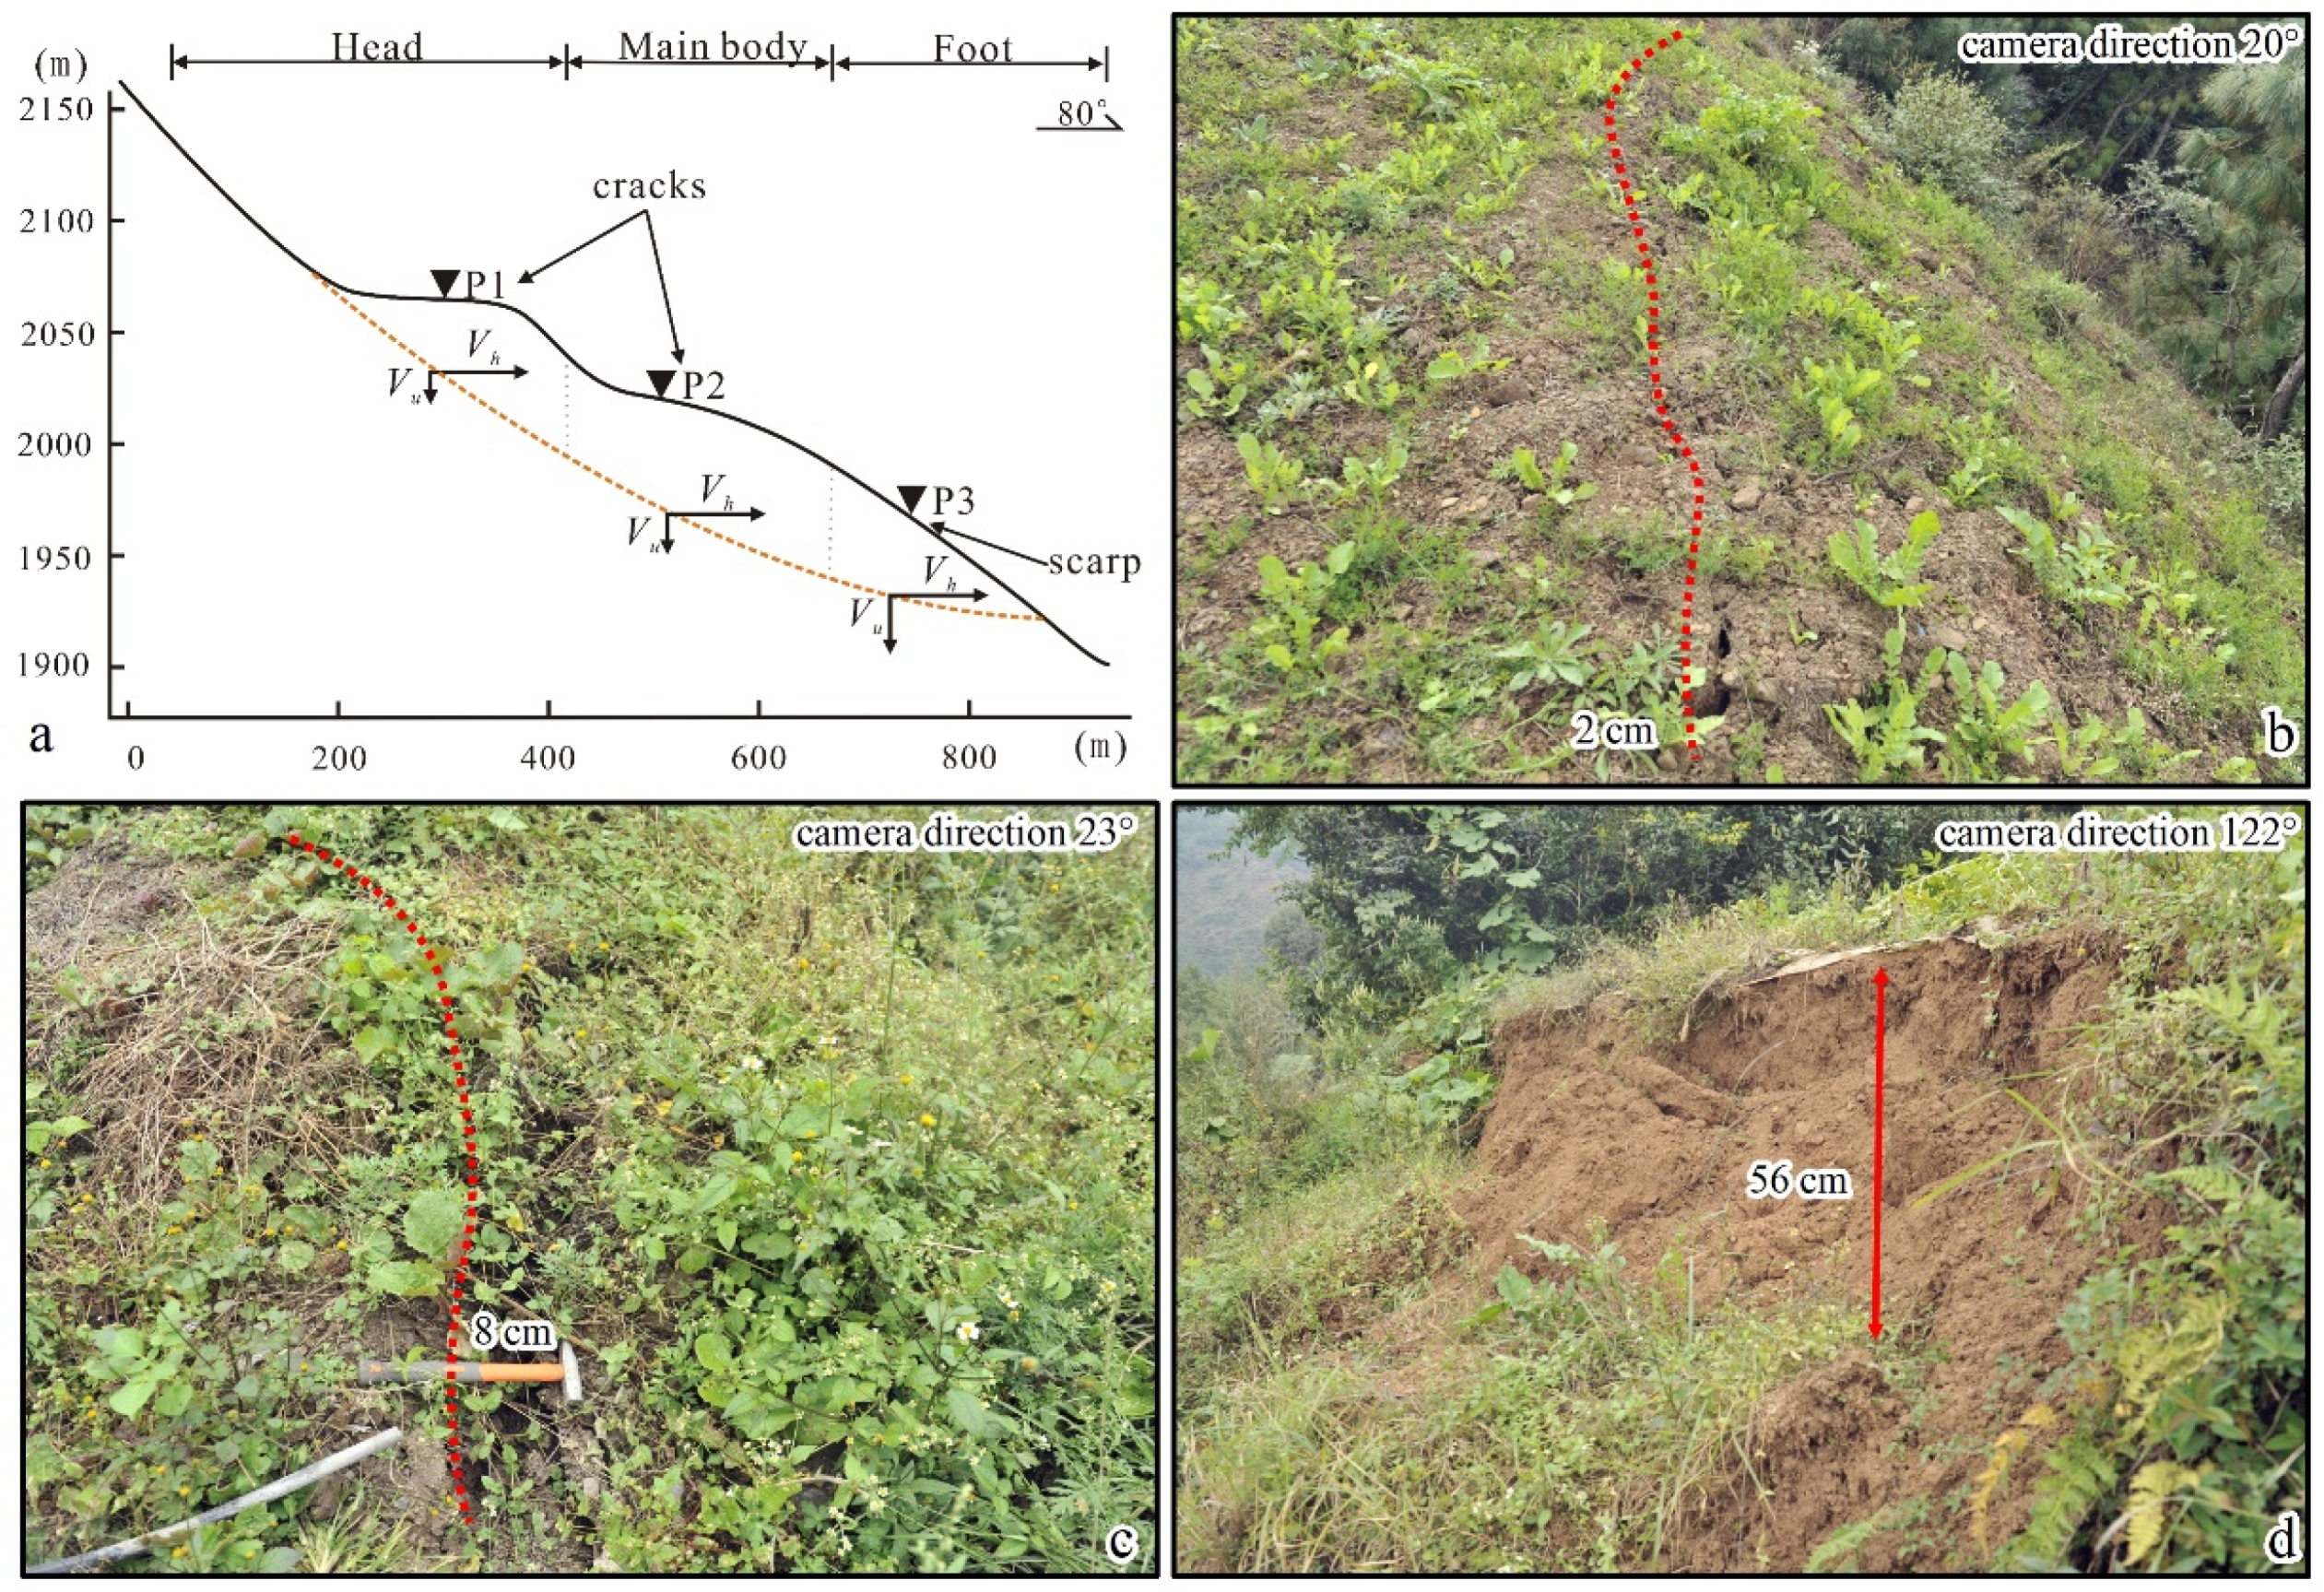
4.2.3. Planar Thrust Slide
5. Discussion
5.1. Relationship between Time-Series Displacement of Landslides and Rainfall
5.2. Uncertainty Factors Affecting Landslide Classification
6. Conclusions
Author Contributions
Funding
Data Availability Statement
Acknowledgments
Conflicts of Interest
References
- Dai, F.C.; Xu, C.; Yao, X.; Xu, L.; Tu, X.B.; Gong, Q.M. Spatial distribution of landslides triggered by the 2008 Ms 8.0 Wenchuan earthquake, China. J. Asian Earth Sci. 2011, 40, 883–895. [Google Scholar] [CrossRef]
- Xu, C.; Xu, X.; Yao, X.; Dai, F. Three (nearly) complete inventories of landslides triggered by the May 12, 2008 Wenchuan Mw 7.9 earthquake of China and their spatial distribution statistical analysis. Landslides 2014, 11, 441–461. [Google Scholar] [CrossRef]
- Ju, Y.; Xu, Q.; Jin, S.; Li, W.; Su, Y.; Dong, X.; Guo, Q. Loess landslide detection using object detection algorithms in northwest China. Remote Sens. 2022, 14, 1182. [Google Scholar] [CrossRef]
- Rogers, A.E.E.; Ingalls, R.P. Venus: Mapping the surface reflectivity by radar interferometry. Science 1969, 165, 797–799. [Google Scholar] [CrossRef] [PubMed]
- Graham, L. Synthetic interferometer radar for topographic mapping. Proc. IEEE 1974, 62, 763–768. [Google Scholar] [CrossRef]
- Xu, Y.; Lu, Z.; Kim, J.-W. P-Band InSAR for geohazard detection over forested terrains: Preliminary results. Remote Sens. 2021, 13, 4575. [Google Scholar] [CrossRef]
- Wang, Y.; Liu, D.; Dong, J.; Zhang, L.; Guo, J.; Liao, M.; Gong, J. On the applicability of satellite SAR interferometry to landslide hazards detection in hilly areas: A case study of Shuicheng, Guizhou in southwest China. Landslides 2021, 18, 2609–2619. [Google Scholar] [CrossRef]
- Ren, K.; Yao, X.; Zhao, X.; Zhou, Z.; Li, L. Study of landslide failure prediction based on TS-InSAR, GPS and image offset monitoring. Chin. J. Rock Mech. Eng. 2020, 39, 3421–3431. [Google Scholar] [CrossRef]
- Sandwell, D.T.; Price, E.J. Phase gradient approach to stacking interferograms. J. Geophys. Res. 1998, 103, 30183–30204. [Google Scholar] [CrossRef]
- Ferretti, A.; Prati, C.; Rocca, F. Analysis of permanent scatterers in SAR interferometry. In Proceedings of the IGARSS 2000, IEEE 2000 International Geoscience and Remote Sensing Symposium. Taking the Pulse of the Planet: The Role of Remote Sensing in Managing the Environment, Honolulu, HI, USA, 24–28 July 2000; Volume 2, pp. 761–763. [Google Scholar]
- Berardino, P.; Fornaro, G.; Lanari, R.; Sansosti, E. A new algorithm for surface deformation monitoring based on small baseline differential SAR interferograms. IEEE Trans. Geosci. Remote Sens. 2002, 40, 2375–2383. [Google Scholar] [CrossRef]
- Liu, Y.; Yao, X.; Gu, Z.; Zhou, Z.; Liu, X.; Chen, X.; Wei, S. Study of the Automatic Recognition of Landslides by Using InSAR Images and the Improved Mask R-CNN Model in the Eastern Tibet Plateau. Remote Sens. 2022, 14, 3362. [Google Scholar] [CrossRef]
- Chen, X.; Yao, X.; Zhou, Z.; Liu, Y.; Yao, C.; Ren, K. DRs-UNet: A Deep Semantic Segmentation Network for the Recognition of Active Landslides from InSAR Imagery in the Three Rivers Region of the Qinghai–Tibet Plateau. Remote Sens. 2022, 14, 1848. [Google Scholar] [CrossRef]
- Zhu, Y.; Yao, X.; Yao, L.; Yao, C. Detection and characterization of active landslides with multisource SAR data and remote sensing in western Guizhou, China. Nat. Hazards 2022, 111, 973–994. [Google Scholar] [CrossRef]
- Li, L.; Yao, X.; Zhou, Z.; Wang, D. The applicability assessment of sentinel-1 data in InSAR monitoring of the deformed slopes of reservoir in the mountains of southwest China: A case study in the Xiluodu reservoir. J. Geomech. 2022, 28, 281–293. [Google Scholar] [CrossRef]
- Yao, C.; Yao, X.; Gu, Z.; Ren, K.; Zhou, Z. Analysis on the development law of active geological hazards in the loess plateau based on InSAR identification. J. Geomech. 2022, 28, 257–267. [Google Scholar] [CrossRef]
- Zhu, Y.; Yao, X.; Yao, L.; Zhou, Z. Identification and risk assessment of coal mining-induced landslides in Guizhou province by InSAR and optical remote rensing. J. Geomech. 2022, 28, 268–280. [Google Scholar] [CrossRef]
- Intrieri, E.; Raspini, F.; Fumagalli, A.; Lu, P.; Del Conte, S.; Farina, P.; Allievi, J.; Ferretti, A.; Casagli, N. The Maoxian landslide as seen from space: Detecting precursors of failure with sentinel-1 data. Landslides 2018, 15, 123–133. [Google Scholar] [CrossRef]
- Reyes-Carmona, C.; Barra, A.; Galve, J.; Monserrat, O.; Pérez-Peña, J.; Mateos, R.; Notti, D.; Ruano, P.; Millares, A.; López-Vinielles, J.; et al. Sentinel-1 DInSAR for monitoring active landslides in critical infrastructures: The case of the rules reservoir (southern Spain). Remote Sens. 2020, 12, 809. [Google Scholar] [CrossRef]
- Zhang, C.; Zhao, Y.; He, X.; Guo, J.; Yan, Y. Space-sky-surface integrated monitoring system for overburden migration regularity in shallow-buried high-intensity mining. Bull. Eng. Geol. Environ. 2021, 80, 1403–1417. [Google Scholar] [CrossRef]
- Cascini, L.; Fornaro, G.; Peduto, D. Advanced low- and full-resolution DInSAR map generation for slow-moving landslide analysis at different scales. Eng. Geol. 2010, 112, 29–42. [Google Scholar] [CrossRef]
- Bonforte, A.; Guglielmino, F.; Coltelli, M.; Ferretti, A.; Puglisi, G. Structural assessment of Mount Etna volcano from Permanent Scatterers analysis. Geochem. Geophys. Geosyst. 2011, 12. [Google Scholar] [CrossRef]
- Li, T.; Motagh, M.; Wang, M.; Zhang, W.; Gong, C.; Xiong, X.; He, J.; Chen, L.; Liu, J. Earth and rock-filled dam monitoring by high-resolution X-band interferometry: Gongming dam case study. Remote Sens. 2019, 11, 246. [Google Scholar] [CrossRef]
- Hu, J.; Li, Z.W.; Ding, X.L.; Zhu, J.J.; Zhang, L.; Sun, Q. Resolving three-dimensional surface displacements from InSAR measurements: A review. Earth-Sci. Rev. 2014, 133, 1–17. [Google Scholar] [CrossRef]
- Ren, K.; Yao, X.; Li, R.; Zhou, Z.; Yao, C.; Jiang, S. 3D displacement and deformation mechanism of deep-seated gravitational slope deformation revealed by InSAR: A case study in Wudongde reservoir, Jinsha river. Landslides 2022, 19, 2159–2175. [Google Scholar] [CrossRef]
- Yi, X.; Feng, W.; Wu, M.; Ye, Z.; Fang, Y.; Wang, P.; Li, R.; Dun, J. The initial impoundment of the Baihetan reservoir region (China) exacerbated the deformation of the Wangjiashan landslide: Characteristics and mechanism. Landslides 2022, 19, 1897–1912. [Google Scholar] [CrossRef]
- Meng, Q.; Confuorto, P.; Peng, Y.; Raspini, F.; Bianchini, S.; Han, S.; Liu, H.; Casagli, N. Regional recognition and classification of active loess landslides using two-dimensional deformation derived from sentinel-1 interferometric radar data. Remote Sens. 2020, 12, 1541. [Google Scholar] [CrossRef]
- Ali, J.R.; Thompson, G.M.; Zhou, M.-F.; Song, X. Emeishan large igneous province, SW China. Lithos 2005, 79, 475–489. [Google Scholar] [CrossRef]
- He, K.; Ma, G.; Hu, X.; Luo, G.; Mei, X.; Liu, B.; He, X. Characteristics and mechanisms of coupled road and rainfall-induced landslide in Sichuan China. Geomat. Nat. Hazards Risk 2019, 10, 2313–2329. [Google Scholar] [CrossRef]
- He, K.; Ma, G.; Hu, X. Formation mechanisms and evolution model of the tectonic-related ancient giant basalt landslide in Yanyuan county, China. Nat. Hazards 2021, 106, 2575–2597. [Google Scholar] [CrossRef]
- Guo, J.; Yi, S.; Yin, Y.; Cui, Y.; Qin, M.; Li, T.; Wang, C. The effect of topography on landslide kinematics: A case study of the Jichang town landslide in Guizhou, China. Landslides 2020, 17, 959–973. [Google Scholar] [CrossRef]
- Lanari, R.; Mora, O.; Manunta, M.; Mallorqui, J.J.; Berardino, P.; Sansosti, E. A small-baseline approach for investigating deformations on full-resolution differential SAR interferograms. IEEE Trans. Geosci. Remote Sens. 2004, 42, 1377–1386. [Google Scholar] [CrossRef]
- Pepe, A.; Lanari, R. On the extension of the minimum cost flow algorithm for phase unwrapping of multitemporal differential SAR interferograms. IEEE Trans. Geosci. Remote Sens. 2006, 44, 2374–2383. [Google Scholar] [CrossRef]
- Doin, M.-P.; Lasserre, C.; Peltzer, G.; Cavalié, O.; Doubre, C. Corrections of stratified tropospheric delays in SAR interferometry: Validation with global atmospheric models. J. Appl. Geophys. 2009, 69, 35–50. [Google Scholar] [CrossRef]
- Morishita, Y.; Lazecky, M.; Wright, T.; Weiss, J.; Elliott, J.; Hooper, A. LiCSBAS: An open-source InSAR time series analysis package integrated with the LiCSAR automated sentinel-1 InSAR processor. Remote Sens. 2020, 12, 424. [Google Scholar] [CrossRef]
- Zhu, Y.; Yao, X.; Yao, L.; Zhou, Z.; Ren, K.; Li, L.; Yao, C.; Gu, Z. Identifying the mechanism of toppling deformation by InSAR: A case study in Xiluodu reservoir, Jinsha river. Landslides 2022, 1–17. [Google Scholar] [CrossRef]
- Kang, Y. Application of InSAR Technology in Landslide Detection and Monitoring in Southwest Mountainous Area. Master’s Thesis, Chang’an University, Xi’an, China, 2016. [Google Scholar]
- Varnes, D.J. Landslide types and processes. Landslides Eng. Pract. 1958, 24, 20–47. [Google Scholar]
- Hungr, O.; Leroueil, S.; Picarelli, L. The varnes classification of landslide types, an update. Landslides 2014, 11, 167–194. [Google Scholar] [CrossRef]
- Xin, P.; Liu, Z.; Wu, S.; Liang, C.; Lin, C. Rotational–translational landslides in the Neogene basins at the northeast margin of the Tibetan plateau. Eng. Geol. 2018, 244, 107–115. [Google Scholar] [CrossRef]
- Huang, H.; Song, K.; Yi, W.; Long, J.; Liu, Q.; Zhang, G. Use of multi-source remote sensing images to describe the sudden Shanshucao landslide in the three gorges reservoir, China. Bull. Eng. Geol. Environ. 2019, 78, 2591–2610. [Google Scholar] [CrossRef]
- Li, D.; Yan, L.; Wu, L.; Yin, K.; Leo, C. The Hejiapingzi landslide in Weining county, Guizhou province, southwest China: A recent slow-moving landslide triggered by reservoir drawdown. Landslides 2019, 16, 1353–1365. [Google Scholar] [CrossRef]
- Ma, S.; Xu, C.; Xu, X.; He, X.; Qian, H.; Jiao, Q.; Gao, W.; Yang, H.; Cui, Y.; Zhang, P.; et al. Characteristics and causes of the landslide on July 23, 2019 in Shuicheng, Guizhou province, China. Landslides 2020, 17, 1441–1452. [Google Scholar] [CrossRef]
- Fan, X.; Tang, J.; Tian, S.; Jiang, Y. Rainfall-induced rapid and long-runout catastrophic landslide on July 23, 2019 in Shuicheng, Guizhou, China. Landslides 2020, 17, 2161–2171. [Google Scholar] [CrossRef]
- Leng, Y.; Kong, X.; He, J.; Xing, A.; Zhang, Y.; Wang, Q. The July 10, 2020, Red-bed landslide triggered by continuous rainfall in Qianxi, Guizhou, China. Landslides 2022, 19, 1421–1433. [Google Scholar] [CrossRef]
- Li, Y.; Feng, X.; Yao, A.; Zhang, Z.; Li, K.; Wang, Q.; Song, S. Progressive evolution and failure behavior of a Holocene river-damming landslide in the SE Tibetan plateau, China. Landslides 2022, 19, 1069–1086. [Google Scholar] [CrossRef]
- Xin, P.; Dong, X.; Wu, S.; Shi, J. The accumulation characteristics and mechanism of rotational-translational landslides in the Neogene basins on the northeastern margin of Tibet plateau. Acta Geol. Sin. 2017, 91, 499–509. [Google Scholar]
- He, K.; Hu, X.; Ma, G.; Liu, B. The reactivated mechanism of Boli village giant ancient basalt landslide in Yanyuan, Sichuan. Rock Soil Mech. 2020, 41, 3443–3455. [Google Scholar] [CrossRef]
- Yu, H.; Li, C.; Zhou, J.-Q.; Gu, X.; Duan, Y.; Liao, L.; Chen, W.; Zhu, Y.; Long, J. A Large-scale obliquely inclined bedding rockslide triggered by heavy rainstorm on the 8th of July 2020 in Shiban village, Guizhou, China. Landslides 2022, 19, 1119–1130. [Google Scholar] [CrossRef]
- Chen, Y.; He, X.; Xu, C.; Huang, Y.; Zhang, P.; Luo, Z.; Zhan, T. Development characteristics and causes of a fatal landslide occurred in Shuicheng, Guizhou province, China. IJGI 2022, 11, 119. [Google Scholar] [CrossRef]
- Zheng, G.; Xu, Q.; Liu, X. The Jichang landslide on July 23, 2019 in Shuicheng, Guizhou: Characteristics and failure mechanism. J. Eng. Geol. 2020, 28, 541–556. [Google Scholar] [CrossRef]
- Shen, Q.; Chen, X.; Wang, N. Analysis of mechanical parameters of slip surface for basalt landslide in Yunnan. Rock Soil Mech. 2006, 27, 2309–2313. [Google Scholar] [CrossRef]


| Sensor | Wavelength | Direction | Path | Frame | Resolution (m) | Incidence Angle (°) | Heading Angle (°) | Number | Polarization | Temporal Coverage |
|---|---|---|---|---|---|---|---|---|---|---|
| Sentinel-1 | 5.6 cm | Ascending | 128 | 84 | 2.33 × 13.96 | 39.64 | 347.3 | 42 | VV | 9 January 2019–15 May 2020 |
| Descending | 164 | 500,505 | 2.33 × 13.99 | 41.69 | 192.56 | 40 | VV | 11 January 2019–5 May 2020 |
| Landslide Number | Landslide Name | Longitude (°) | Latitude (°) | Length (m) | Width (m) | MHV (mm/y) | MVV (mm/y) | β (°) | Kinematic Type |
|---|---|---|---|---|---|---|---|---|---|
| L04 | Xiamatian | 103.882 | 26.877 | 860 | 900 | 49 | 50 | 260 | R |
| L03 | Bainijing | 103.765 | 26.961 | 380 | 720 | 41 | 19 | 215 | P-TR |
| L05 | Jieli | 104.521 | 26.806 | 710 | 840 | 66 | 34 | 203 | P-TR |
| L06 | Liujiagou | 104.533 | 26.818 | 1180 | 840 | 78 | 46 | 309 | P-TR |
| L10 | Hanjiaping | 103.821 | 26.869 | 890 | 1050 | 57 | 32 | 80 | P-TR |
| L11 | Dapingzi | 103.819 | 26.855 | 460 | 790 | 69 | 39 | 110 | P-TR |
| L12 | Zhande | 103.823 | 26.762 | 980 | 730 | 40 | 30 | 99 | P-TR |
| L13 | Songlingping | 103.735 | 26.775 | 470 | 1160 | 72 | 35 | 318 | P-TR |
| L16 | Dakouzi | 104.162 | 26.713 | 870 | 410 | 59 | 35 | 156 | P-TR |
| L18 | Yanzutian | 104.624 | 26.660 | 300 | 427 | 71 | 31 | 220 | P-TR |
| L19 | Shiyakou | 104.627 | 26.659 | 312 | 550 | 89 | 37 | 205 | P-TR |
| L01 | Dahaizi | 103.939 | 27.321 | 1120 | 320 | 76 | 55 | 357 | P-TH |
| L02 | Xujiayan | 103.920 | 27.224 | 1360 | 500 | 78 | 31 | 48 | P-TH |
| L07 | Xiaohe | 104.068 | 27.068 | 850 | 350 | 53 | 30 | 300 | P-TH |
| L08 | Wachang | 104.276 | 26.681 | 620 | 280 | 57 | 23 | 170 | P-TH |
| L09 | Wujiapingzi | 103.828 | 26.881 | 980 | 600 | 54 | 30 | 66 | P-TH |
| L14 | Sanjiacun | 103.821 | 26.596 | 998 | 450 | 68 | 28 | 240 | P-TH |
| L15 | Laoyaying | 104.055 | 26.695 | 1300 | 360 | 128 | 59 | 208 | P-TH |
| L17 | Tuojiyuanzi | 104.629 | 26.665 | 733 | 790 | 67 | 46 | 275 | P-TH |
| L20 | Dongfeng | 104.577 | 26.801 | 415 | 910 | 149 | 60 | 217 | P-TH |
| L21 | Sanguozhuang | 104.570 | 26.809 | 900 | 500 | 98 | 66 | 290 | P-TH |
Publisher’s Note: MDPI stays neutral with regard to jurisdictional claims in published maps and institutional affiliations. |
© 2022 by the authors. Licensee MDPI, Basel, Switzerland. This article is an open access article distributed under the terms and conditions of the Creative Commons Attribution (CC BY) license (https://creativecommons.org/licenses/by/4.0/).
Share and Cite
Zhu, Y.; Yao, X.; Yao, C.; Zhou, Z.; Gu, Z.; Yao, L. Integration of Vertical and Horizontal Deformation Derived by SAR Observation for Identifying Landslide Motion Patterns in a Basaltic Weathered Crust Region of Guizhou, China. Remote Sens. 2022, 14, 4014. https://doi.org/10.3390/rs14164014
Zhu Y, Yao X, Yao C, Zhou Z, Gu Z, Yao L. Integration of Vertical and Horizontal Deformation Derived by SAR Observation for Identifying Landslide Motion Patterns in a Basaltic Weathered Crust Region of Guizhou, China. Remote Sensing. 2022; 14(16):4014. https://doi.org/10.3390/rs14164014
Chicago/Turabian StyleZhu, Yifei, Xin Yao, Chuangchuang Yao, Zhenkai Zhou, Zhenkui Gu, and Leihua Yao. 2022. "Integration of Vertical and Horizontal Deformation Derived by SAR Observation for Identifying Landslide Motion Patterns in a Basaltic Weathered Crust Region of Guizhou, China" Remote Sensing 14, no. 16: 4014. https://doi.org/10.3390/rs14164014
APA StyleZhu, Y., Yao, X., Yao, C., Zhou, Z., Gu, Z., & Yao, L. (2022). Integration of Vertical and Horizontal Deformation Derived by SAR Observation for Identifying Landslide Motion Patterns in a Basaltic Weathered Crust Region of Guizhou, China. Remote Sensing, 14(16), 4014. https://doi.org/10.3390/rs14164014