
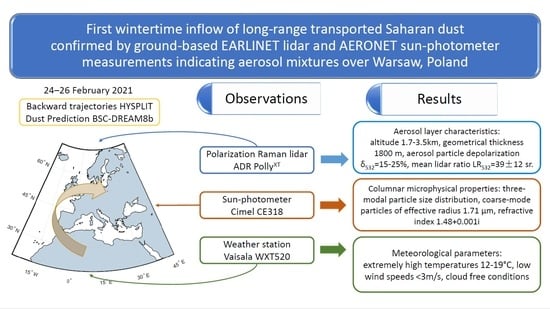
First Ever Observations of Mineral Dust in Wintertime over Warsaw, Poland

 , , , and
Abstract
1. Introduction
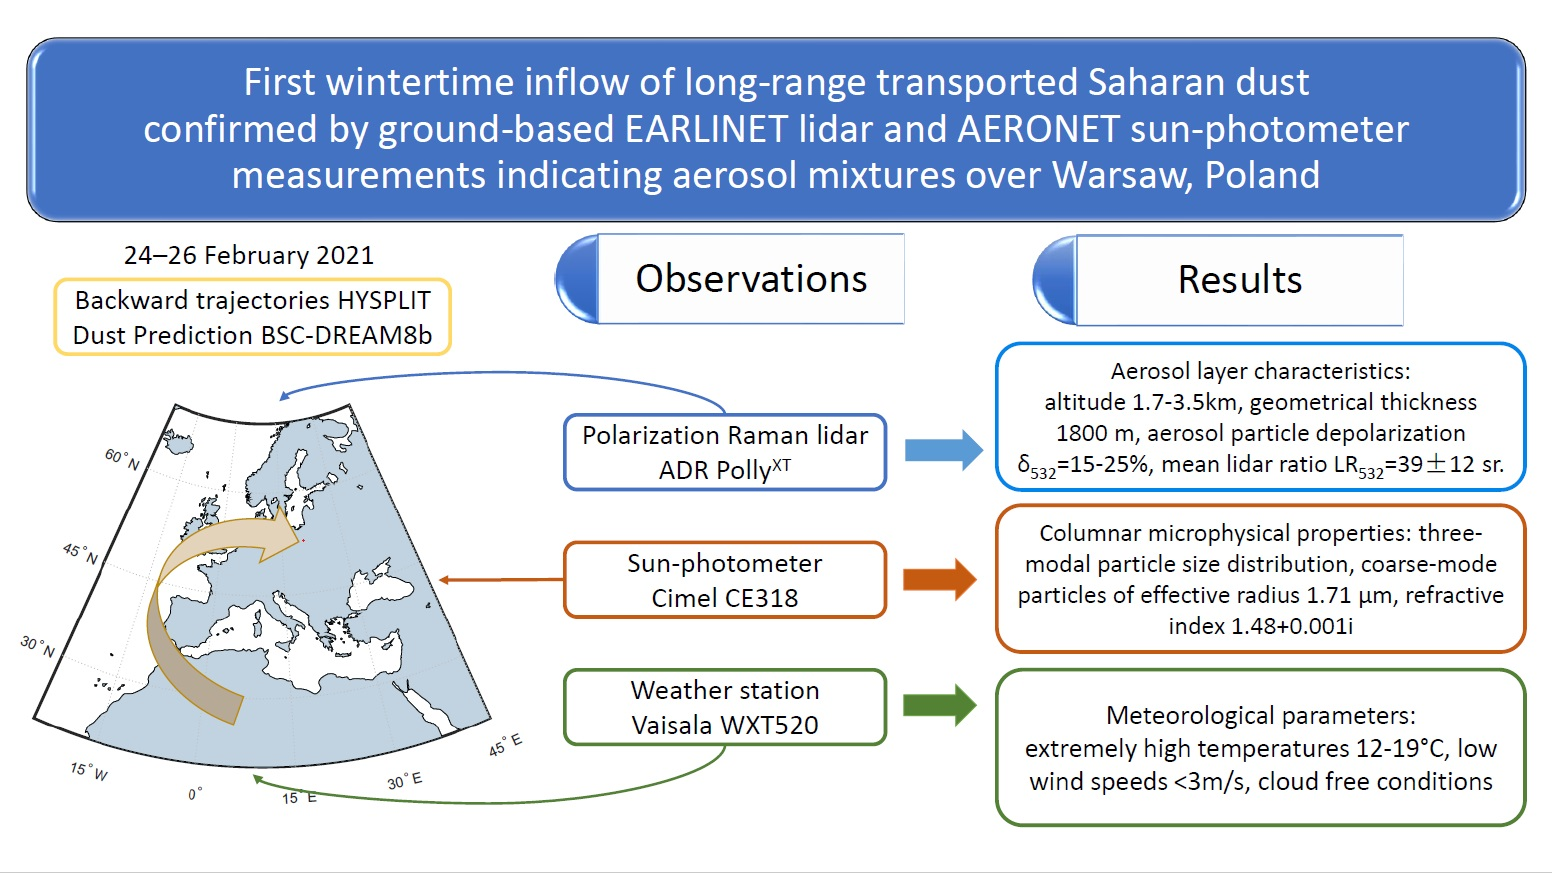
2. Measuring Instruments and Numerical Models
3. Methodology
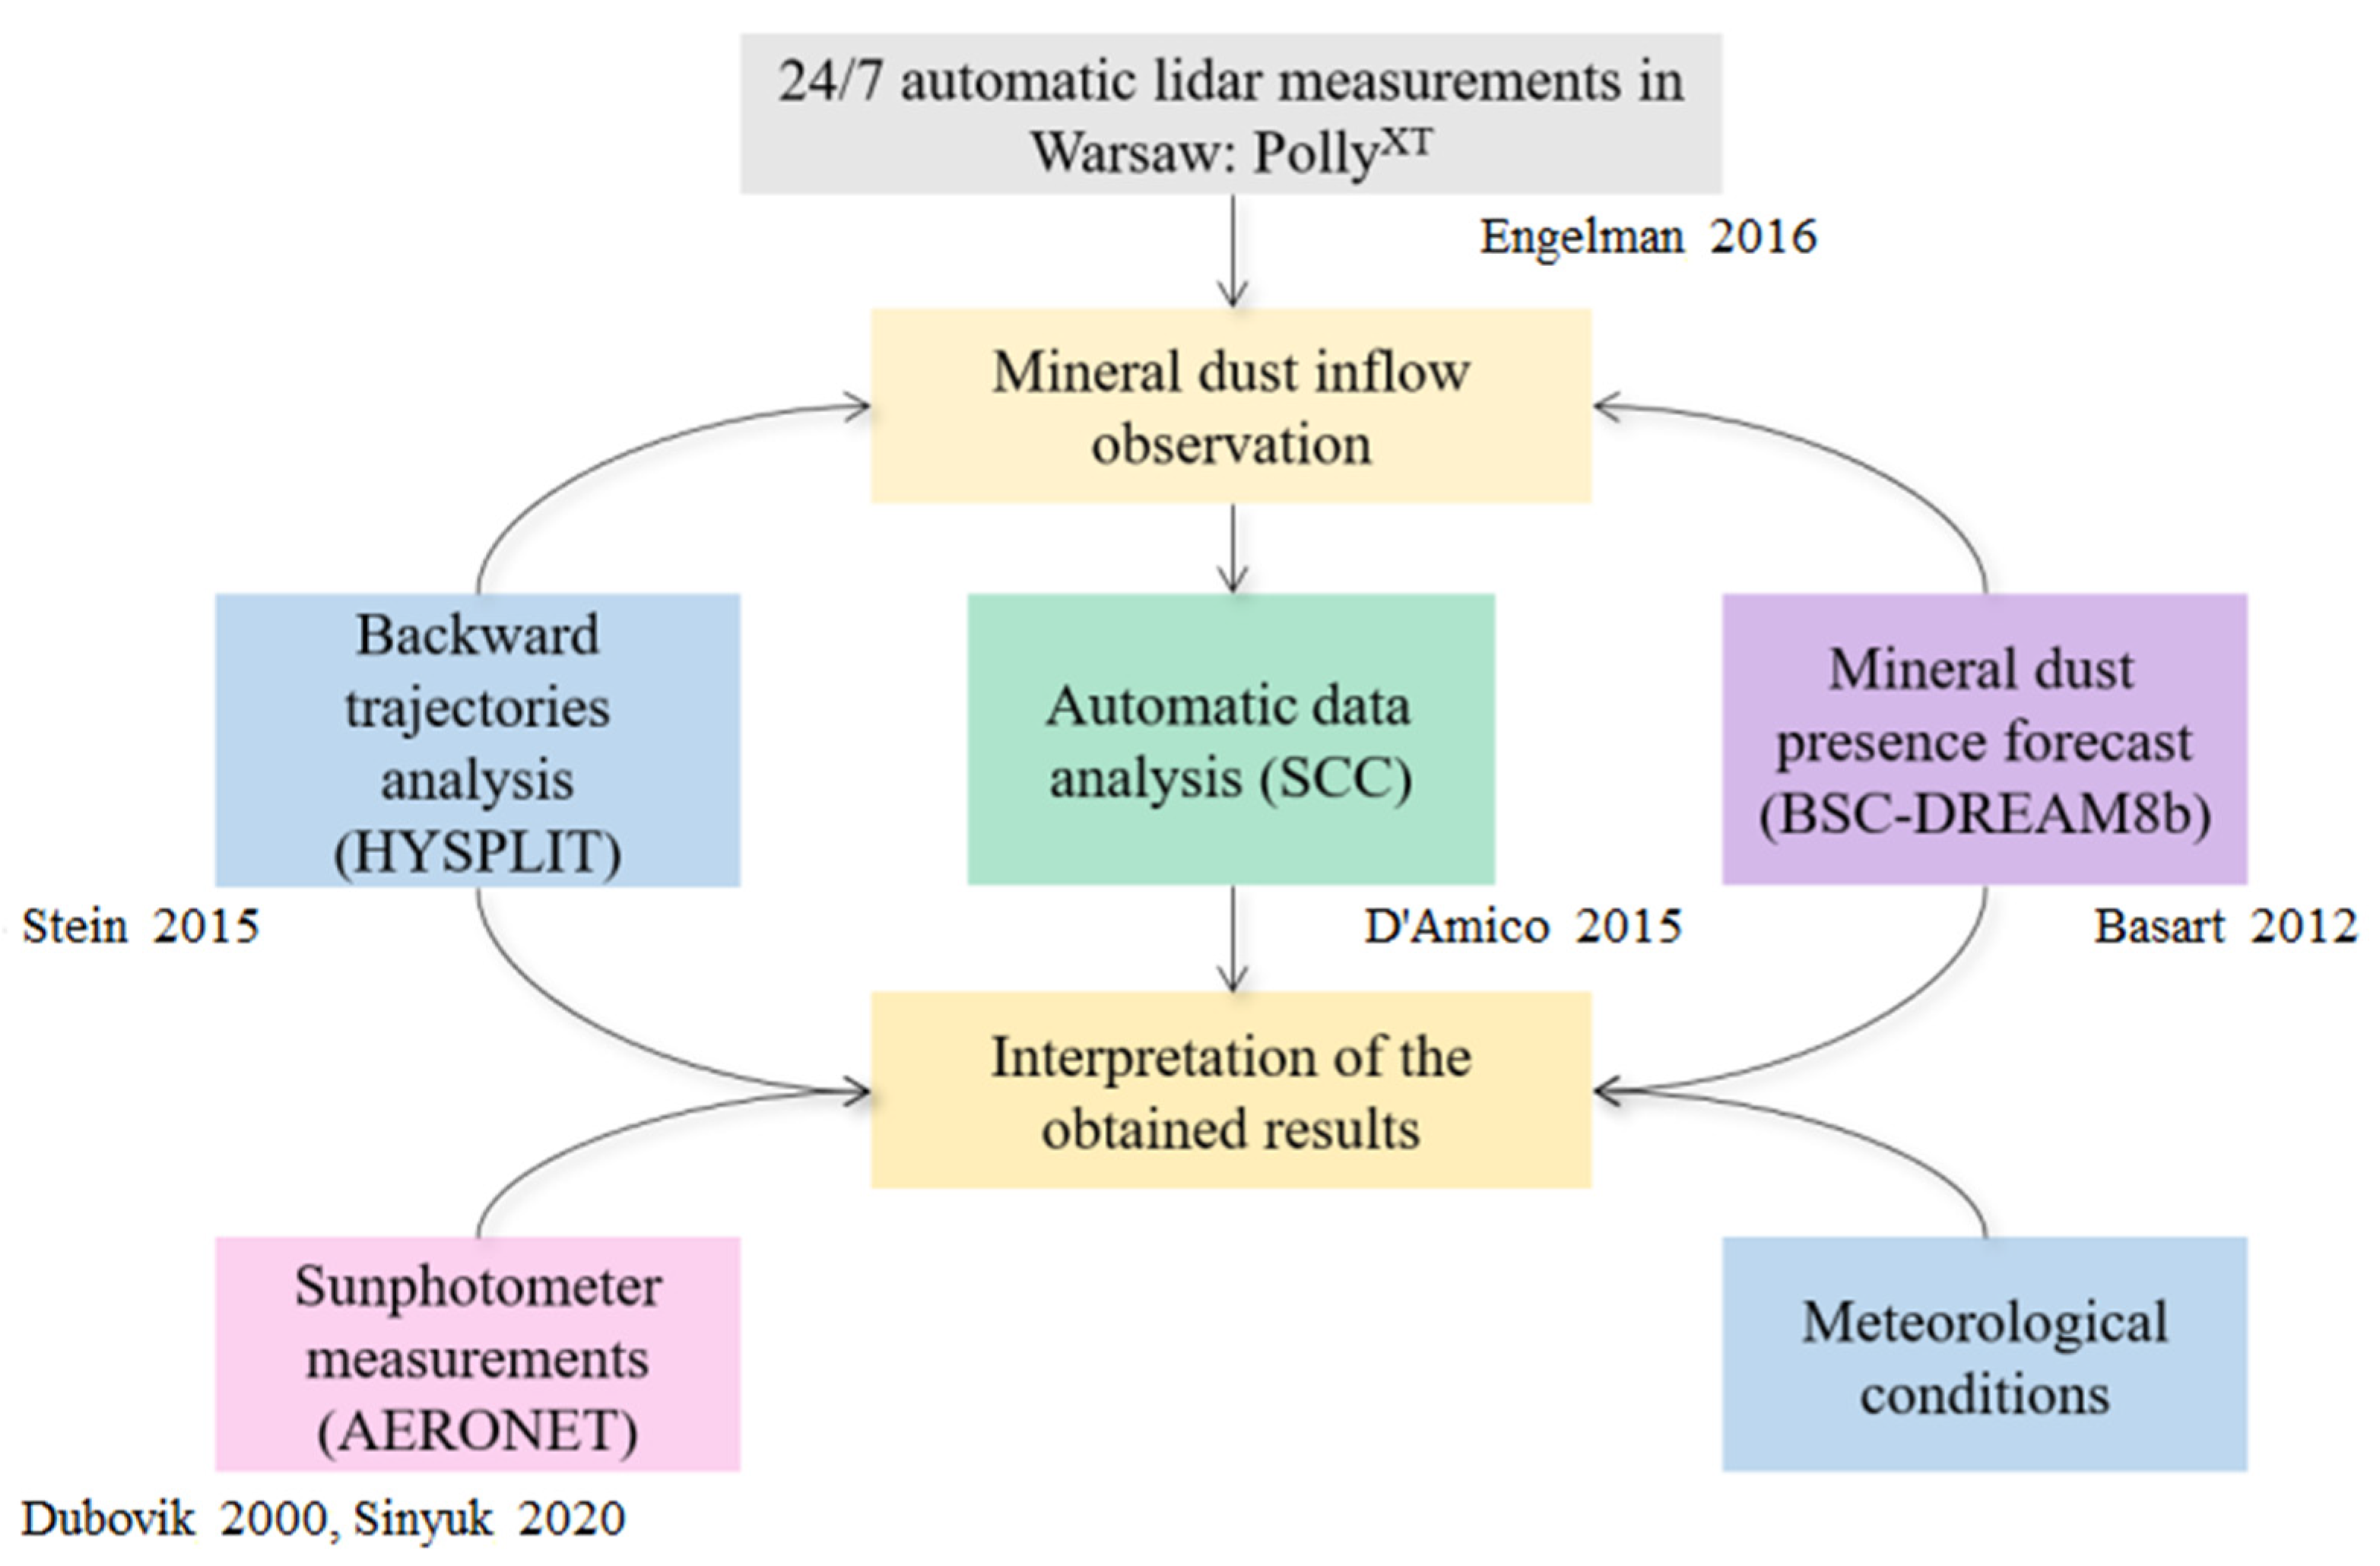
4. Results
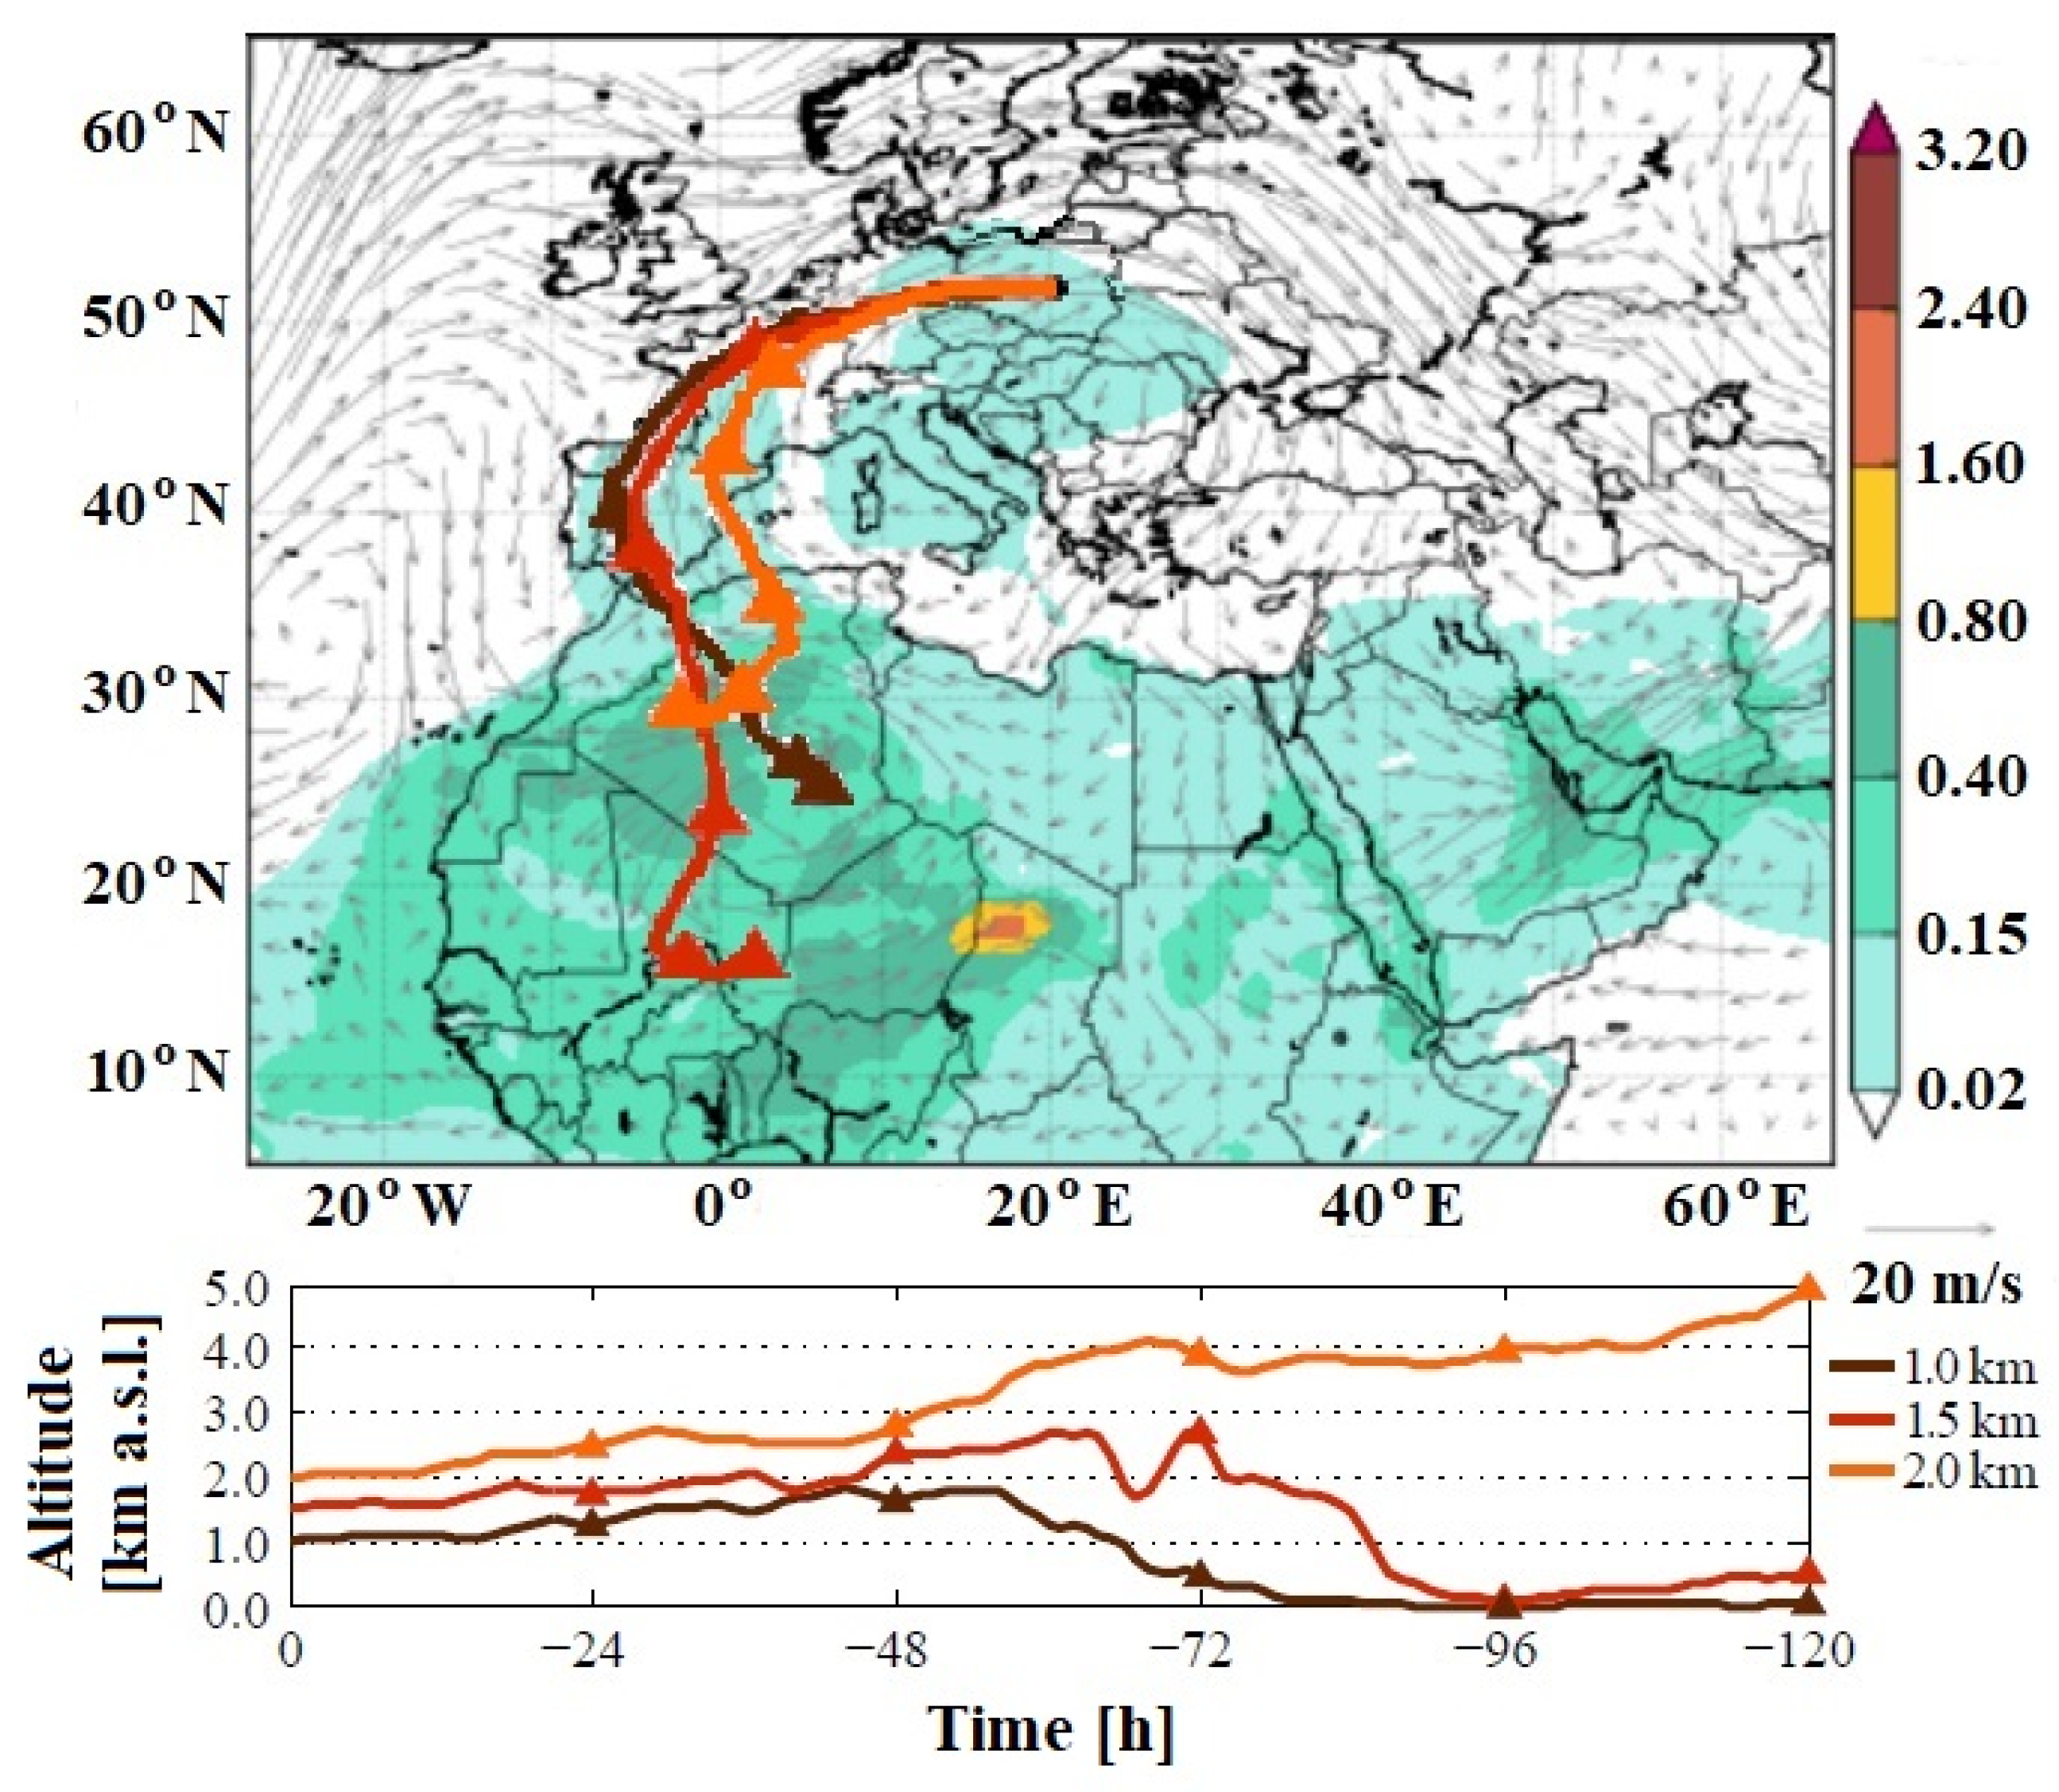
4.1. Meteorological Situation
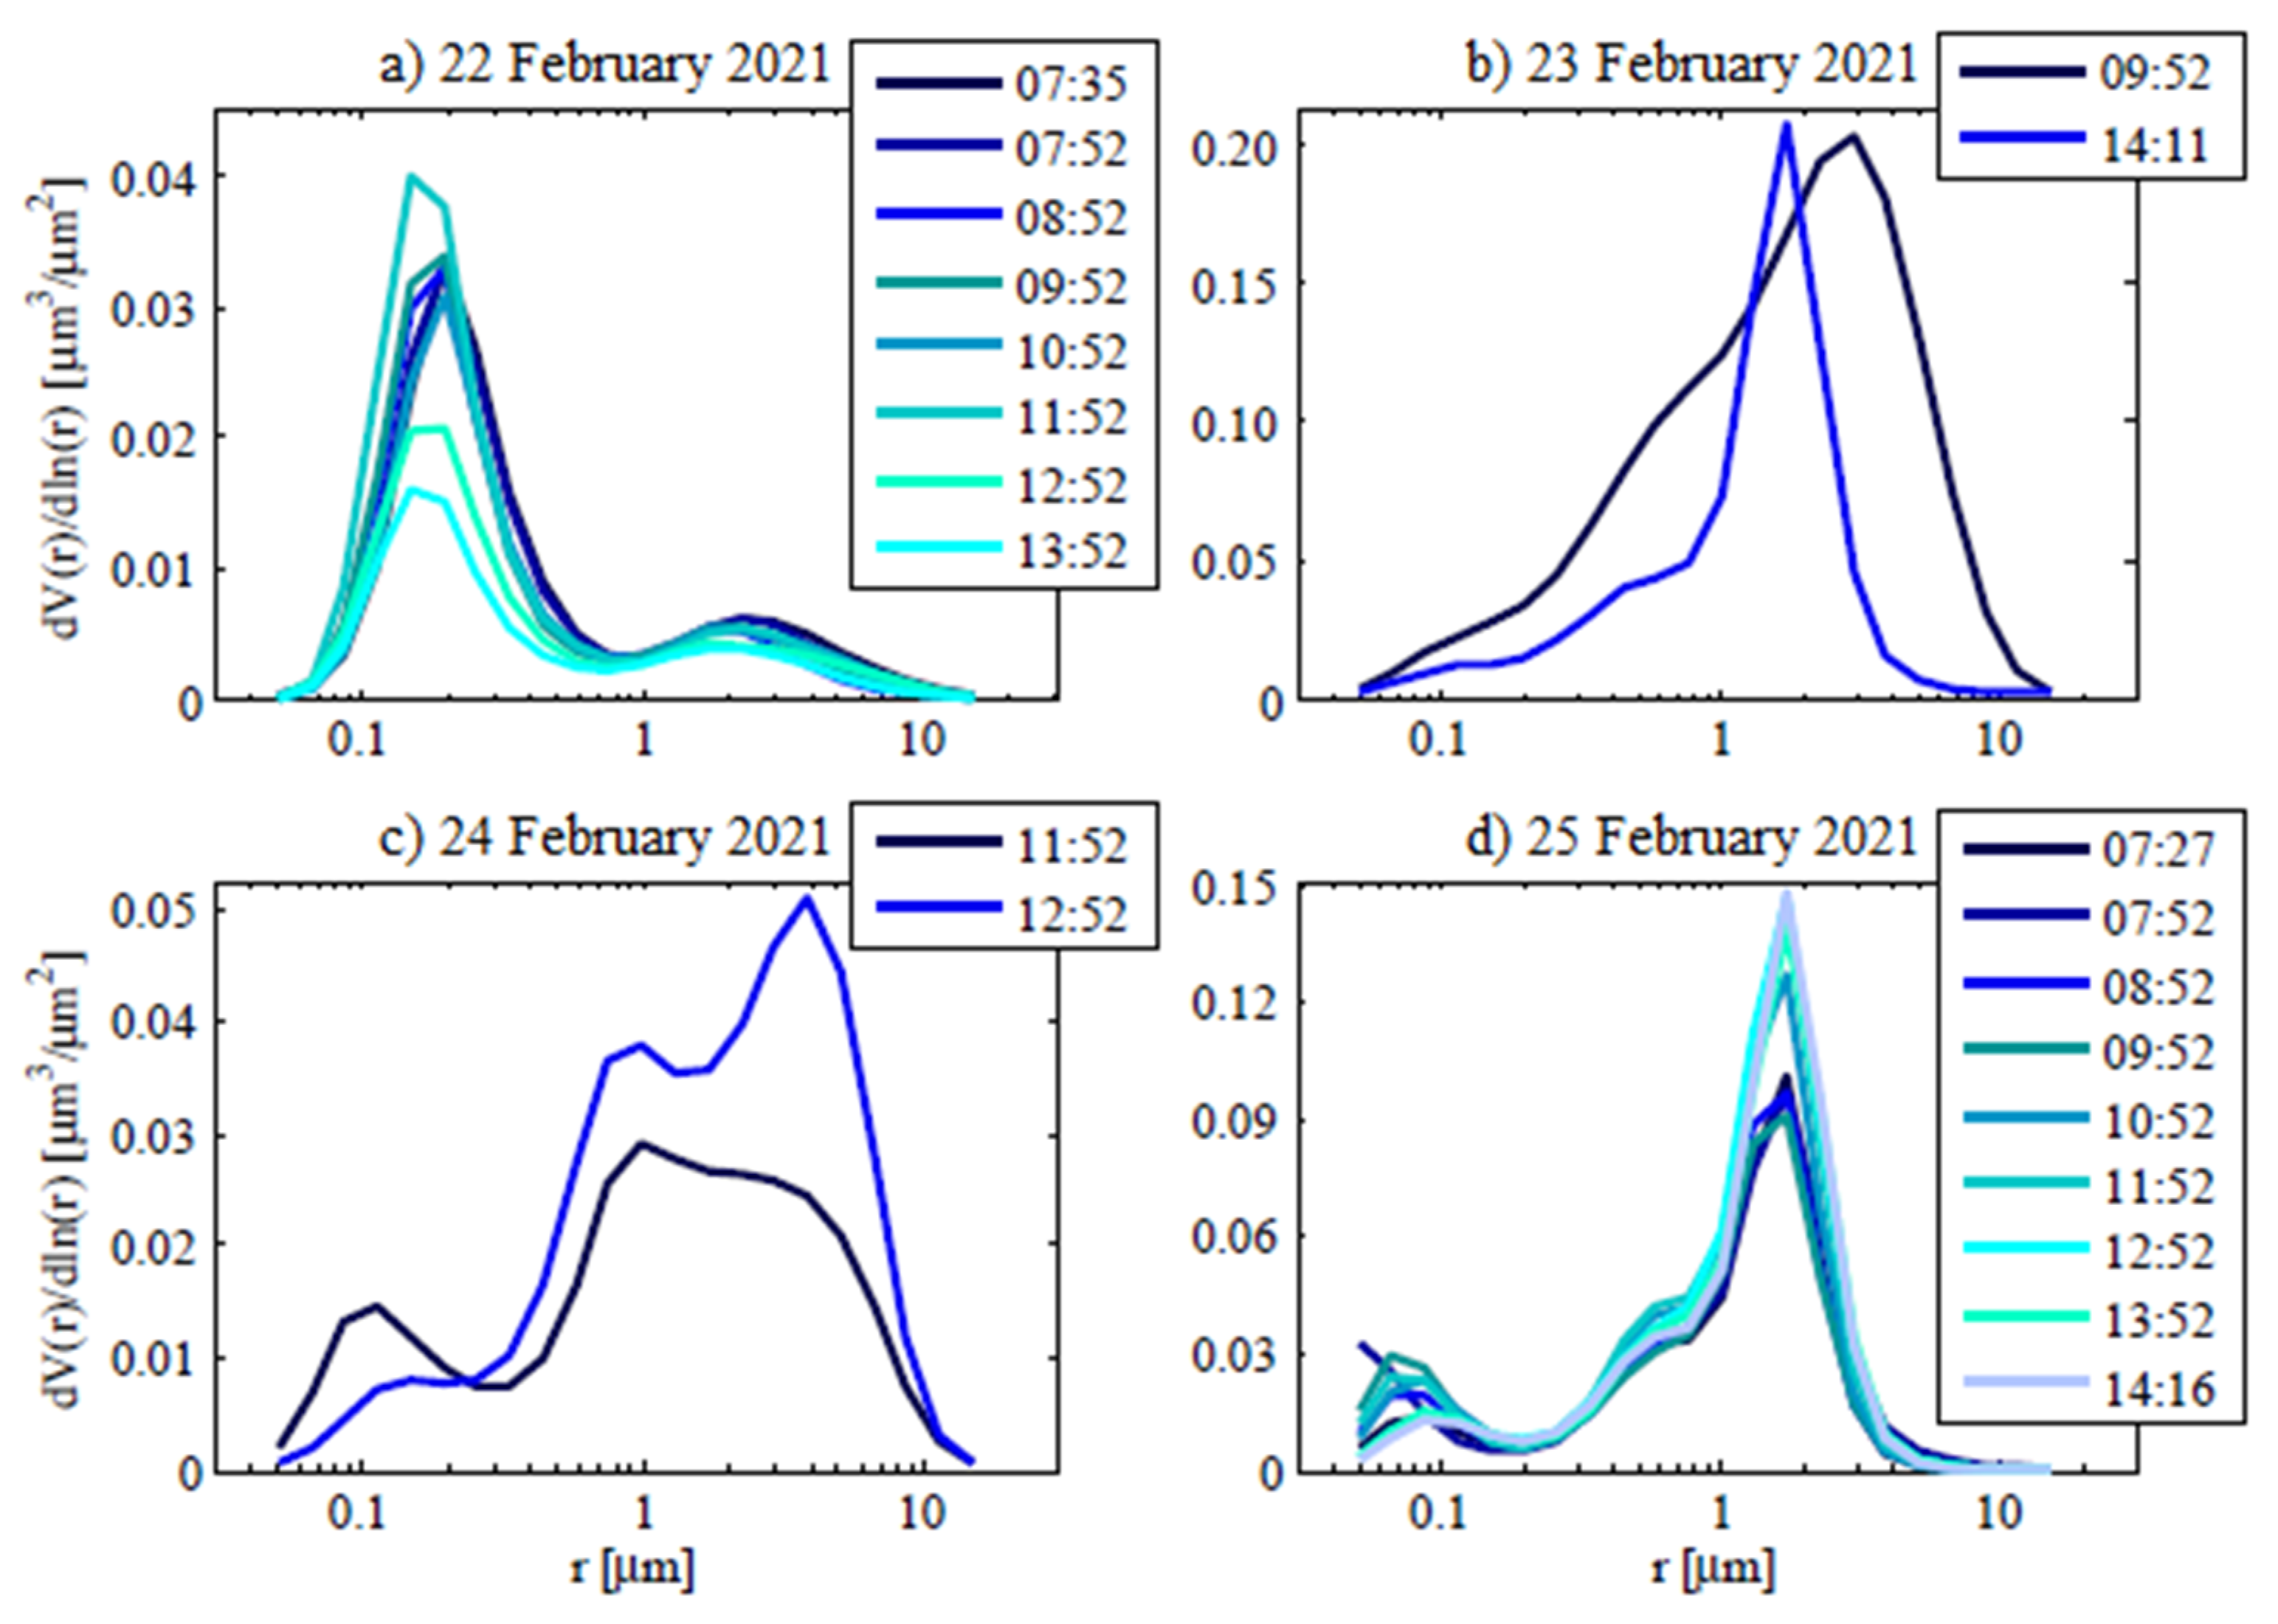
4.2. Analysis of Potential Aerosol Sources
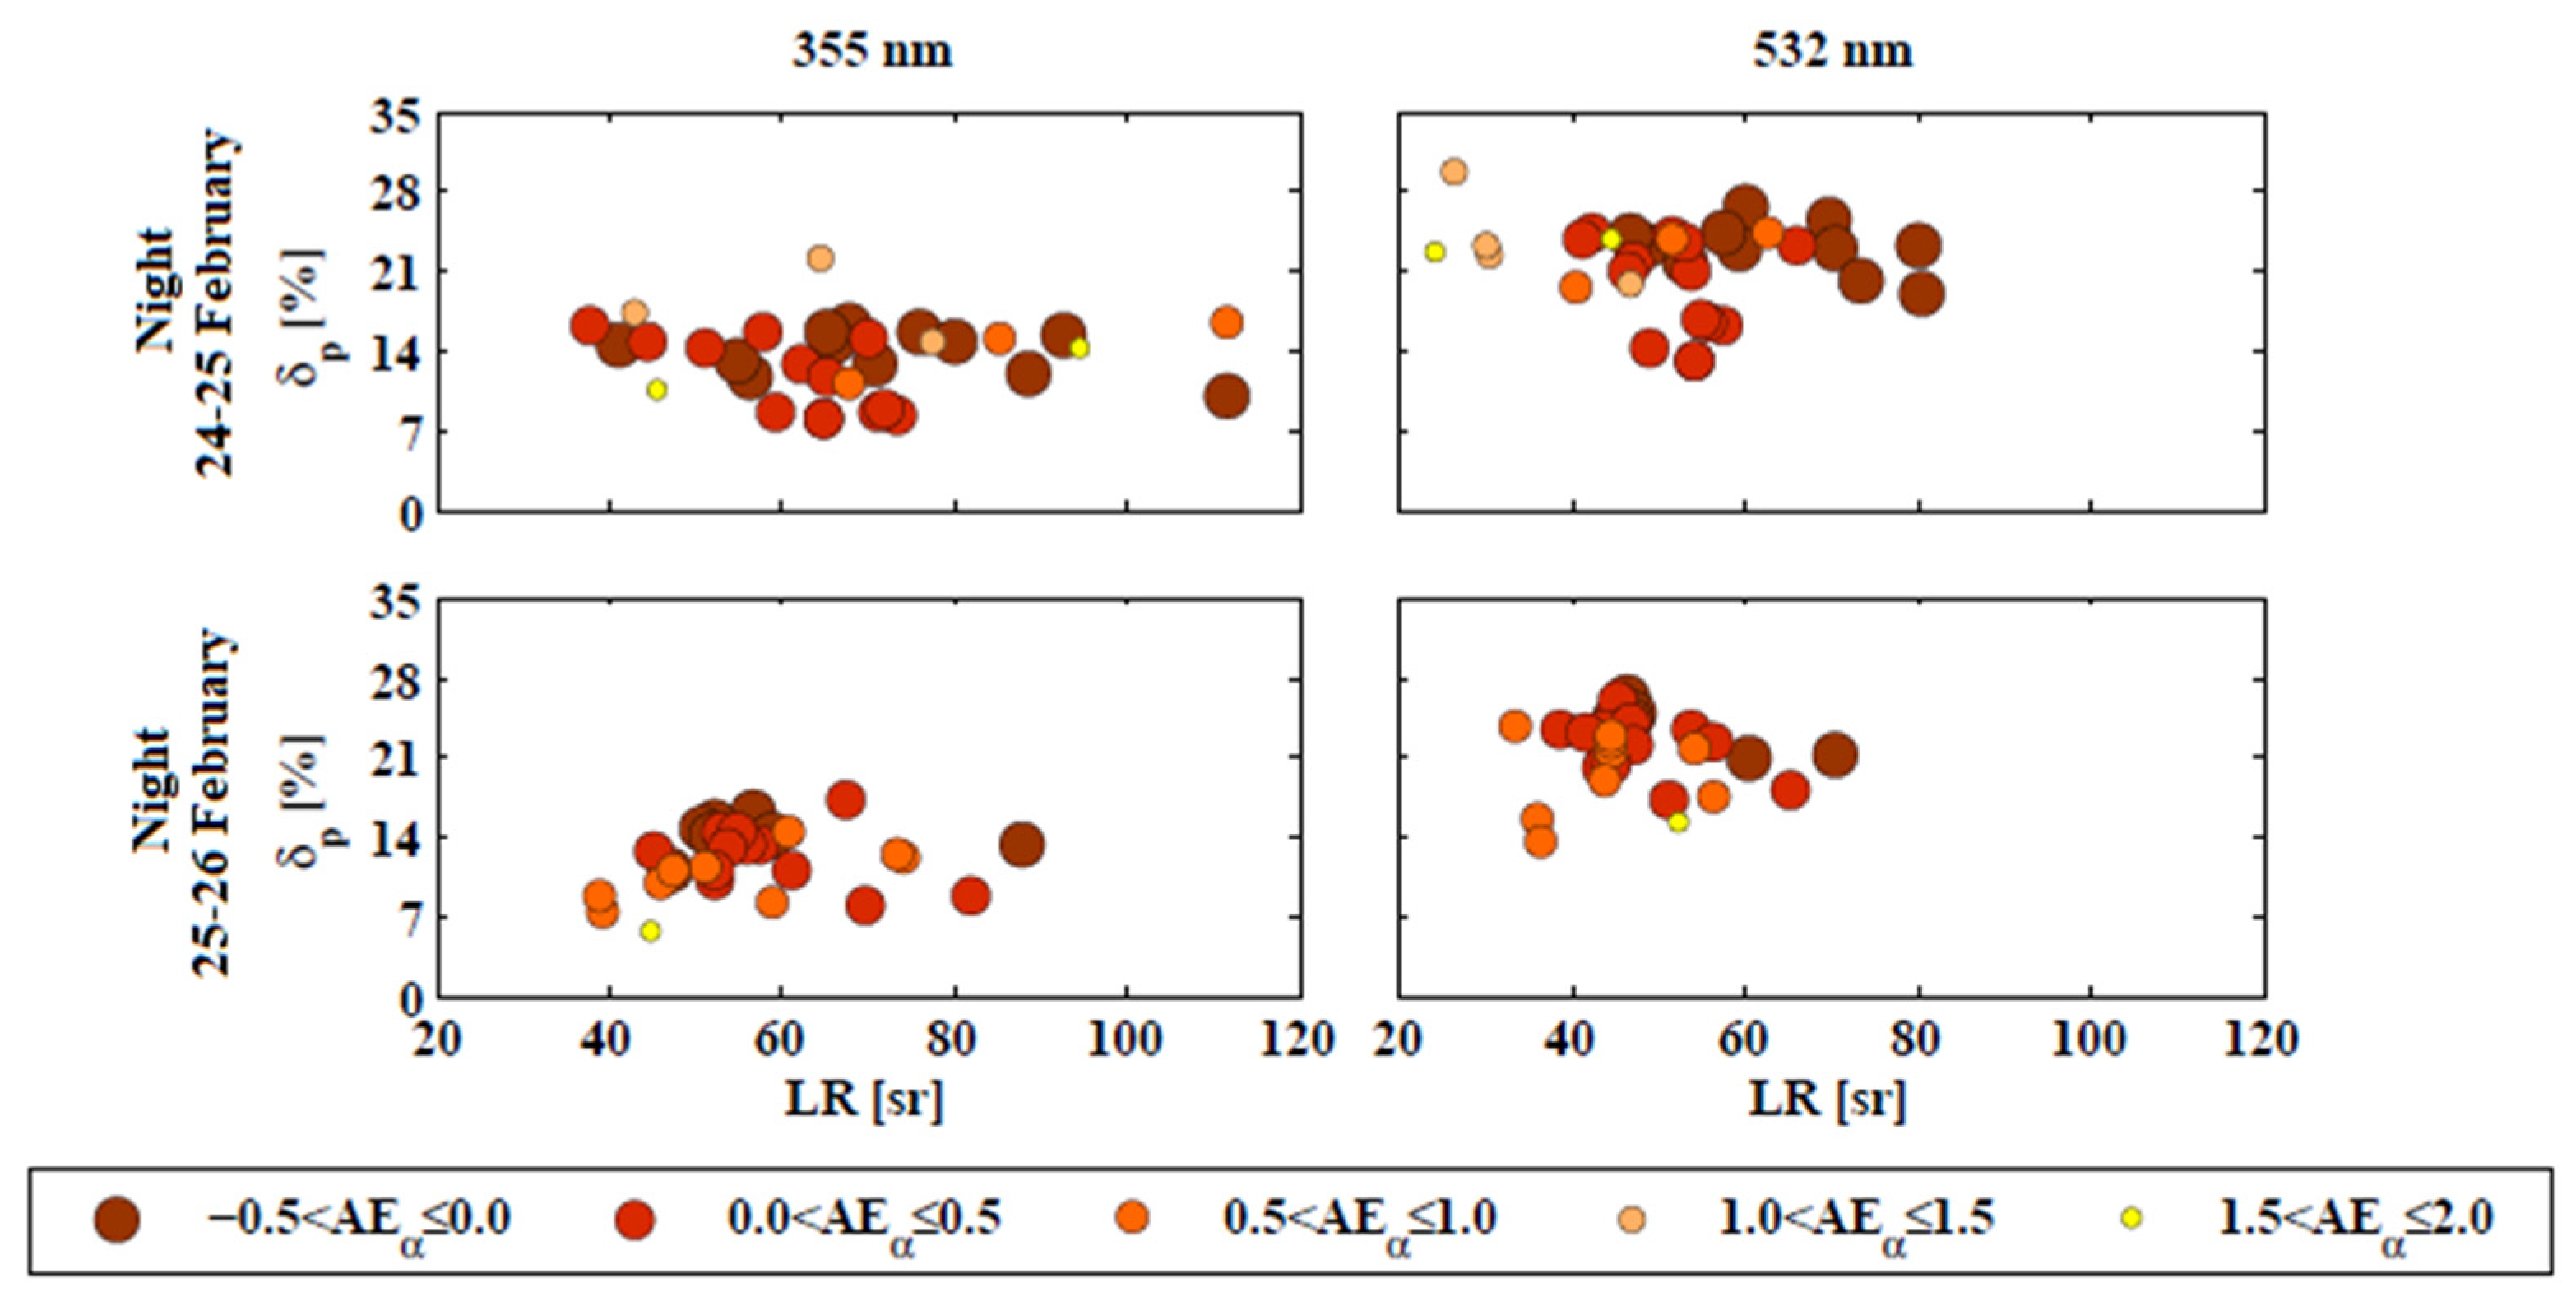
4.3. Optical Properties of the Atmosphere
5. Summary and Conclusions
Author Contributions
Funding
Data Availability Statement
Acknowledgments
Conflicts of Interest
References
- Boucher, O. Atmospheric Aerosols. In Atmospheric Aerosols; Springer: Dordrecht, The Netherlands, 2015; pp. 9–24. [Google Scholar]
- Masson-Delomonte, V.; Zhai, P.; Pirani, A.; Connors, S.L.; Pean, C.; Berger, S.; Caud, N.; Chen, Y.; Goldfarb, L.; Gomis, I.M.; et al. (Eds.) IPCC 2021: Climate Change 2021: The Physical Science Basis; Cambridge University: Cambridge, UK, in press.
- Grandos-Muñoz, M.J.; Sicard, M.; Román, R.; Benavent-Oltra, J.A.; Barragán, R.; Brogniez, G.; Denjean, C.; Mallet, M.; Formenti, P.; Torres, B.; et al. Impact of mineral dust on shortwave and longwave radiation: Evaluation of different vertically resolved parametrization in 1-D radiative transfer computations. Atmos. Chem. Phys. 2019, 19, 523–542. [Google Scholar] [CrossRef]
- Karydis, V.A.; Kumar, P.; Barahona, D.; Sokolik, I.N.; Nenes, A. On the effect of dust particles on global cloud condensation nuclei and cloud droplet number. J. Geophys. Res. 2011, 116, D23204. [Google Scholar] [CrossRef]
- Schepanski, K. Transport of Mineral Dust and Its Impact of Climate. Geosciences 2018, 8, 151. [Google Scholar] [CrossRef]
- Cook, B.I.; Seager, R.; Miller, R.L.; Mason, J.A. Intensification of north American megadroughts through surface and dust aerosol forcing. J. Climate 2013, 26, 4414–4430. [Google Scholar] [CrossRef]
- Kayetha, V.K.; Senthilkumar, J.; Prasad, A.K.; Cervone, G.; Singh, R.P. Effect of dust storm on ocean color and snow parameters. Photonirvachak—J. Indian Soc. Remote Sens. 2007, 35, 1–9. [Google Scholar] [CrossRef]
- Singh, R.P.; Prasad, A.K.; Kayetha, V.K.; Kafatos, M. Enhancement of oceanic parameters associated with dust storms using satellite data. J. Geophys. Res. 2008, 113, C11. [Google Scholar] [CrossRef]
- Kok, J.F.; Adebiyi, A.A.; Albani, S.; Balkanski, Y.; Checa-Garcia, R.; Chin, M.; Colarco, P.R.; Hamilton, D.S.; Huang, Y.; Ito, A.; et al. Contribution of the world’s main dust regions due to the global cycle of dust. Atmos. Chem. Phys. 2021, 21, 8169–8193. [Google Scholar] [CrossRef]
- Middleton, N.J.; Goudie, A.S. Saharan dust: Sources and trajectories. Trans. Inst. Br. Geogr. 2001, 26, 165–181. [Google Scholar] [CrossRef]
- Janicka, L.; Stachlewska, I.S.; Vesolovskii, I.; Baars, H. Temporal variations in optical and microphysical properties of mineral dust and biomass burning aerosol derived from daytime Raman lidar observations over Warsaw, Poland. Atmos. Environ. 2017, 169, 162–174. [Google Scholar] [CrossRef]
- Janicka, L.; Szczepanik, D.; Borek, K.; Heese, B.; Stachlewska, I.S. Lidar derived properties of air masses advected from Ukraine, Sahara and Carpathian mountains to Warsaw, Poland on 9–11 August 2015. EPJ Web Conf. 2018, 176, 5003. [Google Scholar] [CrossRef][Green Version]
- Szczepanik, D.; Tetoni, E.; Wang, D.; Stachlewska, I.S. Lidar based separation of polluted dust observed over Warsaw (case study on 09 August 2013). EPJ Web Conf. 2020, 237, 2018. [Google Scholar] [CrossRef]
- Szczepanik, D.M.; Stachlewska, I.S.; Tetoni, E.; Altchausen, D. Properties of Saharan Dust versus Local Urban Dust—A case study. Earth Space Sci. 2021, 8, e2021EA001816. [Google Scholar] [CrossRef]
- Enander, A.E.; Hygge, S. Thermal stress and human performance. Scand. J. Work. Environ. Health 1990, 16, 44–50. [Google Scholar] [CrossRef] [PubMed]
- Stanelle, T.; Bey, I.; Raddatz, T.; Reick, C.; Tegen, I. Anthropogenically induced changes in twentieth century mineral dust burden and the associated impact on radiative forcing. J. Geophys. Res. Atmos. 2013, 119, 13526–13546. [Google Scholar] [CrossRef]
- Feuerstein, S.; Schepanski, K. Identification of Dust Sources in a Saharan Dust Hot-Spot and Their Implementation in a Dust-Emission Model. Rem. Sens. 2019, 11, 4. [Google Scholar] [CrossRef]
- Tsarpalis, K.; Papadopoulos, A.; Mihalopoulos, N.; Spyrou, C.; Michaelides, S.; Katsafados, P. The Implementation of a Mineral Dust Wet Deposition Scheme in the GOCART-AFWA Module of the WRF Model. Rem. Sens. 2018, 10, 1595. [Google Scholar] [CrossRef]
- Adebiyi, A.A.; Kok, J.F. Climate models miss most of the coarse dust in the atmosphere. Sci. Adv. 2020, 6, eaaz9507. [Google Scholar] [CrossRef]
- Woodward, S.; Roberts, D.L.; Betts, R.A. A simulation of the effect of climate change- induced desertification on mineral dust aerosol. Geophys. Res. Lett. 2005, 32, 18. [Google Scholar] [CrossRef]
- Mahowald, N.M.; Luo, C. A less dusty future? Geophys. Res. Lett. 2003, 30, 1903. [Google Scholar] [CrossRef]
- Haarig, M.; Ansmann, A.; Engelmann, R.; Baars, H.; Toledano, C.; Torres, B.; Althausen, D.; Radenz, M.; Wandinger, U. First triple-wavelength lidar observations of depolarization and extinction-to-backscatter ratios of Saharan dust. Atmos. Chem. Phys. 2022, 22, 355–369. [Google Scholar] [CrossRef]
- Francis, D.; Fonseca, R.; Nelli, N.; Bozkurt, D.; Picard, G.; Guan, B. Atmospheric rivers drive exceptional Saharan dust transport towards Europe. Atmos. Res. 2022, 266, 105959. [Google Scholar] [CrossRef]
- Meinander, O.; Alvarez Piedehierro, A.; Kouznetsov, R.; Rontu, L.; Welti, A.; Kaakinen, A.; Heikkinen, E.; Laaksonen, A. Saharan dust transported and deposited in Finland on 23 February 2021. In Proceedings of the EGU General Assembly 2022, Vienna, Austria, 23–27 May 2022. EGU22-4818. [Google Scholar] [CrossRef]
- Pappalardo, G. ACTRIS Aerosol, Clouds and Trace Gases Research Infrastructure. EPJ Web Conf. 2018, 176, 9004. [Google Scholar] [CrossRef]
- Pappalardo, G.; Amodeo, A.; Apituley, A.; Cameron, A.; Freudenthaler, V.; Linné, H.; Ansmann, A.; Bösenberg, J.; D’Amico, G.; Mattis, I. EARLINET: Towards an advanced sustainable European aerosol lidar network. Atmos. Meas. Tech. 2014, 7, 2389–2409. [Google Scholar] [CrossRef]
- Baars, H.; Kanitz, T.; Engelmann, R.; Althausen, D.; Heese, B.; Komppula, M.; Preißler, J.; Tesche, M.; Ansmann, A.; Wandinger, U.; et al. An overview of the first decade of PollyNET: An emerging network of automated Raman-polarization lidars for continuous aerosol profiling. Atmos. Chem. Phys. 2016, 16, 5111–5137. [Google Scholar] [CrossRef]
- Holben, B.N.; Eck, T.F.; Slutsker, I.; Tanré, D.; Buis, J.P.; Setzer, A.; Vermote, E.; Reagan, J.A.; Kaufman, Y.J.; Nakajima, Y.; et al. AERONET—A Federated Instrument Network and Data Archive for Aerosol Characterization. Rem. Sens. Environ. 1998, 66, 1–16. [Google Scholar] [CrossRef]
- Engelmann, R.; Kanitz, T.; Baars, H.; Althausen, D.; Skupin, A.; Wandinger, U.; Komppula, M.; Stachlewska, I.S.; Amiridis, V.; Marinou, E.; et al. The automated multiwavelength Raman polarization and water-vapor lidar PollyXT: The next generation. Atmos. Meas. Tech. 2016, 9, 1767–1784. [Google Scholar] [CrossRef]
- D’Amico, G.; Amodeo, A.; Baars, H.; Binietoglou, I.; Freudenthaler, V.; Mattis, I.; Wandinger, U.; Pappalardo, G. EARLINET Single Calculus Chain—Overview on methodology and strategy. Atmos. Meas. Tech. 2015, 8, 4891–4916. [Google Scholar] [CrossRef]
- Mattis, I.; D’Amico, G.; Baars, H.; Amodeo, A.; Madonna, F.; Iarlori, M. EARLINET Single Calculus Chain-technical—Part 2: Calculation of optical products. Atmos. Meas. Tech. 2016, 9, 3009–3029. [Google Scholar] [CrossRef]
- Dubovik, O.; King, M.D. A flexible inversion algorithm for retrieval of aerosol optical properties from Sun and sky radiance measurements. J. Geophys. Res. 2000, 105, 20673–20696. [Google Scholar] [CrossRef]
- Sinyuk, A.; Holben, B.N.; Eck, T.F.; Giles, D.M.; Slutsker, I.; Korkin, S.; Schafer, J.S.; Smirnov, A.; Sorokin, M.; Lyapustin, A. The AERONET Version 3 aerosol retrieval algorithm, associated uncertainties and comparisons to Version 2. Atmos. Meas. Tech. 2020, 13, 3375–3411. [Google Scholar] [CrossRef]
- Vaisala. Vaisala Weather Transmitter WXT520. 2010. Available online: https://www.vaisala.com/sites/default/files/documents/M210906EN-C.pdf (accessed on 25 June 2022).
- Draxler, R.R.; Rolph, G.D. An overview of the HYSPLIT_4 modelling system for trajectories, dispersion and deposition. Aust. Met. Mag. 1998, 47, 295–308. [Google Scholar]
- Stein, A.F.; Draxler, R.R.; Rolph, G.D.; Stunder, B.J.B.; Cohen, M.D.; Ngan, F. NOAA’s HYSPLIT Atmospheric Transport and Dispersion Modeling System. Bull. Am. Meteorol. Soc. 2015, 96, 2059–2077. [Google Scholar]
- Basart, S.; Pérez, C.; Nickovic, S.; Cuevas, E.; Baldasano, J.M. Development and evaluation of the BSC-DREAM8b dust regional model over Northern Africa, the Mediterranean and the Middle East. Tellus B 2012, 64, 1–23. [Google Scholar] [CrossRef]
- Nikovic, S.; Papadopoulos, A.; Kakaliagou, O.; Kallos, G. Model for prediction of dust cycle in the atmosphere. J. Geophys. Res. 2001, 106, 18113–18129. [Google Scholar] [CrossRef]
- Huang, Y.; Adebiyi, A.A.; Formenti, P.; Kok, J.F. Linking the different diameter types of aspherical desert dust indicates that models underestimate coarse dust emission. Geophys. Res. Lett. 2021, 48, e2020GL092054. [Google Scholar]
- D’Amico, G.; Amodeo, A.; Mattis, I.; Freudenthaler, V.; Pappalardo, G. EARLINET Single Calculus Chain-technical—Part 1: Pre-processing of raw lidar data. Atmos. Meas. Tech. 2016, 9, 491–507. [Google Scholar] [CrossRef]
- Ansman, A.; Riebesell, M.; Weitkamp, C. Measurement of the atmospheric aerosol extinction profiles with a Raman lidar. Opt. Lett. 1990, 15, 746–748. [Google Scholar] [CrossRef] [PubMed]
- Wang, S.-H.; Lei, H.-W.; Pani, S.K.; Huang, H.-Y.; Lin, N.-H.; Welton, E.J.; Chang, S.-C.; Wang, Y.-C. Determination of Lidar Ratio for Major Aerosol Types over Western North Pacific Based on Long-Term MPLNET Data. Remote Sens. 2020, 12, 2769–2786. [Google Scholar]
- Freudenthaler, V. About the effects of polarizing optics on lidar sygnals and the Δ90 calibration. Atmos. Meas. Tech. Discuss. 2016, 9, 4181–4255. [Google Scholar] [CrossRef]
- Pawelec, W.; Werski, S. Biuletyn Państwowej Służby Hydrologiczno-Meteorologicznej (PSHM) Luty 2021. IMGW—PIB 2021, Nr 9(198), ISSN 1730-6124. Available online: https://danepubliczne.imgw.pl/data/dane_pomiarowo_obserwacyjne/Biuletyn_PSHM/Biuletyn_PSHM_2021_02_(luty).pdf (accessed on 20 June 2022).
- Kumar, S.; Kumar, S.; Kaskaoutis, D.G.; Singh, R.P.; Singh, R.K.; Mishra, A.K.; Srivastava, M.K.; Singh, A.K. Meteorological, atmospheric and climatic perturbations during major dust storms over Indo-Gangetic Basin. Aeolian Res. 2015, 17, 15–31. [Google Scholar]
- Di Biagio, C.; Formenti, P.; Balkanski, Y.; Caponi, L.; Cazaunau, M.; Pangui, E.; Journet, E.; Nowak, S.; Andreae, M.O.; Kandler, K.; et al. Complex refractive indices and single-scattering albedo of global dust aerosols in the shortwave spectrum and relationship to size and iron content. Atmos. Chem. Phys. 2019, 19, 15503–15531. [Google Scholar] [CrossRef]


| Optical Property | Lidar System PollyXT-Warsaw |
|---|---|
| Raman Backscattering β at 1064 nm | Raman backscatter (000); Usecase: 7; Calibration range: 3.0–12.0 km; Calibration value: 1.00; Error 50%; |
| Raman Backscattering β at 532 nm | Lidar ratio and extinction (002); Usecase: 7; Calibration range: 3.0–12.0 km; Calibration value: 1.00; Error: 50% (<2 km), 100% (>2 km); |
| Raman Backscattering β at 355 nm | Lidar ratio and extinction (002); Usecase: 7; Calibration range: 3.0–12.0 km; Calibration value: 1.00 Error: 50% (<2 km), 100% (>2 km); |
| Extinction α at 532 nm | Lidar ratio and extinction (002); Usecase: 7; Calibration range: 3.0–12.0 km; Calibration value: 1.00; Error: 50% (<2 km), 100% (>2 km) |
| Extinction α at 355 nm | Lidar ratio and extinction (002); Usecase: 7; Calibration range: 3.0–12.0 km; Calibration value: 1.00; Error: 50% (<2 km), 100% (>2 km); |
| Particle depolarization δ at 532 nm | Raman backscatter and linear depolarization ratio (007); Usecase: 0; Calibration range: 1.0–12.0 km; Calibration value: 1.00; Error: 50% |
| Particle depolarization δ at 355 nm | Raman backscatter and linear depolarization ratio (007); Usecase: 0; Calibration range: 1.0–12.0 km; Calibration value: 1.00; Error: 50% |
| Time UTC | β [×10−6 m−1 sr−1] | α [×10−4 m−1] | δ [%] | τ [×10−2] |
|---|---|---|---|---|
| 08:00 | 1.8 ± 0.5 | 0.8 ± 0.2 | 20 ± 4 | 34.23 ± 0.85 |
| 09:00 | 2.1 ± 0.5 | 0.8 ± 0.2 | 19 ± 4 | 32.83 ± 0.46 |
| 10:00 | 1.5 ± 0.3 | 1.0 ± 0.3 | 24 ± 2 | 37.01 ± 3.33 |
| 11:00 | 3.3 ± 0.4 | 1.1 ± 0.1 | 20 ± 3 | 40.57 ± 1.59 |
| 12:00 | 4.4 ± 0.8 | 0.9 ± 0.1 | 18 ± 2 | 40.99 ± 0.69 |
| 13:00 | 2.2 ± 0.3 | 0.9 ± 0.2 | 15 ± 1 | 38.50 ± 0.78 |
| 14:00 | 3.6 ± 0.3 | 1.0 ± 0.4 | 20 ± 2 | 38.27 ± 0.52 |
| Time UTC | 440 nm | 675 nm | 870 nm | 1020 nm | ||||
|---|---|---|---|---|---|---|---|---|
| SSA | n | SSA | n | SSA | n | SSA | n | |
| 22 February 2021 | ||||||||
| 07:35 | 0.89 | 1.39 + 0.015 i | 0.91 | 1.41 + 0.011 i | 0.91 | 1.42 + 0.010 i | 0.90 | 1.42 + 0.009 i |
| 07:52 | 0.90 | 1.38 + 0.016 i | 0.91 | 1.40 + 0.011 i | 0.91 | 1.42 + 0.010 i | 0.90 | 1.43 + 0.009 i |
| 08:52 | 0.89 | 1.38 + 0.016 i | 0.90 | 1.40 + 0.011 i | 0.90 | 1.42 + 0.010 i | 0.89 | 1.45 + 0.010 i |
| 09:52 | 0.89 | 1.44 + 0.016 i | 0.85 | 1.45 + 0.013 i | 0.90 | 1.47 + 0.012 i | 0.89 | 1.49 + 0.012 i |
| 10:52 | 0.80 | 1.41 + 0.037 i | 0.85 | 1.41 + 0.020 i | 0.83 | 1.43 + 0.020 i | 0.83 | 1.44 + 0.018 i |
| 11:52 | 0.82 | 1.33 + 0.024 i | 0.87 | 1.37 + 0.013 i | 0.86 | 1.39 + 0.012 i | 0.86 | 1.41 + 0.012 i |
| 12:52 | 0.85 | 1.43 + 0.025 i | 0.87 | 1.44 + 0.016 i | 0.86 | 1.46 + 0.015 i | 0.85 | 1.48 + 0.015 i |
| 13:52 | 0.92 | 1.49 + 0.010 i | 0.91 | 1.49 + 0.010 i | 0.91 | 1.52 + 0.010 i | 0.90 | 1.54 + 0.009 i |
| 23 February 2021 | ||||||||
| 09:52 | 0.93 | 1.50 + 0.005 i | 0.94 | 1.50 + 0.004 i | 0.94 | 1.50 + 0.005 i | 0.94 | 1.50 + 0.006 i |
| 14:11 | 0.93 | 1.84 + 0.005 i | 0.99 | 1.48 + 0.004 i | 0.99 | 1.48 + 0.005 i | 0.99 | 1.47 + 0.006 i |
| 24 February 2021 | ||||||||
| 11:52 | 0.91 | 1.55 + 0.007 i | 0.95 | 1.57 + 0.003 i | 0.96 | 1.60 + 0.002 i | 0.96 | 1.60 + 0.003 i |
| 14:11 | 0.95 | 1.60 + 0.003 i | 0.99 | 1.60 + 0.004 i | 0.99 | 1.60 + 0.001 i | 0.99 | 1.60 + 0.001 i |
| 25 February 2021 | ||||||||
| 07:27 | 0.93 | 1.48 + 0.004 i | 0.99 | 1.48 + 0.001 i | 0.99 | 1.48 + 0.001 i | 0.99 | 1.47 + 0.001 i |
| 07:52 | 0.95 | 1.50 + 0.003 i | 0.98 | 1.50 + 0.001 i | 0.98 | 1.50 + 0.002 i | 0.98 | 1.49 + 0.001 i |
| 08:52 | 0.93 | 1.50 + 0.005 i | 0.97 | 1.51 + 0.002 i | 0.97 | 1.51 + 0.002 i | 0.99 | 1.50 + 0.001 i |
| 09:52 | 0.95 | 1.48 + 0.001 i | 0.99 | 1.50 + 0.001 i | 0.99 | 1.49 + 0.001 i | 0.98 | 1.48 + 0.001 i |
| 10:52 | 0.90 | 1.46 + 0.001 i | 0.98 | 1.47 + 0.001 i | 0.98 | 1.47 + 0.001 i | 0.99 | 1.46 + 0.001 i |
| 11:52 | 0.92 | 1.47 + 0.001 i | 0.98 | 1.48 + 0.001 i | 0.98 | 1.47 + 0.001 i | 0.99 | 1.46 + 0.001 i |
| 12:52 | 0.93 | 1.48 + 0.001 i | 0.99 | 1.49 + 0.001 i | 0.99 | 1.48 + 0.001 i | 0.99 | 1.47 + 0.001 i |
| 13:52 | 0.93 | 1.48 + 0.001 i | 0.99 | 1.49 + 0.001 i | 0.99 | 1.48 + 0.001 i | 0.99 | 1.47 + 0.001 i |
| 14:16 | 0.93 | 1.47 + 0.001 i | 0.99 | 1.48 + 0.001 i | 0.99 | 1.48 + 0.001 i | 0.99 | 1.47 + 0.001 i |
Publisher’s Note: MDPI stays neutral with regard to jurisdictional claims in published maps and institutional affiliations. |
© 2022 by the authors. Licensee MDPI, Basel, Switzerland. This article is an open access article distributed under the terms and conditions of the Creative Commons Attribution (CC BY) license (https://creativecommons.org/licenses/by/4.0/).
Share and Cite
Szczepanik, D.M.; Ortiz-Amezcua, P.; Heese, B.; D’Amico, G.; Stachlewska, I.S. First Ever Observations of Mineral Dust in Wintertime over Warsaw, Poland. Remote Sens. 2022, 14, 3788. https://doi.org/10.3390/rs14153788
Szczepanik DM, Ortiz-Amezcua P, Heese B, D’Amico G, Stachlewska IS. First Ever Observations of Mineral Dust in Wintertime over Warsaw, Poland. Remote Sensing. 2022; 14(15):3788. https://doi.org/10.3390/rs14153788
Chicago/Turabian StyleSzczepanik, Dominika M., Pablo Ortiz-Amezcua, Birgit Heese, Giuseppe D’Amico, and Iwona S. Stachlewska. 2022. "First Ever Observations of Mineral Dust in Wintertime over Warsaw, Poland" Remote Sensing 14, no. 15: 3788. https://doi.org/10.3390/rs14153788
APA StyleSzczepanik, D. M., Ortiz-Amezcua, P., Heese, B., D’Amico, G., & Stachlewska, I. S. (2022). First Ever Observations of Mineral Dust in Wintertime over Warsaw, Poland. Remote Sensing, 14(15), 3788. https://doi.org/10.3390/rs14153788