Abstract
Distinct absorption peaks, with maxima at around 328 nm and a shoulder at 360 nm, were observed in the UV region of the absorption spectra for both the particulate and dissolved fractions of water samples collected in Keppel Bay (NE Australia) during the presence of sporadic Trichodesmium colonies. The largest absorption coefficients for these peaks were observed in samples collected in the near-surface waters (top 2–3 cm). Values approximately 3.5–6 times greater for aCDOM(328) and 13–36 times greater for ap(328) were observed in the near-surface samples compared to those collected from the top 20 cm of the water column at the same sites. Similar UV-absorption peaks observed in other studies have been attributed to the presence of mycosporine-like amino acids (MAAs). Increased UV absorption can affect both the magnitude of the absorption coefficients in the blue end of the visible region and the spectral slope of the exponential model commonly used to describe the CDOM absorption coefficient. This, in turn, can significantly affect the accuracy of satellite retrieved estimates of ocean colour products related to CDOM and particulate absorption coefficients. In tropical waters where Trichodesmium blooms are prevalent, regional ocean colour algorithms need to be developed using in situ bio-optical measurements from both the UV and visible regions of the spectra.
1. Introduction
In recent years, the depletion of stratospheric ozone, resulting in an increase in UV-A and UV-B radiation to the Earth’s environment, has caused concern on a global scale [1].
The photosynthetic system of phytoplankton can be harmed or inhibited by UV radiation, which will, in turn, affect oceanic carbon production, biogeochemical cycles and Earth’s climate change [2]. Many phytoplankton and other marine organisms have found ways to contend with UV radiation, one of which is to produce UV-absorbing compounds to help protect the plankton/organism. Mycosporine-like amino acids (MAAs) show maximum absorption in the UV region and have been recorded in many species of phytoplankton [3,4,5,6,7] and marine organisms [8,9,10,11,12].
In natural waters, absorption in the UV region is primarily due to chromophoric dissolved organic matter (CDOM), often considered to be dominated by terrestrial-derived organic matter in coastal waters and by local phytoplankton production and/or degradation processes in open-ocean waters. Several studies have observed distinct peaks below 400 nm in the particulate absorption spectra of intact cells either in suspension or on a glass-fibre filter [6,13,14,15,16,17,18] or of solvent extracted cells [5,8,9,19]. Spectrophotometric techniques and High-Performance Liquid Chromatography (HPLC) analysis, used in some studies, have identified these absorption peaks as either individual or combinations of at least two mycosporine-like amino acids [5,10,20]. Laboratory studies have shown that when high densities of zooplankton and phytoplankton, known to contain MAAs, were maintained in culture media or filtered seawater, distinct peaks in the UV were observed in the CDOM spectra of the media [11,16]. Absorption peaks at about 330 nm and 360 nm were also detected in the wash water of a high abundance of Trichodesmium spp. colonies after vortexing to disintegrate the colonies into trichomes and cells without cell breakage [5]. In all these studies, the presence of absorption peaks in the CDOM spectra due to MAAs was observed when cell abundance was much greater than would be found in the natural environment.
The distribution of MAAs is widespread, having been shown to be present in phytoplankton from polar waters [8,13,15] to tropical oligotrophic waters [6,11,21]. If the concentration of MAAs in the phytoplankton and the water column is correlated with UV radiation, as has been suggested [7,11,21,22,23], then a seasonal cycle in the CDOM absorption coefficient in the UV likely occurs in some regions. To date, little is known about the distribution of MAAs in various phytoplankton species in the world’s oceans and their species-specific and seasonal photo-acclimation responses to UV exposure [21].
The first published observation of distinct UV-absorbing compounds, probably MAAs, in the dissolved fraction of a natural sample was a slight shoulder at about 360 nm from a sample collected from La Jolla Bay, California, in February 1996, after a bloom of Lingulodinium polyedra [14]. Since then, other studies have observed UV-absorbing peaks in CDOM spectra in coastal waters off the Iberian Peninsula [17], south-west tropical Pacific Ocean [24], waters of the Santa Barbara Channel, California [18]; and coastal waters off Goa, western India [25].
Variations in CDOM and particulate absorption properties will affect the reliability and accuracy of satellite-based estimates of ocean colour products such as CDOM, chlorophyll-a (chl-a) and primary production. Increases in UV absorption due to the presence of MAAs or other UV-absorbing compounds in the dissolved and particulate fractions can affect both the magnitude of the absorption coefficients at 412 nm and 443 nm (commonly used by ocean colour algorithms for CDOM and chl-a retrievals, respectively) and the spectral slope of the exponential model commonly used to describe the CDOM absorption coefficient. Development of algorithms specific to Trichodesmium spp. bloom detection and abundance estimation have been reported [16,24,26,27,28,29,30], and a comprehensive review of three decades of ocean-colour remote sensing of Trichodesmium spp. in the world’s oceans has been published [31]. A variety of algorithms have been developed using different satellite ocean colour sensors–SeaWiFS imagery was used with both semi-analytical bio-optical models [28] and algorithms based on radiance anomalies [29]. Other algorithms include a binary classification algorithm with MODIS imagery [30] and an algorithm using Maximum Chlorophyll Index (MCI) with MERIS imagery [26] which can be adapted to the newer generation of satellite ocean colour sensors such as Sentinel-2 MSI and Sentinel-3 OLCI as both have similar wavelength band positions as MERIS. The last two algorithms [26,30] have been developed and validated on imagery and samples collected in the Great Barrier Reef region.
During a field survey to characterise the spatial bio-optical and biogeochemical variability in the Fitzroy River Estuary–Keppel Bay region of the Great Barrier Reef (GBR) Lagoon, in September 2003, significant absorption peaks in the UV region of the CDOM and particulate spectra were detected for samples collected from sites where Trichodesmium spp. colonies were visible in the surface waters. For this study, optical satellite imagery from the MERIS ocean colour sensor onboard the Envisat satellite acquired over the region at the time of the field survey was used to confirm the temporal and spatial distributions of Trichodesmium spp. aggregations and thus support field observations during the sampling period. Samples were collected from a number of sites, but the UV-absorbing peaks in the CDOM fraction were only observed at four sites. Three other sites showed slight increases in UV absorption at the same wavelengths as the peaks. In this study, it seems probable that the UV-absorbing peaks were due to MAAs; however, samples were not collected for the analysis of MAAs and hence we cannot be definitive in MAAs identification. Other studies have attributed similar absorption peaks to the presence of MAAs without analytical verification [11,16]. It is, however, important that the presence of UV-absorbing peaks is recorded for this region so that satellite imagery and retrieved estimates, such as CDOM, chl-a and primary production, can be assessed for accuracy. For this paper, the results have been generally confined to only those sites where UV-absorbing peaks were observed.
2. Materials and Methods
A field survey was carried out in the Fitzroy River Estuary–Keppel Bay region within the Great Barrier Reef (GBR) Lagoon in NE Australia (Figure 1) between 5–12 September 2003. Around 60 sites were sampled to determine various optical and biogeochemical parameters, but this manuscript only considers data from sites within Keppel Bay and does not include sites sampled within the Fitzroy River or near the river mouth (Table 1). A more detailed description of the bio-optical study, including a broader description of the Keppel Bay region, has previously been provided [32], and a description of each site is included in the data, accessed through the data link provided at the end of this manuscript.
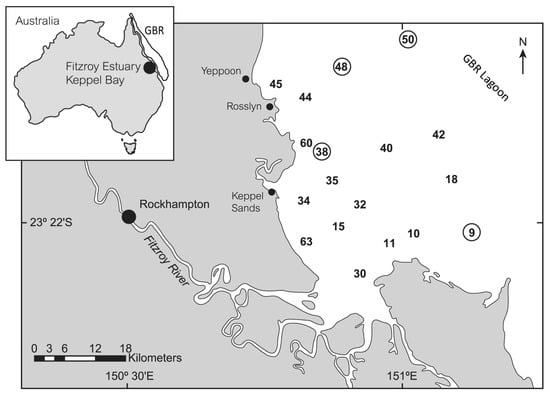
Figure 1.
Map of the Keppel Bay–Fitzroy River Estuary. Numbers indicate sampling sites and circled numbers indicate sites where UV-absorption peaks were present in the CDOM fraction.

Table 1.
Meta data for sites sampled within Keppel Bay. Date and time are in local time (Australian Eastern Standard Time; UTC + 10).
Discrete water samples were collected, at several sites, from the surface waters using a 10 L plastic carboy held approximately 10–20 cm under the surface (nominally referred to as “surface” samples). From this bulk water sample, subsamples were taken for the determination of total suspended matter (TSM) concentration, HPLC pigment concentration and composition, and the absorption coefficient of the particulate and dissolved fractions. At two sites (38 and 48), Trichodesmium cells/colonies were visible in the surface waters. In an attempt to capture these cells/colonies, an additional sample was collected by holding a 2 L plastic bottle within the top 2–3 cm of the surface layer, such that the mouth of the bottle was not fully submerged (nominally referred to as “near-surface” samples) and subsamples were taken for all discrete measurements.
In situ continuous measurements of total absorption and spectral attenuation coefficients were collected along a horizontal transect using an ac-9 (WETLabs, 9 wavelengths, 25 cm path length). The water intake for the ac-9 was about 1 m below the water’s surface, and the water was pumped, using low pressure, through a stainless steel filter mesh (pore size 350 μm) and a debubbling system into the ac-9 tubes at a flow rate of six litres per minute. Samples were collected from the outflow of the ac-9 only at site 9.
2.1. Pigment Analysis
Sample water was filtered through a 47 mm glass-fibre filter (Whatman GF/F) using low vacuum and then stored in liquid nitrogen until analysis. Pigment extracts were analysed using a published method [33] with HPLC (Waters) and photo-diode array detection. The separated pigments were detected at 436 nm and identified against standard spectra using Waters Millenium software. Concentrations of chl-a, chl-b, and β,β-carotene were determined from standards (Sigma), and all other pigment concentrations were determined from standards of purified pigments isolated from algal cultures. A more detailed description of the method can be found in [34].
2.2. Particulate and Detrital Absorption
Sample water was filtered through a 25 mm glass-fibre filter (Whatman GF/F) and then stored flat in liquid nitrogen until analysis. Optical density (OD) spectra for total particulate and detrital matter were obtained using a GBC 916 UV/VIS dual beam spectrophotometer equipped with integrating sphere.
The optical density scans were converted to absorption spectra by first normalising the scans to zero at 730 nm. The particulate absorption coefficient (m−1) was calculated using the equation
where ODf is the optical density of the sample filter (normalised to zero at 730 nm), S is the clearance area of the filter (m2), V the filtered volume of the sample (m3) and β the path length amplification [35]. The method is described in detail in [34]. The phytoplankton absorption coefficient, aph, was computed as the difference between the measured particulate absorption coefficient (ap) and the measured non-algal or detrital absorption coefficient (ad).
2.3. CDOM Absorption
In the field, samples for CDOM analysis were pre-filtered through a glass-fibre filter (GF/F) to reduce particles and the opportunity for CDOM release from phytoplankton cells before analysis in the laboratory. The pre-filtered samples were stored in acid-washed glass bottles and kept cool and dark while transported overnight to a laboratory for analysis. Samples were generally analysed within 24–48 h after collection. At the laboratory, the pre-filtered samples were stored under subdued light until they reached room temperature (3–4 h) and then filtered through a 0.2 μm Durapore filter (25 mm, Millipore) immediately prior to analysis. The CDOM absorbance was measured in a 10 cm path length quartz cell, from 200–900 nm, using the normal cell compartment of the GBC 916 UV/VIS spectrophotometer, with Milli-Q water as a reference. Between sample scans, the reference cell was removed from the spectrophotometer and placed in a room temperature water bath to reduce temperature effects in the scans. The CDOM absorption coefficient (m−1) was calculated using the equation
where A(λ) is the absorbance (normalised to zero at 680 nm), l is the cell path length in meters and factor 2.3 converts Log10 to Loge.
Both the total particulate and the CDOM absorbance scans were smoothed using a running box-car filter with a 10 nm width.
2.4. Remote Sensing
For this study, the MERIS ocean colour sensor onboard the Envisat satellite was used to support field observations of Trichodesmium spp. events prior to, during and after the sampling period.
MERIS reduced resolution (1 km) Level 1b scenes acquired over the region of interest (Figure 1) between 1 September and 2 October 2003 at 1000 h local time (Australian Eastern Standard Time; UTC + 10) were downloaded from the Optical Data processor online archive of the European Space Agency (ODESA) as described in [26]. The Maximum Chlorophyll Index (MCI) [36] was subsequently computed for each MERIS scene. The use of the MERIS MCI has been demonstrated to be suitable for the detection of Trichodesmium spp. surface blooms, specifically in Great Barrier Reef coastal waters [26] and references therein. The MCI is computed using water-leaving radiances at three spectral bands in the near-infrared, namely, 681 nm, 709 nm, and 753 nm, with the 709 band used specifically to detect peaks when surface aggregations are present. This spectral band is specific to MERIS [37] and its successor Sentinel-3 OLCI but is not present in NASA MODIS. For the MERIS images acquired over the period of interest, MCI was computed as described in [26] using water-leaving radiances at these three bands as input for all water pixels. MCI output typically ranges between −3 and ~15 mW−2 sr−1 nm−1, with pixels with positive MCI values indicating the presence of a surface algal bloom expression. The MCI product does not have quality flags. The quality control of each MERIS scene was ensured by computing the MCI for water pixels with Level 1 radiance at 865 nm as <15 mW−2 sr−1 nm−1 [36], which further filtered pixels contaminated by land, high sun glint, haze or thick clouds. A land mask and a reef mask were applied using a 250 m resolution GIS shapefile. For this study, a colour scale ranging between −1 and +1 mW m−2 sr−1 nm−1 for the MCI was adopted, with an associated colour coding from dark blue (clear waters) to orange/red (algal event) for better visualisation of Trichodesmium spp. aggregation events. Pixels that did not satisfy the quality control or that were located on land or reef structures were set to NaN (not a number) and appear black.
3. Results
Satellite remote sensing images (MERIS) are processed specifically to detect and quantify Trichodesmium spp. during the period of the field survey, and it showed an initial surface bloom occurrence on 7 September 2003, north of the Fitzroy River Estuary, extending to the south of the estuary. The Trichodesmium spp. event was still present in the images from 10 and 11 September 2003 and expanded throughout the study area and adjacent waters from 14 September 2003, peaking between 20 and 23 September 2003. The event then appeared to decline from 26 September 2003 (Figure 2). Satellite observations of the bloom event were confirmed by coincident in situ observations collected during the field survey (Table 1).
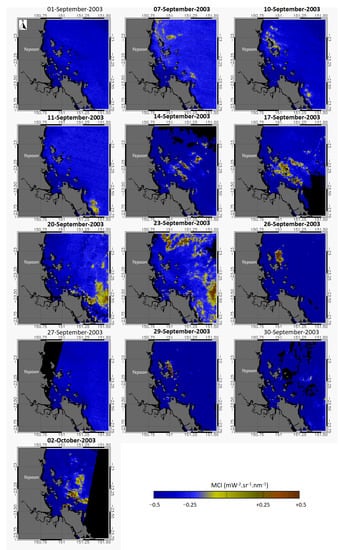
Figure 2.
Time-series of Envisat MERIS reduced resolution scenes processed with the MCI over the region of interest between 1 September and 2 October 2003 showing the development of a surface bloom event. Dates in bold characters indicate the presence of surface bloom expressions detected by the MCI. The colour scale varies from dark blue to red, with warmer colours denoting an increase in algal bloom surface expressions. Masked pixels and missing data are shown in black.
Trichodesmium spp. colonies were visible in the surface waters at several sites. The cells were brown/red in colour, and there was no obvious odour, as is often associated with dying colonies/cells. Without further microscopic analysis, these observations suggest that the Trichodesmium spp. colonies, although sporadic throughout the bay, were in a healthy physiological condition
At seven sites (9, 18, 38, 40, 42, 48, 50) within the bay where Trichodesmium spp. colonies were present, and distinct peaks were observed in the UV region of the absorption spectra for the particulate fraction. Corresponding peaks in the absorption spectra of the dissolved fraction were observed at only four of the seven sites (9, 38, 48, 50). Slight increases in absorption rather than actual peaks were observed in the absorption spectra of the dissolved fraction at the remaining three sites (Figure 3a–m). At 11 other sites in Keppel Bay, peaks of UV-absorbing compounds were not observed in either the particulate or dissolved fractions. The maximum absorption band of these peaks ranged between 325 and 329 nm, with a shoulder at 360 nm. Both surface (S) and near-surface (NS) samples were collected only at sites 38 and 48. At site 38, peaks due to UV-absorbing compounds were present in the particulate absorption spectra for both S and NS samples, but the absorption coefficient at 328 nm for the near-surface sample was 36.4 times greater than that for the surface sample (Figure 3a,b; Table 2). In the dissolved fraction, at site 38, a peak at about 328 nm with a shoulder at 360 nm was only observed in the absorption spectra for the near-surface sample (Figure 3c), and the absorption coefficient at 328 nm for the near-surface sample was 3.63 times greater than that for the surface sample (Table 2).
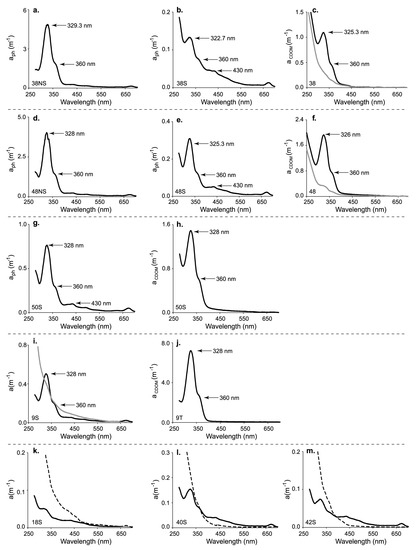
Figure 3.
Spectra of the absorption coefficient for the phytoplankton (aph) and dissolved (aCDOM) fractions in samples collected at sites within Keppel Bay. (a) aph for the near-surface layer (NS) sample at site 38; (b) aph for the surface (S) sample at site 38; (c) aCDOM for the surface sample (grey line) and the near-surface layer sample (black line) at site 38; (d) aph for the near-surface layer (NS) sample at site 48; (e) aph for the surface (S) sample at site 48; (f) aCDOM for the surface sample (grey line) and the near-surface. layer sample (black line) at site 48; (g) aph for the surface (S) sample at site 50; (h) aCDOM for the surface sample at site 50; (i) aph (black line) and aCDOM (dotted grey line) of the surface sample at site 9; (j) aCDOM for the water sample from the outflow of the ac-9 (T) at site 9; (k) aph (black line) and aCDOM (dotted line) of the surface sample at site 18; (l) aph (black line) and aCDOM (dotted line) of the surface sample at site 40; (m) aph (black line) and aCDOM (dotted line) of the surface sample at site 42.
Table 2.
Absorption coefficients (m−1) at 328 nm, 440 nm and 676 nm and the spectral slope (CDOM) for samples from Keppel Bay.
Similar peaks in the particulate absorption spectra for both the near-surface (48NS) and surface (48S) samples were observed at site 48 (Figure 3d,e). Again, the absorption coefficient at 328 nm was greater in the near-surface sample, but at this site only by a factor of 13 (Table 2). In the dissolved fraction, a distinct peak at about 328 nm was observed in the absorption spectra of the near-surface sample (Figure 3f), but unlike site 38, where there were no obvious peaks or even slight increases in the absorption spectra of the surface sample, the absorption coefficient for the dissolved fraction in the near-surface sample was six times greater than that for the surface sample (Table 2).
Only a surface sample was collected at site 50, but unlike sites 38 and 48, a distinct peak around 328 nm with a shoulder at 360 nm was observed both in the dissolved fraction and the particulate fraction of the surface sample (Figure 3g,h).
At site nine, in addition to the collection of a surface sample (9S), a sample was collected from the outflow of the ac-9 (9T), but this later sample was only analysed for absorbance due to CDOM. The same peaks as had been observed at other sites in the particulate absorption spectra were observed at this site. For the dissolved fraction of the surface sample, slight increases in absorption at the same wavelengths were observed (Figure 3i). For the ac-9 outflow sample, the peak at 328 nm in the dissolved fraction had the highest absorption coefficient (7.14 m−1, Figure 3j) for all samples collected during this field survey, with the next highest of 1.91 m−1 (48NS).
At sites located in the outer section of Keppel Bay (18, 40, 42), a peak at about 328 nm was observed in the particulate absorption spectra for the surface samples (Figure 3k–m). A near-surface sample was not collected at these sites. For the dissolved fraction, a small increase or shoulder in absorption at about 360 nm was observed only at sites 40 and 42 (Figure 3k–m).
In the particulate and dissolved fractions where UV-absorbing compounds were present, the absorption at 328 nm was always much greater than the chlorophyll-associated absorption at 440 nm. Ratios of aph(328) to aph(440) for surface samples from all 17 sites sampled ranged from 0.49 to 9.2, with values of 24.97 and 36.91 for the near-surface samples from sites 38 and 48, respectively (Table 2). Where no increase in UV absorption was observed in the surface samples, the ratio ranged from 0.49 to about 1.60. Ratios of aCDOM(328) to aCDOM(440) were more variable (Table 2). In general, the ratio ranged between 4.8 and 7.2 for surface samples where no increase in UV absorption was observed (sites 9, 10, 11, 15, 18, 30, 35, 45, 60, 63). Exceptions were at sites 32, 34 and 44, where the ratios were 23.51, 10.71 and 9.00, respectively. CDOM ratios at sites where there was an observable increase in UV absorption ranged from 12.48 to 34.04 (Table 2). The sample collected at site 9, from the outflow of the ac-9, had a ratio of 160.27.
Pigments that relate specifically to an algal class are termed marker or diagnostic pigments [38,39]; some marker pigments are found exclusively in one algal class (e.g., alloxanthin, which is only found in cryptophytes), while others are the principal pigments of one class but are also found in other classes (e.g., fucoxanthin in diatoms and some haptophytes). The presence or absence of these diagnostic pigments can provide a simplified guide to the composition of a phytoplankton community. Four stations (9, 38, 48, 50) had the highest values of phytoplankton biomass, as indicated by the concentration of chl-a (Figure 4a), and the pigment composition (Figure 4b) indicated the samples to be totally dominated by cyanophytes-Trichodesmium spp. (as indicated by zeaxanthin). In contrast, the phytoplankton assemblage at other stations was a mix of cyanophytes, probably Trichodesmium (zeaxanthin), diatoms (fucoxanthin), haptophytes (hex-fucoxanthin), and at some stations, small amounts of cryptophytes (alloxanthin), prasinophytes (prasinoxanthin) and euglenophytes (chl-b). At sites 38 and 48, the concentration of chl-a was enhanced in the near-surface layer compared to the surface layer by values of 16.8 and 9.2, respectively.
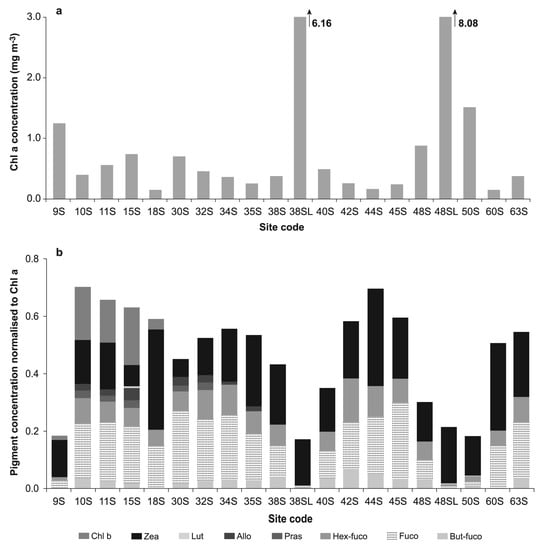
Figure 4.
(a) chl-a concentration for the surface and near-surface layer samples collected at the sites sampled in Keppel Bay; (b) The concentration of marker pigments normalised to chl-a indicating the phytoplankton composition in the surface and near-surface layer samples collected at the sites sampled in Keppel Bay.
4. Discussion
The observation of UV-absorbing peaks in the dissolved and particulate fractions of natural samples in this study was serendipitous rather than the result of a well-designed field study to detect the presence of UV-absorbing compounds. Since this study took place, there have been published observations of high concentrations of UV-absorbing compounds in the micro-layer of surface waters [17,18,40]. All these observations lead to some critical points of discussion about the bio-optical properties of the near-surface layer of tropical and subtropical oceanic and coastal areas. From the observations at sites 38 and 48, it would appear that the UV-absorbing compounds are concentrated in the very near-surface layer. Within several centimetres further depth, they are missing or diluted such that they are often not detectable in the absorption spectra of the dissolved fraction. This would be a plausible explanation for why these peaks are not routinely observed. Sampling in the near-surface layer is not achievable from a large research vessel using traditional (Niskin bottle or bucket) sampling techniques. Other studies that have reported UV-absorbing compounds in the microlayer of oceanic surface waters have used specific microlayer sampling equipment [17,18,40]. The collection depth appears to be a critical factor for the observation of UV-absorbing compounds in the CDOM absorption spectra.
The rare observation of UV-absorption peaks in the CDOM spectra for natural samples has previously been attributed to rapid microbial consumption or bleaching [11]. In this field survey, immediately after collection, the water samples were kept cool and dark until subsampling and filtering took place approximately 3–7 h later in order to reduce or prevent microbial consumption or photochemical processes from taking place. The CDOM samples were pre-filtered through a GF/F filter (~ 0.7 μm pore size), removing large size plankton material but allowing microbial matter to pass through the filter. The samples were then kept cool and dark and transported overnight for analysis, 24–48 h after initial collection. If bacterial consumption of exuded UV-absorbing compounds occurred within this period (from collection to analysis), then either the peaks measured in the CDOM spectra were only a fraction of what they could have been, or microbial consumption is not as rapid or important as it was possibly thought to be. Photodegradation or bleaching of MAAs requires a strong photosensitiser, and natural photosensitisers such as those found in seawater will only photodegrade MAAs under high irradiance conditions and usually occurs over a time span of days [41].
The absorption band of these UV-absorbing peaks ranged between 325 nm and 329 nm with a shoulder at 360 nm, which matched an absorption spectrum of the filtrate of Trichodesmium spp. colonies after disaggregation by vortexing [6]. In that study, absorbance at these wavelengths was attributed to the presence of MAAs and was positively correlated with an increase in sample handling. Although slight increases in absorption were evident in the absorption spectra of the dissolved fraction from intact colonies, it was only after vortexing that actual peaks appeared in the absorption spectra. In this study, all samples, except one (9T, from the ac9 outflow), were collected and treated in the same manner, and so degrees of handling cannot explain the presence of UV-absorbing compounds in the dissolved fraction at only some sites.
The absorption spectra also matched an absorption spectrum of an individual HPLC peak from an extract of the toxic dinoflagellate species–Alexandrium [20]. Further experiments indicated this spectrum to be due to the presence of three MAAs–shinorine, mycosporine-glycine, and palythene in a 1:1:1 molar ratio. Five individual MAAs, including shinorine and mycosporine-glycine, were reported for a Trichodesmium sample collected from Belize [9], and an absorption spectrum, resulting from two MAAs, has previously been reported for a terrestrial cyanobacterium, Nostoc commune [42]. Despite the fact that HPLC analysis for the concentration and composition of MAAs was not carried out in this study, the similarity between the in vivo absorption spectra observed in this study and those reported previously does indicate a high probability that the UV-absorption peaks observed for the Keppel Bay samples are due to MAAs.
During the austral summer months, colonies of Trichodesmium spp. are common within much of the Great Barrier Reef coastal waters, including the Keppel Bay area [26,43,44,45]. Surface blooms of Trichodesmium spp. develop under periods of calm weather and are generally confined to the top few centimetres of the water column [46,47,48]. Our observations, together with those of other studies [18,25,26], agree with the occurrence of Trichodesmium spp. in surface waters during periods of reduced turbulence. The persistence of the microlayer is contingent on low wind speeds <2.6 m s−1 [48,49]. Under such calm conditions, the colonies become trapped in the surface layer. Unable to regulate their buoyancy to overcome the surface tension effects and sink below the surface layer, they die in the surface layer. This suggests that both healthy and dying cells can be in the surface waters, and it is possible that the exuded UV-absorbing compounds can originate from either physiological state. In this study, satellite imagery suggests that the Trichodesmium spp. colonies started to decay from 17 September, leading to senescent cells floating at the surface. This increased the water-leaving radiance signal in the red-near-infrared spectral region (680–750 nm), allowing the large surface event to be captured by MERIS MCI between 20 and 23 September 2003 (Figure 2).
One of the advantages of colonial forming species, such as Trichodesmium spp., is that the individual cells can exude photoprotective compounds, such as MAAs, into the mucilage surrounding the cells to enhance the photoprotection of the colony [13,15,50].
The observations at site 50, however, suggest that UV absorbing compounds can be exuded in the dissolved fraction of samples collected at slightly deeper depths than the very near surface layer. This could be supported by observations at site 9. Trichodesmium spp. colonies were present at about 1 m depth at site 9, but how much of the absorption due to UV-absorbing compounds in the CDOM spectra was due to natural processes or the way in which the sample was collected is questionable. It may have been that at site 50, the Trichodesmium colonies/cells were in a state of buoyancy and either rising or falling through the water column at the time of sampling and were not all in the near-surface layer as was observed at sites 38 and 48. The lack of a near-surface sample from this site does not allow confirmation of this hypothesis. At site 9, the way in which the water was pumped into the ac-9 chamber could have caused cell breakage or if not, possible release of MAAs from the Trichodesmium colonies due to “non-gentle” handling as was observed in a previous study [6]. Cell breakage has been discounted as there was no evidence of phycoerythrin and/or phycocyanin pigment peaks in the visible wavelengths, but a stress-induced release of UV-absorbing compounds from the Trichodesmium colonies is definitely possible and supports the suggestion that UV-absorbing compounds such as MAAs are extracellular [6,13,19,42].
Time of day for sample collection was probably not a reason in itself to explain the presence of Trichodesmium colonies/cells at different depths in the water column, as other stations where Trichodesmium spp. was present were sampled at similar times and depths, and yet there were no distinct peaks due to UV-absorbing compounds, in the CDOM spectra (Table 1). Other studies also found no obvious relationship between UV absorption and factors such as depth in the water column, time of day or species [6,16].
One feature common to the four stations that showed UV- absorption peaks in the CDOM spectra is the phytoplankton community composition (as indicated by the pigment composition). All four stations were dominated by cyanophytes-Trichodesmium spp., while the phytoplankton assemblage at other stations was a mix of several algal groups-cyanophytes, (probably Trichodesmium), diatoms, haptophytes and at some stations, small amounts of cryptophytes, prasinophytes and euglenophytes. At sites 38 and 48, the concentration of chl-a was also enhanced in the near-surface layer compared to the surface layer by values of 16.8 and 9.2, respectively, similar to the observed enhancement in the near-surface layer compared to the surface layer for both dissolved and particulate absorption coefficients. These chl-a concentration enhancements are small compared to those observed in the other studies, where the thickness of the near-surface microlayer sampled was smaller. A value of 63.1 was observed in waters off the Iberian Peninsula during a bloom of Prorocentrum sp. [17]. In the same study, the chl-a concentration measured at one site at 25 cm water depth was only 2% of the concentration measured in the microlayer at the same location. During a dense Trichodesmium spp. bloom in waters off the Hawaiian Islands, a maximum enhancement value of 236 was observed for chl-a [18].
Where no increase in UV absorption was observed in the surface samples, the range for aph(328) to aph(440) (0.49 to about 1.60) and aph(328) to aph(676) (1.41 to 17.4) was similar to ratios recorded for a culture of colonial Phaeocystis antarctica [14] with a range of 1.5 to 3.7 for aph(330) to aph(440) and 4 to 13 for aph(330) to aph(676). The ranges in both studies are unexpectedly similar, given that in the present study, natural samples were used, where the dominant species was a cyanophyte, and in the other, a monospecific culture of a prymnesiophyte was used [15]. However, both Trichodesmium spp. and Phaeocystis antarctica are colonial-forming species that produce MAAs.
The magnitude of the absorption coefficient at 440 nm is not the only parameter affected by an increase in UV absorption. The value of the spectral slope (S), generally determined from an exponential model used to describe CDOM absorption, increased significantly. Without spectral data from the UV region (at least 300 nm), the CDOM “slope” is calculated from a curve that includes the tailing edge of the peak, causing the slope to be extremely steep. Typical values of S have been reported in the literature. A range for S of 0.014–0.019 with a mean value of 0.016 ± 0.002 was reported for results taken from a literature review [51]; S was found to vary from 0.010–0.020 with a mean value of 0.014 ± 0.0032 for a variety of water bodies [52] and in another study, a range for S of 0.0176 ± 0.0039 for several coastal locations around Europe was reported [53]. In Keppel Bay, where an increase in UV-absorption in the CDOM spectra was not observed, S fell within the “typical” ranges reported in the literature (Table 2). At stations where an increase in UV-absorption was observed, S ranged from 0.024–0.044 (Table 2), corresponding to an increase in S of between 70 and 300%.
Previous studies have suggested that decreases in the CDOM absorption coefficient due to photochemical processes are directly correlated to an increase in the CDOM spectral slope [54,55,56]. A study of CDOM dynamics in the Great Barrier Reef (GBR) Lagoon system suggested that the generally high CDOM slope values in GBR waters resulted from photochemical degradation [57]. The results presented in this paper highlight the additional role of UV-absorbing compounds leading to an increase in spectral slope in the dissolved fraction., However, in this scenario, there should be an accompanying increase in the CDOM absorption coefficient at wavelengths in the lower end of the visible range. Provided both spectral slope and aCDOM values are recorded, researchers should be able to determine whether photochemical or photoprotective processes are taking place.
Increasingly, field studies are using in situ spectrophotometers in a profiling mode, such as a WETLabs ac-9 (9 wavelengths) or ac-s (hyperspectral), to measure in situ total absorptions of the water column and with an appropriate filter, the CDOM absorption. These commercially available instruments are limited to the visible range (412–715 nm for the ac-9, 400–730 nm for the ac-s) and thus cannot view any features occurring in the UV range. With these instruments, the CDOM absorption spectrum is often measured at five wavelengths (between 412 nm and 560 nm), and S is calculated from this spectrum. This method cannot distinguish the source of an observed increase in S (photochemical degradation vs. presence of MAAs). The results from this study suggest that some discrete samples should always be collected for the analysis of the absorption coefficient over the full spectrum from 300–800 nm. In addition, future development of instruments such as the ac-9 or ac-s should consider the inclusion of wavelengths in the UV region (between 320–330 nm and possibly another at 360 nm).
The presence of these distinct peaks in the UV region of the CDOM spectra of natural samples has implications for the development of remote sensing algorithms to retrieve in-water products such as absorption coefficients, chl-a (and ultimately primary production), and CDOM concentration. A typically high absorption in both the particulate and dissolved fractions of the near-surface layer will affect ocean reflectance and cause standard ocean colour algorithms to overestimate the true chl-a concentration. For colonial forming species, such as Trichodesmium spp., individual cells experience self-shading, leading to a decrease in the true absorption [6,58] and a possible four-fold underestimation of satellite retrieved chl-a biomass [6]. The presence of UV-absorbing compounds in the dissolved fraction further compounds these problems in retrieving an accurate remotely sensed estimate of chl-a. The regional bio-optical characteristics of blooms and the surrounding water often drive the algorithm, which cannot be easily translated to other regions [28,29]. Comparison of blooms has shown a large variation in the characteristics between blooms, indicating the importance of sampling in a new region to validate algorithms.
5. Conclusions
This study reports the observation of peaks in the UV region in the absorption spectra of dissolved and particulate fractions of near-surface waters during a bloom of Trichodesmium spp. in the Keppel Bay region (GBR lagoon). The presence of these peaks affects the values of the light absorption coefficients as well as CDOM and chl-a concentrations recorded at wavelengths in the visible region of the light spectrum. These, in turn, impact satellite retrieved estimates of these parameters from standard ocean colour algorithms. In tropical and subtropical regions where Trichodesmium spp. blooms are most prevalent, it is important to gather in situ information from the whole light spectrum–UV to near infra-red (200–800 nm) and not just from the visible region (400–700 nm). In addition, sampling in the near-surface layer, top 2–3 cm or less, should be routine. Information from both these sources will improve the development and ultimately the accuracy of regional Trichodesmium spp. specific algorithms which can then be integrated into the new generation of ocean colour sensors, such as Copernicus’ Sentinel-3 OLCI and PACE.
Author Contributions
Conceptualisation, L.A.C. and K.O.; methodology, L.A.C. and K.O.; validation, D.B.-P.; formal analysis, L.A.C., K.O., P.W.F. and D.B.-P.; investigation, L.A.C., K.O., P.W.F. and D.B.-P.; data curation, L.A.C. and K.O.; writing—original draft preparation, L.A.C. and K.O.; writing—review and editing, L.A.C., K.O., P.W.F. and D.B.-P.; visualisation, L.A.C., K.O. and D.B.-P. All authors have read and agreed to the published version of the manuscript.
Funding
Funding for this study was provided by CSIRO Earth Observation Centre, CSIRO Marine Research, CSIRO Land & Water, and The Cooperative Research for Coastal Zone, Estuary and Waterway Management.
Data Availability Statement
The data presented in this study are openly available in Clementson et al. (2022) at https://doi.org/10.25919/1zhm-kr81 (accesssed on 25 May 2022).
Acknowledgments
The authors would like to thank Kirrod Broadhurst, Graham Wassell and Paul Ridett, the skipper and crew of the Rum Rambler; Paul Daniel and Ian Webster (CSIRO–Canberra) for assistance during the field programmes; Lea Crosswell for the figures. Ian Barton for comments on an earlier draft and Mark Baird and Andy Steven for comments on later drafts.
Conflicts of Interest
The authors declare no conflict of interest. The funders had no role in the design of the study; in the collection, analyses, or interpretation of data; in the writing of the manuscript, or in the decision to publish the results.
References
- Barnes, N.R.E.; Robson, P.W.; Robson, T.M.; Neale, P.J.; Williamson, C.E.; Zepp, R.G.; Wilson, S.R.; Madronich, S.; Andrady, A.L.; Heikkilä, A.M.; et al. Environmental effects of stratospheric ozone depletion, UV radiation, and interactions with climate change: UNEP Environmental Effects Assessment Panel, Update 2020. Photochem. Photobiol. Sci. 2021, 20, 1–67. [Google Scholar] [CrossRef]
- Häder, D.-P.; Williamson, C.E.; Wängberg, S.-Å.; Rautio, M.; Rose, K.C.; Gao, K.; Helbling, E.W.; Sinha, R.P.; Worrest, R. Effects of UV radiation on aquatic ecosystems and interactions with other environmental factors. Photochem. Photobiol. Sci. 2015, 14, 108–126. [Google Scholar] [CrossRef]
- Vernet, K.; Whitehead, K. Release of untraviolet-absorbing compounds by the red-tide dinoflagellate Lingulodinium polyedra. Mar. Biol. 1996, 127, 35–44. [Google Scholar] [CrossRef]
- Sinha, R.P.; Klisch, M.; Gröniger, A.; Häder, D.-P. Ultraviolet-absorbing/screening substances in cyanobacteria, phytoplankton and macroalgae. J. Photochem. Photobiol. B Biol. 1998, 47, 83–94. [Google Scholar] [CrossRef]
- Jeffrey, S.W.; MacTavish, H.S.; Dunlap, W.C.; Vesk, M.; Groenewoud, K. Occurrence of UVA- and UVB-absorbing compounds in 152 species (206 strains) of marine microalgae. Mar. Ecol. Prog. Ser. 1999, 189, 35–51. [Google Scholar] [CrossRef]
- Subramaniam, A.; Carpenter, E.J.; Karentz, D.; Falkowski, P.G. Bio-optical properties of the marine diazotrophic cyanobacteria Trichodesmium spp. I. Absorption and photosynthetic action spectra. Limnol. Oceanogr. 1999, 44, 608–617. [Google Scholar] [CrossRef]
- Llewellyn, C.A.; Harbour, D.S. A temporal study of mycosporine-like amino acids in surface water phytoplankton from the English Channel and correlation with solar irradiation. J. Mar. Biol. Ass. UK 2003, 83, 1–9. [Google Scholar] [CrossRef]
- Karentz, D.; McEwan, F.S.; Land, M.C.; Dunlap, W.C. Survey of mycosporine-like amino acids compounds in Antarctic marine organisms: Potential protection from ultraviolet exposure. Mar. Biol. 1991, 108, 157–166. [Google Scholar] [CrossRef]
- Banaszak, A.T.; Lesser, M.P.; Kuffner, I.B.; Ondrusek, M. Relationship between ultraviolet (UV) radiation and mycosporine-like amino acids (MAAS) in marine organisms. Bull. Mar. Sci. 1998, 63, 617–628. [Google Scholar]
- Lamare, M.D.; Lesser, M.P.; Barker, M.F.; Barry, T.M.; Schimanski, K.B. Variation in sunscreen compounds (mycosporine-like amino acids) for marine species along a gradient of ultraviolet radiation transmission within doubtful sound, New Zealand. N. Z. J. Mar. Freshw. Res. 2004, 38, 775–793. [Google Scholar] [CrossRef][Green Version]
- Steinberg, D.K.; Nelson, N.B.; Carlson, C.A.; Prusak, A.C. Production of chromophoric dissolved organic matter (CDOM) in the open ocean by zooplankton and the colonial cyanobacterium Trichodesmium spp. Mar. Ecol. Prog. Ser. 2004, 267, 45–56. [Google Scholar] [CrossRef]
- Yakovleva, I.; Hidaka, M. Diel fluctuations of mycosporine-like amino acids in shallow-water scleractinian corals. Mar. Biol. 2004, 145, 863–873. [Google Scholar] [CrossRef]
- Marchant, H.J.; Davidson, A.T.; Kelly, G.J. UV-B protecting compounds in the marine alga Phaeocystis pouchetii from Antarctica. Mar. Biol. 1991, 109, 391–395. [Google Scholar] [CrossRef]
- Whitenead, K.; Vernet, M. Influence of mycosporine-like aminoacids (MAAs) on UV absorption by particulate and dissolved organic matter in La Jolla Bay. Limnol. Oceanogr. 2000, 45, 1788–1796. [Google Scholar] [CrossRef]
- Moisan, T.A.; Mitchell, B.G. UV absorption by mycosporine-like amino acids in Phaeocystis antarctica Karsten induced by photosynthetically available radiation. Mar. Biol. 2001, 138, 217–227. [Google Scholar] [CrossRef]
- Dupouy, C.; Neveux, J.; Dirberg, G.; Röttgers, R.; Tenório, M.M.B.; Ouillon, S. Bio-optical properties of the marine cyanobacteria Trichodesmium spp. J. App. Rem. Sens. 2008, 2, 023503. [Google Scholar] [CrossRef]
- Tilstone, G.H.; Airs, R.L.; Martinez-Vicente, V.; Widdicombe, C.; Llewellyn, C.A. High concentrations of mycosporine-like amino acids and colored dissolved organic matter in the sea surface microlayer off the Iberian Peninsula. Limnol. Oceanogr. 2010, 55, 1835–1850. [Google Scholar] [CrossRef]
- Stramski, D.; Reynolds, R.A.; Gernez, P.; Röttgers, R.; Wurl, O. Inherent optical properties and particle characteristics of the sea-surface microlayer. Prog. Oceanogr. 2019, 176, 102117. [Google Scholar] [CrossRef]
- Laurion, I.A.; Lami, A.; Sommaruga, R. Distribution of mycosporine-like amino acids and photoprotective carotenoids among freshwater phytoplankton assemblages. Aq. Microb. Ecol. 2002, 26, 283–294. [Google Scholar] [CrossRef]
- Carreto, J.I.; Carignan, M.O. Mycosporine-like amino acids: Relevant secondary metabolites. Chemical and ecological aspects. Mar. Drugs 2011, 9, 387–446. [Google Scholar] [CrossRef]
- Morrison, J.R.; Nelson, N.B. Seasonal cycle of phytoplankton UV absorption at the Bermuda Atlantic Time-series Study (BATS) site. Limnol. Oceanogr. 2004, 49, 215–224. [Google Scholar] [CrossRef]
- Nelson, N.B.; Carlson, C.A.; Steinberg, D.K. Production of chromophoric dissolved organic matter by Sargasso Sea microbes. Mar. Chem. 2004, 89, 273–287. [Google Scholar] [CrossRef]
- Oubelkheir, K.; Clementson, L.A.; Moore, G.F.; Tilstone, G.H. Production of mycosporine-like amino acids by phytoplankton under ultraviolet radiation exposure in the Sub-Antarctic Zone south of Tasmania. Mar. Ecol. Prog. Ser. 2013, 494, 41–63. [Google Scholar] [CrossRef][Green Version]
- Dupouy, C.; Frouin, R.; Tedetti, M.; Maillard, M.; Rodier, M.; Lombard, F.; Guidi, L.; Picheral, M.; Neveux, J.; Duhamel, S.; et al. Diazotrophic Trichodesmium impact on UV-Vis radiance and pigment composition in the western tropical South Pacific. Biogeosciences 2018, 15, 5249–5269. [Google Scholar] [CrossRef]
- Dias, A.; Kurin, S.; Thayapurath, S. Influence of environmental parameters on bio-optical characteristics of colored dissolved organic matter in a complex tropical coastal and estuarine region. Est. Coast. Shelf Sci. 2020, 242, 106864. [Google Scholar] [CrossRef]
- Blondeau-Patissier, D.; Brando, V.E.; Lønborg, C.; Leahy, S.M.; Dekker, A.G. Phenology of Trichodesmium spp. blooms in the Great Barrier Reef lagoon, Australia, from the ESA-MERIS 10 year mission. PLoS ONE 2018, 13, e0208010. [Google Scholar] [CrossRef]
- Subramaniam, A.; Carpenter, E.J.; Falkowski, P.G. Bio-optical properties of the marine diazotrophic cyanobacteria Trichodesmium spp. II. A reflectance model for remote sensing. Limnol. Oceanogr. 1999, 44, 618–627. [Google Scholar] [CrossRef]
- Westberry, T.K.; Siegel, D.A.; Subramaniam, A. An improved bio-optical model for the remote sensing of Trichodesmium spp. blooms. J. Geophys. Res. 2005, 110, C06012. [Google Scholar] [CrossRef]
- Dupouy, C.; Benielli-Gary, D.; Neveux, J.; Dandonneau, Y.; Westberry, T.K. An algorithm for detecting Trichodesmium surface blooms in the South Western tropical Pacific. Biogeosciences 2011, 8, 3631–3647. [Google Scholar] [CrossRef]
- McKinna, L.I.W.; Furnas, M.J.; Ridd, P.V. A simple binary classification algorithm for the detection of Trichodesmium spp. within the Great barrier Reef using MODIS imagery. Limnol. Oceanogr. Methods 2011, 9, 50–66. [Google Scholar] [CrossRef]
- McKinna, L.I.W. Three decades of ocean-color remote-sensing Trichodesmium spp. in the world’s oceans: A review. Prog. Oceanogr. 2015, 131, 177–199. [Google Scholar] [CrossRef]
- Oubelkheir, K.; Clementson, L.A.; Webster, I.T.; Ford, P.W.; Dekker, A.G.; Radke, L.C.; Daniel, P. Using inherent optical properties to investigate biogeochemical dynamics in a tropical macrotidal coastal system. J. Geophys. Res. 2006, 111, C07021. [Google Scholar] [CrossRef]
- Wright, S.W.; Jeffrey, S.W.; Mantoura, R.F.C.; Llewellyn, C.A.; Bjornland, D.; Repeta, D.; Welschmeyer, N. Improved HPLC method for the analysis of chlorophylls and carotenoids from marine phytoplankton. Mar. Ecol. Prog. Ser. 1991, 77, 183–196. [Google Scholar] [CrossRef]
- Clementson, L.A.; Parslow, J.S.; Turnbull, A.R.; McKenzie, D.C.; Rathbone, C.E. Optical properties of waters in the Australasian sector of the Southern Ocean. J. Geophys. Res. 2001, 106, 31611–31625. [Google Scholar] [CrossRef]
- Mitchell, B.G. Algorithms for determining the absorption coefficient for aquatic particulates using the quantitative filter technique. Proc. Ocean Optics X 1990, 1302, 137–148. [Google Scholar]
- Gower, J.; King, S.; Goncalves, P. Global monitoring of plankton blooms using MERIS MCI. Int. J. Remote Sens. 2008, 29, 6209–6216. [Google Scholar] [CrossRef]
- Gower, J.; King, S. On the importance of a band at 709 nm. In Proceedings of the 2nd MERIS-AATSR Workshop, ESRIN, Frascati, Italy, 23 September 2008. [Google Scholar]
- Jeffrey, S.W.; Vesk, M. Introduction to marine phytoplankton and their pigment signatures. In Phytoplankton Pigments in Oceanography: Guidelines to Modern Methods; Jeffrey, S.W., Mantoura, R.F.C., Wright, S.W., Eds.; UNESCO Publishing: Paris, France, 1997; pp. 37–84. [Google Scholar]
- Jeffrey, S.W.; Wright, S.W. Photosynthetic pigments in marine microalgae: Insights from cultures and the sea. In Algal Cultures, Analogues of Blooms and Applications; Subba Rao, D.V., Ed.; Science Publishers: Enfield, NH, USA, 2006; pp. 33–90. [Google Scholar]
- Kuznetsova, M.; Lee, C.; Aller, J.; Frew, N. Enrichment of amino acids in the sea surface microlayer at coastal and open ocean sites in the North Atlantic Ocean. Limnol. Oceanogr. 2004, 49, 1605–1619. [Google Scholar] [CrossRef]
- Whitehead, K.; Hedges, J.I. Photodegradation and photosensitization of mycosporine-like amino acids. J. Photochem. Photobiol. B Biol. 2005, 80, 115–121. [Google Scholar] [CrossRef]
- Böhm, G.A.; Pfleiderer, W.; Böger, P.; Scherer, S. Structure of a novel oligosaccharide-mycosporine-amino acid ultraviolet A/B sunscreen pigment from the terrestrial cyanobacterium Nostoc commune. J. Biol. Chem. 1995, 270, 8536–8539. [Google Scholar] [CrossRef] [PubMed]
- Furnas, M.J. Pelagic Trichodesmium (=Oscillatoria) in the Great Barrier Reef region. In Marine Pelagic Cyanobacteria: Trichodesmium and Other Diazotrophs; Carpenter, E.J., Capone, D.G., Rueter, J.G., Eds.; Kluwer Academic Publishers: Bamberg, Germany, 1992; pp. 265–272. [Google Scholar]
- Jones, G.B. Effect of Trichodesmium blooms on water quality in the Great Barrier Reef Lagoon. In Marine Pelagic Cyanobacteria: Trichodesmium and Other Diazotrophs; Carpenter, E.J., Capone, D.G., Rueter, J.G., Eds.; Kluwer Academic Publishers: Bamberg, Germany, 1992; pp. 273–287. [Google Scholar]
- Bell, P.R.F.; Elemetri, I.; Uwins, P. Nitrogen fixation by Trichodesmium spp. in the Central and Northern Great Barrier Reef Lagoon: Relative importance of the fixed-nitrogen load. Mar. Ecol. Prog. Ser. 1999, 186, 119–126. [Google Scholar] [CrossRef]
- Walsby, A.E. The gas vesicles and buoyancy of Trichodesmium. In Marine Pelagic Cyanobacteria: Trichodesmium and Other Diazotrophs; Carpenter, E.J., Capone, D.G., Rueter, J.G., Eds.; Kluwer Academic Publishers: Bamberg, Germany, 1992; pp. 141–162. [Google Scholar]
- Capone, D.G.; Zehr, J.P.; Paerl, H.W.; Bergman, B.; Carpenter, E.J. Rtichodesmium, a globally significant marine cyanobacterium. Science 1997, 276, 1221–1229. [Google Scholar] [CrossRef]
- Obernosterer, I.; Catala, P.; Lami, R.; Caparros, J.; Ras, J.; Bricaud, A.; Dupuy, C.; van Wambeke, F.; Lebaron, P. Biochemical characteristics and bacterial community structure of the sea surface microlayer in the South Pacific Ocean. Biogeosciences 2008, 5, 693–705. [Google Scholar] [CrossRef]
- Webster, I.T.; Hutchinson, P.A. Effect of wind on the distribution of phytoplankton cells in lakes revisited. Limnol. Oceanogr. 1994, 39, 365–373. [Google Scholar] [CrossRef]
- Riegger, L.; Robinson, D. Photoinduction of UV-absorbing compounds in Antarctic diatoms and Phaeocystis antarctica. Mar. Ecol. Prog. Ser. 1997, 160, 13–25. [Google Scholar] [CrossRef]
- Roesler, C.S.; Perry, M.J.; Carder, K.L. Modeling in situ phytoplankton absorption from total absorption spectra in productive inland marine waters. Limnol. Oceanogr. 1989, 34, 1510–1523. [Google Scholar] [CrossRef]
- Bricaud, A.; Morel, A.; Prieur, L. Absorption by dissolved organic matter of the sea (yellow substance) in the UV and visible domains. Limnol. Oceanogr. 1981, 26, 43–53. [Google Scholar] [CrossRef]
- Babin, M.; Stramski, D.; Ferrari, G.M.; Claustre, H.; Bricaud, A.; Obolensky, G.; Hoepffner, N. Variations in the light absorption coefficients of phytoplankton nonalgal particles and dissolved organic matter in coastal waters around Europe. J. Geophys. Res. 2003, 108, 3211. [Google Scholar] [CrossRef]
- Twardowski, M.S.; Donaghay, P.L. Separating in situ and terrigenous sources of absorption by dissolved materials in coastal waters. J. Geophys. Res. 2001, 106, 2545–2560. [Google Scholar] [CrossRef]
- Del Vecchio, R.; Blough, N.V. Photobleaching of chromophoric dissolved organic matter in natural waters: Kinetics and modelling. Mar. Chem. 2002, 78, 231–253. [Google Scholar] [CrossRef]
- Nelson, N.B.; Siegel, D.A.; Carlson, C.A.; Swan, C.M. Tracing global biogeochemical cycles and meridional overturning circulation using chromophoric dissolved organic matter. Geophys. Res. Lett. 2010, 37, L03610. [Google Scholar] [CrossRef]
- Lønborg, C.; McKinna, L.I.W.; Slivkoff, M.M.; Carreira, C. Coloured dissolved organic matter dynamics in the Great Barrier Reef. Cont. Shelf Res. 2021, 219, 104395. [Google Scholar] [CrossRef]
- Borstad, G.A.; Gower, J.F.R.; Carpenter, E.J. Development of algorithms for remote sensing of Trichodesmium blooms. In Marine Pelagic Cyanobacteria: Trichodesmium and Other Diazotrophs; Carpenter, E.J., Capone, D.G., Rueter, J.G., Eds.; Kluwer Academic Publishers: Bamberg, Germany, 1992; pp. 193–210. [Google Scholar]
Publisher’s Note: MDPI stays neutral with regard to jurisdictional claims in published maps and institutional affiliations. |
© 2022 by the authors. Licensee MDPI, Basel, Switzerland. This article is an open access article distributed under the terms and conditions of the Creative Commons Attribution (CC BY) license (https://creativecommons.org/licenses/by/4.0/).