The Change Pattern and Its Dominant Driving Factors of Wetlands in the Yellow River Delta Based on Sentinel-2 Images
Abstract
:1. Introduction
2. Materials and Methods
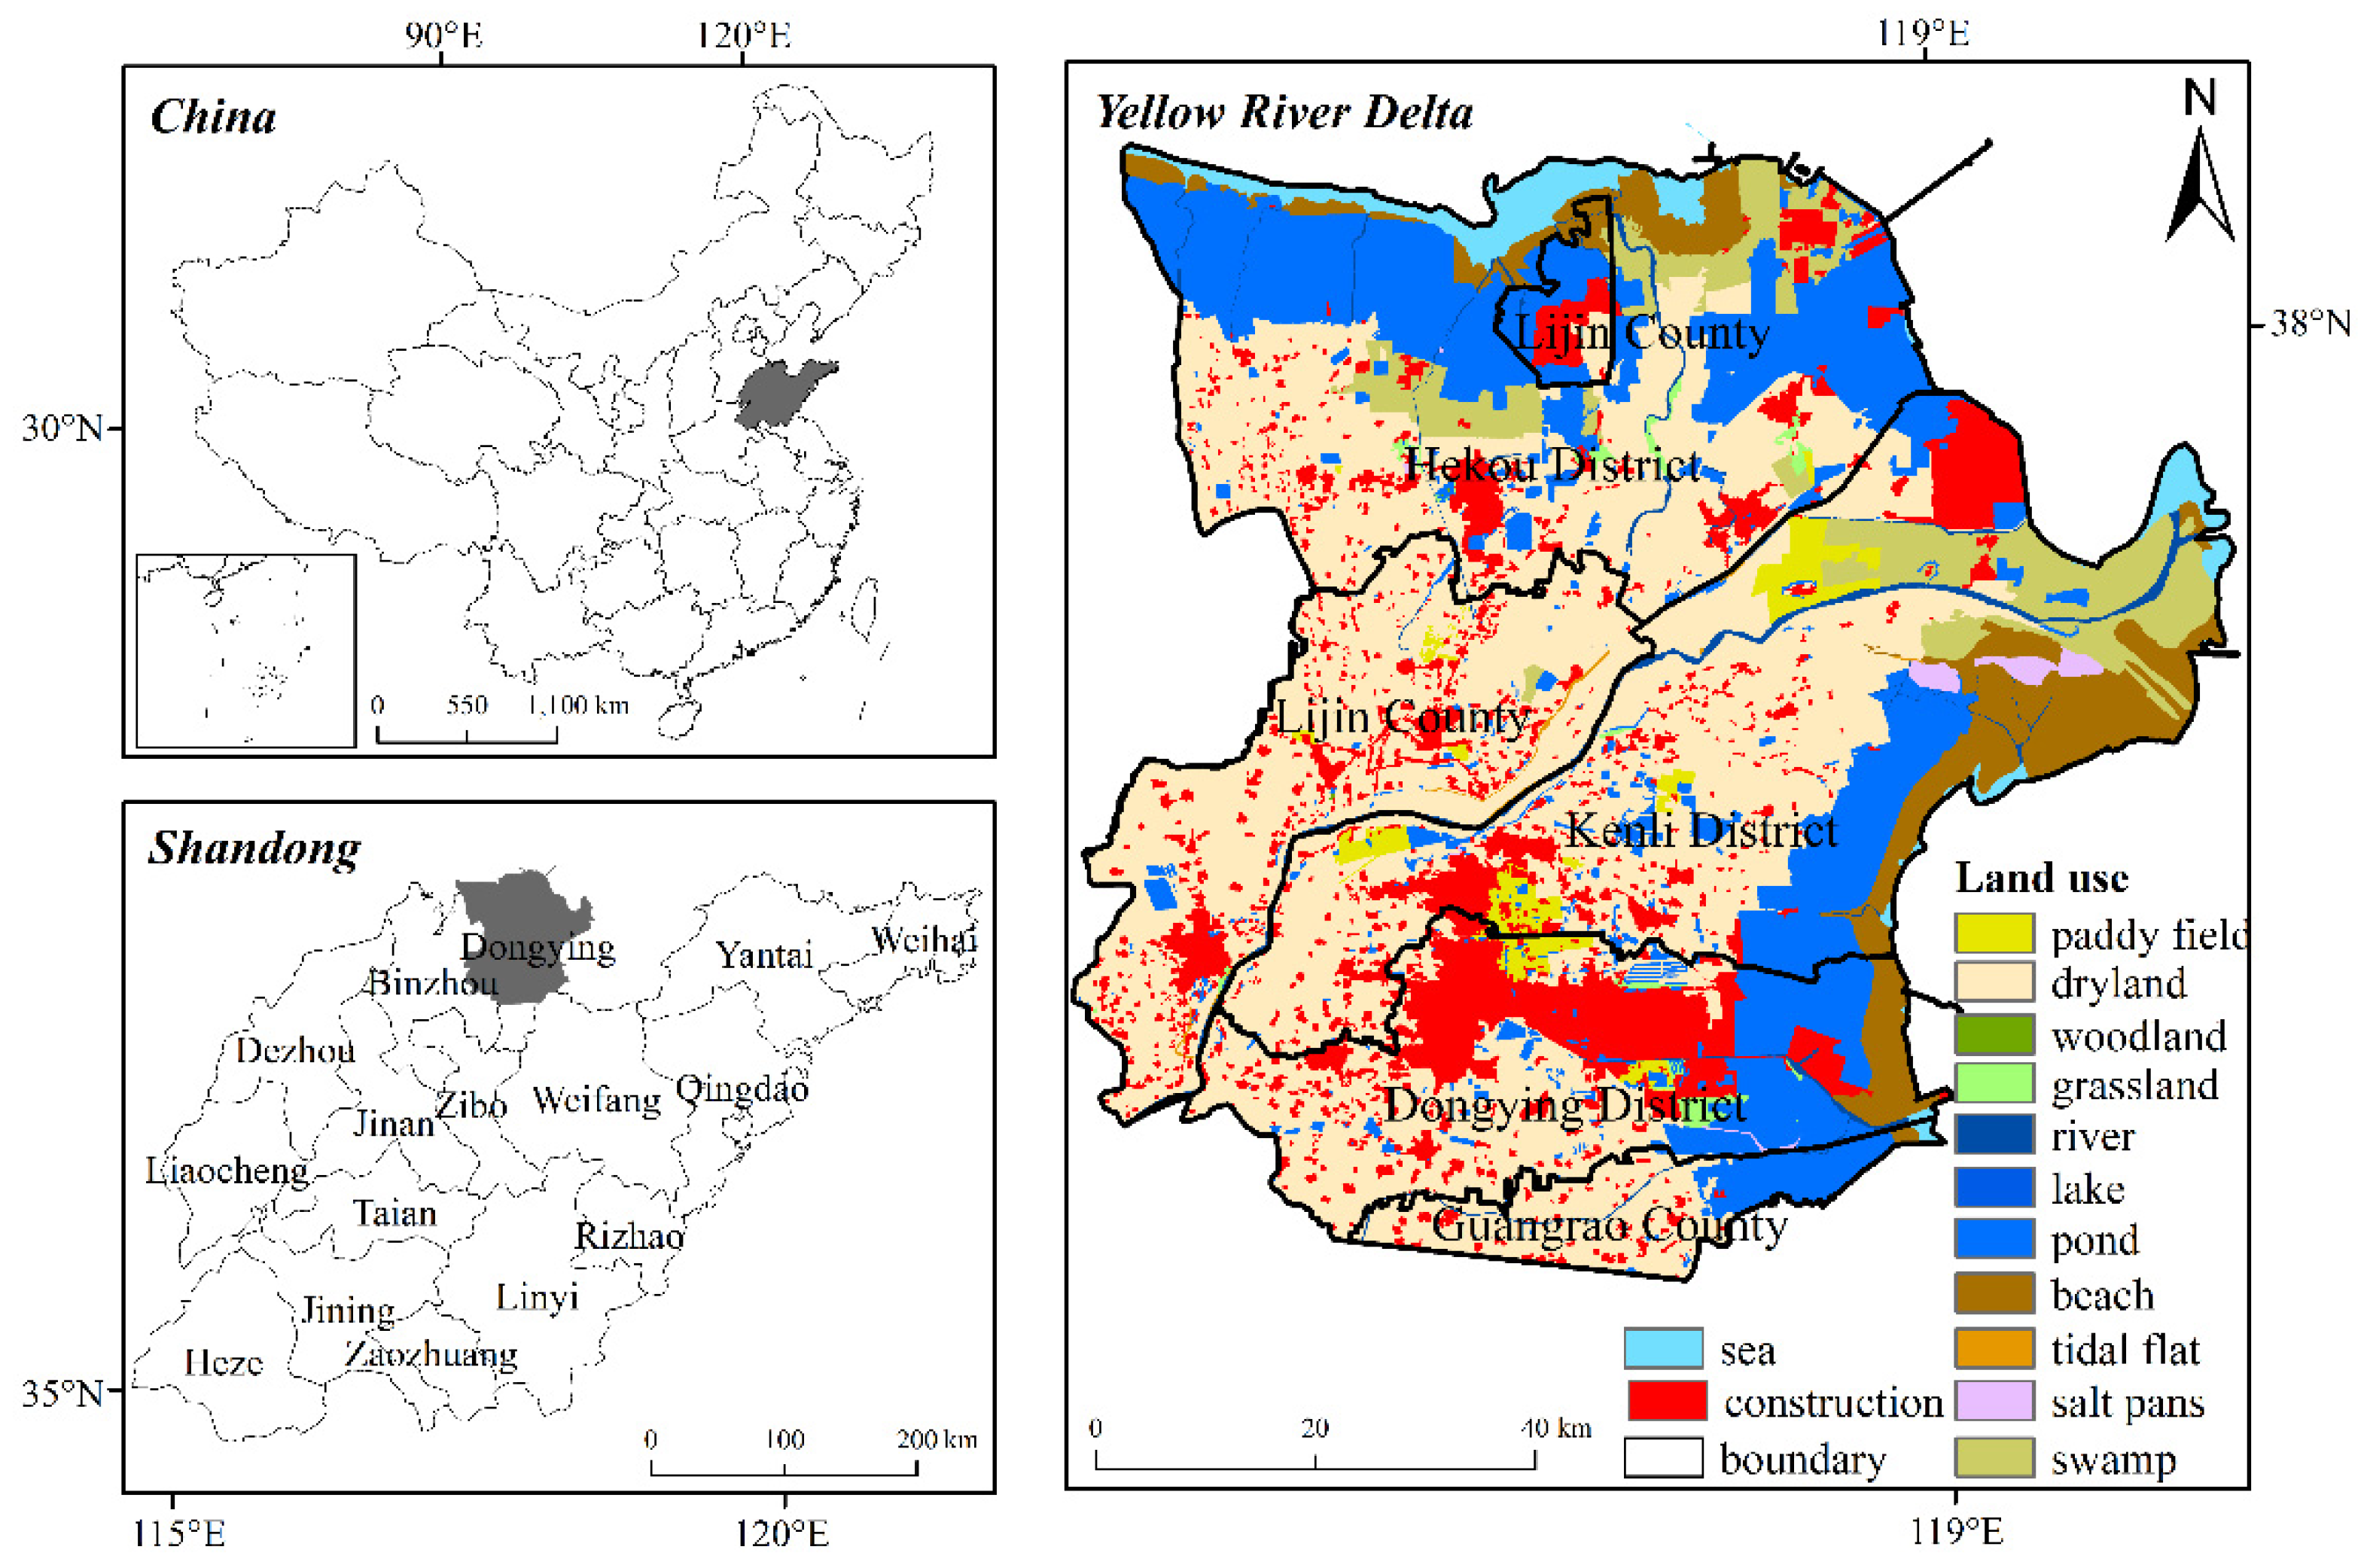
2.1. Study Area
2.2. Data Source and Preprocessing
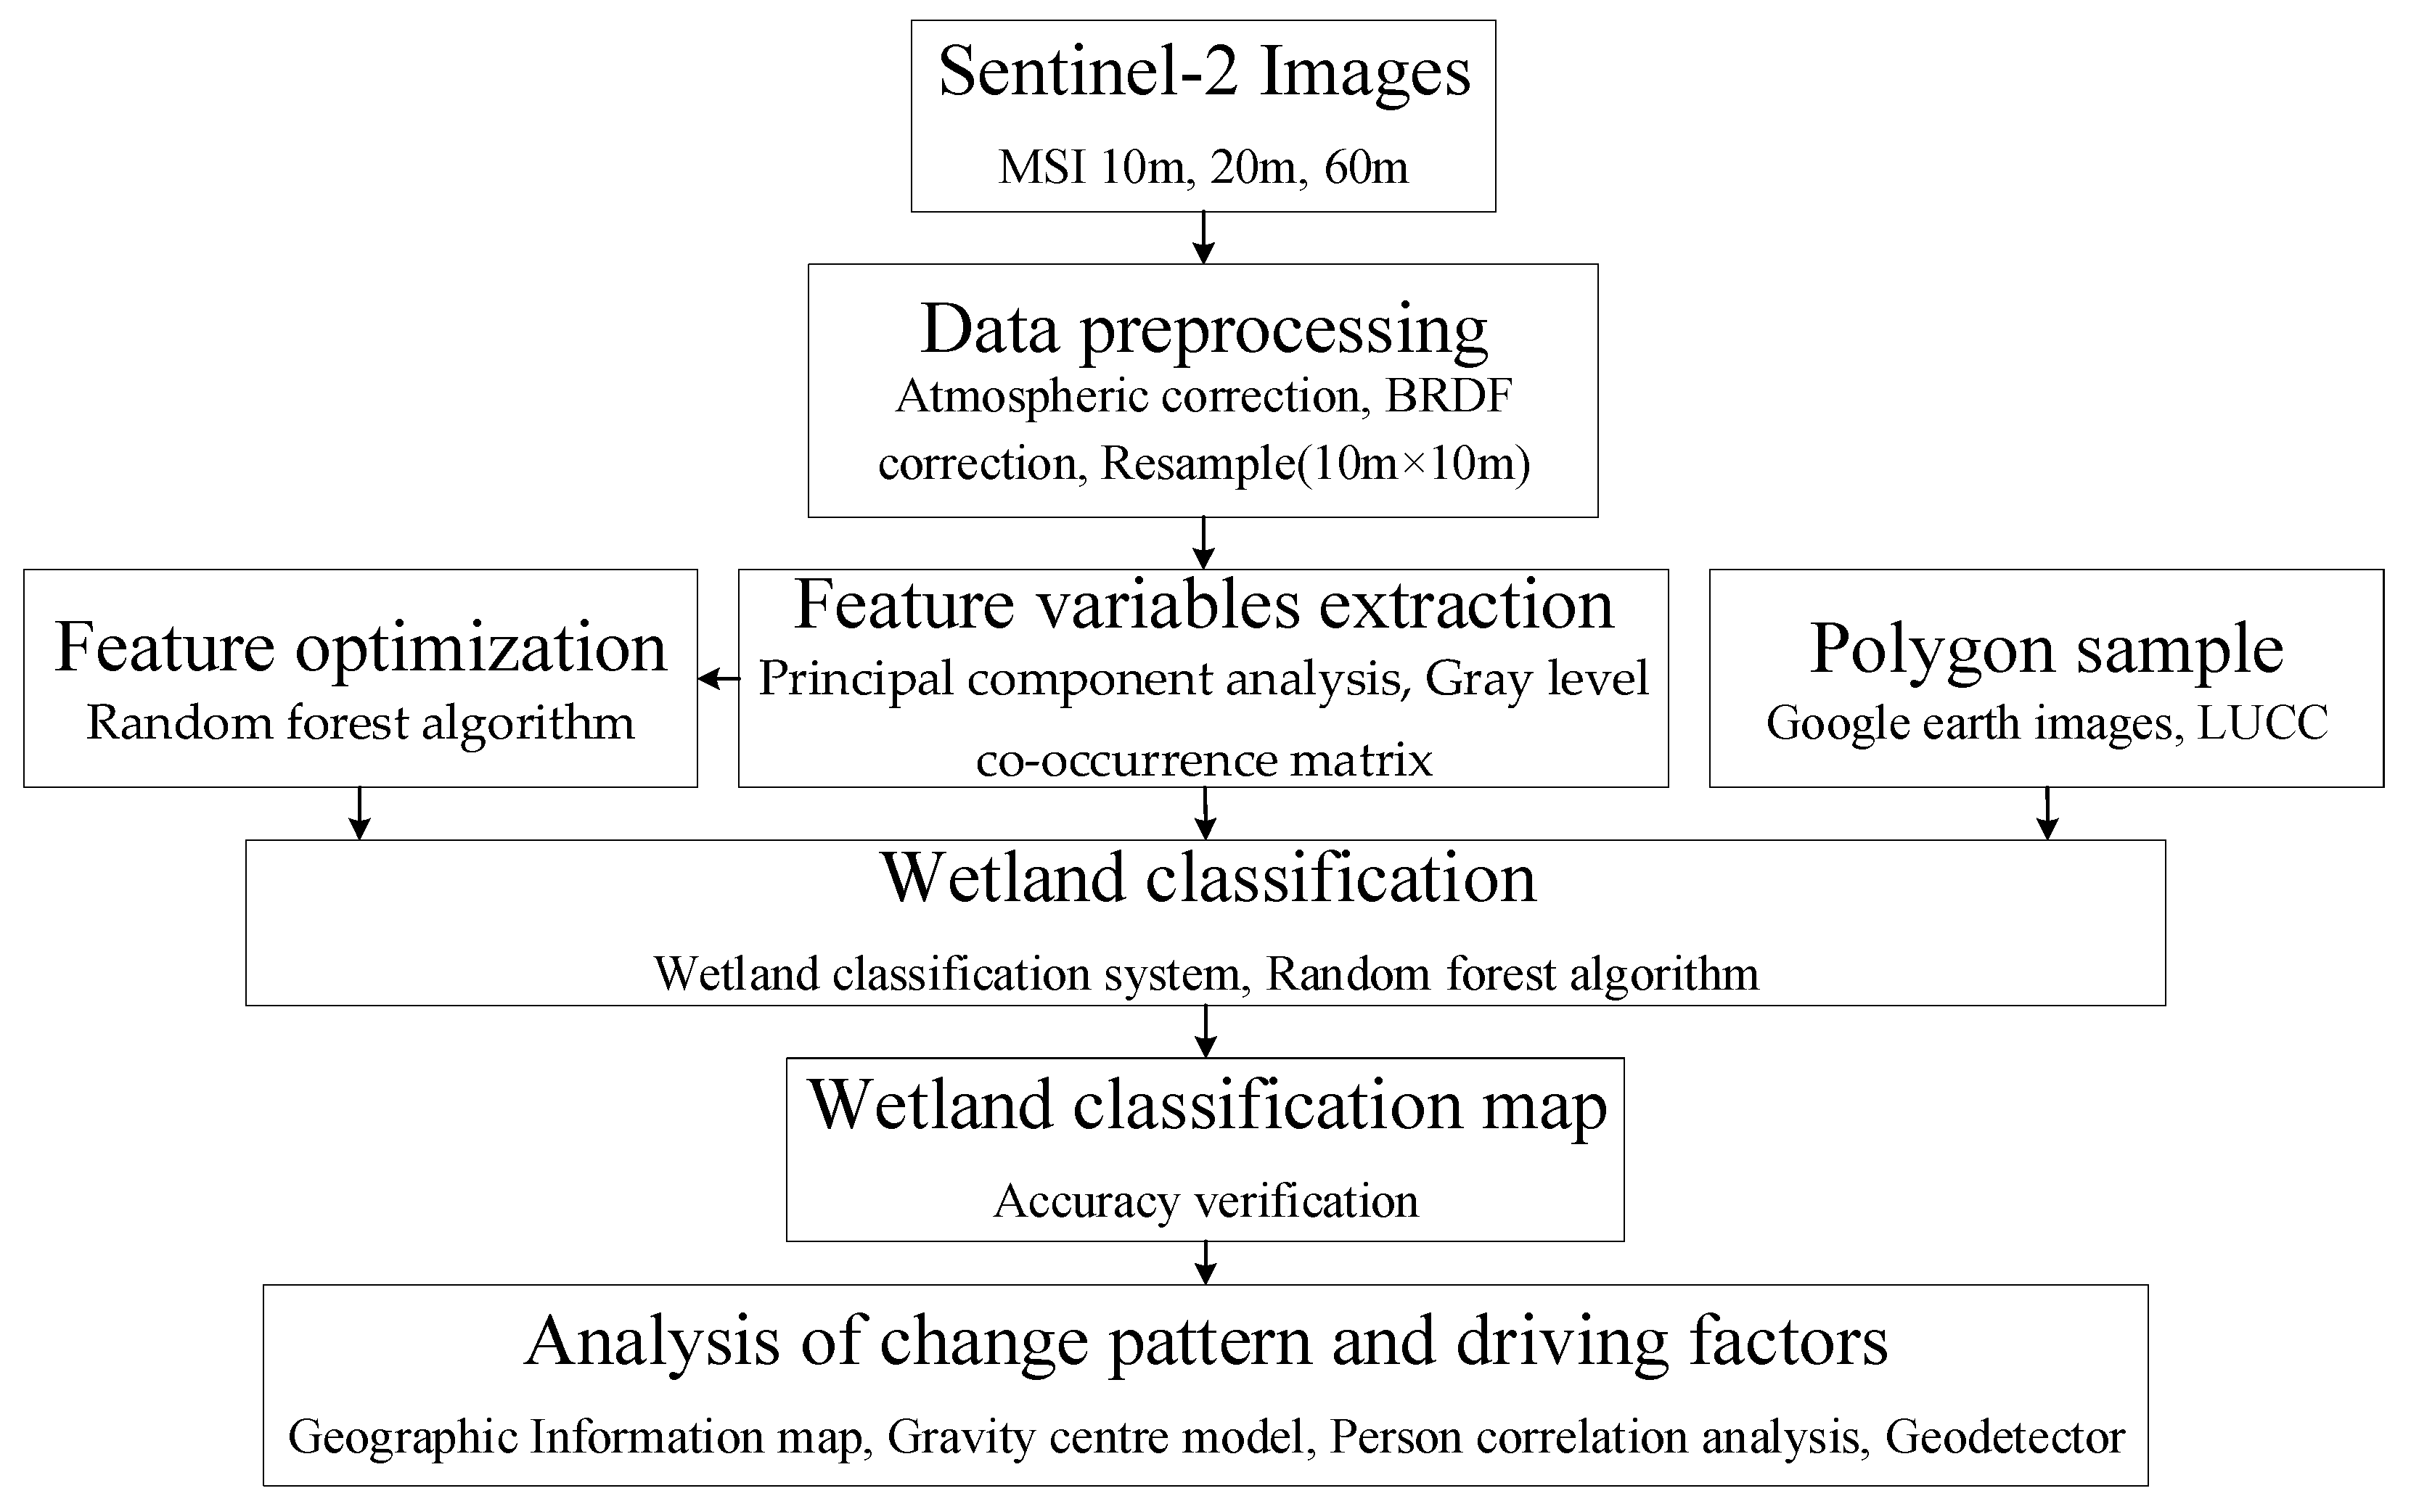
2.3. Methods
2.3.1. Classification System of Wetlands
2.3.2. Description of Feature Variables
| Feature Variable Set | Index Full Name | Index [28,29] | Characteristic Description | Resolution (m) |
|---|---|---|---|---|
| Spectral feature | Band | B | B2, B3, B4, B5, B6, B7, B8, B8A, B11, B12 | 10 |
| Texture feature | ASM | GLCM_ASM | -- | 10 |
| Contrast | GLCM_Con | -- | 10 | |
| Dissimilarity | GLCM_Dis | -- | 10 | |
| Energy | GLCM_Ene | -- | 10 | |
| Entropy | GLCM_Ent | -- | 10 | |
| Homogeneity | GLCM_Hom | -- | 10 | |
| MAX | GLCM_MAX | -- | 10 | |
| GLCM_Correlation | GLCM_Cor | -- | 10 | |
| GLCM_Mean | GLCM_Mean | -- | 10 | |
| GLCM_Variance | GLCM_Var | -- | 10 | |
| Vegetation index | Normalized Difference Vegetation Index | NDVI | 10 | |
| Ratio Vegetation Index | RVI | 10 | ||
| Difference Vegetation Index | DVI | 10 | ||
| Modified Soil Adjusted Vegetation Index | MSAVI | 10 | ||
| Soil Adjusted Vegetation Index | SAVI | 10 | ||
| Water index | Normalized Difference Water Index | NDWI | 10 | |
| Modified Normalized Difference Water Index | MNDWI | 10 | ||
| Red-edge index | Red-edge Normalized Difference Vegetation Index | RNDVI | 10 | |
| Chlorophyll Index red-edge | CIre | 10 | ||
| Modified Simple Ratio Index red-edge | MSRre | 10 | ||
| Normalized Difference Vegetation Index red-edge1 | NDVIre1 | 10 | ||
| Normalized Difference Vegetation Index red-edge2 | NDVIre2 | 10 | ||
| Normalized Difference Vegetation Index red-edge3 | NDVIre3 | 10 | ||
| Normalized Difference red-edge1 | NDre1 | 10 | ||
| Normalized Difference red-edge2 | NDre2 | 10 |
2.3.3. Texture Information Extraction
2.3.4. Random Forest Algorithm
2.3.5. Confusion Matrix
3. Results
3.1. Wetland Information Extraction and Classification
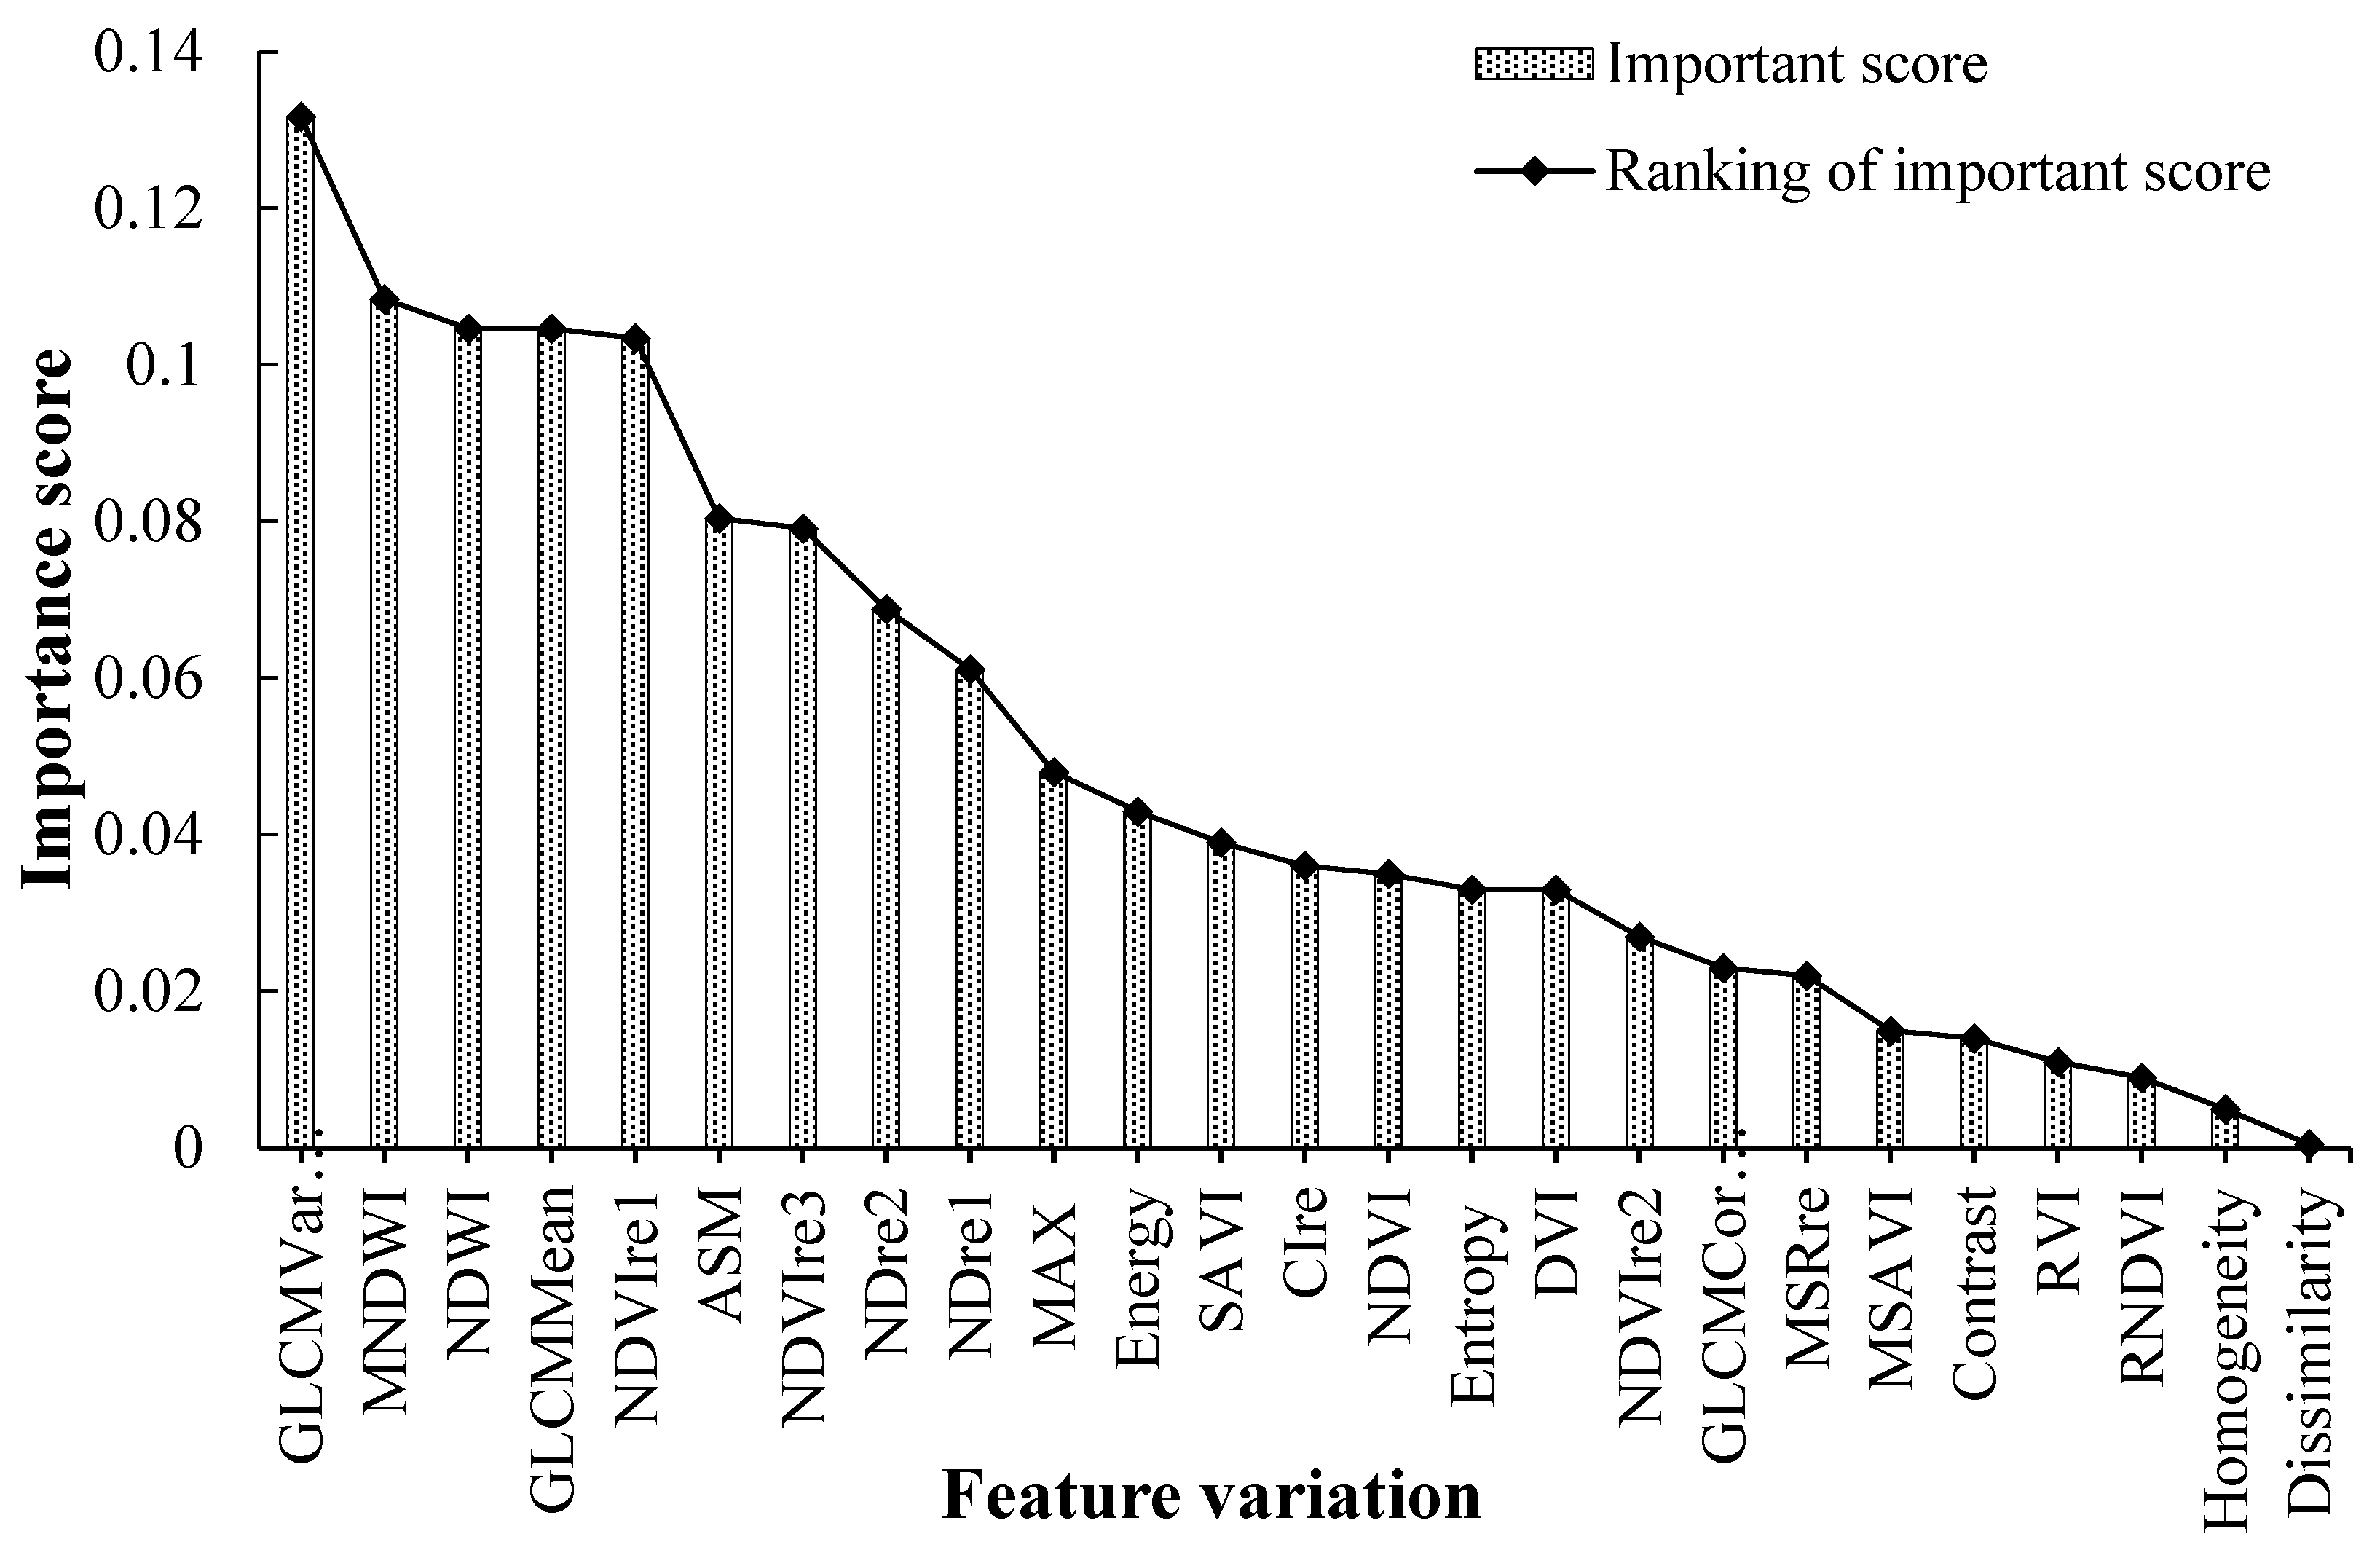
3.1.1. Feature Optimization
3.1.2. Construction of the Classification Scheme
3.1.3. Accuracy Evaluation Analysis
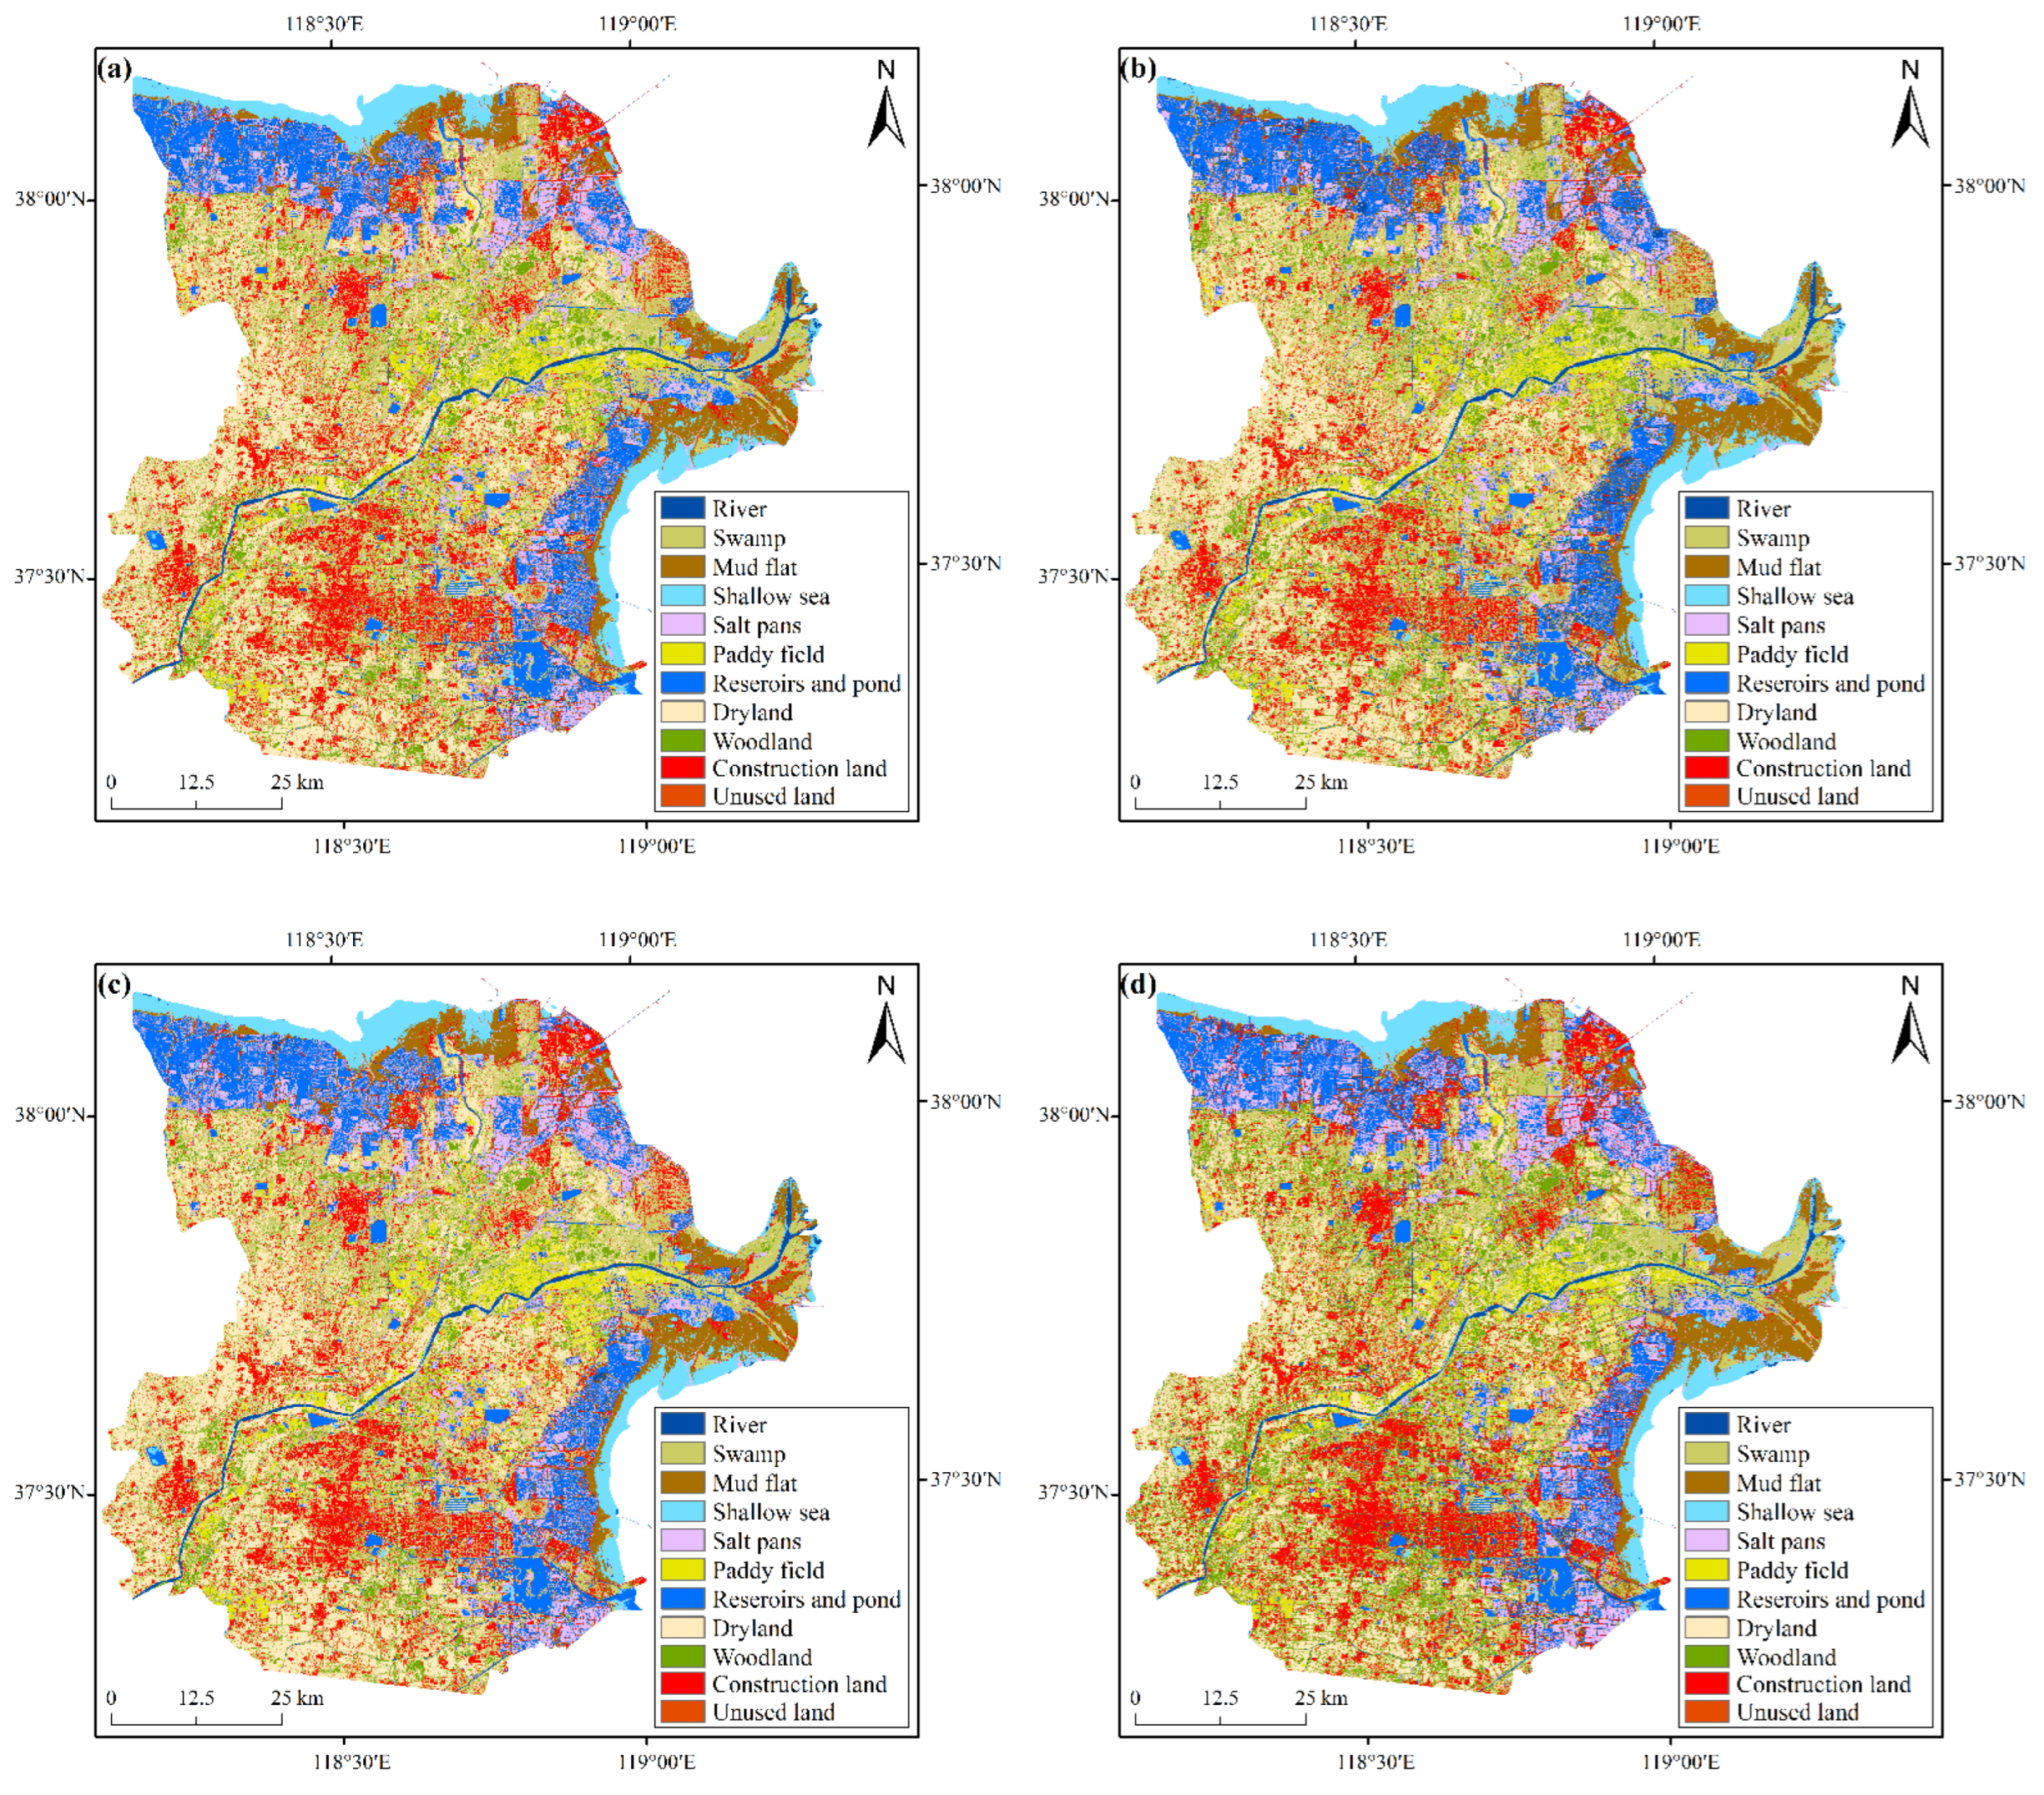
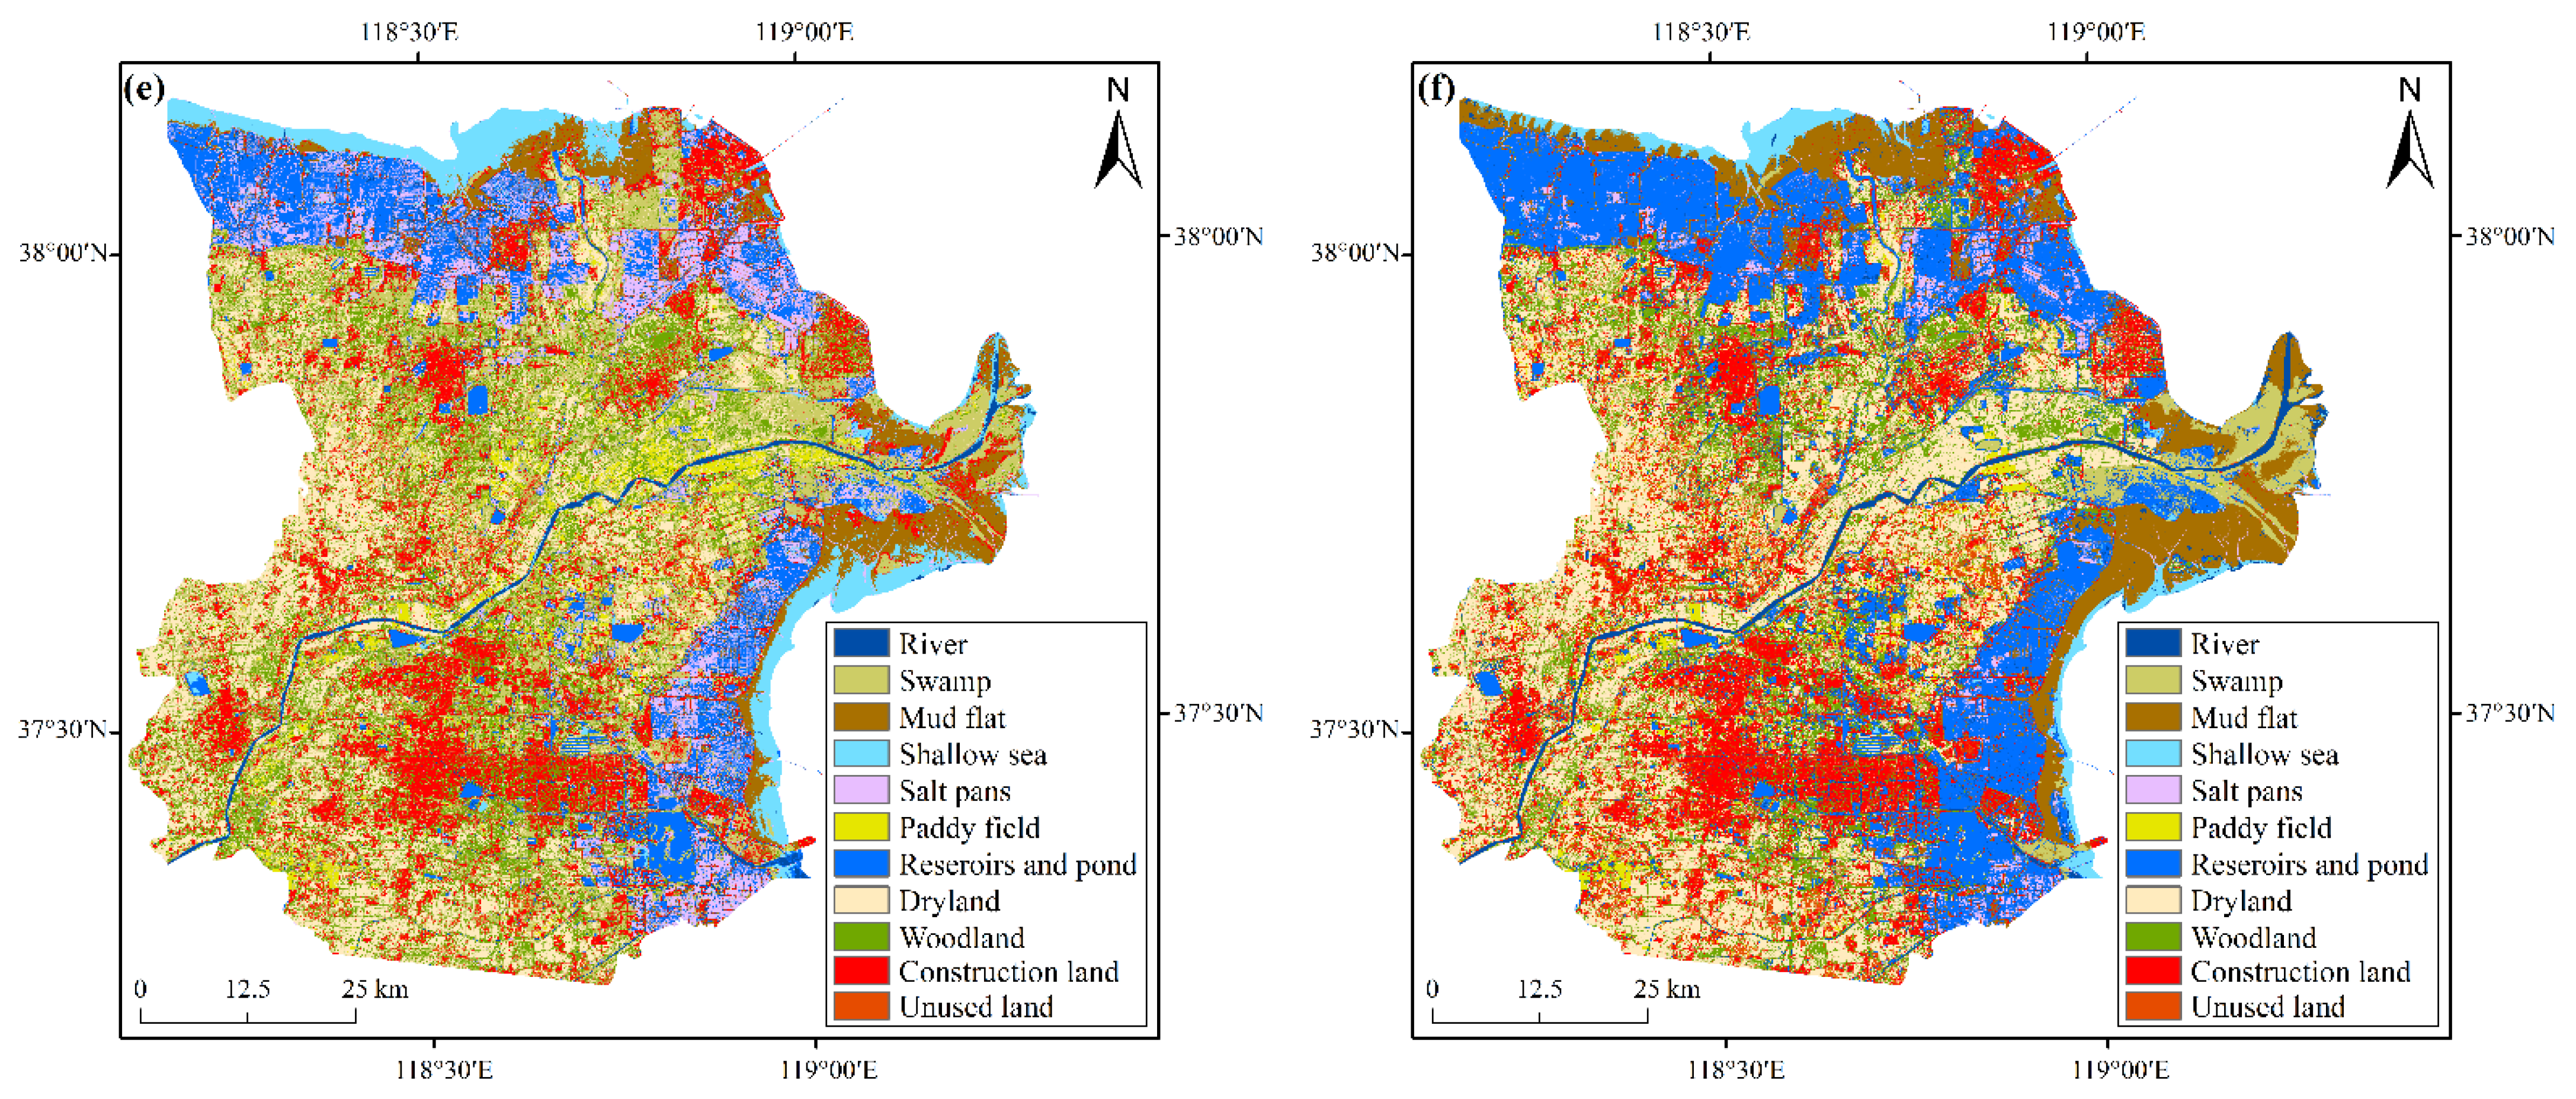
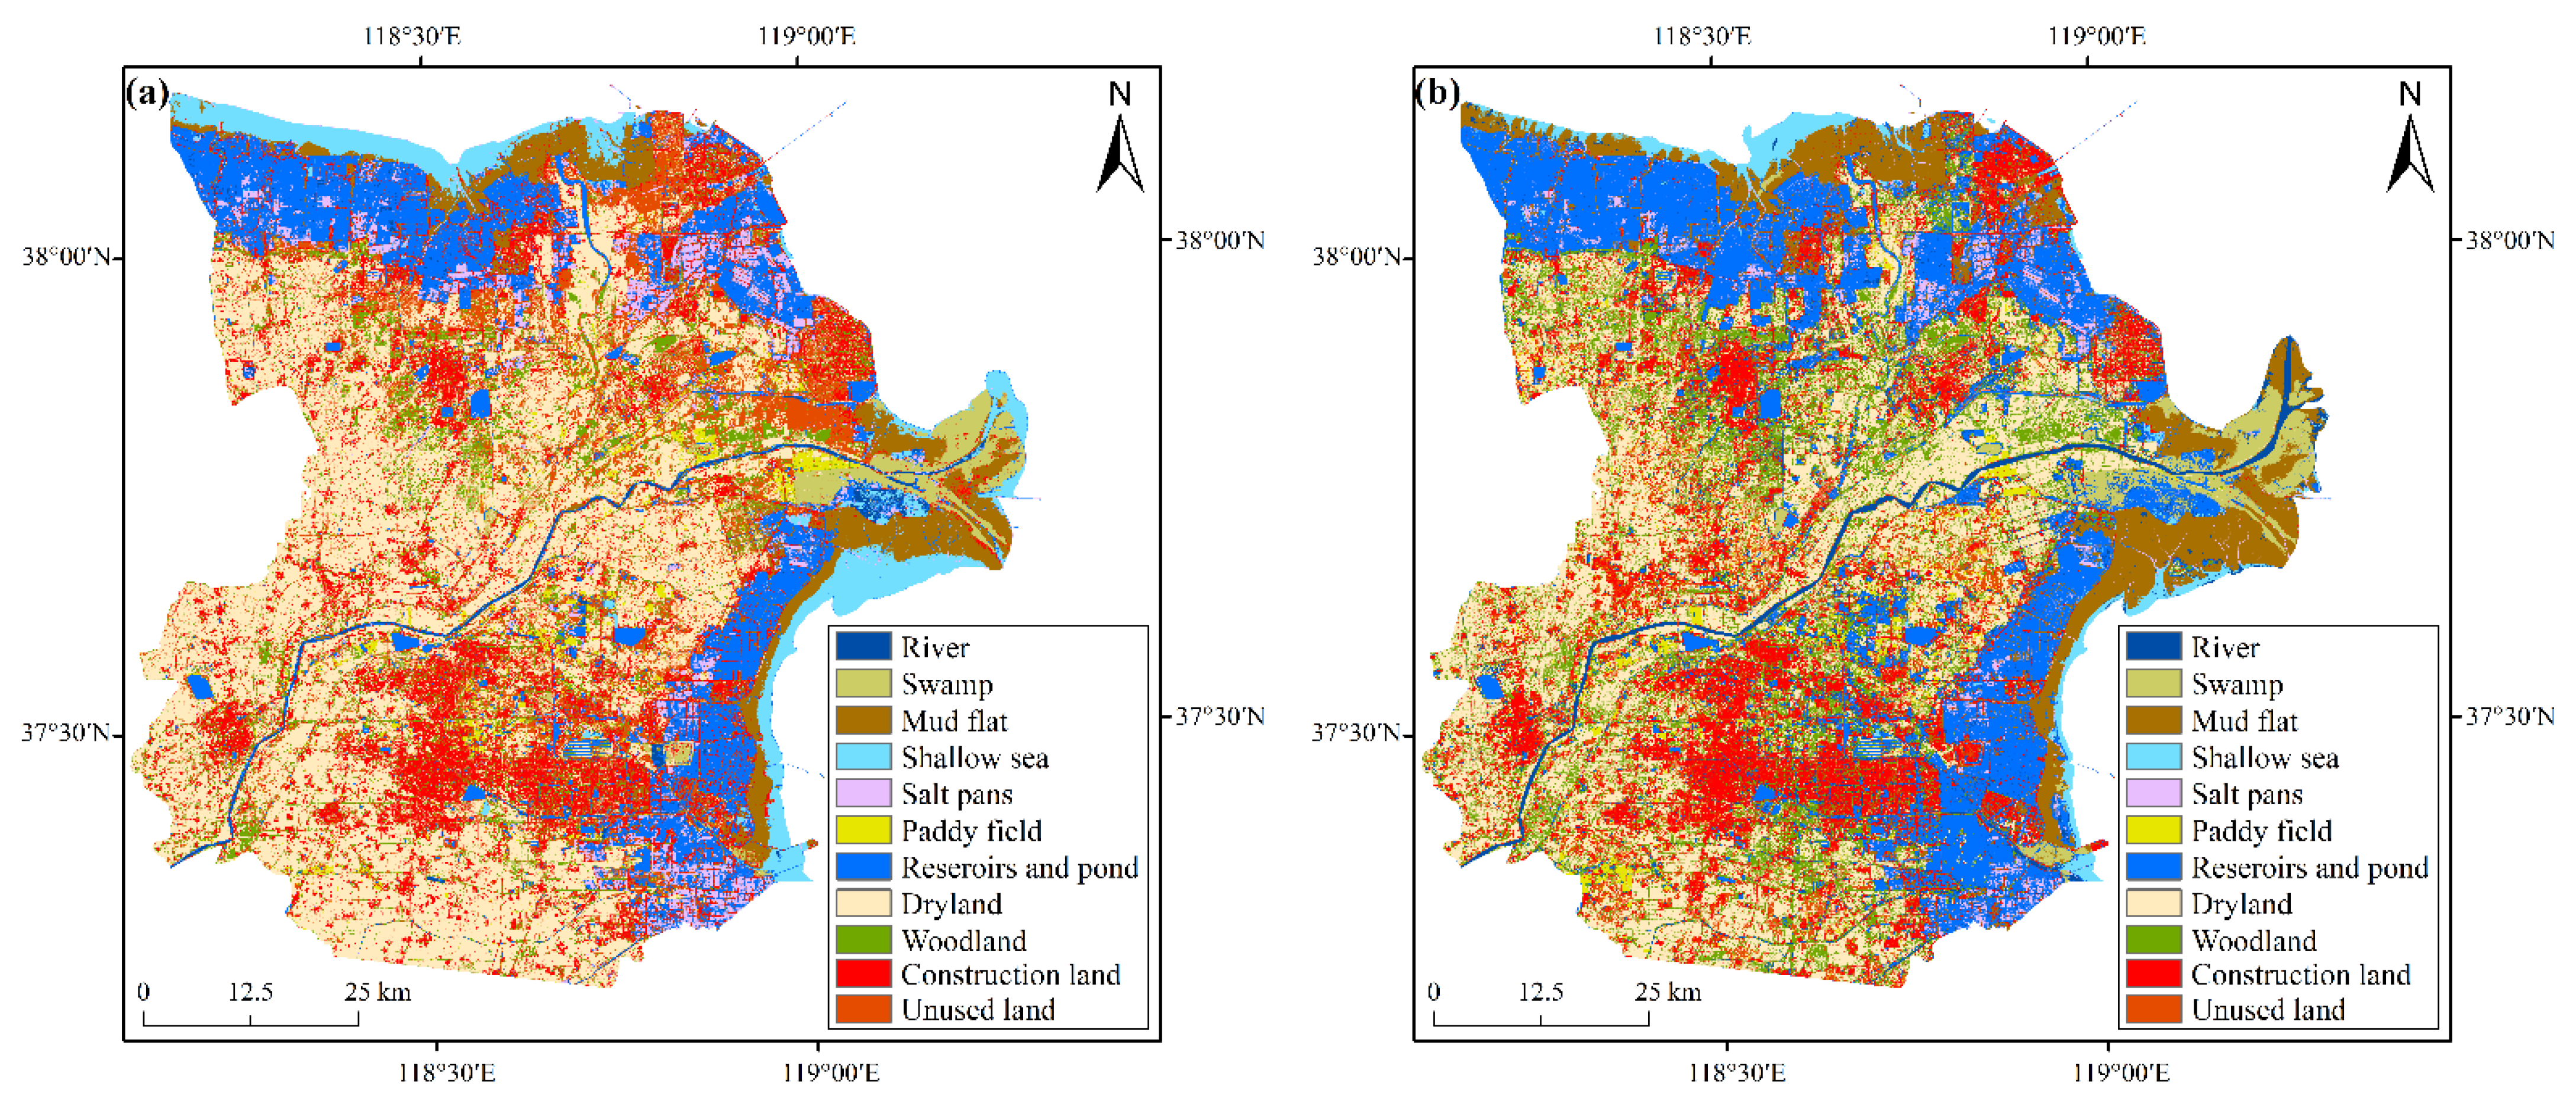
3.1.4. Wetland Information Extraction and Classification Results
3.2. Change Patterns of Wetland during 2015–2021 in YRD
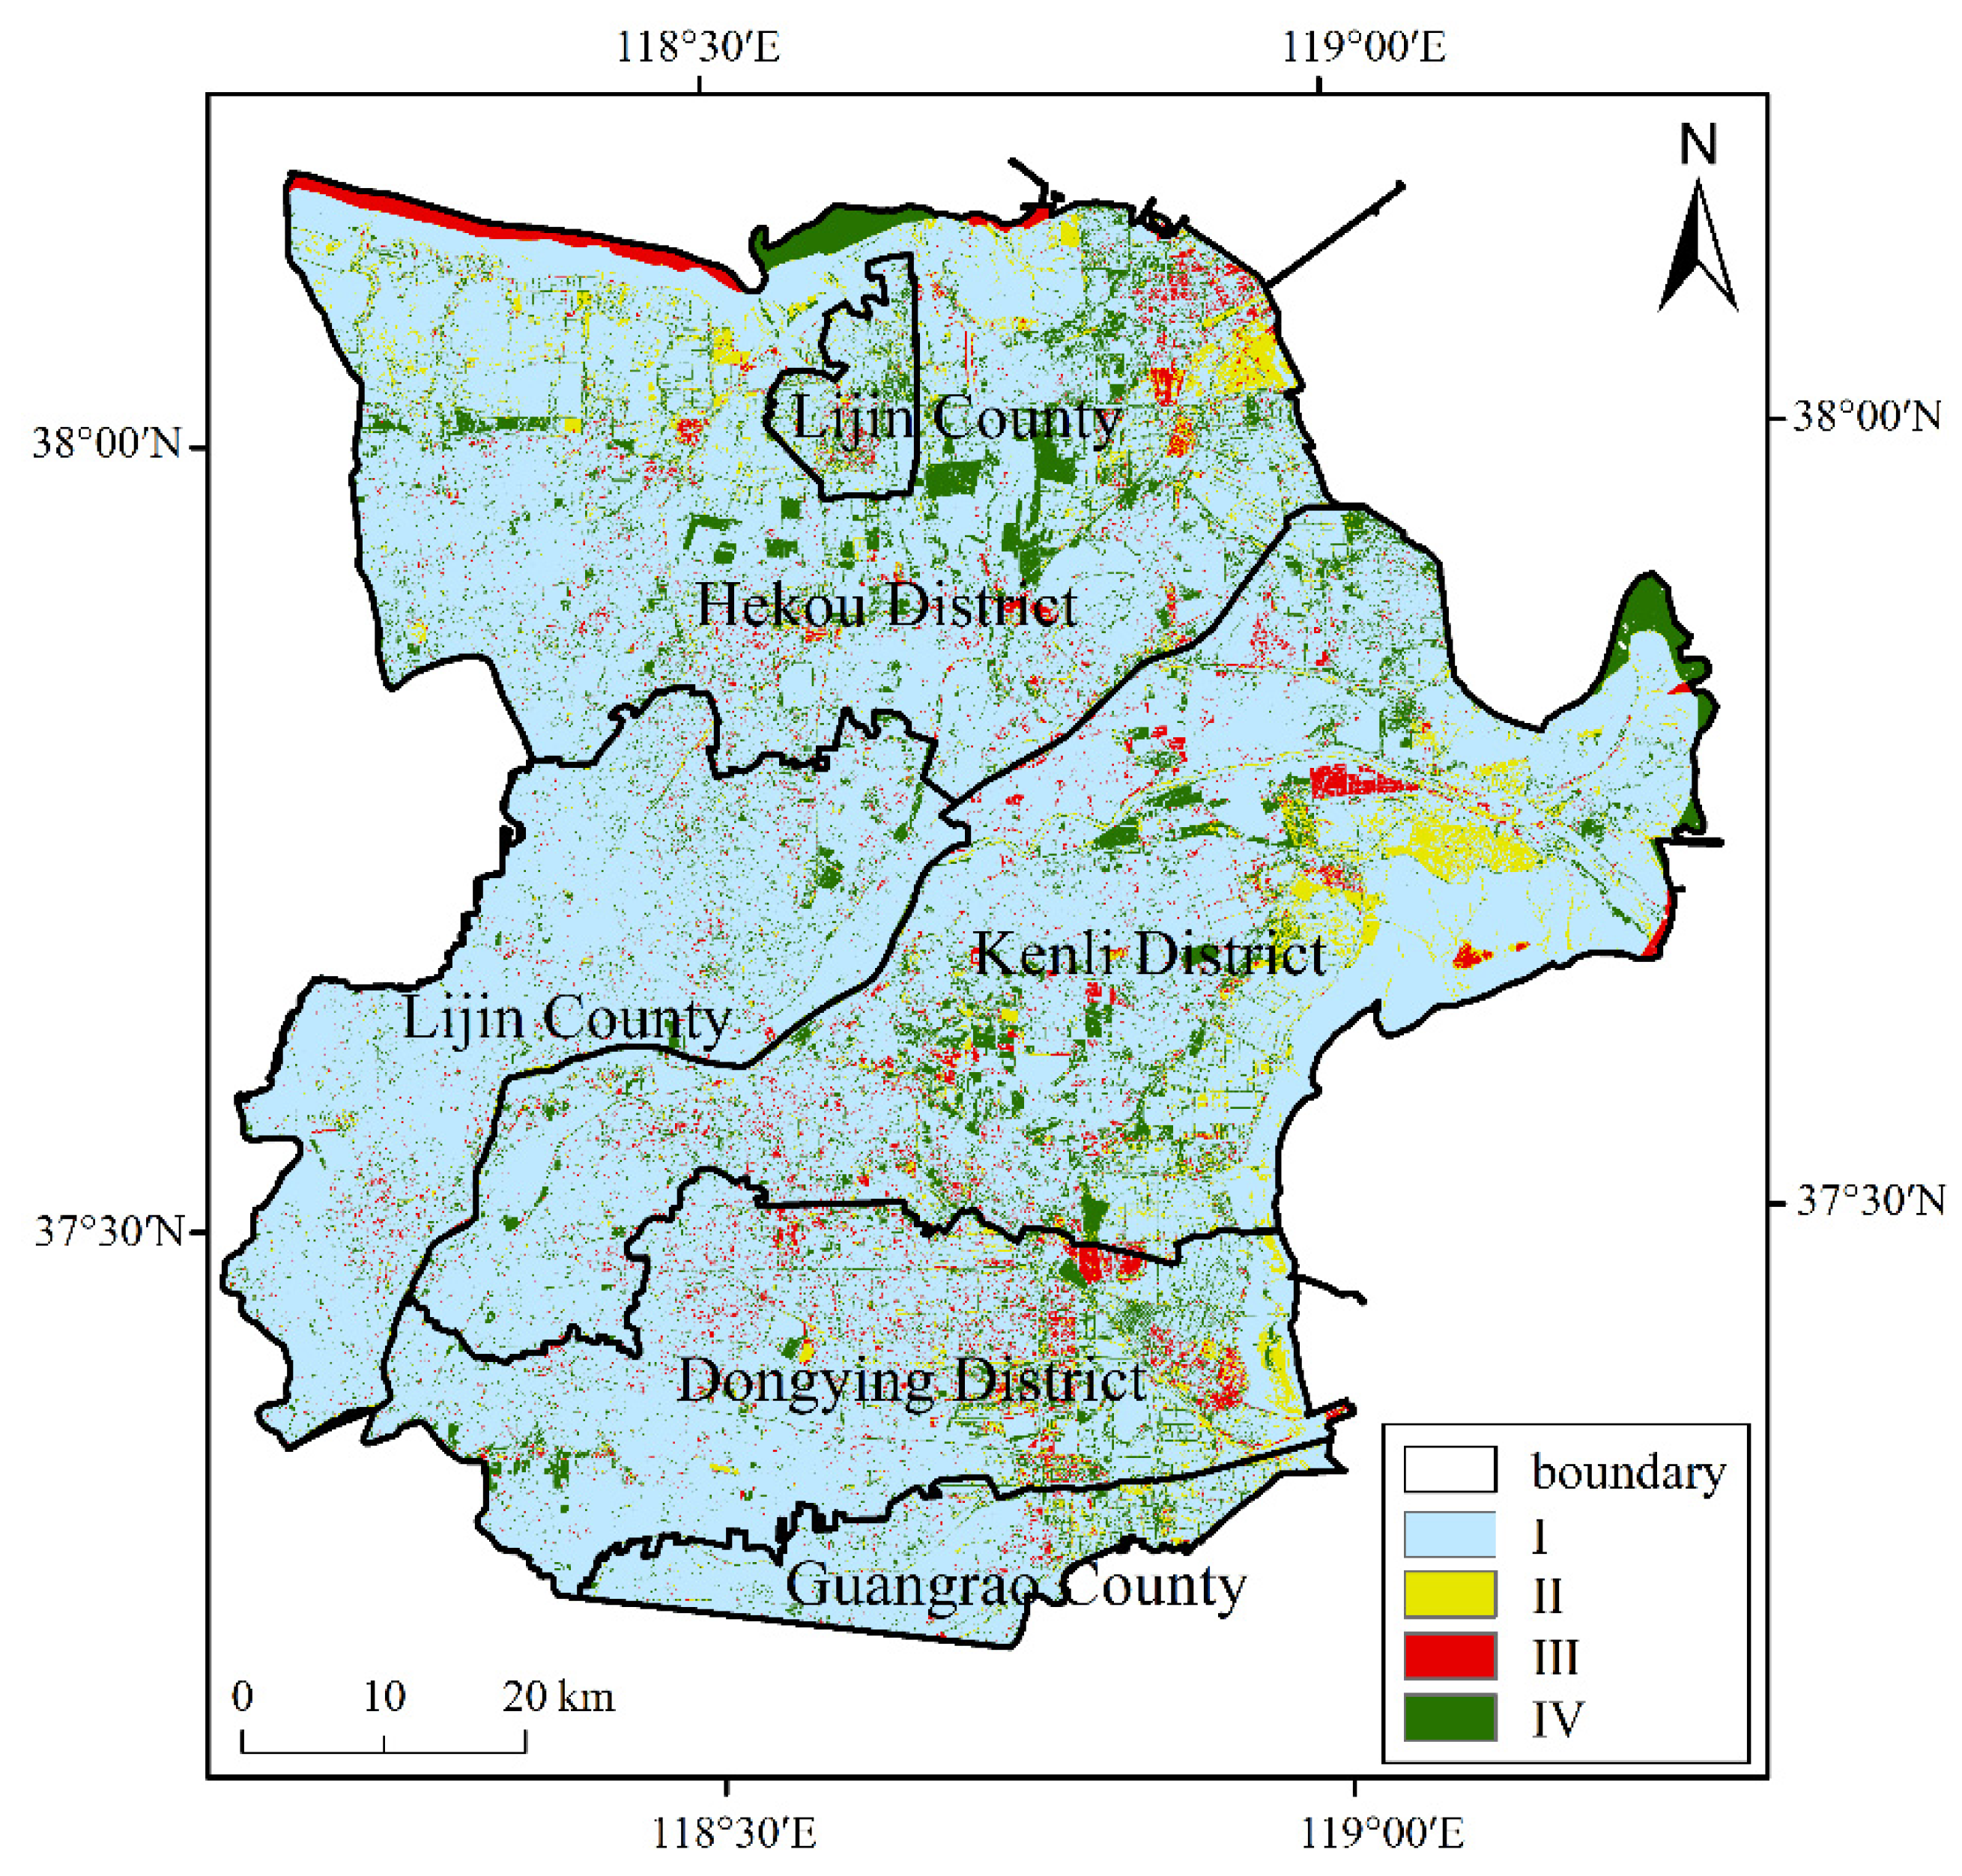
3.2.1. Spatial Distribution of Wetland Changes
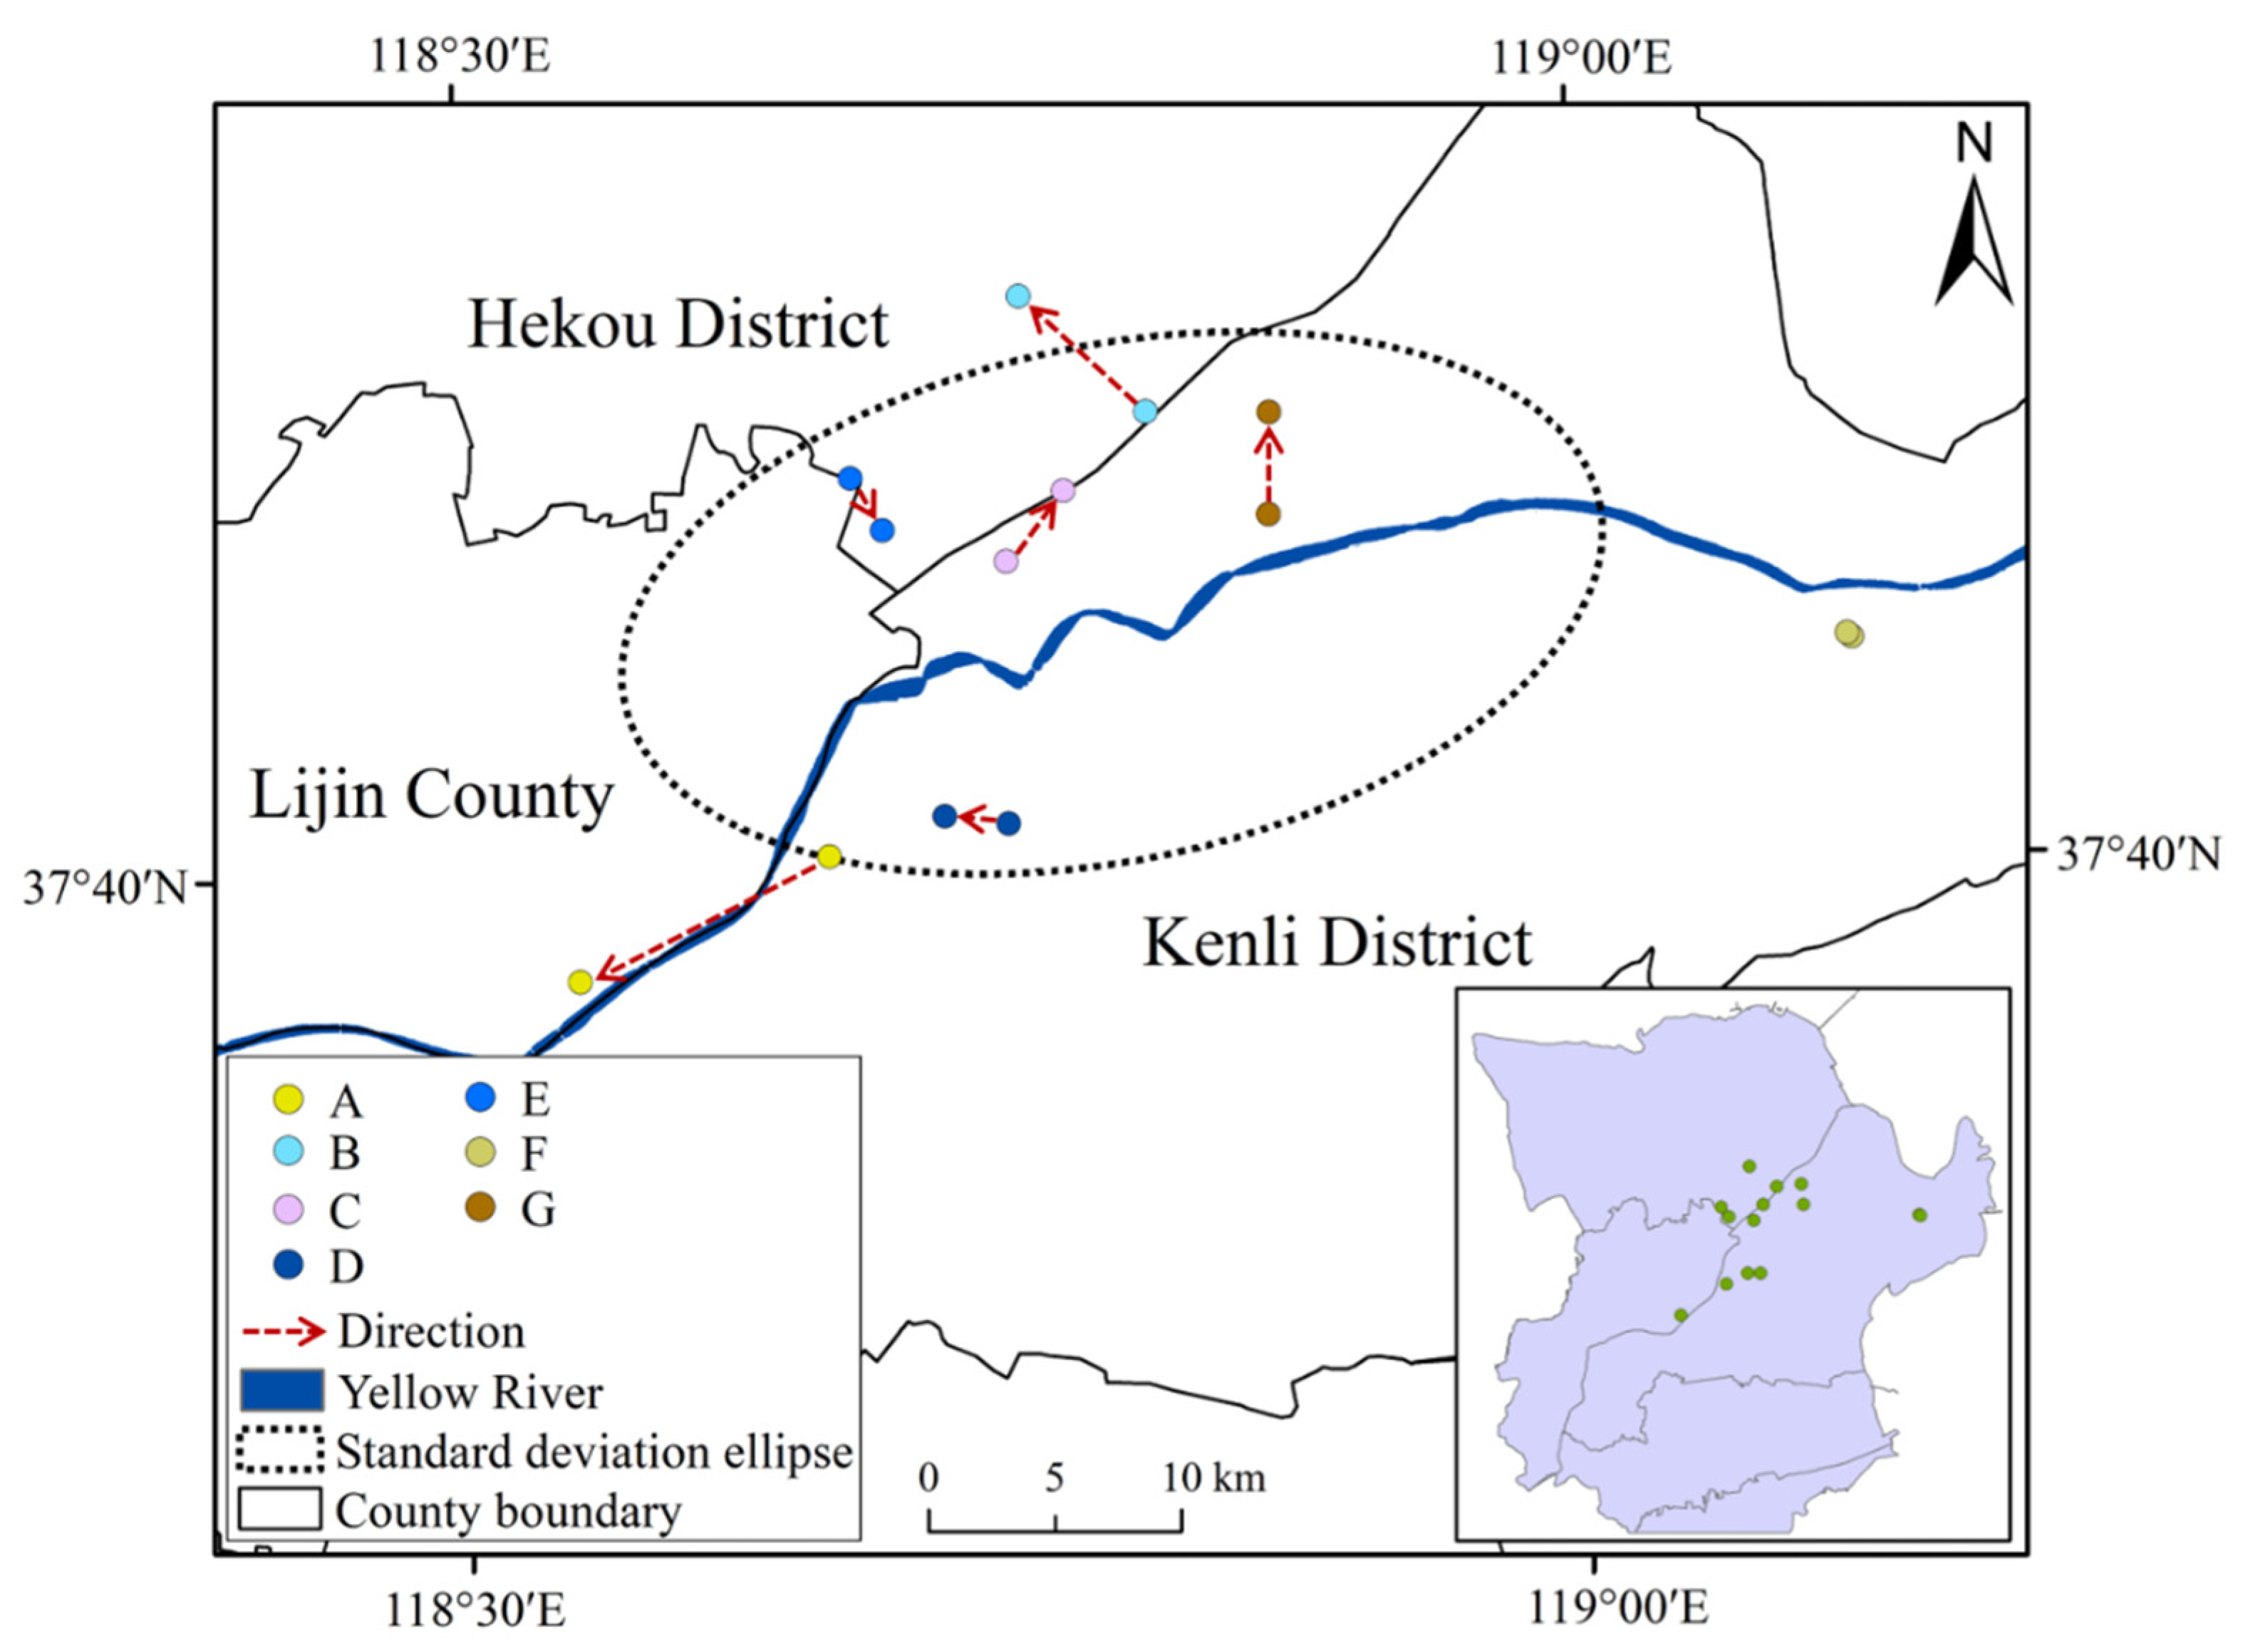
3.2.2. Gravity Center Migrations for Different Wetlands
3.3. Dominant Driving Factors of Wetland Changes during 2015–2021
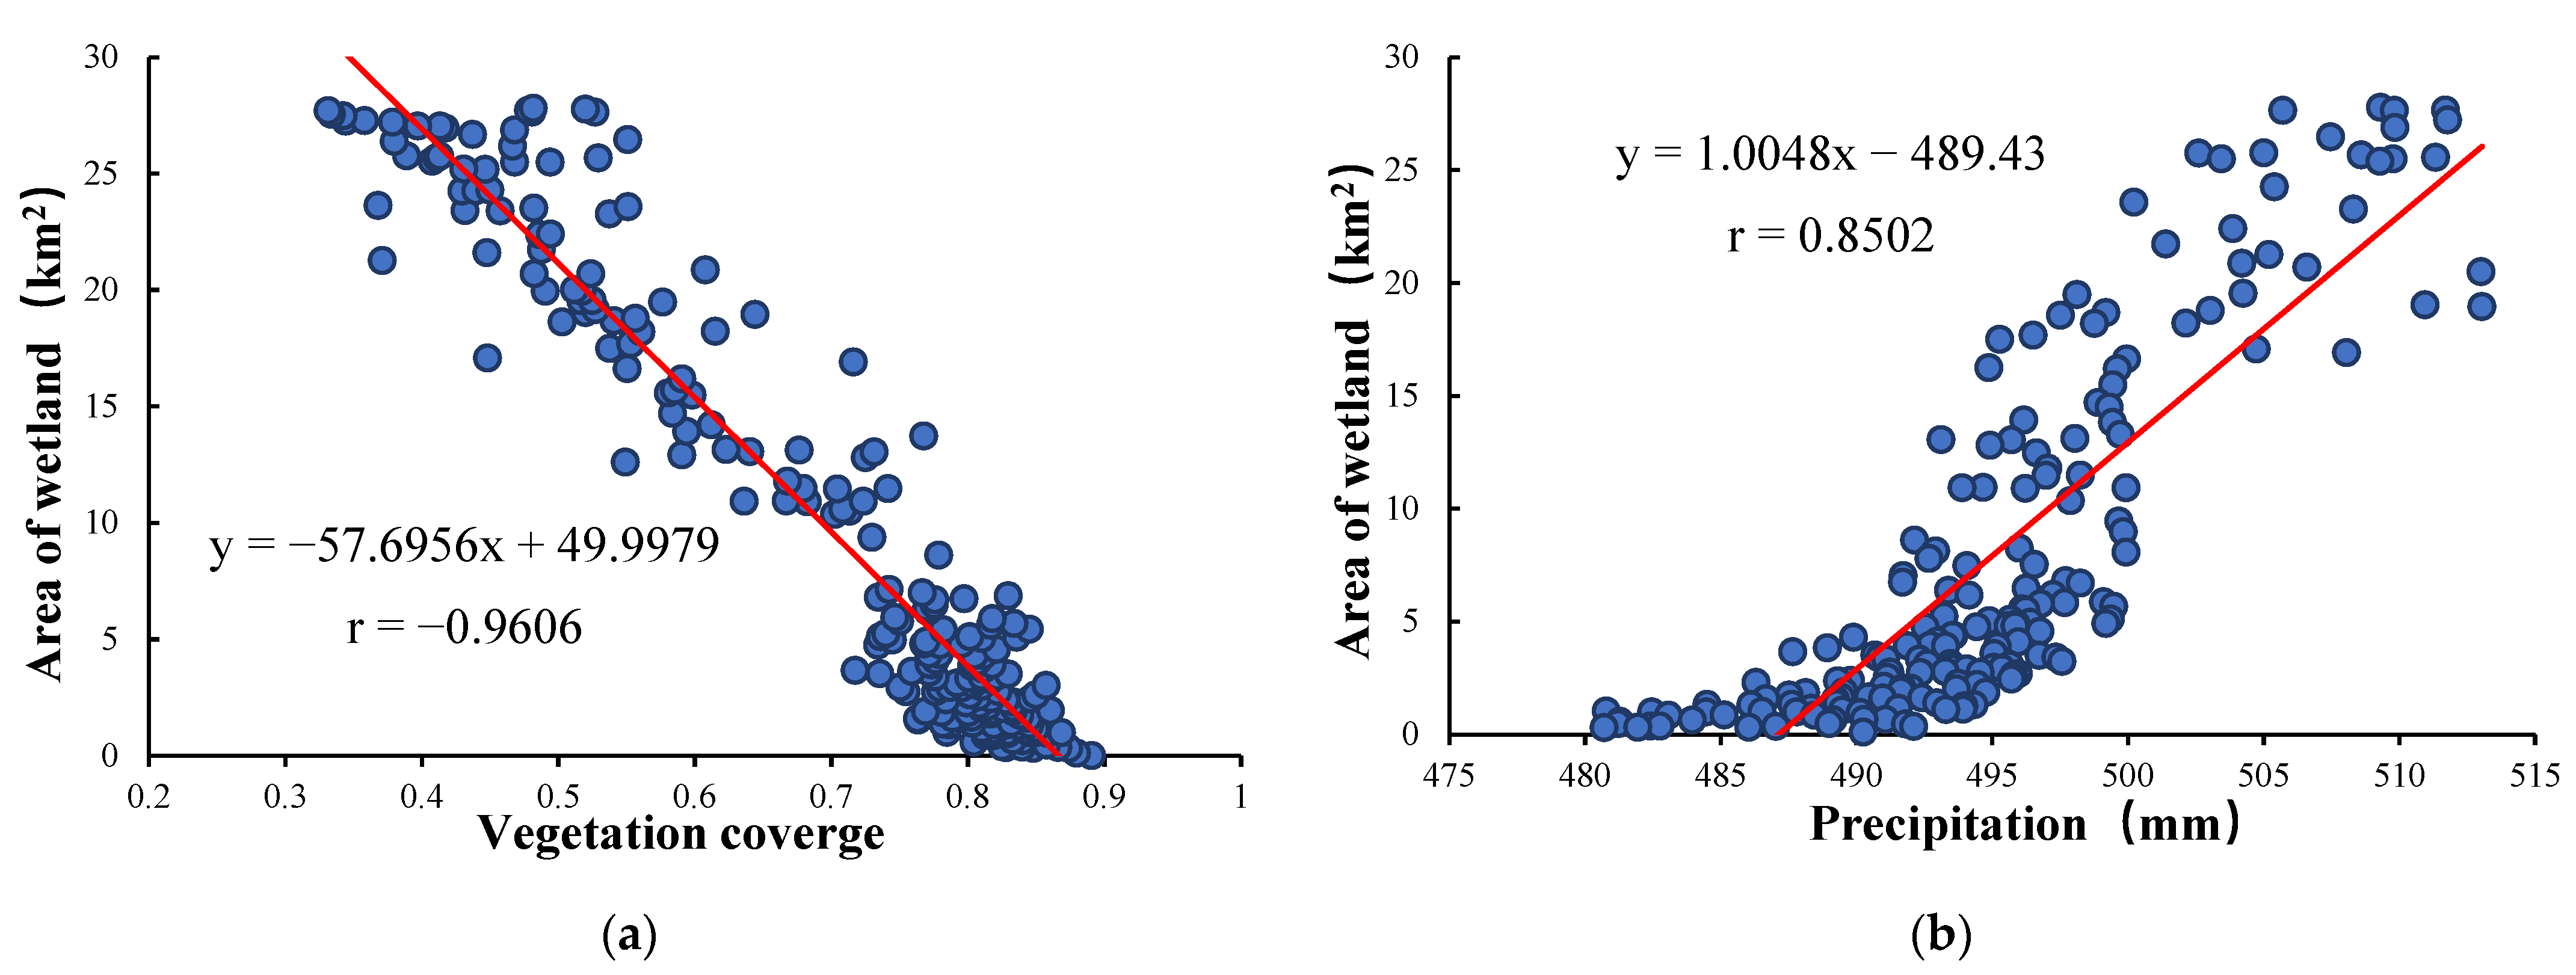
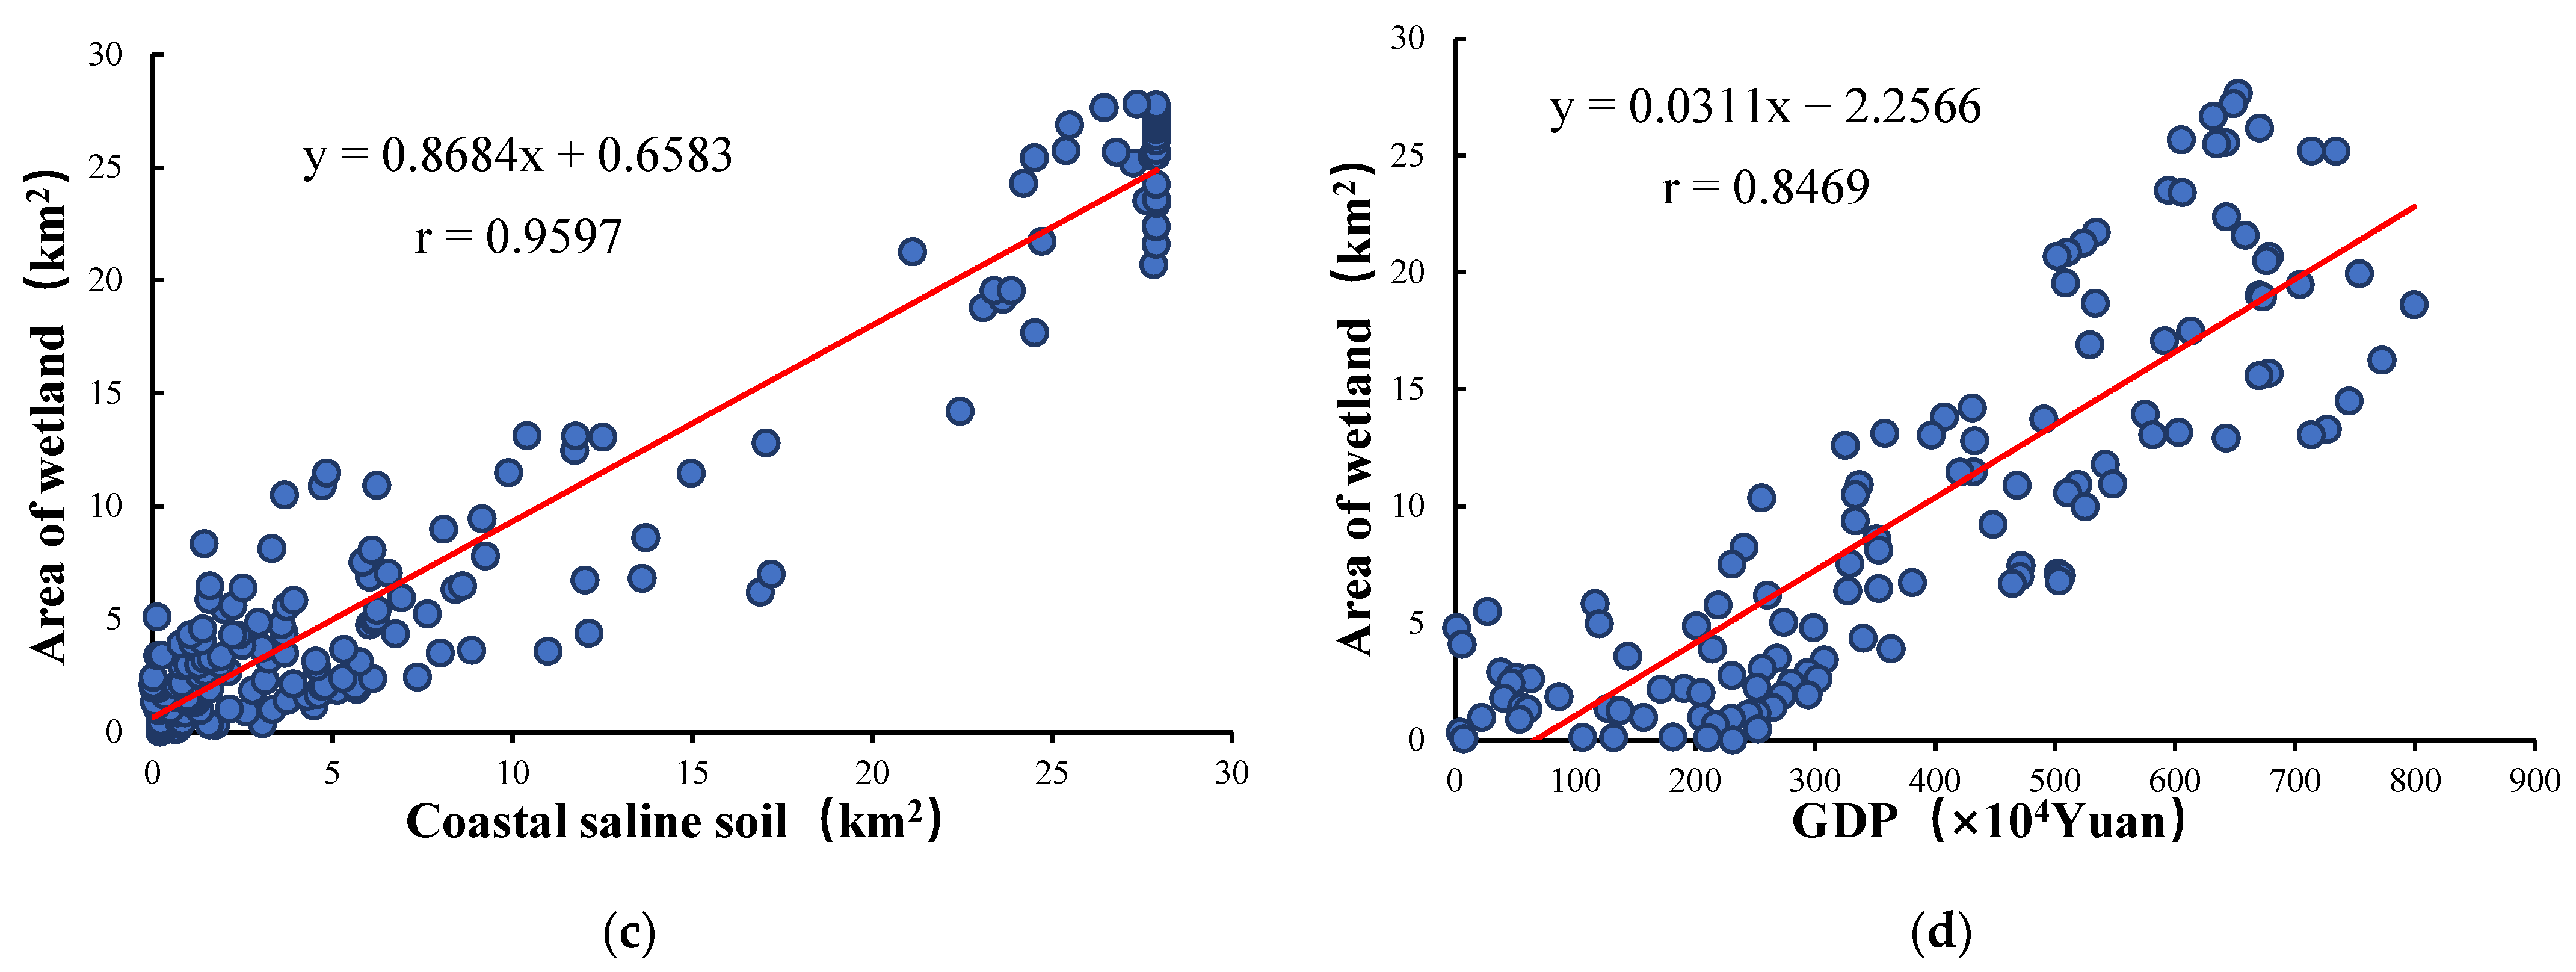
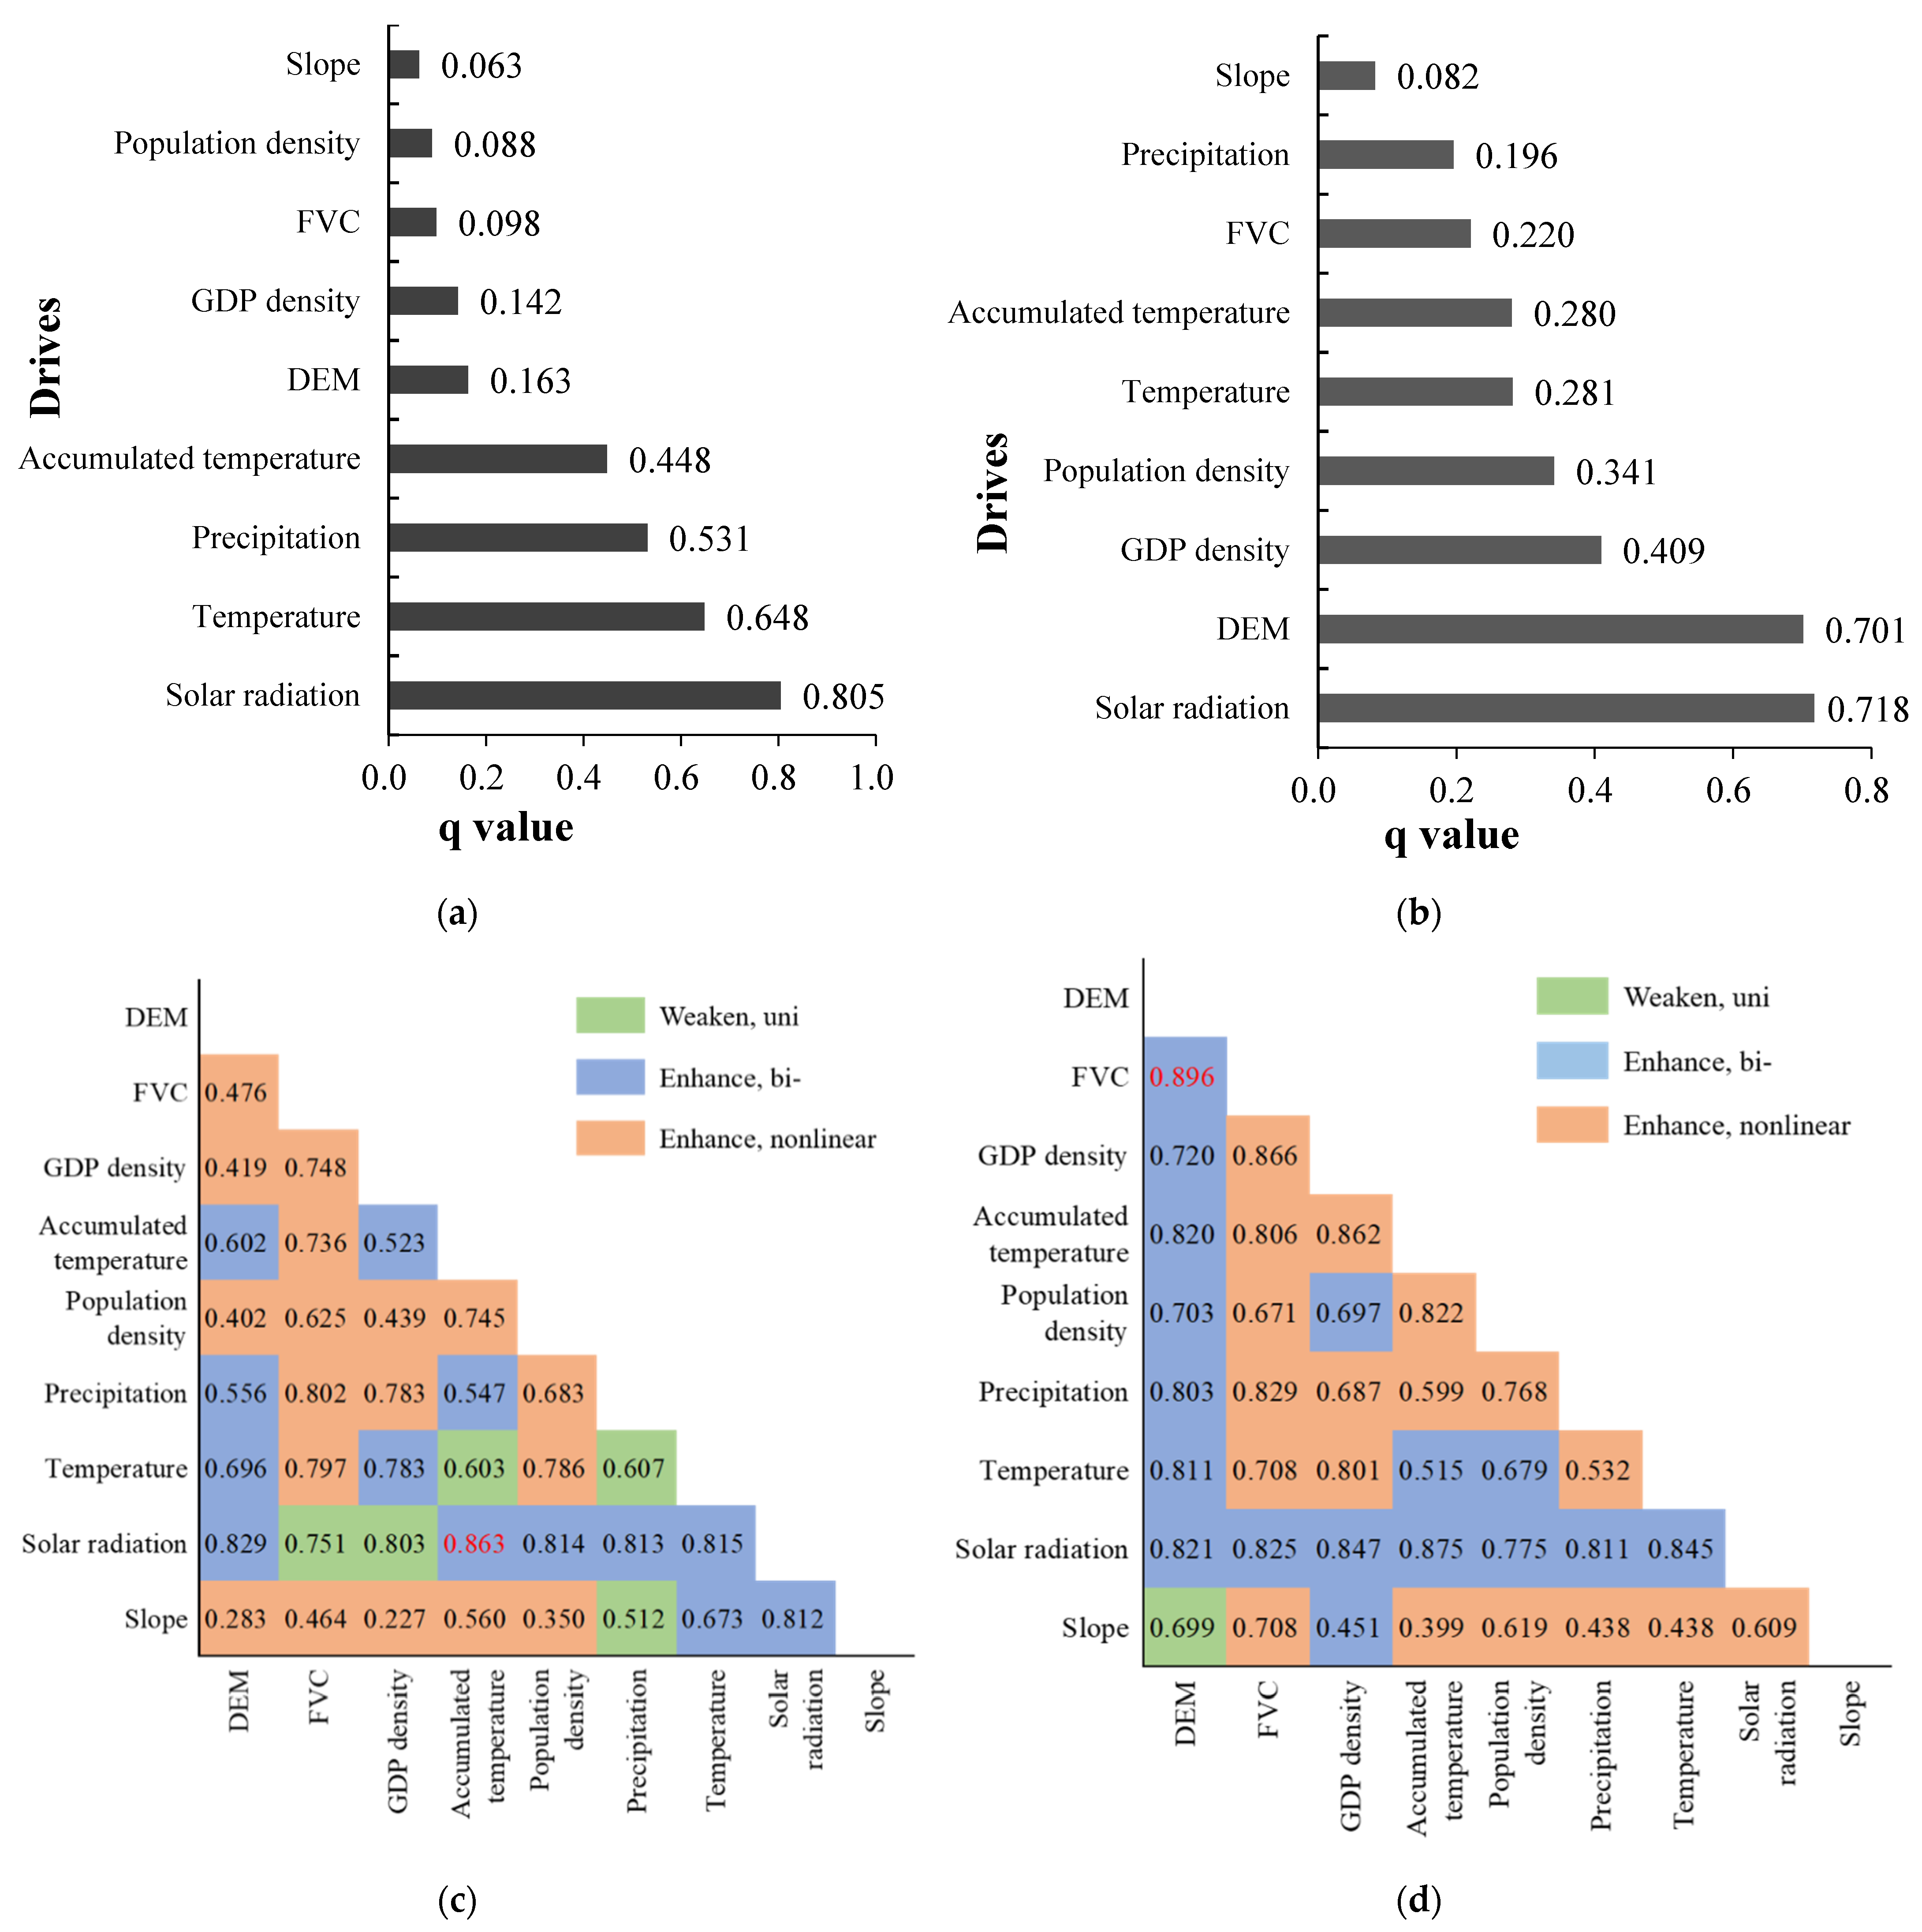
3.3.1. Single Factor
3.3.2. Interaction Factors
4. Discussion
4.1. Advantages of the Classification Method of Wetlands
4.2. Causes of Wetland Change Pattern
5. Conclusions
- (1)
- Vegetation index and water index have a positive impact on wetland information extraction and classification accuracy. In addition, the red-edge index made greater contributions to enhance classification accuracy.
- (2)
- The Random Forest algorithm could be used to optimize the feature variables, and remove the redundancy among feature variables. Scheme F, based on optimal feature variable sets, had the best classification accuracy of wetlands, which could provide references for the investigation of wetlands in the YRD.
- (3)
- During 2015–2021, a large area of natural wetland in the YRD was transformed into an artificial wetland. The wetlands showed an overall development direction of “northwest–southeast” along the Yellow River.
- (4)
- Wetland changes in the YRD were affected by both natural and human factors. The interaction between FVC and accumulated temperature had the largest explanatory power of the change in the natural wetland area. The interaction between solar radiation and DEM had the largest explanatory power for the change in the artificial wetland area.
Author Contributions
Funding
Data Availability Statement
Conflicts of Interest
Abbreviation
| Full Name | Abbreviation |
| Yellow River delta | YRD |
| Classification and Regression Tree | CART |
| Support Vector Machine | SVM |
| Random Forest | RF |
| Artificial Neural Network | ANN |
| K-Nearest Neighbors | KNN |
| Google Earth Engine | GEE |
| Digital Elevation Model | DEM |
| Bidirectional Reflectance Distribution Function | BRDF |
| Principal component analysis | PCA |
| Gray Level Co-occurrence Matrix | GLCM |
| Overall Accuracy | OA |
| Kappa coefficient | Kappa |
| Producer’s Accuracy | PA |
| User’s Accuracy | UA |
| Land Use/Cover Change | LUCC |
| Out-Of-Bag | OOB |
| Geographic Information System | GIS |
| Remote Sensing | RS |
| Vegetation Coverage | FVC |
| Gross Domestic Product | GDP |
References
- Davidson, N.C. How much wetland has the world lost? Longterm and recent trends in global wetland area. Mar. Freshw. Res. 2014, 65, 934–941. [Google Scholar] [CrossRef]
- Escorihuel, M.J.; Quintana, S.P.; Escorihuel, M.J. Comparison of remote sensing and simulated soil moisture datasets in Mediterranean landscapes. Remote Sens. Environ. 2016, 180, 99–114. [Google Scholar] [CrossRef]
- Steven, A.S.; Douglas, A.; Liou, W.S. Accuracy of Landsat-TM and GIS rule-based methods for forest wetland classification in Maine. Remote Sens. Environ. 1995, 53, 133–144. [Google Scholar]
- Ozesmi, S.L.; Marvin, E.B. Satellite remote sensing of wetlands. Wetl. Ecol. Manag. 2002, 10, 381–402. [Google Scholar] [CrossRef]
- Aurélie, D.; Gaëtan, L.; Brigitte, P. Wetland monitoring using classification trees and SPOT-5 seasonal time series. Remote Sens. Environ. 2009, 114, 552–562. [Google Scholar]
- Zhang, C.; Zang, S.Y.; Jin, Z.; Zhang, Y.H. Remote sensing classification for Zhalong Wetlands based on support vector machine. Wetl. Sci. 2011, 9, 263–269. [Google Scholar]
- Abdelgadir, A.A.; Sucharita, G.; James, R.I.; Alan, H.S. Classification of ASAS multiangle and multispectral measurements using artificial neural networks. Remote Sens. Environ. 1996, 57, 79–87. [Google Scholar]
- Khatami, R.; Mountrakis, G.; Stephen, V. A meta-analysis of remote sensing research on supervised pixel-based land-cover image classification processes: General guidelines for practitioners and future research. Remote Sens. Environ. 2016, 177, 89–100. [Google Scholar] [CrossRef]
- Noi, P.T.; Kappas, M. Comparison of Random Forest, k-Nearest Neighbor, and Support Vector Machine Classifiers for Land Cover Classification Using Sentinel-2 Imagery. Sensors 2018, 18, 18. [Google Scholar]
- Dehkordi, A.T.; Zoej, M.J.V.; Ghasemi, H.; Ghaderpour, E.; Hassan, Q.K. A new clustering method to generate training samples for supervised monitoring of long-term water surface dynamics using Landsat data through Google Earth Engine. Sustainability 2022, 14, 8046. [Google Scholar] [CrossRef]
- Gxokwe, S.; Dube, T.; Mazvimavi, D. Leveraging Google Earth Engine platform to characterize and map small seasonal wetlands in the semi-arid environments of South Africa. Sci. Total Environ. 2022, 803, 150139. [Google Scholar] [CrossRef] [PubMed]
- Chi, Y.; Shi, H.H.; Sun, J.K.; Li, J.; Yang, F.; Fu, Z.Y. Spatio-temporal characteristics and main influencing factors of vegetation net primary productivity in the Yellow River Delta in recent 30 years. Acta Ecol. Sin. 2018, 38, 2683–2697. [Google Scholar]
- Zhang, X.L.; Ye, S.Y.; Yin, P.; Chen, J.D. Characters and successions of natural wetland vegetation in Yellow River Delta. Ecol. Environ. Sci. 2009, 18, 292–298. [Google Scholar]
- Talukdar, S.; Singha, P.; Mahato, S.; Liou, Y.A.; Rahman, A. Land-use land-cover classification by machine learning classifiers for satellite observations-A review. Remote Sens. 2020, 12, 1135. [Google Scholar] [CrossRef]
- Abdi, A.M. Land cover and land use classification performance of machine learning algorithms in a boreal landscape using Sentinel-2 data. GIScience Remote Sens. 2020, 57, 1–20. [Google Scholar] [CrossRef]
- Wang, M.; Qi, S.; Zhang, X. Wetland loss and degradation in the Yellow River Delta, Shandong Province of China. Environ. Earth Sci. 2012, 67, 185–188. [Google Scholar] [CrossRef]
- Liu, G.L.; Zhang, L.C.; Zhang, Q.; Musyimi, Z.; Jiang, Q.H. Spatio–Temporal Dynamics of Wetland Landscape Pat-terns Based on Remote Sensing in Yellow River Delta, China. Wetlands 2014, 34, 787–801. [Google Scholar] [CrossRef]
- Zhou, K. Wetland landscape pattern evolution and prediction in the Yellow River Delta. Appl. Water Science. 2022, 12, 190. [Google Scholar] [CrossRef]
- Chen, Z.R.; Zhang, X.X.; Hu, H.H.; Niu, Y.Y.; Ye, J.F.; Zhang, Q.; Liu, B.; Zhao, L.N.; Lu, S.; Lu, L.M.; et al. Plant geography in China: History, progress and prospect. Acta Geogr. Sin. 2022, 77, 120–132. [Google Scholar]
- Guo, B.; Yang, F.; Fan, J.F.; Lu, Y.F. The changes of spatiotemporal pattern of rocky desertification and its dominant driving factors in typical Karst mountainous areas under the background of global change. Remote Sens. 2022, 14, 2351. [Google Scholar] [CrossRef]
- Zhang, L.; Gong, Z.N.; Wang, Q.W.; Jin, D.D.; Wang, X. Wetland mapping of Yellow River Delta wetlands based on multi-feature optimization of Sentinel-2 images. J. Remote Sens. 2019, 23, 313–326. [Google Scholar]
- Ortega, P.M.; Montero, L.G.G.; Sibelet, N. Temporal patterns in illumination conditions and its effect on vegetation indices using Landsat on Google Earth Engine. Remote Sens. 2022, 12, 211. [Google Scholar] [CrossRef]
- Office of International Standards and Legal Affairs. UNESCO. Convention on wetlands pf international importance especially as waterfowl habitat. In Proceedings of the Second Conference of the Parties, Groningen, The Netherlands, 7–12 May 1984.
- Huang, K.; Shi, D.Z.S.; Deng, C.L.; Du, K. Response relationship between ecosystem and runoff into the sea in the Yellow River. Yellow River 2012, 34, 66–69. [Google Scholar]
- Mu, X.J.; Liu, X.T.; Yan, B.X.; Cui, B.S. Classification system of coastal wetlands in China. Wetl. Sci. 2015, 13, 19–26. [Google Scholar]
- Liu, G.Y.; Huang, Y.; Cao, Y.; Zeng, Z.Y.; Zhao, E.M. Research on extraction of image texture feature based on gray co-occurrence matrix. Wind. Sci. Technol. 2021, 12, 61–64. [Google Scholar]
- Li, H.K.; Wang, L.J.; Xiao, S.S. Random forest classification of land use in hilly and mountaineous areas of southern China using multi-source remote sensing data. Trans. Chin. Soc. Agric. Eng. 2021, 37, 244–251. [Google Scholar]
- Na, X.D.; Zhang, S.Q.; Kong, B.; Yu, H.; Liu, C.Y. The extraction of freshwater marsh wetland information based on Decision Tree Algorithm- A case study in the northeast of the Sanjiang Plain. Remote Sens. Technol. Appl. 2008, 23, 265–372. [Google Scholar]
- Kumari, N.; Srivastava, A.; Dumka, U.C. A long-term spatiotemporal analysis of vegetation greenness over the Himalayan Region using Google Earth Engine. Climate 2021, 9, 109. [Google Scholar] [CrossRef]
- Du, Z.F. Multivariate Statistical Analysis; Tsinghua University Press: Beijing, China, 2016. [Google Scholar]
- Deng, N.D.; Li, Y.X.; Cui, Y.Y.; Shi, H.; Guo, Y.L. Landslide susceptibility assessment based on hybrid model of machine learning. Sci. Technol. Eng. 2022, 22, 5539–5547. [Google Scholar]
- Fabian, B.; Kai, Z. Thermal influences on groundwater in urban environments—A multivariate statistical analysis of the subsurface heat island effect in Munich. Sci. Total Environ. 2022, 810, 152193. [Google Scholar]
- Haralick, R.M. Statistical and structural approaches to texture. Proc. IEEE 1979, 67, 786–804. [Google Scholar] [CrossRef]
- Dong, K.; Yu, Z.; Kerfahi, D.; Sang, S.L.; Li, N.; Yang, T.; Adams, J.M. Soil microbial co-occurrence networks become less connected with soil development in a high Arctic glacier foreland succession. Sci. Total Environ. 2022, 813, 152565. [Google Scholar] [CrossRef] [PubMed]
- Belwalkar, A.; Pobleta, T.; Longmire, A.; Hornero, A.; Hernandez, R.C.; Tejada, P.J.Z. Evaluation of SIF retrievals from narrow-band and sub-nanometer airborne hyperspectral imagers flown in tandem: Modelling and validation in the context of plant phenotyping. Remote Sens. Environ. 2022, 273, 112926. [Google Scholar] [CrossRef]
- Wang, S.J. Study on feature extraction and semi-supervised classification for hyperspectral remote sensing imagery. Nanjing Norm. Univ. 2016. [Google Scholar] [CrossRef]
- Iverson, L.R.; Prasad, A.M.; Matthews, S.N. Estimating potential habitat for 134 eastern US tree species under six climate scenarios. For. Ecol. Manag. 2008, 254, 390–406. [Google Scholar] [CrossRef]
- Breiman, L. Random forest. Mach. Learn. 2001, 45, 5–32. [Google Scholar] [CrossRef] [Green Version]
- Virro, H.; Kmoch, A.; Vainu, M.; Unemaa, E. Random forest-based modeling of stream nutrients at national level in a data-scarce region. Sci. Total Environ. 2022, 840, 156613. [Google Scholar] [CrossRef]
- Solmaz, F.; Mohammad, K.F.; Li, H.J.; Asim, B. Surface biophysical features fusion in remote sensing for improving land crop/cover classification accuracy. Sci. Total Environ. 2022, 838, 156520. [Google Scholar]
- Wang, L.J.; Kong, Y.R.; Xu, Y.; Liang, L.; Wang, S.G. Classification of land use in farming areas based on feature optimization random forest algorithm. Trans. Chin. Soc. Agric. Eng. 2020, 36, 244–250. [Google Scholar]
- Gao, Z.P.; Guo, H.M.; Li, S.Y.; Wang, J.; Ye, H.L.; Han, S.B.; Cao, W.G. Remote sensing of wetland evolution in predicting shallow groundwater arsenic distribution in two typical inland basins. Sci. Total Environ. 2022, 806, 150496. [Google Scholar] [CrossRef]
- Jiang, S.; Meng, J.J.; Zhu, L.K.; Cheng, H.R. Spatial-temporal pattern of land use conflict in China and its multilevel driving mechanisms. Sci. Total Environ. 2021, 801, 149697. [Google Scholar] [CrossRef]
- Zan, C.J.; Liu, T.; Huang, Y.; Bao, A.M.; Yan, Y.Y.; Ling, Y.N.; Wang, Z.; Duan, Y.C. Spatial and temporal variation and driving factors of wetland in the Amu Darya River Delta, Central Asia. Ecol. Indic. 2022, 139, 108898. [Google Scholar] [CrossRef]
- Zhang, Y.R.; Wen, X.H.; Luo, S.Q.; Li, M.S. Study on the relationship between vegetation cover change and climate factors in Zoige wetland in recent 20 year. Plateau Meteorol. 2022, 41, 317–327. [Google Scholar]
- Jia, J.J.; Wang, Y.F.; Lu, Y.; Sun, K.; Lu, S.D.; Gao, Y. Driving mechanisms of gross primary productivity geographical patterns for Qinghai–Tibet Plateau lake systems. Sci. Total Environ. 2021, 791, 148286. [Google Scholar] [CrossRef] [PubMed]
- Venkatesh, K.; John, R.; Chen, J.Q.; Xiao, J.F.; Amirkhiz, R.G.; Giannico, V.; Kussainova, M. Optimal ranges of social-environmental drivers and their impacts on vegetation dynamics in Kazakhstan. Sci. Total Environ. 2022, 847, 157562. [Google Scholar] [CrossRef]
- Yan, J.N.; Liu, J.W.; Wang, L.Z.; Liang, D.; Cao, Q.C.; Zhang, W.F.; Jiang, P. Land-cover classification with time-series remote sensing images by complete extraction of multiscale timing dependence. IEEE J. Sel. Top. Appl. Earth Obs. Remote Sens. 2022, 15, 1953–1967. [Google Scholar] [CrossRef]
- Guo, B.; Wei, C.X.; Yu, Y.; Liu, Y.F.; Li, J.L.; Meng, C.; Cai, Y.M. The dominant influencing factors of desertification changes in the source region of Yellow River: Climate change or human activity? Sci. Total Environ. 2022, 813, 152512. [Google Scholar] [CrossRef]
- Chen, S.T.; Guo, B.; Zhang, R.; Zang, W.Q.; Wei, C.X.; Wu, H.W.; Yang, X.; Zhen, X.Y.; Li, X.; Zhang, D.F.; et al. Quantitatively determine the dominant driving factors of the spatial-temporal changes of vegetation NPP in the Hengduan Mountain area during 2000–2015. J. Mt. Sci. 2021, 18, 427–445. [Google Scholar] [CrossRef]
- Song, H.R.; Su, G.H.; Sun, J.H.; Lin, W.R. Landscape changes of the Yancheng wetland in the past 20 years: Evidence from Random Forest. Mar. Geol. Front. 2021, 37, 75–82. [Google Scholar]
- Pu, Y.H.; Zhang, D.; Xu, D.D.; Luan, Z.Q. Evaluation of red edge of Sentinel-2A in vegetation classification of lakeside zone. For. Resour. Manag. 2021, 2, 131–139. [Google Scholar]
- Wei, Y.Q.; Wang, W.W.; Tang, X.J.; Li, H.; Hu, H.W.; Wang, X.F. Classification of alpine grasslands in cold and high altitudes based on multispectral Landsat-8 images: A case study in Sanjiangyuan National Park, China. Remote Sens. 2022, 14, 3714. [Google Scholar] [CrossRef]
- Gao, R.; Wang, Z.Y.; Zhou, X.D.; Liu, R. Monitoring and analysis of wetland change dynamics in the Yellow River Delta using multi-temporal remote sensing. Surv. Mapp. Bull. 2021, 4, 22–27. [Google Scholar]



| First Classification | Secondary Classification | Remote Sensing Image | Geometric Feature |
|---|---|---|---|
| Natural wetland | River |  | Green or yellow, slender striped. |
| Swamp |  | Dark green, irregular shape, largely distributed in nature reserves. | |
| Mud flat |  | Yellow, striped, distributed in coastal areas. | |
| Shallow sea |  | Green, striped, distributed in coastal areas. | |
| Artificial wetland | Salt pans |  | Green or gray-white, grid-like, coastal distribution. |
| Paddy field |  | Bright green, striped, distributed along the river. | |
| Reservoirs pond |   | Reservoir pond: Green, regular in shape, scattered in the study area; Loose pond: Green, striped, distributed in coastal areas. | |
| Non-wetland | Dryland |  | Green, regular shape, with evident texture features. |
| Woodland |  | Dark green, distributed along roads and rivers. | |
| Construction land |  | Pink and gray hybrid, regular in shape, distributed inland. | |
| Unused land |  | Soil yellow, scattered distribution. |
| Correlation | Extremely Strong Correlation | Strong Correlation | Moderate Correlation | Low Correlation | Uncorrelation |
|---|---|---|---|---|---|
| correlation coefficient | >0.8 <−0.8 | 0.6~0.8 −0.8~−0.6 | 0.4~0.6 −0.6~−0.4 | 0.2~0.4 −0.4~−0.2 | <0.2 >−0.2 |
| Year | The Optimal Combination of Features |
|---|---|
| 2015 | B2, B3, B4, B5, GLCM_Variance, RNDVI, GLCM_Mean, MNDWI, MSAVI, RVI, Energy, DVI, MSRre, NDVIre1, NDVIre3, NDre1, NDre2, Cire, NDVI, NDVIre2 |
| 2021 | B2, B3, B4, B5, GLCM_Variance, ASM, Energy, GLCM_Correlation, MNDWI, MSAVI, NDVIre1, NDVIre3, NDre1, NDre2, Cire, NDVI, NDVIre2, RNDVI, RVI, DVI |
| Classification Scheme | Feature Combination |
|---|---|
| A | Spectral feature |
| B | Spectral feature + Vegetation index + Water index |
| C | Spectral feature+ Red-edge index |
| D | Spectral feature + Texture feature |
| E | Spectral feature + Vegetation index + Water index + Red-edge index + Texture feature |
| F | The optimal feature variables set |
| Land Cover Type | A | B | C | D | E | F | ||||||
|---|---|---|---|---|---|---|---|---|---|---|---|---|
| PA % | UA % | PA % | UA % | PA % | UA % | PA % | UA % | PA % | UA % | PA % | UA % | |
| River | 63.98 | 83.74 | 62.73 | 82.11 | 63.35 | 79.69 | 50 | 67.82 | 59.32 | 81.4 | 79.37 | 82.05 |
| Swamp | 62.50 | 64.52 | 59.38 | 66.67 | 70.31 | 75.00 | 79.79 | 72.82 | 64.71 | 70.21 | 95.45 | 96.78 |
| Mud flat | 94.39 | 91.82 | 96.26 | 95.37 | 93.46 | 93.46 | 94.03 | 99.21 | 97.01 | 93.53 | 99.77 | 99.64 |
| Shallow sea | 86.59 | 87.65 | 87.80 | 83.72 | 91.46 | 87.21 | 94.66 | 88.57 | 92.37 | 95.53 | 92.91 | 98.58 |
| Salt pans | 94.12 | 87.50 | 94.96 | 87.60 | 93.70 | 90.28 | 87.08 | 84.89 | 88.19 | 86.59 | 67.08 | 56.34 |
| Paddy field | 92.21 | 87.12 | 93.51 | 89.44 | 93.51 | 88.89 | 84.91 | 85.71 | 89.62 | 93.14 | 95.24 | 100 |
| Reservoirs and pond | 84.15 | 77.00 | 83.61 | 78.06 | 85.25 | 77.23 | 84.77 | 78.04 | 86.8 | 76.34 | 99.5 | 97.88 |
| Dryland | 81.31 | 76.99 | 81.31 | 79.82 | 82.24 | 81.48 | 66.93 | 75.22 | 70.87 | 69.23 | 91.15 | 96.55 |
| Woodland | 65.57 | 83.33 | 75.41 | 83.64 | 77.05 | 88.68 | 81 | 77.88 | 64 | 72.73 | 74.74 | 71.14 |
| Construction land | 92.42 | 84.72 | 90.15 | 85.00 | 92.42 | 87.77 | 86.72 | 81.62 | 84.38 | 77.7 | 95.24 | 92.25 |
| Unused land | 78.12 | 94.34 | 79.69 | 85.00 | 87.50 | 91.80 | 72.55 | 74 | 66.67 | 79.07 | 98.29 | 95.82 |
| OA | 83.81 | 84.26 | 85.89 | 81.74 | 81.54 | 95.75 | ||||||
| Kappa | 0.81 | 0.83 | 0.84 | 0.80 | 0.79 | 0.93 | ||||||
| Number | Type | Meaning |
|---|---|---|
| Ⅰ | Unchanged area | Land cover did not change |
| Ⅱ | Internal conversion area | Conversion between natural/constructed wetlands |
| Ⅲ | Extinction area | Conversion of natural/constructed wetlands to non-wetlands |
| Ⅳ | New-born area | Conversion of non-wetlands to natural/constructed wetlands |
| Number | 01 | 02 | 03 | 04 | 05 | 06 |
|---|---|---|---|---|---|---|
| Land cover | Paddy field | Shallow sea | Salt pans | Reservoirs and pond | Dryland | Woodland |
| Number | 07 | 08 | 09 | 10 | 11 | 12 |
| Land cover | River | Mud flat | Construction land | Swamp | Unused land | Sea |
| Number | A | B | C | D | E | F | G |
|---|---|---|---|---|---|---|---|
| Type of wetland | puddy field | shallow sea | salt pans | river | reservoirs and pond | swamp | mud flat |
| Correlation | High Correlation | Moderate Correlation | Mild Correlation | Low Correlation | Uncorrelation |
|---|---|---|---|---|---|
| r | >0.95 <−0.95 | 0.8~0.95 −0.95~−0.8 | 0.5~0.8 −0.8~−0.5 | 0.3~0.5 −0.5~−0.3 | <0.3 >−0.3 |
Publisher’s Note: MDPI stays neutral with regard to jurisdictional claims in published maps and institutional affiliations. |
© 2022 by the authors. Licensee MDPI, Basel, Switzerland. This article is an open access article distributed under the terms and conditions of the Creative Commons Attribution (CC BY) license (https://creativecommons.org/licenses/by/4.0/).
Share and Cite
Wei, C.; Guo, B.; Fan, Y.; Zang, W.; Ji, J. The Change Pattern and Its Dominant Driving Factors of Wetlands in the Yellow River Delta Based on Sentinel-2 Images. Remote Sens. 2022, 14, 4388. https://doi.org/10.3390/rs14174388
Wei C, Guo B, Fan Y, Zang W, Ji J. The Change Pattern and Its Dominant Driving Factors of Wetlands in the Yellow River Delta Based on Sentinel-2 Images. Remote Sensing. 2022; 14(17):4388. https://doi.org/10.3390/rs14174388
Chicago/Turabian StyleWei, Cuixia, Bing Guo, Yewen Fan, Wenqian Zang, and Jianwan Ji. 2022. "The Change Pattern and Its Dominant Driving Factors of Wetlands in the Yellow River Delta Based on Sentinel-2 Images" Remote Sensing 14, no. 17: 4388. https://doi.org/10.3390/rs14174388
APA StyleWei, C., Guo, B., Fan, Y., Zang, W., & Ji, J. (2022). The Change Pattern and Its Dominant Driving Factors of Wetlands in the Yellow River Delta Based on Sentinel-2 Images. Remote Sensing, 14(17), 4388. https://doi.org/10.3390/rs14174388


