Abstract
On 20 December 2021, after six quiet years, the Hunga Tonga–Hunga Ha’apai volcano erupted abruptly. Then, on 15 January 2022, the largest eruption produced a plume well registered from satellites and destroyed the volcanic cone previously formed in 2015, connecting the two islands. We applied a multi-parametric and multi-layer study to investigate all the possible pre-eruption signals and effects of this volcanic activity in the lithosphere, atmosphere, and ionosphere. We focused our attention on: (a) seismological features considering the eruption in terms of an earthquake with equivalent energy released in the lithosphere; (b) atmospheric parameters, such as skin and air temperature, outgoing longwave radiation (OLR), cloud cover, relative humidity from climatological datasets; (c) varying magnetic field and electron density observed by ground magnetometers and satellites, even if the event was in the recovery phase of an intense geomagnetic storm. We found different precursors of this unique event in the lithosphere, as well as the effects due to the propagation of acoustic gravity and pressure waves and magnetic and electromagnetic coupling in the form of signals detected by ground stations and satellite data. All these parameters and their detailed investigation confirm the lithosphere–atmosphere–ionosphere coupling (LAIC) models introduced for natural hazards such as volcano eruptions and earthquakes.
Keywords:
volcanic eruptions; explosions; lamb waves; gravity waves; ULF waves; ionosphere; LAIC models 1. Introduction
The Hunga Tonga–Hunga Ha’apai (HT-HH) volcano showed on 15 January 2022 one of the most exceptional eruptions of history [1] since the effects of the explosive eruption were observed around the entire globe.
The HT-HH volcano is located in the SW Pacific Ocean, belonging to the Ha’apai island group, which represents the center of the Kingdom of Tonga, consisting of a volcanic arc lying on the western part of the Tonga–Kermadec back arc (Figure 1). It covers an area of over 109 km2 and lies along the subduction zone, a convergent plate boundary between the Pacific and Indo-Australian plates, which form the Tonga trench, the second deepest oceanic trench on Earth. The subduction of the Pacific plate beneath the Indo-Australian one feeds the activity of this volcanic arc. This geodynamic process is responsible for the formation of the NNE-SSW aligned ridge and basin system, where the Tonga–Kermadec Trench faces the Tonga-Kermadec Ridge with its volcanoes, which is separated from the Lau-Colville Ridge by the Havre Trough.
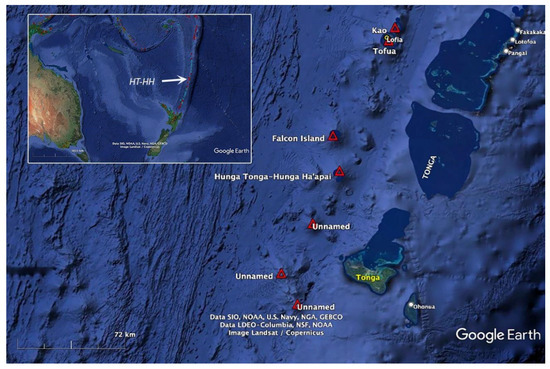
Figure 1.
Study area with a zoom of the Hunga Tonga–Hunga Ha’apai (HT-HH) volcanic region. The Tonga–Kermadec trench lies to the east of the volcanic Tofua arc where several submarine volcanoes are shown in red triangles. Source: Google Earth.
HT-HH is one of the volcanic edifices rising from the seafloor to the sea surface and a little above. It consisted in 2 km long uninhabited islets (Hunga Tonga and Hunga Ha’apai) representing the remnants of an older cone, destroyed by ancient caldera-forming eruptions. The caldera, before the 2022 eruption, was submerged, slightly SE-wards between the two islets. The volcano has been active since its first historical eruption in 1912, an underwater explosion south of Hunga Tonga. All known eruptions occurred along the rim of the submerged caldera. During the explosive eruption of December 2014, a tuff cone raised over the sea level, connecting the islands Hunga Tonga to the northeast and Hunga Ha’apai to the southwest [2]. The emerging island persisted, despite all odds, over passing erosional stages, until the last eruption that destroyed the connection material and left the two small islands.
On 15 January 2022, the Hunga Tonga volcano erupted with two main explosions in quick succession releasing an enormous amount of energy into the atmosphere, permitting the effects to be observed across the entire globe. Due to this extensive character, the event has been studied by many researchers. This recent intra-caldera uplift, together with the regular historic eruptions, indicate a gradually growing evolution of the magmatic system beneath Hunga from repeated recharge events into a relatively homogeneous andesitic reservoir [3].
There are different important aspects that several studies have investigated in detail to better understand this unique volcanic event: the exact origin time of the eruption, the energy released in the lithosphere-atmosphere, the characteristics of the ash plume, different waves propagation, and the tsunamis that originated by this event. The Global Volcanism Program [4] identified the eruption as starting at 04:15 UTC with a plume reaching 30 km in the atmosphere and 600 km in diameter. The analysis of GNSS [5] confirmed that the material ejected was lofted between 30 and 40 km approximately 1 h after the initial eruption. The relative Volcanic Explosivity Index (VEI), assigned by the Global Disaster Alert and Coordination System (GDACS), was estimated to be 6. Later, it was confirmed by [6] from their work on the explosion impulse. Again, the equivalent energy in the lithosphere was evaluated between 4 and 18 Mt of TNT (trinitrotoluene) [7], while the explosion power in the atmosphere–ionosphere was estimated to be 50 Mt [1], more than 58 Mt [8] and between 9–37 Mt [9]; this last measurement from multiple large peaks in total electron content (TEC) variations obtained for the onset HT-HH eruption trigger event at 04:18:10 UTC. Finally, USGS evaluated the eruption equivalent to a magnitude (M) 5.8 earthquake with techniques calibrated for earthquakes, based on the energy released only in the lithosphere.
In [10], different waves were described as effects of the main explosion: infrasound waves, acoustic-gravity waves, and Lamb waves. Many studies focused on the latter for its high phase speed and non-dispersive wavelengths; ref. [11] numerically simulated these atmospheric Lamb waves with similarities to ocean long waves. Among the first studies for estimation of Lamb waves speed, ref. [12] provided a horizontal speed between 300 and 350 m/s from the travelling ionospheric disturbances (TIDs) global propagation and it was confirmed by [13] with their manual picking of Lamb waves arrival at dozens of stations. As shown in [14], these waves near Tonga consist of at least two pulses beginning with a 7–10 min pressure increase, followed by a second larger compression and subsequent long rarefaction phase. Ref. [15] identified the Lamb waves as a high-amplitude monochromatic pulse with a phase speed between 308 ± 5 and 319 ± 4 m/s depending on the location and they individuated its antipodal point in Algeria, where the signal arrived 18.1 h after the eruption. Another interesting pressure record from Tamanrasset in Southern Algeria, within a few hundred kilometers of the antipodal point, suggested that the arrival of the “inbound” wave was followed within 15–20 min by two rapid falls in pressure with a speed of 310 m/s. Refs. [16,17] demonstrated that the ionospheric disturbances started ~40 min before the initial arrival of the Lamb waves, which could be explained by the faster acoustic wave velocity in the ionosphere. Moreover, the varying phase velocity of the ionospheric disturbances with different wave periods suggests that the Lamb waves excite a broad spectrum of gravity waves [18]. For the first time, pronounced and prolonged post-volcanic night-time equatorial plasma bubbles (EPBs) were observed over the Asian–Oceania area following the arrival of Lamb waves [19]. The EPBs study was explained in [20]. Again, taking the propagating pressure pulses clearly visualized by the Soretena weather stations and the angular distance of each station from the Tonga volcano, ref. [21] estimated the phase speed of the first Lamb wave to be 310 m/s with the dominant wavelength of 500–600 km. In the end, the vertical TEC (vTEC) was used to study the medium scale traveling ionospheric disturbances (MSTIDs) and the large-scale traveling ionospheric disturbances (LSTIDs). Ref. [22] used two methods to assess the speed of these disturbances: the triangulation of these irregularities from neighbouring GNSS ray paths and the trace of slope of coherent wave structures in plots of the distance from the epicentre versus time. The results showed that the first LSTIDs appeared as acoustic waves generated from the initial shock and propagated radially at speed of 950 ± 170 m/s while the first MSTIDs, corresponding to acoustic gravity waves generated by subsequent atmospheric disturbance, propagated at a speed of 337 ± 17 m/s. In addition, ref. [23] obtained wave periods and velocities for the MSTIDs consistent between the different types of data analysed.
Another important effect correlated to the explosive eruption is the tsunami. Ref. [24] was the first to describe its effects on the coasts of Mexico. The study of the tsunami triggered by the volcano continued with [25] who well modeled the air–sea-coupled tsunami with an atmospheric pressure pulse, and finally ref. [26] affirmed that the tsunami was driven by a constantly moving source in which the acoustic-gravity waves radiating from the eruption excite the ocean and transfer energy into it via resonance.
In this paper, we analyse multi-parametric (seismic, atmospheric, ionospheric, and geomagnetic) data from ground-based observatories and satellites and individuate the possible precursors, the effects, as well as the consequences that the volcanic explosion produced in the entire globe at different scales and in parameters of different nature. All these signals confirm the uniqueness of this volcanic event and the coupling between the layers of our Earth system.
From a seismological point of view, one of the lithosphere–atmosphere–ionosphere coupling (LAIC) models is based on the release of different traces of gases induced by the seismic activity to reveal their influence on the atmosphere and ionosphere. Refs. [27,28] described an interaction of gases during volcanic activities. The variations of Earth’s atmosphere due to volcanic activities are related to the eruption rate and the trace gases such as sulphur dioxide (SO2), carbon monoxide (CO), and their possible interactions between the troposphere and ionosphere layers. It is noted [29] that the appearance of some thermal anomalies in the crater area can be seen some weeks/months before explosive volcanic eruptions. These are due to rise hot material (magma, pressurized fluids); this causes the hotter isotherms to approach the surface. During the upward movement, these fluids can get in touch with the superficial waters, often of marine origin, entering also from the flank of the volcanic edifice, causing the sudden evaporation and consequent explosions, in the present case defined as a phreatoplinian eruption [13]. This increases the concentration of water vapour in the tropospheric regions just above the volcano.
A recent study [30] offers an interesting view of the electrical activity associated with volcanic plumes and how the ambient conditions together with the characteristics of the explosive materials may determine its effects.
Here we propose a complete study of the great explosive eruption of 2022 investigating the phenomenon from multi-parametric and multi-layer data. We start to present the precursors in seismological and atmospheric data that could be connected to the incipient eruption. Then, we analyse the effects of the propagation of a pressure wave in the atmosphere registered from the Italian tide gauge network. Extending our study area to the ionosphere, we present a specific analysis of the geomagnetic field from satellite data, showing peculiar precursory signals. We also present the limit of this layer study due to the geomagnetic storm in the “recovery” phase and finally we show a singular signal detected on the spectrograms from the Finnish pulsation magnetometer network. The flowchart of our analysis is shown in Figure 2. Among all the studies about this eruption, our analysis is one of the more complete considering different aspects and different temporal and spatial scales. The results obtained confirm the coupling between the lithosphere, atmosphere, and ionosphere for this volcanic event.
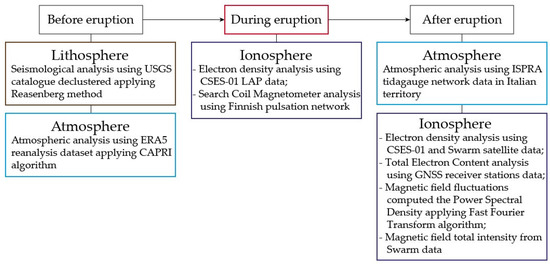
Figure 2.
Flowchart of our analysis in correlation with eruption time.
2. Geological and Geographical Setting
The volcanic edifice rises from the seafloor to above sea level, and it is visible at the surface as two small andesitic islands, Hunga Tonga and Hunga Ha’apai, made up of a succession of ignimbrites and andesitic lava flows, representing the remnants of the north-western rim of a largely submarine caldera, around 1800 m high and 20 km wide, located about 30 km SSE of Falcon Island (Figure 3). It belongs to the Tonga–Kermadec volcanic arc, part of the “Ring of Fire”. A Surtseyan eruption observed near 20.5°S and 175.4°W on 19 December 2014 combined them into one larger structure [2,31]. Previous eruptions are proved by additional welded pumice-rich ignimbrite units and non-welded pyroclastic flow deposits, below paleosols and other volcanoclastic deposits. Cronin et al. [32] using a WASSP multibeam sounder obtained a map of the entire submarine caldera and the summit platform of the submerged Hunga volcanic edifice of recent formation. The caldera appeared as a large, closed depression, around 150 m deep, probably formed by a violent collapse of the older Hunga edifice into the sea by an unknown eruption. The rim of this caldera is surrounded by numerous cones formed in previous eruptions. The floor of the caldera has been quiescent since there is information. All known eruptions in the last decades occurred around the rim of the caldera and some resulting vents and reefs were still visible from the bathymetry (Figure 3). In addition, the emerged cone, formed after the 2014–2015 eruptive activity and connecting the two islets, is located on the NW rim of the caldera.
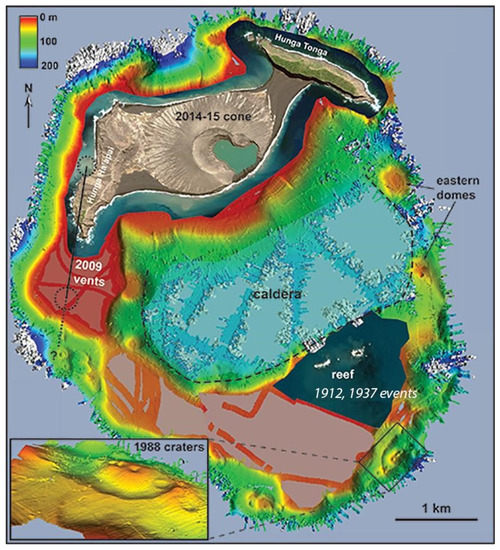
Figure 3.
Map of the summit platform of the HT-HH volcanic edifice in 2015, and the locations of recorded eruptions. Images taken from [32].
3. Materials and Methods
A multi-parametric analysis needs different datasets and investigation methods to be compared and/or integrated, each one in relation to the arrival time of the signal in the location analyzed and to the type of phenomenon to be studied. In the following we describe three groups of data, one for each macro-layer of the Earth.
3.1. Lithospheric Data
Starting from the lithospheric point of view, we carried out a seismological analysis of the volcanic region in the subduction zone. Considering the magnitude M5.8, attributed to the volcanic event by the United States Geological Survey (USGS), we use the USGS catalogue in the period between 1 January 2021 and 16 January 2022. Taking into account the zone of effective manifestation of the precursory deformations as defined by the Dobrovolsky area [33] with a radius R = 100.43M = 312 km, we selected 388 events and obtained the first map of Nuku’alofa—the capital of Tonga—seismicity. We proceeded to calculate a cumulative trend of the events with a magnitude equal to or larger than Mc = 4.3 (Mc indicates the magnitude of completeness), computed as a function of time by sliding the time windows, each containing 150 earthquakes and stepping by 5 events.
The estimation of the magnitude of completeness permitted us to evaluate the revised accelerated moment release (R-AMR, introduced in [34]), the variation of b-value or the seismic quiescence, which provides a measure for the relative abundance of the strong to weak earthquakes and is considered to be related to the tectonic regime of the area under consideration, or the seismic quiescence.
3.2. Atmospheric Data
The European Centre for Medium-range Weather Forecasts (ECMWF) Reanalysis v5 (ERA5) is centred on physical variables related to thermal radiative interaction between atmosphere and surface: skin temperature (SKT), air temperature (T2m—measured at 2 m of height), outgoing longwave radiation (OLR), cloud cover, relative humidity, ozone, surface pressure. This dataset provides hourly estimates of a large number of atmospheric, land, and oceanic climate variables; it covers the Earth at 0.25° × 0.25° spatial resolution resolving the atmosphere using 137 levels from the surface up to a height of 80 km. Comparing the 2022 time series with the period 1980–2021, we were able to identify anomalies, possibly due to volcanic eruptions in the Dobrovolsky area.
3.3. Ionospheric Data
To analyse the effects on the ionosphere, we considered information from the ground, using geomagnetic observatories and ionosonde data, and from satellites. These last data come from ESA Swarm three-satellite constellation (Alpha, Bravo, Charlie, indicated with only capital letters in the text) and CSES-01 satellite (China Seismo-Electromagnetic Satellite). Alpha and Charlie fly side-by-side at around 460 km of altitude, Bravo at 510 km, and CSES-01 at about 500 km.
For Swarm magnetic field data, we downloaded both Level 1b low (1 Hz) and high (50 Hz) resolution data from all satellites for the eruption day and two days before (13–15 January 2022). The magnetic field vectorial data come from the Vector Fluxgate Magnetometer (VFM), while magnetic field intensity measurements are provided by the Absolute Scalar Magnetometer (ASM, available only at 1 Hz resolution). These datasets are provided in Common Data Format (CDF) and freely available in the ESA Swarm FTP and HTTP Server swarm-diss.eo.esa.int.
Regarding the CSES-01 satellite, it is equipped with a high-precision magnetometer (HPM) composed of two fluxgates and a coupled dark state scalar magnetometer (CDSM) on one of its booms that allow us to investigate the magnetic field measurements. For plasma measurements (as electron density and temperature), we considered Langmuir probes (LAP), also in the case of Swarm. The CSES LAP can measure electron density (Ne) over a range from 5 × 10² to 1 × 107 cm−3 and the electron temperature from 500 to 10,000 K. For Swarm electron density data, we considered EFI LP (2 Hz), baseline 0501.
4. Results
4.1. Investigation of the Preparation of the Volcanic Explosion of Hunga Tonga–Hunga Ha’apai of 15 January 2022
4.1.1. Seismological Data Analysis
The nearest seismic station (~760 km) to Tonga, Monasavu—Fiji (code MSVF_II), showed an interesting vertical component trend at 04:00 UTC. Since this trend presented the first impulse on the top, we could connect it with the explosive eruption. Then, we proceeded to calculate a cumulative trend (Figure 4) of the 388 selected events with a magnitude larger than or equal to Mc 4.3. After declustering the catalogue using the Reasenberg method [35] for the Mc value, we obtained the b-value trend in time [36], with values between 1.2 and 1.4. For volcanic earthquakes, we would expect the b-value to be about 1.5 [37]. However, since we considered a larger area, corresponding to an equivalent earthquake magnitude of M5.8, most of the seismicity was tectonic: this would explain why the found b-value is a little lower than 1.5.
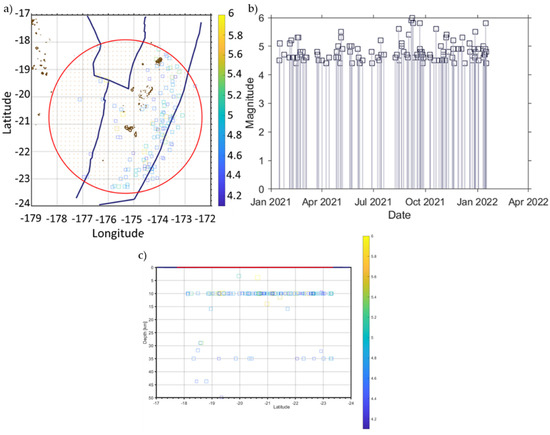
Figure 4.
Seismic analysis, in particular: (a) Map of seismicity within the Dobrovolsky area; (b) distribution of magnitude with time; (c) seismicity distribution in depth.
Furthermore, we analyzed the accelerating seismicity (Figure 5) before the explosion by applying the R-AMR method [34] to the USGS declustered catalog in order to evidence a power-law diverging function with time for the cumulative value of the Benioff strain [38]. With this scenario, due to its gradual increase, we considered the main eruption as the mainshock of the sequence (USGS estimated an equivalent earthquake magnitude of 5.8). The acceleration seismicity in the earthquake preparatory phase is given by the so-called C-factor [39,40]. The C-factor is defined as the ratio between the root mean square (rms) of the residuals of the non-linear (power-law) fit and the root mean square of the linear fit: the lower this parameter, the more acceleration we have in the seismic data. The resulting C-factor is about 0.7 indicating a slow increase in seismicity. Interestingly, the predicted magnitude is in the range of 6.4–6.7, larger than the equivalent magnitude for the energy released in the lithosphere, even including part of the one released in the atmosphere.
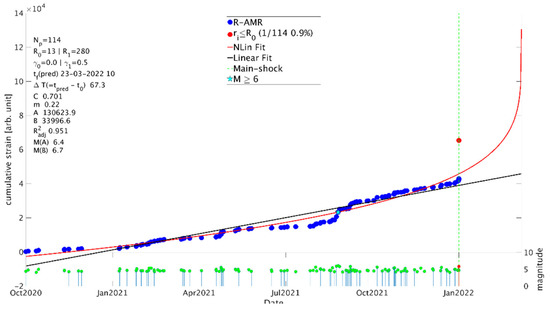
Figure 5.
The R-AMR analysis of the USGS catalog around the 2022 Hunga Tonga eruption (lat −20.55° lon −175.38°) for the M5.8 equivalent earthquake. The algorithm evidenced a low increased seismicity a few months before the explosive event. See [40] for more details about this analysis method.
The found results are a confirmation that a clear distinction between tectonic and volcanic seismicity is not possible when analysing a large region. Only considering a smaller area coinciding with the size of the volcano would in principle provide a better representation of the volcanic seismicity. However, no seismic stations were available on the HT-HH volcano before the eruption, so we had to resort to USGS data over a larger region. Nevertheless, it is interesting that we find some signals of the preparation of the great eruption even in the behaviour of mostly tectonic seismic events, in terms of b-value and R-AMR. Our results would confirm that the tectonic seismicity had some role in the preparation phase of the eruption, as an inter-relation between tectonics and volcanism. This would also explain the huge energy released into the atmosphere by the eruption.
4.1.2. Atmospheric Data Analysis
As described in the LAIC models proposed until now, the release of trace gases (especially SO2 and CO) by a volcanic event would be responsible for air ionization through various chemical reactions with other gases in the atmosphere. Ref. [41] showed some results analysing stratospheric aerosol and water vapour perturbations due to this eruption. We analyzed the ERA5 reanalysis dataset with the application of the Climatological Analysis for Seismic PRecursor Identification (CAPRI) algorithm [42,43]. It is based on the comparison between the surface/atmospheric parameters in the three months preceding the event with those of the historical time series of 40 years in the same seasonal period (Figure 6). The anomalies are effective if they positively overpass the mean of twice the standard deviations of the respective historical time series. A comparison with the same parameters analysed during the same period before a fictitious event on 15 January 2021 (i.e., one year before the volcano explosion) allowed for the validation of the anomalous days. In the respective spatial map (Figure 7), we can better individuate the distribution of the parameter values compared to the volcano position, indicated with a small star, during the detected anomalous days.
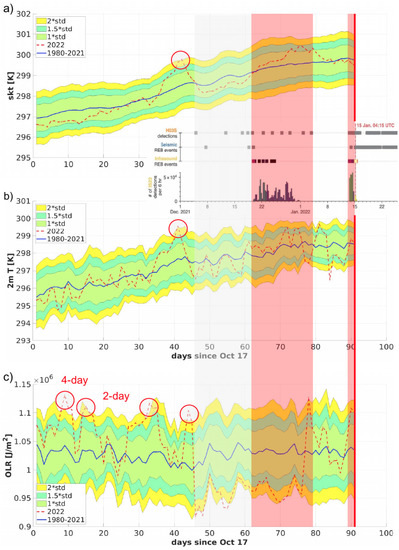
Figure 6.
Case study for 2022 Hunga Tonga volcanic eruption ECMWF (a) SKT, (b) T2m, (c) OLR. The comparison between the 2022 time series (dashed red line) and the historical time series (1980–2021, blue line) is shown. For the latter, we also represented the 1.0 (cyan), 1.5 (green) and 2.0 (yellow) standard deviations from the mean, respectively. The circle puts in evidence the identified anomalies. The eruption occurred at the end of the analyzed period (90 days) as indicated by the red vertical line. Red shaded areas highlight periods of eruptive activity as also detected remotely by the analysis of co-eruptive seismic, hydroacoustic, and infrasound signals since December 2021 (modified from [14]). Reprinted with permission from AAAS. The grey shaded area instead highlights a period of pre-eruptive seismic and hydroacoustic detections.
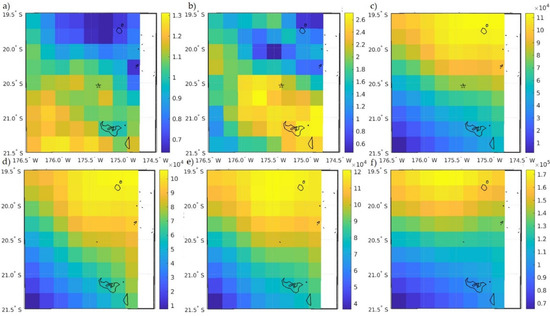
Figure 7.
Case study for 2022 Hunga Tonga volcanic eruption ECMWF (a) SKT, (b) T2m, (c–f) OLR (25 October, 31 October, 17 November, 29 November) anomalous day maps in terms of difference with respect to the historical mean. The stars indicate the volcano’s position.
Starting with the SKT (Figure 6a), we saw an anomalous day on 27 November 2021 (48 days before the eruption); the day before we identified an anomaly on the 2 m temperature (Figure 6b). The latter shows the absolute maximum on the SW side of the volcano as shown in the map in Figure 7, so it is more plausible the connection to the volcanic eruption. OLR reveals various persistent anomalies (Figure 6c): one 4-day persistent starts on 25 October 2021 (81 days before the eruption), two 2-day persistent starts on 31 October (75 days before the eruption), and 17 November (58 days before the eruption), respectively. Moreover, we saw two anomalies on 29 November and the last one on 2 January 2022. We also analysed some more parameters, not shown here. The cloud cover also shows an anomaly on 9 November 2021 that could be related to the eventual air ionization that can induce the formation of clouds. Again, the ozone concentration presents an anomaly on 30 October 2021, but the distributional map of this day shows that the anomaly is not centred in the volcano, so probably it is not correlated to the event. In addition, the surface pressure individuates a little anomaly on 19 December 2021, but since in the anomalous day map the anomaly is not centred on the volcano, we excluded it as a possible influence on the preparation of the eruption.
We also show the main results from [14], where it is interesting to note that the pre-eruptive seismic and hydroacoustic detections (the grey shaded area in Figure 6) followed the atmospheric anomalies around 45 days before the explosion. Red shaded areas highlight periods of eruptive activity as also detected remotely by the analysis of co-eruptive seismic, hydroacoustic, and infrasound signals since December 2021 (modified from [14]).
In order to confirm these anomalies, we observed the parameters in the same seasonal period of 2020–2021 (in the absence of volcanic eruption) and no anomalies were detected.
4.2. Results concerning the Effect of the Hunga Tonga Volcano Explosive Eruption of 15 January 2022 All around the Globe
4.2.1. Atmospheric Data Analysis
Considering that the effects of this volcanic event on atmospheric parameters were distributed over the whole globe, we also performed a meteorological analysis in Italian territory. We calculated the HT-HH—Italy (20.57°S, 175.38°W; 42°N 12°E respective coordinates) shortest distance from the website by Movable Type Ltd. (https://www.movable-type.co.uk, accessed on 15 June 2022) that is 17,530 km. Since the pressure wave is the parameter that mainly influenced on the meteorological effects of the volcanic event, and such effects travel at the speed of sound, depending on the temperature, we calculated this speed coherent to the 0–10 °C—winter temperature in which the wave passed in Northern Hemisphere—and the value is 1195 km/h. It means that they arrived in Italy at around 20:00 UTC on 15 January 2022. We further calculated a second arrival of the signal, at 6:00 UTC on 17 January.
The data used for this analysis come from ISPRA’s (Italian Institute for Environmental Protection and Research) National Tidegauge Network (https://www.mareografico.it/?syslng=ing, accessed on 15 June 2022), consisting of 36 environmental monitoring stations located along the Italian coasts. Since the wave came from approximately the north direction, we considered stations at different latitudes (Figure 8).
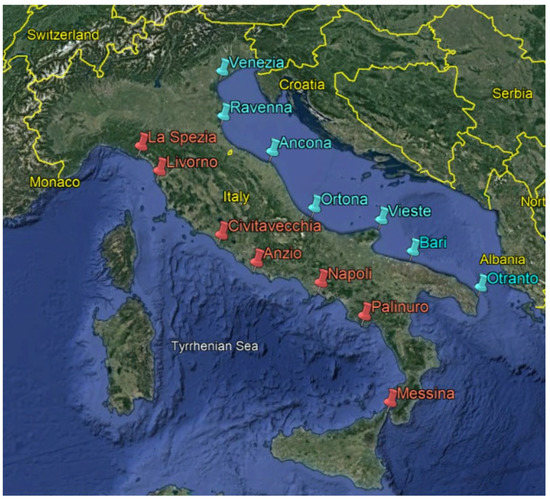
Figure 8.
Location of tide gauge stations analyzed: the Tyrrhenian coast is red and the Adriatic coast is light blue. (Modified from Google Earth).
To search for a fine estimation of the direction of the wave, we separated the Adriatic and Tyrrhenian data. We focused our attention on atmospheric pressure, air temperature (measured at 2 m of altitude), and relative humidity, which are the principal parameters influenced by volcanic explosions on the occasion of larger eruptions and, in turn, Lamb waves. All the parameters were analyzed using hourly data. In the atmospheric pressure (Figure 9), we individuated a peak value in correspondence to the pressure wave arrival on both coastal sides. From the comparison with the 2020 data, we saw that the general trend is concordant with our analysis, but the identified increase was absent, confirming the peculiarity of the data after the volcanic explosion.
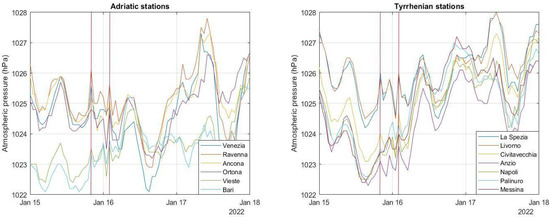
Figure 9.
Atmospheric pressure in comparison between Adriatic (left) and Tyrrhenian (right) stations: the vertical bars correspond to the first arrival and second arrival of the pressure wave.
Concerning the air temperature and relative humidity, we did not observe clear evidence of the eruption influence, in terms of Lamb waves. In addition, the mean values of 2020 are coherent with those analyzed.
To better appreciate the late arrival of the pressure wave from north to south stations, we examined the same parameters data sampled every 15 s and downloaded from ISPRA’s TAD Server (https://tsunami.isprambiente.it/Tad_Server, accessed on 15 June 2022). The better temporal resolution allowed us to distinguish the temporal delay—between 20 UTC and 20:15 UTC—of the pressure wave in stations at different latitudes and longitudes, again separating the Tyrrhenian (Figure 10a) and Adriatic stations (Figure 10b). Furthermore, we can see the pressure wave arrived before on the Adriatic coast and minutes later on the Tyrrhenian side, confirming its northeast direction.
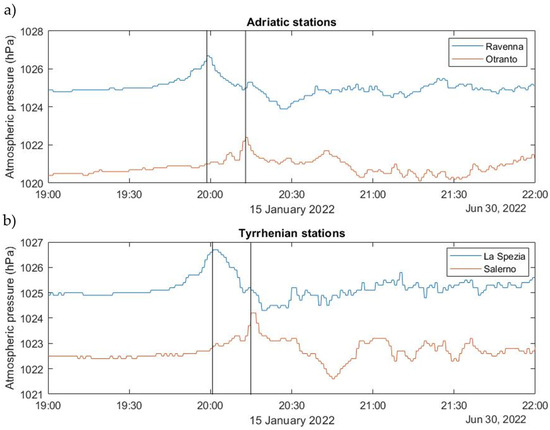
Figure 10.
Late arrival of the pressure wave individuated in atmospheric pressure data: (a) from Ravenna to Otranto stations (Adriatic coast); (b) from La Spezia to Salerno stations (Tyrrhenian coast).
4.2.2. Geomagnetic Field and Ionospheric Electron Density Data Analysis
In this section we investigate possible signatures of seismic shake or possible direct electromagnetic emissions produced by the eruptive event in the geomagnetic field and ionospheric electron density. We considered the region around the volcano using both ground magnetic data coming from geomagnetic observatories and magnetic and electron density data from low earth orbit (LEO) Swarm and CSES satellites.
First, we focused on the geomagnetic observatories data from the INTERMAGNET database from 13 to 15 January 2022. The only operating observatories close to Hunga Tonga and its magnetic conjugate point were API (Apia—Western Samoa, geographic coordinates 13.82°S, 171.78°W), PPT (Pamatai–Papeete, French Polynesia, geographic coordinates 17.57°S, 149.57°W) and SHU (Shumagin, USA, geographic coordinates 55.35°N, 160.46°W) observatories. The vectorial magnetic data collected (X, Y, Z) present a sampling rate of 1 min and we calculated the first differences to highlight eventual signatures due to the volcanic explosion. In the API observatory, there is a signature in the proximity to the principal eruption that is not observed in the other observatories. Previously, ref. [44] showed a high-frequency signature visible in both API’s vertical and horizontal components suggesting an external ionospheric origin. Indeed, these data are very affected by the geomagnetic storm running on the day of the main eruption as we can see when comparing magnetic data with the evolution of the Dst index. There is a clear evidence of the geomagnetic storm effect reflected as an increase of the amplitude of the first differences data at the beginning and during the geomagnetic storm. However, we can see that API, the closest observatory to the volcano, detected an interesting magnetic perturbation at the same time (04:16 UTC) that the two seismic stations MSVF (Monasavu, Fiji, geographic coordinates 17.75°S, 178.05°E) and AFI (Afiamalu, Samoa, geographic coordinates 13.91°S, 171.78°W) recorded the arrival of the seismic waves P (04:16 UTC) and S (04:18 UTC), produced by the volcano explosion. This means that this effect observed in the geomagnetic observatory seems mechanical and not a magnetic disturbance eventually produced by the volcanic eruption.
Then, we examined the magnetic field fluctuations at Swarm’s altitudes during the eruption day (15 January 2022). The satellite magnetic signals were recorded with a sampling frequency of 50 Hz in the north–east–center (NEC) reference frame, and were tapered with a 400 s Hamming moving time window (frequency resolution 2.5 mHz). Before performing the spectral analysis, the magnetic data were differentiated in order to: (a) Reduce the typical red-noise trend of the spectra in the ionosphere (i.e., [45] for magnetospheric applications); (b) mitigate the effect of satellite’s low polar orbits which determines an apparent high variation of the main magnetic field in each time window as trends or offsets, due to standard latitudinal dependence of geomagnetic field. We computed the power spectral density (PSD) through a fast Fourier transform algorithm applied to magnetic field measurements. The resulting spectra were then smoothed over 3 adjacent frequency bands by using a triangular window (final frequency resolution ~5 mHz, i.e., [46,47,48]). The final spectra were not converted by means of the transfer function of the difference in order to make more clear ultra-low frequency (ULF, 1 mHz–5 Hz) signals.
First, we focused our attention on the time interval 21–22 UTC, which just followed the great eruption: the differentiated magnetic signals for Swarm A and B are reported in Figure 11 (panels a and d, respectively). We performed a dynamic spectral analysis by moving the 400 s time window by time steps of 14 s. The resulting total PSDs, i.e., the sum of the PSDs of each magnetic field component, are shown in panels c and f. The high fluctuation and power levels observed at the beginning and at the end of the interval shown in the figure correspond to the high latitude sectors of the Swarm satellite’s orbit (|λ| > 55–60°) and are due to standard polar geomagnetic phenomena. The dynamic spectra clearly show the occurrence of ULF fluctuations approximately in the ~1–150 mHz frequency range, while at higher frequencies no significant signals emerge. Interestingly, the PSD also seems to be symmetric around the equator, which is crossed approximately at 21:51 UTC by Swarm A and at 21:47 UTC by Swarm B (λ = 0 is indicated by horizontal dashed lines in panels b and e). As highlighted by higher values of the PSD, the ULF activity is more intense at Swarm A altitude, which is lower than the altitude of Swarm B.
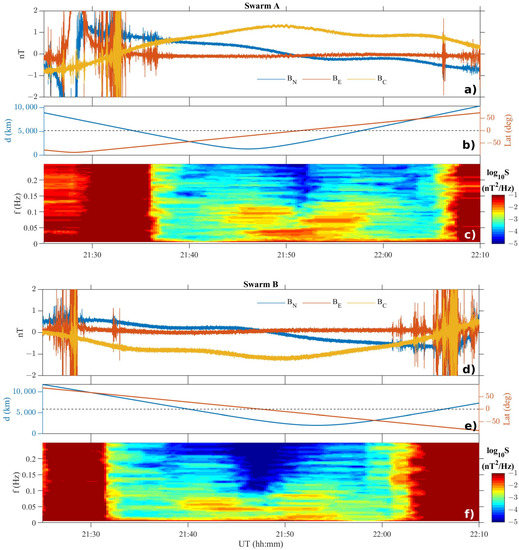
Figure 11.
Differentiated magnetic data from Swarm A and B (panels (a,d)) during 15 January 2022, together with the satellite-volcano distance ‘d’ and the satellite geographic latitude ‘λ’ (panels (b,e)) and sum of the PSD of all components, here indicated with S (panels (c,f)). The large high power intervals at high latitudes (|λ| > 55–60°) are due to polar phenomena.
We improved our investigation on PSD behaviours by extending it to the whole day of 15 January 2022. We restricted the analysis to time intervals for which the satellite–volcano distance was lower than 7000 km and the absolute value of the satellite latitude did not exceed 40°. Finally, we computed the power, hereafter indicated as the LEO ULF power track, by integrating the total PSD in the 1–150 mHz frequency range. Figure 12 shows ULF waves power tracks for both Swarm satellites. As for Figure 11, by visual inspections of the whole region, it can be seen that higher average power levels are attained at Swarm A altitude. Interestingly, the power track levels seem to be independent of local time, suggesting that our observations are probably related to large local sources in the area around the volcano (indicated by a star): that signals probably came from the examined regions below the satellites.
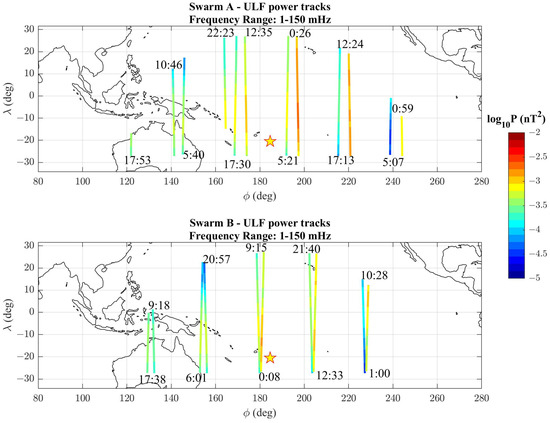
Figure 12.
Power tracks in the 1–150 mHz ULF range at Swarm A (top) and B (bottom) during 15 January 2022. The local times of the track beginning are indicated. Both satellites show power tracks with higher values in a large region around the volcano, almost independently of the local time. The volcano position is marked by a star.
Further, we analyzed the Swarm tracks passing in a Dobrovolsky area of M7.3—we considered a major magnitude with respect to the one attributed to the eruption since the energy released in the atmosphere is bigger than the energy released at the surface (as described in [7] and more detailed [14]) over the conjugate magnetic point of the volcano eruption. In this case, we examined the magnetic field components and the total intensity F recorded with a sampling frequency of 1 Hz. Here, we follow the MASS method (ref. [49] for more details about the method). According to the above-shown investigations, all-time series were differentiated. In the tracks of all satellites on 13 January, there was an interesting signal. We report Swarm A as an example in Figure 13.
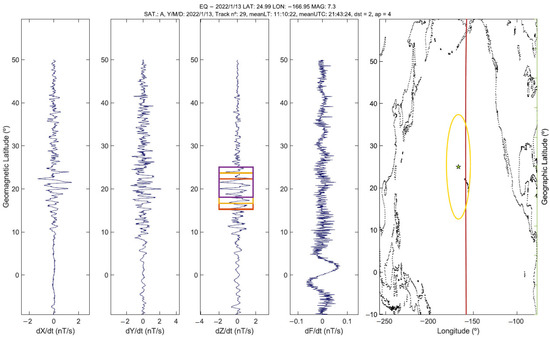
Figure 13.
Swarm satellite track passing over the Dobrovolsky area (yellow oval in the geographic map; the star represents the conjugate point of the volcano location) on 13 January 2022 at 21:43 UTC. From left: first differences of X, Y, and Z components and total intensity F, geographic map. It is evident an anomaly signal in the Z component of the magnetic field. Anomalous windows that overcome 2.5 times the root mean square of the whole satellite track are marked.
The day before the eruption, a signal started probably due to the volcanic event, seen from all satellites. On the same day of the explosive eruption, the disturbance of the geomagnetic storm covered any eventual signal in the components of the geomagnetic field.
To detect eventual electromagnetic anomalies possibly connected to the volcanic eruption, we investigated Swarm and CSES-01 magnetic and electron density (Ne) datasets. Unfortunately, in the days near the volcanic event there was a relevant geomagnetic storm with a minimum Dst index equal to −94 nT at 23:00 UTC on 14 January 2022.
To better visualise the geomagnetic signal on the eruption day, we compared the first differences of the total intensity F (mag-F) of the three Swarm satellites (Figure 14).
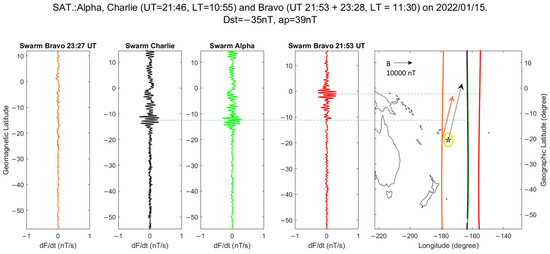
Figure 14.
Comparison of the first differences of the total intensity F (mag-F) of the three Swarm satellites. On the rightmost picture the geographic map showing the satellite tracks, with the same colours of the first differences graphs. The arrows represent the horizontal directions of the geomagnetic field as measured from the Swarm B satellite (orange) and given by the global geomagnetic field model IGRF-13 at the sea level (black).
Swarms A and C showed almost the same signal since in this period they were flying at a closer distance (0.2° of longitude) with respect to the standard orbit separation at the equator (1.4° of longitude). Furthermore, Swarm B track is really interesting, providing more information which permits a better understanding of the signal detected by Alpha and Charlie satellites. Swarm B passed at 21:53 UTC on the east side of Hunga Tonga and at 23:27 UTC on the west side. The first track showed some disturbance at about the latitude of the volcano, while the second one did not present any disturbances. To explain this particular situation, we proposed two scenarios: the first is that the signal influenced by the phenomenon disappeared in the time period of the second passage of the Swarm B. The second one suggests that the volcano magnetic disturbance was likely propagated along the magnetic field direction. The latter was calculated with the IGRF-13 (International Geomagnetic Reference Field) model [50], at sea level and reported as a black arrow in the figure, and also extracted from direct measurements of ASM of the Swarm B at its altitude and it has been shown by an orange arrow.
At this time, we were able to analyse the Langmuir probe (LAP) data—inherent to the electron density in the ionosphere in situ—from the CSES-01 satellite relative to the day before and the same day of the volcanic event. On the day before, we saw in different tracks close to the equator a common disturbance that, due to its shape and recurrence, we propose as an instrumental or cross-talk: probably it could be due to an interference with the rotation of the solar panel conducted about the equator to optimize the solar irradiation on the same panel. For further analysis, we plotted the electron density during the time of the explosion of the Hunga Tonga volcano, shown in Figure 15.
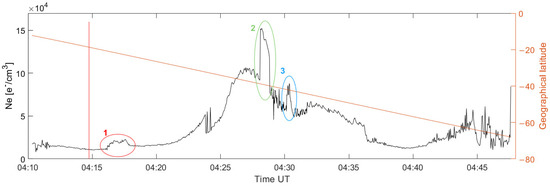
Figure 15.
CSES LAP Ne during the time of the major explosion of Hunga Tonga volcano on 15 January 2022 at 04:20 UTC. The circles with numbers mark the observed disturbances on the track.
We saw principally one disturbance and two spikes. The disturbance number 1 in the red circle has been recorded just after the volcano explosion (red vertical line) and could be explained only as an electromagnetic wave if it was produced by the volcanic explosion. The first spike (disturbance number 2)—evidenced on the green circle—was around 8 min after the eruption; at this time, we expected that the possible acoustic-gravity wave signal reached the F2 ionospheric layer. The second spike (disturbance number 3 in blue circle), detected 10 min after the eruption, is caused by instantaneous illumination changes of the probe surface when the boom of the electric field detector in the windward panel shades the LAP [51]. We also represented the whole day CSES-01 and Swarms B—C Ne maps divided for day and night time—Figure 16 left and right, respectively—(as the ionosphere is significantly different). In the CSES-01 tracks (Figure 16A,B), no data were available after 15:00 UTC due to maintenance operations on the satellite.
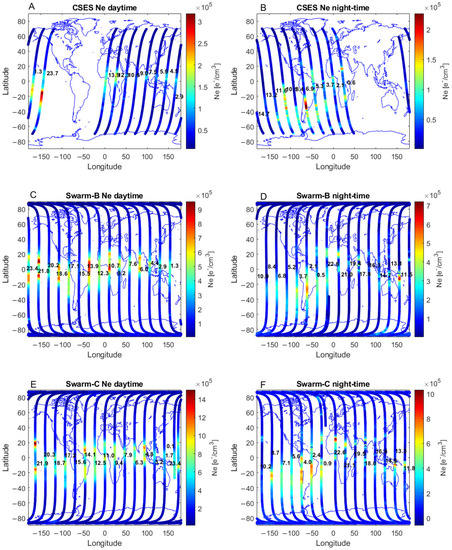
Figure 16.
CSES-01 Ne maps are divided for day and nighttime (left and right, respectively), the UTC time is represented near the track. (A,B) CSES-01; (C,D) Swarm B; (E,F) Swarm C tracks.
In the CSES-01 Ne night-time map (Figure 16B) we can see two signals. One centred in South America registered 2.7 h after the eruption at 10156 km from the volcano, and thus it could not be generated by the pressure wave of the event. The second one was in the Pacific Ocean, 5.8 h later than the eruption, and thus compatible with the pressure wave arrival at this location, considering the speed of sound in the air. In both Swarm satellites (Figure 16D,F), we have a cross-detected signal of South America around 2 h before the main eruption, the same seen in CSES-01 tracks. Another interesting signal, seen in these figures, is centred between Australia and New Guinea at 13 UTC, i.e., 9 h after the main explosion. It could be an effect of the enormous plume of SO2 that were moving in this direction [5]. In the Ne day time maps (Figure 16C,E) we see different signals around the magnetic equator that can be interpreted as a signature of the Equatorial Ionospheric Anomaly (EIA).
To further check this possible connection, we analyzed the time derivative of surface pressure from the ECMWF ERA-5 dataset with the CSES-01 track at the same time of satellite passage, i.e., 10 UTC (Figure 17). The satellite effectively crossed the pressure first wavefront at the latitude signal individuated in Figure 16, causing the electron density variation between −20° and +10° geographic latitudes. The lower latitude, between −50°N and −30°N, perturbations of electron density seem to correspond with perturbations of surface atmospheric pressure, but they are probably associated with other phenomena (e.g., weather) as the volcanic pressure wave still had not reached such distances at that time.
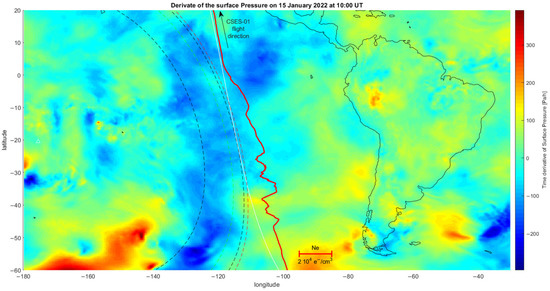
Figure 17.
Time derivative of surface pressure from the ECMWF ERA-5 dataset and CSES-01 track (red line) at 10 UTC; two black dashed lines represent the pressure wavefront prevised at 09 UTC and 10 UTC considering the velocity of 1100 km/h. These two times are representative of the time interval that we suppose the map is sensible. CSES-01 satellite entered the represented area (latitude of 60°S) at 09:44 UTC and the estimated position of the front pressure wave is represented by a green dashed line. It exits (latitude of 20°N) at 10:05 UTC and the corresponding estimated position of the pressure wave is represented by a red dashed line.
4.2.3. Ionosonde Analysis
As we mentioned before, the Hunga Tonga eruptions occurred during a geomagnetic storm. The Auroral Electrojet (AE) index is shown in Figure 18. In particular, in the South Hemisphere between longitude 90–225°E and in latitude 60°S–0 a negative ionospheric storm occurs at 23 UTC on 14 January until 16 January 2022. In this condition, the effect of volcanic eruption on the electron density could be covered by the storm effect as we saw previously.
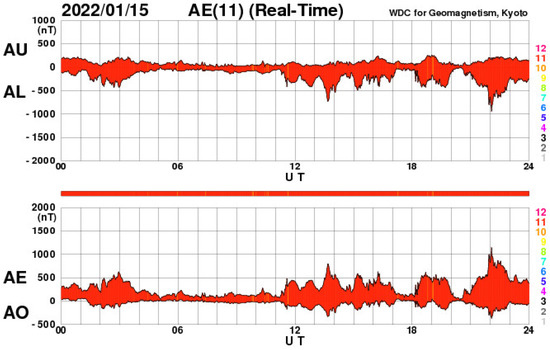
Figure 18.
Auroras Electrojet (AE) index distribution on 15 January 2022, day of major Hunga Tonga volcanic eruption.
Using the global ionosonde network (see Table 1 for more information about the ionosonde observatories considered), we analyzed the parameter foF2, defined as the highest frequency at which the ionosphere reflects vertically. foF2 increases at 05 UTC but the same effect is seen on the previous day, so we cannot consider it connected to the volcanic activity (Figure 19).

Table 1.
List of ionosonde observatories used in this work. No information about ionosonde of Khabarovsk and Wake Island is available.
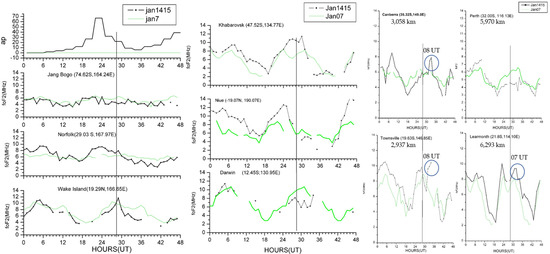
Figure 19.
Ionosonde data analysis on 15 January 2022, day of major Hunga Tonga volcanic eruption.
4.2.4. TEC Data Analysis
In order to further check the effect of the eruption on the ionosphere, we inspected the vertical Total Electron Content (TEC) maps produced by the International GNSS Service (IGS) (https://cddis.nasa.gov/, accessed on 15 June 2022). The daily dataset contains spatial gridding of the TEC values derived from the dual-frequency GNSS receiver stations data worldwide. We focused on the nearest grid point location with respect to the volcano, i.e., at (lat, lon) = (−20°, −175°). Figure 20A shows the direct comparison among the TEC values (in TECU) measured on 15 January and the same observable on the days before and after it. It is noticeable the appearance, on the day of the eruption, of a prolonged decrease (evidenced by the red ellipses), especially if compared to the day before when such a feature is absent. In addition, this behaviour seems present (although to a lesser extent) even on 16 January (inside the smaller red ellipse). By superposing the Dst index (Figure 20B) to the three days long time series (Figure 20C), we noticed that both the decrements on 15 and 16 January appeared just during the recovery phase of the geomagnetic storm, which started around the end of the 14 January. We cannot exclude a priori that these decreases were manifestations of the storm, even if we observe that apparently, no manifest variation coincides with the maximum of it across 14 and 15 January, probing for a possible relationship with the volcanic eruption. At the same time, we cannot ignore the intense lightning activity that accompanied the eruption [13]: this could have played a decisive role in the variation of TEC [52].
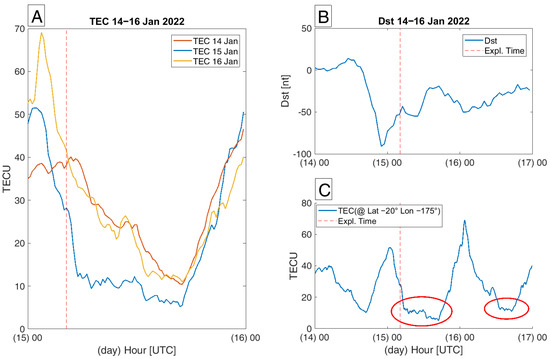
Figure 20.
Total electron content (TEC) data from 14 to 16 January 2022. In (A) there is the comparison of the three TEC time series as a function of the hour of the day (UTC): it is evident the lowering of the TEC values on the eruption day (15 January) compared to the previous and following days; (B,C) show the simultaneous behaviour of the Dst and the TEC time series.
4.2.5. Search Coil Magnetometer (SCM) Data Analysis
In addition, we retrieved the search coil magnetometer (SCM) data from the Sodankylä Geophysical Observatory (https://www.sgo.fi/Data/Pulsation/pulData.php, accessed on 15 June 2022), which furnishes continuous measurements of the Earth’s magnetic field, cosmic radio noise, seismic activities, and cosmic rays. This Finnish pulsation magnetometer network includes four stations equipped with two three-component search coil magnetometers (station names, monitoring start dates, and coordinates are considered in Table 2). Recordings are made by a 24-bit 250 Hz sampling system with a cut-off filter at 35 Hz. The timing of the data is based on the GPS Precise Positioning Service (PPS) with a 10 MHz reference. The stations are able to detect regular geomagnetic pulsations, Alfvén resonators, and Schumann resonances. Moreover, the Earth’s cavity resonances crossing the troposphere and stratosphere can be directly influenced by the eruption.

Table 2.
Search Coil Magnetometer (SCM) stations of Sodankylä Geophysical Observatory (SGO) Finnish pulsation magnetometer chain details.
In order to identify a possible signal from the volcanic event, we selected all stations in a wider band—to have a compressive view and evidence of the first two Schumann resonances.
Figure 21 shows the total power (expressed in dB) of data acquired on 15 January 2022 from four Finnish observatories by means of search coil magnetometers [53] presents anomalous dynamic spectra detected at particular observatories located in France, Italy, Russia, and Japan during the eruption day. All the spectrograms show high total power at 7–9 Hz and at the upper harmonics (about 14 Hz), frequencies characteristic of the Schumann resonance and where the effects of global lightning activities are searched. What is relevant is the marked increase in energy between 04:15 and 05:45 UTC, in a wider range of frequency (i.e., a higher power from 6 to 18 Hz), a phenomenon that interested all the Finnish observatories. We believe that a spotlight should be pointed to the following observations: (1) the occurring time is coherent with the Hunga Tonga eruption and the consequent wave propagation time; (2) the analysis of the same observatories in other periods does not show any anomalous signal. Thus, we could suppose that the features detected in the spectrograms could be the effects of the volcanic thunderstorm associated with the friction of particles recorded in the cloud of ash and gas produced by the eruption.
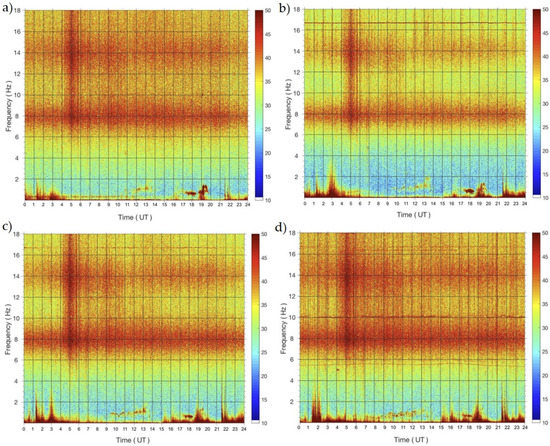
Figure 21.
Spectrograms of 15 January 2022 revealed by the search coil magnetometers of the Finnish stations: (a) Nurmijärvi, (b) Oulu, (c) Sodankylä, (d) Kevo.
5. Discussion
Before the main eruption of Hunga Tonga, we identified a weak seismic acceleration in the stressed zone. From our experience on the seismicity induced from volcanic events, we could attribute this seismicity increase to the imminent explosion, as tectonics and volcanism had an inter-relating role in the preparation phase of this unique energetic event. Also among the effects prior to the eruption, we saw different anomalies in atmospheric parameters such as skin temperature (SKT), air temperature (T2m—measured at 2 m of altitude), and outgoing longwave radiation (OLR) and these show the geographical distribution of their maximum values approximately near to the volcano Hunga Tonga. We also analysed data coming from geomagnetic observatories near the volcano. They are very influenced by the geomagnetic storm occurring during the eruption day, but we found an interesting effect in the closest observatory API. However, we see that it was probably due to the passing of the seismic wavefront as registered for the near seismic station AFI.
An eruption of this explosivity (estimated as VEI = 6) generates various phenomena on a global scale. In the atmosphere, we could observe the arrival of the pressure wave at different latitudes and distinguish the Tyrrhenian and Adriatic coasts with a peak of atmospheric pressure data at the time calculated for this arrival considering a velocity of around 1100 km/h. Furthermore, we analysed the magnetic field fluctuations at Swarm altitude and the power spectral density (PSD) on the time interval 21–22 UTC on 15 January 2022. It was interesting to note that the latter parameter seems to be symmetric with respect to the equator. Extending the analysis for the whole day, the power track level shows the independence of the local time, suggesting the probable relation to large local sources in the area around the volcano. Other signals probably inherent to the eruption are individuated in the Swarm tracks on the scalar intensity of the magnetic field on the evening of the day of the event (15 January 2022). The location of the scalar residual of the magnetic field obtained from the Swarm constellation is coherent with the field direction considering the IGRF-13 model supposing the source of the signal was at the volcano. On the other hand, we also analysed the CSES-01 electron density and found a signal in the Pacific Ocean compatible with the pressure wave arrival at this location. In particular, CSES-01 satellite flew almost tangent to the front of the pressure wave at about 10 UTC recording oscillations of Ne possibly due to the acoustic gravity waves induced by the Lamb wave. The satellite data present limits due to their orbit and the instrument’s sensibility. The ionosonde data were really disturbed by the geomagnetic storm of this period, and thus, analysing the foF2 parameter, we were not able to discern any volcanic effect. Moreover, the total electron content shows an abrupt and particular decrease on the eruption day, whose time persistence is unique. Finally, we observed the activation of Schumann resonance and close frequencies on the interval time of the eruption explosion in all the Finnish network observatories.
The timeline of all anomalies detected before and after the great eruption is shown in Figure 22, representing a chronological summary of the found anomalies in the different geolayers and demonstrating that, not only the consequences of the eruption were affecting the entire globe, but also its preparation involved a very large area, much larger than the local volcanic cone.
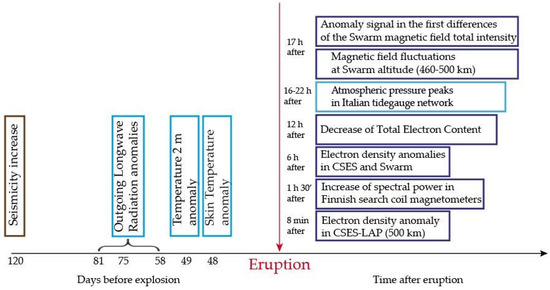
Figure 22.
Timeline of the detected anomalies before and after the large eruption of 15 January 2022.
6. Conclusions
In this article, we applied a multi-parameter and multi-layer approach to study the pre- and post-effects of the largest Hunga Tonga Hunga Ha’apai eruptions that occurred on 15 January 2022 to the atmosphere and ionosphere. We started our analysis 120 days before the explosion and extended the study to the day of the volcanic eruption. Searching for possible effects of this event, we used different datasets to observe the phenomenon from various points of view.
Our main conclusions can be resumed as:
- (a)
- The seismicity of the study area showed a weak increase from 120 days before the eruption;
- (b)
- The atmospheric parameters presented anomalies that seem to anticipate the explosion. The outgoing longwave radiation exhibits three anomalies (at 81, 75, and 58 days before the eruption), the first one was 4-day persistent while the last was two 2-day persistent. The 2-m and skin temperatures indicated anomalies 49 and 48 days, respectively, before the eruption;
- (c)
- The atmospheric pressure on the Italian territory increased in correspondence to the arrival of the pressure wave from Hunga Tonga, and, then, the back wave from the antipodal point. It is also identified a late wake from northern to southern stations of this arrival;
- (d)
- The spectral analysis of magnetic field components at Swarm satellite altitudes revealed fluctuations that were equatorially symmetric, more intense at lower altitudes, and local time independent in a large area around the volcano. Therefore, we believe that the observed ULF fluctuations are probably not directly related to external sources, which are mainly linked to the solar wind-magnetosphere interactions;
- (e)
- The first differences in the total intensity (mag-F) of the geomagnetic field of the three Swarm satellites showed a clear anomaly in correspondence to the volcanic position;
- (f)
- The electron density registered by CSES-01 LAP presented an anomaly around 8 min after the eruption; correlating with the arrival of the acoustic-gravity wave signal in the F2 ionospheric layer. Another anomaly at 6 h after the explosive event was detected by Swarm and CSES-01 satellites;
- (g)
- All the Finnish search coil magnetometers showed a higher total power at frequencies characteristic of the Schumann resonance and where we expect the effects of global lightning activities.
A unique limitation of our analysis of the ionosphere was the presence of a magnetic storm the day before the eruption with its recovery phase on the day of the eruption, so the risk of mixing the effects of volcanic origin on the ionosphere with those solar induced cannot be neglected. Future perspectives could include more innovative techniques to overcome this problem and, for instance, make a more accurate investigation about the decrease of TEC that we found on the eruption day to exclude any possible geomagnetic storm influence.
Nevertheless, our study confirmed the lithosphere–atmosphere–ionosphere coupling models introduced for natural hazards, such as volcanic eruptions and earthquakes and provided a very comprehensive view of such an eruption, that even if it was a unique single point starting phenomenon, its preparation was evident over a larger area than the volcanic cone and the effects of the explosion were very distinct and global.
Author Contributions
Conceptualization, S.D. and A.D.S.; methodology, A.D.S., L.P., M.S., S.A.C., G.C., D.M., M.O., A.P., M.R., A.D.C. and D.S.; software, M.S., S.A.C., G.C., D.M., A.P., M.R., A.D.C. and D.S.; validation, S.D., A.B., A.D.S., S.R.M., L.P., M.S., D.D.M. and S.L.; formal analysis, S.A.C., G.C., D.M., M.O., A.P., M.R., A.D.C. and D.S.; investigation, S.D., A.B., A.D.S., S.R.M., L.P., M.S., F.B., M.C., S.A.C., G.C., D.D.M., C.F., A.I., S.L., D.M., A.N., M.O., A.P., M.R., A.D.C. and D.S.; data curation, S.D., S.R.M., M.S., S.A.C., G.C., D.M., M.O., A.P., M.R., A.D.C. and D.S.; writing—original draft preparation, S.D., A.B., A.D.S., S.R.M., L.P., M.S., F.B., S.A.C., G.C., C.F., A.I., D.M., M.O., A.P., M.R., A.D.C. and D.S.; writing—review and editing, all authors; visualization, S.D., S.R.M., S.A.C., G.C., D.M., M.O., A.P., M.R., A.D.C. and D.S.; supervision, S.D., A.B., A.D.S., S.R.M., L.P. and M.S.; project administration, A.B., A.D.S., S.R.M., L.P. and M.S.; funding acquisition, A.B., A.D.S., M.R., L.P. and M.S. All authors have read and agreed to the published version of the manuscript.
Funding
This work has been funded partly by the Italian Ministry of University and Research in the framework of the Working Earth (Pianeta Dinamico) Project and partly by the Italian Space Agency within Limadou Science + Project.
Data Availability Statement
For the seismological analysis, we used the USGS catalog, available at https://earthquake.usgs.gov/earthquakes/search/ (accessed on 15 June 2022). The atmospheric data analyzed was furnished by the European Centre for Medium-range Weather Forecasts (ECMWF—https://www.ecmwf.int/ (accessed on 15 June 2022)). Tidegauge data used in this article, acquired by means of monitoring stations belonging to ISPRA’s National Tidegauge Network, are available on the websites https://www.mareografico.it/?syslng=ing and https://tsunami.isprambiente.it/Tad_Server (accessed on 15 June 2022). For Swarm magnetic field data, we downloaded both Level 1b low (1 Hz) and high (50 Hz) resolution data; provided in Common Data Format (CDF) and freely available in the ESA Swarm FTP and HTTP Server swarm-diss.eo.esa.int. The CSES-01 data are formally available at the CSES satellite web portal (www.leos.ac.cn (accessed on 15 June 2022)). However, we partly downloaded them from the Chinese “Space Observation Research Center, National Institute of Natural Hazards’’. and partly from the server managed by the Istituto di Astrofisica e Planetologia Spaziali (IAPS) (within the Limadou-Science+ collaboration). For the ground observations, we used GNSS data from the receivers of the GeoNet GNSS/GPS network (https://www.geonet.org (accessed on 15 June 2022)). We used the INTERMAGNET database (https://intermagnet.github.io/, accessed on 15 June 2022) to obtain the geomagnetic observatories data. In order to analyse the vertical Total Electron Content (TEC), we considered the maps produced by the International GNSS Service (IGS) (https://cddis.nasa.gov/ (accessed on 15 June 2022)). Finally, we retrieved the Search Coil Magnetometer (SCM) data from the Sodankylä Geophysical Observatory (https://www.sgo.fi/Data/Pulsation/pulData.php (accessed on 15 June 2022)).
Acknowledgments
We would like to thank Sodankylä Geophysical Observatory for providing us with search coil magnetometer spectrograms; CSNA and CEA for providing CSES data; ESA for providing Swarm satellite data and INTERMAGNET for providing the magnetic data from ground observatories. We also thank ISPRA for providing tidegauge data used in this article. Thank for the academic editor and reviewers for improving our manuscript with their comments. Finally, a personal thank you to Gaetano De Luca for sharing his seismological experience in the review phase of the paper.
Conflicts of Interest
The authors declare no conflict of interest.
References
- Campbell-Brown, M. A Nuclear-Test Monitor Calls Tonga Volcano Blast ‘Biggest Thing That We’ve Ever Seen’. 2022. Available online: https://www.gpb.org/news/2022/01/21/nuclear-test-monitor-calls-tonga-volcano-blast-biggest-thing-weve-ever-seen (accessed on 22 January 2022).
- Garvin, J.B.; Slayback, D.A.; Ferrini, V.; Frawley, J.; Giguere, C.; Asrar, G.R.; Andersen, K. Monitoring and Modeling the Rapid Evolution of Earth’s Newest Volcanic Island: Hunga Tonga Hunga Ha’apai (Tonga) Using High Spatial Resolution Satellite Observations. Geophys. Res. Lett. 2018, 45, 3445–3452. [Google Scholar] [CrossRef] [PubMed]
- Brenna, M.; Cronin, S.J.; Smith, I.E.; Pontesilli, A.; Tost, M.; Barker, S.; Tonga’Onevai, S.; Kula, T.; Vaiomounga, R. Post-caldera volcanism reveals shallow priming of an intra-ocean arc andesitic caldera: Hunga volcano, Tonga, SW Pacific. Lithos 2022, 412–413, 106614. [Google Scholar] [CrossRef]
- Global Volcanism Program. Report on Hunga Tonga-Hunga Ha’apai (Tonga). In Weekly Volcanic Activity Report, 12 January–18 January 2022; Sennert, S.K., Ed.; Smithsonian Institution and US Geological Survey; Available online: https://watchers.news/2022/01/21/the-weekly-volcanic-activity-report-january-12-18-2022/ (accessed on 22 January 2022).
- Carr, J.L.; Horváth, Á.; Wu, D.L.; Friberg, M.D. Stereo Plume Height and Motion Retrievals for the Record-Setting Hunga Tonga-Hunga Ha’apai Eruption of 15 January 2022. Geophys. Res. Lett. 2022, 49, e2022GL098131. [Google Scholar] [CrossRef]
- Poli, P.; Shapiro, N.M. Rapid Characterization of Large Volcanic Eruptions: Measuring the Impulse of the Hunga Tonga Ha’apai Explosion from Teleseismic Waves. Geophys. Res. Lett. 2022, 49, e2022GL098123. [Google Scholar] [CrossRef]
- Garvin, J.B. Dramatic Changes at Hunga Tonga-Hunga Ha’apai. 2022. Available online: https://earthobservatory.nasa.gov/images/149367/dramatic-changes-at-hungatonga-hunga-334 (accessed on 15 May 2022).
- Kulichkov, S.N.; Chunchuzov, I.P.; Popov, O.E.; Gorchakov, G.I.; Mishenin, A.A.; Perepelkin, V.G.; Bush, G.A.; Skorokhod, A.I.; Vinogradov, Y.A.; Semutnikova, E.G.; et al. Acoustic-Gravity Lamb Waves from the Eruption of the Hunga-Tonga-Hunga-Hapai Volcano, Its Energy Release and Impact on Aerosol Concentrations and Tsunami. Pure Appl. Geophys. 2022, 179, 1533–1548. [Google Scholar] [CrossRef]
- Astafyeva, E.; Maletckii, B.; Mikesell, T.D.; Munaibari, E.; Ravanelli, M.; Coisson, P.; Manta, F.; Rolland, L. The 15 January 2022 Hunga Tonga Eruption History as Inferred from Ionospheric Observations. Geophys. Res. Lett. 2022, 49, e2022GL098827. [Google Scholar] [CrossRef]
- Duncombe, J. The Surprising Reach of Tonga’s Giant Atmospheric Waves. Eos 2022, 103. [Google Scholar] [CrossRef]
- Amores, A.; Monserrat, S.; Marcos, M.; Argüeso, D.; Villalonga, J.; Jordà, G.; Gomis, D. Numerical Simulation of Atmospheric Lamb Waves Generated by the 2022 Hunga-Tonga Volcanic Eruption. Geophys. Res. Lett. 2022, 49, e2022GL098240. [Google Scholar] [CrossRef]
- Zhang, S.-R.; Vierinen, J.; Aa, E.; Goncharenko, L.P.; Erickson, P.J.; Rideout, W.; Coster, A.J.; Spicher, A. 2022 Tonga Volcanic Eruption Induced Global Propagation of Ionospheric Disturbances via Lamb Waves. Front. Astron. Space Sci. 2022, 9, 871275. [Google Scholar] [CrossRef]
- Yuen, D.A.; Scruggs, M.A.; Spera, F.J.; Zheng, Y.; Hu, H.; McNutt, S.R.; Thompson, G.; Mandli, K.; Keller, B.R.; Wei, S.S.; et al. Under the surface: Pressure-induced planetary-scale waves, volcanic lightning, and gaseous clouds caused by the submarine eruption of Hunga Tonga-Hunga Ha’apai volcano. Earthq. Res. Adv. 2022, 2, 100134. [Google Scholar] [CrossRef]
- Matoza, R.S.; Fee, D.; Assink, J.D.; Iezzi, A.M.; Green, D.N.; Kim, K.; Toney, L.; Lecocq, T.; Krishnamoorthy, S.; Lalande, J.-M.; et al. Atmospheric waves and global seismoacoustic observations of the January 2022 Hunga eruption, Tonga. Science 2022, 337, 95–100. [Google Scholar] [CrossRef]
- Wright, C.; Hindley, N.; Alexander, M.J.; Barlow, M.; Hoffmann, L.; Mitchell, C.; Prata, F.; Bouillon, M.; Carstens, J.; Clerbauz, C.; et al. Tonga eruption triggered waves propagating globally from surface to edge of space. Earth Space Sci. Open Arch. 2022. [Google Scholar] [CrossRef]
- Burt, S. Multiple airwaves crossing Britain and Ireland following the eruption of Hunga Tonga–Hunga Ha’apai on 15 January 2022. Weather 2022, 77, 76–81. [Google Scholar] [CrossRef]
- Heki, K. Ionospheric signatures of repeated passages of atmospheric waves by the 2022 Jan. 15 Hunga Tonga-Hunga Ha’apai eruption detected by QZSS-TEC observations in Japan. Earth Planets Space 2022, 74, 112. [Google Scholar] [CrossRef]
- Lin, J.; Rajesh, P.K.; Lin, C.C.H.; Chou, M.; Liu, J.; Yue, J.; Hsiao, T.; Tsai, H.; Chao, H.; Kung, M. Rapid Conjugate Appearance of the Giant Ionospheric Lamb Wave Signatures in the Northern Hemisphere After Hunga-Tonga Volcano Eruptions. Geophys. Res. Lett. 2022, 49, e2022gl098222. [Google Scholar] [CrossRef]
- Aa, E.; Zhang, S.R.; Erickson, P.J.; Vierinen, J.; Coster, A.J.; Goncharenko, L.P.; Spicher, A.; Rideout, W. Significant equatorial plasma bubbles and global ionospheric disturbances after the 2022 Tonga volcano eruption. Space Weather. Earth Space Sci. Open Arch. 2022. [Google Scholar] [CrossRef]
- Sun, W.; Kuriakose, A.K.; Li, G.; Li, Y.; Zhao, X.; Hu, L.; Yang, S.; Xie, H.; Li, Y.; Ning, B.; et al. Unseasonal super ionospheric plasma bubble and scintillations seeded by the 2022 Tonga Volcano Eruption related perturbations. J. Space Weather Space Clim. 2022, 12, 25. [Google Scholar] [CrossRef]
- Kataoka, R.; Winn, S.D.; Touber, E. Meteotsunamis in Japan Associated with the Tonga Eruption in January 2022. SOLA 2022, 18, 116–121. [Google Scholar] [CrossRef]
- Themens, D.R.; Watson, C.; Žagar, N.; Vasylkevych, S.; Elvidge, S.; McCaffrey, A.; Prikryl, P.; Reid, B.; Wood, A.; Jayachandran, P.T. Global Propagation of Ionospheric Disturbances Associated With the 2022 Tonga Volcanic Eruption. Geophys. Res. Lett. 2022, 49, e2022gl098158. [Google Scholar] [CrossRef]
- Verhulst, T.; Altadill, D.; Barta, V.; Belehaki, A.; Buresova, D.; Cesaroni, C.; Galkin, I.; Guerra, M.; Ippolito, A.; Herekakis, T.; et al. Multi-instrument detection in Europe of ionospheric disturbances caused by the 15 January 2022 eruption of the Hunga volcano. J. Space Weather. Space Clim. 2022. [Google Scholar] [CrossRef]
- Ramírez-Herrera, M.T.; Coca, O.; Vargas-Espinosa, V. Tsunami Effects on the Coast of Mexico by the Hunga Tonga-Hunga Ha’apai Volcano Eruption, Tonga. Pure Appl. Geophys. 2022, 179, 1117–1137. [Google Scholar] [CrossRef] [PubMed]
- Tanioka, Y.; Yamanaka, Y.; Nakagaki, T. Characteristics of tsunamis observed in Japan due to the air wave from the 2022 Tonga eruption. Res. Sq. 2022. [Google Scholar] [CrossRef]
- Omira, R.; Ramalho, R.S.; Kim, J.; González, P.J.; Kadri, U.; Miranda, J.M.; Carrilho, F.; Baptista, M.A. Global Tonga tsunami explained by a fast-moving atmospheric source. Nature 2022. [Google Scholar] [CrossRef] [PubMed]
- Pulinets, S.; Ouzounov, D. Lithosphere–Atmosphere–Ionosphere Coupling (LAIC) model—An unified concept for earthquake precursors validation. J. Southeast Asian Earth Sci. 2011, 41, 371–382. [Google Scholar] [CrossRef]
- Dautermann, T.; Calais, E.; Mattioli, G.S. Lithosphere—atmosphere—ionosphere coupling after the 2003 explosive eruption of the Soufriere Hills Volcano, Montserrat. Geophys. J. Int. 2009, 179, 1537–1546. [Google Scholar] [CrossRef] [Green Version]
- Dehn, J.; Harris, A.J.L. Thermal anomalies at volcanoes. In Monitoring Volcanoes in the North Pacific; Springer Praxis Books: Berlin/Heidelberg, Germany, 2015; pp. 49–78. [Google Scholar] [CrossRef]
- Cimarelli, C.; Genareau, K. A review of volcanic electrification of the atmosphere and volcanic lightning. J. Volcanol. Geotherm. Res. 2021, 422, 107449. [Google Scholar] [CrossRef]
- Global Volcanism Program. Report on Hunga Tonga-Hunga Ha’apai (Tonga). Bulletin Global Volcanism Network. 2015, Volume 40. Available online: https://volcano.si.edu/showreport.cfm?doi=10.5479/si.GVP.BGVN201501-24304 (accessed on 15 June 2022).
- Cronin, S.J.; Brenna, M.; Smith, I.E.M.; Barker, S.; Tost, M.; Ford, M.; Tonga’Onevai, S.; Kula, T.; Vaiomounga, R. New Volcanic Island Unveils Explosive Past. Eos 2017. [Google Scholar] [CrossRef]
- Dobrovolsky, I.P.; Zubkov, S.I.; Miachkin, V.I. Estimation of the size of earthquake preparation zones. Pure Appl. Geophys. 1979, 117, 1025–1044. [Google Scholar] [CrossRef]
- De Santis, A.; Cianchini, G.; Di Giovambattista, R. Accelerating moment release revisited: Examples of application to Italian seismic sequences. Tectonophysics 2015, 639, 82–98. [Google Scholar] [CrossRef]
- Reasenberg, P. Second-order moment of central California seismicity, 1969–1982. J. Geophys. Res. Earth Surf. 1985, 90, 5479–5495. [Google Scholar] [CrossRef]
- Wiemer, S. Minimum Magnitude of Completeness in Earthquake Catalogs: Examples from Alaska, the Western United States, and Japan. Bull. Seism. Soc. Am. 2000, 90, 859–869. [Google Scholar] [CrossRef]
- Schorlemmer, D.; Wiemer, S.; Wyss, M. Variations in earthquake-size distribution across different stress regimes. Nature 2005, 437, 539–542. [Google Scholar] [CrossRef] [PubMed]
- Benioff, H. SEISMIC EVIDENCE FOR THE FAULT ORIGIN OF OCEANIC DEEPS. GSA Bull. 1949, 60, 1837–1856. [Google Scholar] [CrossRef]
- Bowman, D.D.; Ouillon, G.; Sammis, C.G.; Sornette, A.; Sornette, D. An observational test of the critical earthquake concept. J. Geophys. Res. Solid Earth 1998, 103, 24359–24372. [Google Scholar] [CrossRef] [Green Version]
- Cianchini, G.; De Santis, A.; Di Giovambattista, R.; Abbattista, C.; Amoruso, L.; Campuzano, S.A.; Carbone, M.; Cesaroni, C.; De Santis, A.; Marchetti, D.; et al. Revised Accelerated Moment Release Under Test: Fourteen Worldwide Real Case Studies in 2014–2018 and Simulations. Pure Appl. Geophys. 2020, 177, 4057–4087. [Google Scholar] [CrossRef]
- Selitto, P.; Podglajen, A.; Belhadji, R.; Boichu, M.; Carboni, E.; Cuesta, J.; Duchamp, C.; Kloss, C.; Siddans, R.; Bègue, N.; et al. The unexpected radiative impact of the Hunga Tonga eruption of January 15th, 2022. Res. Sq. 2022. [Google Scholar] [CrossRef]
- Piscini, A.; De Santis, A.; Marchetti, D.; Cianchini, G. A new multi-parametric climatological approach to the study of the earthquake preparatory phase: The 2016 Amatrice-Norcia (Central Italy) seismic sequence. In Proceedings of the 19th EGU General Assembly, Vienna, Austria, 23–28 April 2017; Volume 19, p. 14105. [Google Scholar]
- Piscini, A.; Marchetti, D.; De Santis, A. Multi-Parametric Climatological Analysis Associated with Global Significant Volcanic Eruptions During 2002–2017. Pure Appl. Geophys. 2019, 176, 3629–3647. [Google Scholar] [CrossRef]
- Schnepf, N.R.; Minami, T.; Toh, H.; Nair, M.C. Magnetic Signatures of the 15 January 2022 Hunga Tonga–Hunga Ha’apai Volcanic Eruption. Geophys. Res. Lett. 2022, 49, e2022GL098454. [Google Scholar] [CrossRef]
- Francia, P.; De Lauretis, M.; Regi, M. ULF fluctuations observed along the SEGMA array during very low solar wind density conditions. Planet. Space Sci. 2013, 81, 74–81. [Google Scholar] [CrossRef]
- Regi, M.; Francia, P.; De Lauretis, M.; Glassmeier, K.H.; Villante, U. Coherent transmission of upstream waves to polar latitudes through magnetotail lobes. J. Geophys. Res. Space Phys. 2013, 118, 6955–6963. [Google Scholar] [CrossRef]
- Regi, M.; De Lauretis, M.; Francia, P. The occurrence of upstream waves in relation with the solar wind parameters: A statistical approach to estimate the size of the foreshock region. Planet. Space Sci. 2014, 90, 100–105. [Google Scholar] [CrossRef]
- Regi, M.; De Lauretis, M.; Francia, P.; Villante, U. The propagation of ULF waves from the Earth’s foreshock region to ground: The case study of 15 February 2009. Earth Planets Space 2014, 66, 43. [Google Scholar] [CrossRef] [Green Version]
- De Santis, A.; Marchetti, D.; Spogli, L.; Cianchini, G.; Pavón-Carrasco, F.J.; De Franceschi, G.; Di Giovambattista, R.; Perrone, L.; Qamili, E.; Cesaroni, C.; et al. Magnetic Field and Electron Density Data Analysis from Swarm Satellites Searching for Ionospheric Effects by Great Earthquakes: 12 Case Studies from 2014 to 2016. Atmosphere 2019, 10, 371. [Google Scholar] [CrossRef] [Green Version]
- Alken, P.; Thébault, E.; Beggan, C.D.; Amit, H.; Aubert, J.; Baerenzung, J.; Bondar, T.N.; Brown, W.J.; Califf, S.; Chambodut, A.; et al. International Geomagnetic Reference Field: The thirteenth generation. Earth Planets Space 2021, 73, 49. [Google Scholar] [CrossRef]
- Yan, R.; Guan, Y.; Miao, Y.; Zhima, Z.; Xiong, C.; Zhu, X.; Liu, C.; Shen, X.; Yuan, S.; Liu, D.; et al. The Regular Features Recorded by the Langmuir Probe Onboard the Low Earth Polar Orbit Satellite CSES. J. Geophys. Res. Space Phys. 2022, 127, e2021JA029289. [Google Scholar] [CrossRef]
- Kumar, S.; Chen, W.; Liu, Z.; Singh, R.P. Thunderstorm-/lightning-induced ionospheric perturbation: An observation from equatorial and low-latitude stations around Hong Kong. J. Geophys. Res. Space Phys. 2017, 122, 9032–9044. [Google Scholar] [CrossRef]
- Nickolaenko, A.P.; Schekotov, A.Y.; Hayakawa, M.; Romero, R.; Izutsu, J. Electromagnetic manifestations of Tonga eruption in Schumann resonance band. J. Atmos. Solar-Terr. Phys. 2022, 237, 105897. [Google Scholar] [CrossRef]
Publisher’s Note: MDPI stays neutral with regard to jurisdictional claims in published maps and institutional affiliations. |
© 2022 by the authors. Licensee MDPI, Basel, Switzerland. This article is an open access article distributed under the terms and conditions of the Creative Commons Attribution (CC BY) license (https://creativecommons.org/licenses/by/4.0/).