Abstract
Ambrym is an active volcanic island, located in the Vanuatu archipelago, consisting of a 12 km-wide summit caldera. This open vent volcano is characterized by an almost persistent degassing activity which occurs in the Benbow and Marum craters, which were also the site of recent lava lakes. On 15 December 2018, about three years after an intense lava effusion, the first recorded since 1989, a small-scale intra-caldera fissure eruption occurred. On 16 December, the eruption stopped, and the lava lakes at the Benbow and Marum craters were drained. In this work, we investigated the thermal activity of the Ambrym volcano, before, during, and after the 15 December 2018 eruption, using daytime Sentinel-2 (S2) Multispectral Instruments (MSI) and Landsat-8 (L8) Operational Land Imager (OLI) data, at a mid-high spatial resolution. The results were integrated with Moderate Resolution Imaging Spectroradiometer (MODIS) observations. Outputs of the Normalized Hotspot Indices (NHI) tool, retrieved from S2-MSI and L8-OLI data, show that the thermal activity at the Ambrym craters increased about three weeks before the 15 December 2018 lava effusion. This information is consistent with the estimates of volcanic radiative power (VRP), which were performed by the Middle Infrared Observation of Volcanic Activity (MIROVA) system, by analyzing the nighttime MODIS data. The latter revealed a significant increase of VRP, with values above 700 MW at the end of the October–November 2018 period. Moreover, the drastic reduction of thermal emissions at the craters, marked by the NHI tool since the day of the fissure eruption, is consistent with the drop in the lava lake level that was independently suggested in a previous study. These results demonstrate that the S2-MSI and L8-OLI time series, combined with infrared MODIS observations, may contribute to detecting increasing trends in lava lake activity, which may precede effusive eruptions at the open vent volcanoes. This study addresses some challenging scenarios regarding the definition of possible threshold levels (e.g., in terms of VRP and total Short Wave Infrared radiance) from the NHI and MIROVA datasets, which could require special attention from local authorities in terms of the occurrence of possible future eruptions.
1. Introduction
Ambrym (1334 m elevation) is one of the most active basaltic volcanoes of the Vanuatu archipelago (Figure 1), an intra-oceanic volcanic arc associated with the eastward subduction of the Indo-Australian plate beneath the Pacific plate [1,2]. This open-vent volcano (the earliest observations of Ambrym’s activity came from Captain James Cook in 1774) is characterized by a persistent degassing, with SO2 emissions exceeding 200 kg/s [3]. Due to these features, the Ambrym volcano was often investigated in order to retrieve information about volcanic processes, and their relation to the signals at the surface (e.g., [2,4]).
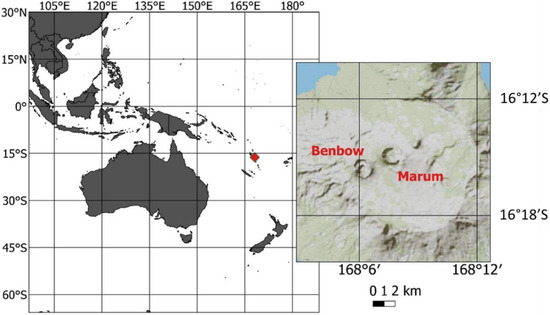
Figure 1.
Geographic location of the Ambrym (Vanuatu) volcano, with indications marking the locations of the Benbow and Marum craters (right panel), which were the sites of recent lava lakes.
In the last century, the Marum and Benbow craters, located within the 12 km-wide caldera, were sites of eruptive activity and continuous degassing [2]. Benbow is a simple cone that is mainly composed of pyroclastic deposits. Marum is a more complex cone, characterized by a thick succession of phreatomagmatic tephra, ash, and lapilli [5]. In recent years, both cones were affected by Strombolian activities, and lava lake emplacement [6].
On 21 February 2015, a basaltic dike intrusion produced more than 1 m of co-eruptive uplift, as indicated by Synthetic Aperture Radar and Multiple Aperture Interferometry measurements [7]. An intra-crater fissure eruption took place from a main fissure located ∼3 km SE of the Marum crater, and a secondary fissure opened south of Niri Mbwelesu Taten [7].
According to MIROVA (Middle Infrared Observation of Volcanic Activity), which performs operationally using MODIS (Moderate Resolution Imaging Spectroradiometer) data (at 1 km spatial resolution), effusive eruption, the first recorded since 1989, lasted about 44 h. The eruption led to values of volcanic radiative power (VRP) that were estimated at around 4000 MW [8]. An almost continuous thermal activity, ascribable to the Benbow and Marum lava lakes, was then observed in 2017, and numerous thermal anomalies were flagged throughout 2018 [9,10].
On 15 December 2018, a small-scale intra-caldera fissure eruption started at 06:00 LT, emitting lava, ash, and gas plumes [9,10]. A Mw 5.6 earthquake marked the start of a dike intrusion into the SE rift zone, extending more than 30 km from within the caldera (e.g., [2,7,9,10]). More than 2 m of subsidence were recorded, at both summit craters, from ALOS-2 and Sentinel-1 data in the weeks following the dike emplacement, and after 22 December, no large-scale deformation was observed [7]. Since the eruption ended, only a few thermal anomalies were flagged by MODVOLC [11] and MIROVA [12]. During February–October 2019, the only activity within the summit caldera consisted of gas/steam emissions, with no evidence of the lava lakes [9,10].
In this paper, we investigate the Ambrym volcano’s activity between January 2017 and December 2019 using the NHI (Normalized Hotspot Indices) tool [13,14], which nalyses Landsat-8 (L8) OLI (Operational Land Imager) and Sentinel-2 (S2) MSI (Multispectral Instrument) data, using 20 m (L8-OLI) and 30 m (S2-MSI) spatial resolution. Results are assessed through a comparison of estimates of the volcanic radiative power (VRP) from the MIROVA system.
A previous study used MODIS–MIROVA data to reconstruct the Ambrym eruptive activity occurring between 2000 and 2015 [8], which suggested an almost persistent increase of thermal output recorded at the Benbow crater during the two years that preceded the 2015 eruption. In this work, we have updated and extended Ambrym’s VRP time series, by considering the thermal anomalies that were detected at night by MODIS up to December 2019.
2. Methods
2.1. NHI Tool
The NHI multichannel algorithm uses two normalized indices to detect and map high-temperature targets using L8-OLI and S2-MSI data:
In Equations (1) and (2), and are the TOA (Top of the Atmosphere) radiances [W m−2 sr−1 µm−1] measured in the NIR (Near Infrared) (0.8 µm) and SWIR (Short Wave Infrared) bands (1.6 µm—SWIR1; 2.2 µm—SWIR2). Pixels with values of OR are considered “hot” by the algorithm, the performance and limitations of which are widely discussed in previous studies (e.g., [13,14]).
The NHI tool (https://sites.google.com/view/nhi-tool/nhi-tool-for-volcanoes, accessed on 6 May 2022) allows users to analyze volcanic thermal features without any authentication, enabling the extended geospatial datasets and the computational resources of the Google Earth Engine (GEE) platform to be exploited [14].
In more detail, this GEE App enables the investigation of about 1400 Holocene’s volcanoes, as listed by the Global Volcanism Program (GVP), with the advantages of Sentinel-2 and Landsat-8/9 data integration (global median average revisit interval of 2.3 days [15]). Thermal anomalies may be analyzed using a different Distance Buffer (DB-radius of a circular area centred over the main craters), after selecting the volcano and the period of interest [14]. Hotspot maps, plots of hot pixel numbers, total SWIR radiance, and total hotspot areas provide information about volcanic thermal features and relative space–time variations (e.g., [16,17]).
The NHI tool is capable of guaranteeing a high reliability level on a global scale, and an accurate mapping of thermal anomalies at different intensity levels. This is due to the use of some additional spectral tests, as detailed in a previous study [14]. Those spectral tests are used to minimize false positives, which occur mainly because of the multispectral misregistration of S2-MSI imagery, and better maps of “extremely hot pixels”, which lead to the SWIR channels’ saturation.
Recently, an additional module has been implemented within the tool, with the aim of providing automated notifications about volcanic thermal anomalies detected over the past 48 h [18]. The developed system (https://sites.google.com/view/nhi-tool, accessed on 6 May 2022) represents an important source of information, especially for volcanoes located in remote areas, which are usually unmonitored by traditional ground-based devices (e.g., [16,19]).
2.2. MIROVA System
MIROVA is an automated volcanic hotspot detection system developed and maintained by the University of Torino, Italy [12]. It is based on the analysis of images acquired by the MODIS sensor, which is carried on two NASA satellites (Terra and Aqua have been in orbit since March 2000 and May 2002, respectively). The algorithm uses the middle infrared (MIR at 3.959 μm) and thermal infrared (TIR at 12.002 μm) images, acquired at 1 km nominal resolution, and combines spectral and spatial analysis to detect the presence of sub-pixel hotspots. The MIR-method [20] is used to quantify the VRP (in Watts) which is a combined measurement of the area and the radiating temperature of the hot volcanic source. With a temporal resolution of 4 images per day (2 at nighttime and 2 at daytime), MIROVA provides continuous thermal observations of 220 volcanoes, with data processed and delivered within 1–4 h from each satellite overpass (http://www.mirovaweb.it, accessed on 6 May 2022).
3. Results
Figure 2 shows a plot of the total hotspot area at the Ambrym volcano, generated through the NHI tool (DB = 10 km), starting from the number of detected hot pixels and the relative pixel area (400/900 m2 for S2-MSI/L8-OLI data), in reference to the period January 2017–December 2019 [14].
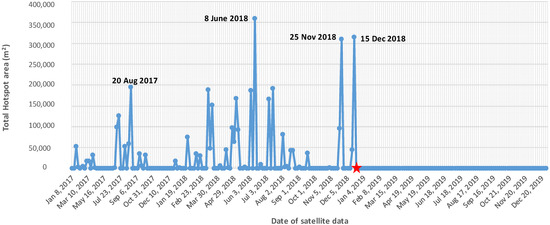
Figure 2.
Plot of total hotspot area (m2) generated using the NHI tool. The plot integrates L8-OLI and S2-MSI observations from January 2017–December 2019; the 15 December 2018 fissure eruption is marked by a red star.
The figure, which integrates daytime L8-OLI and S2-MSI observations, shows that the total hotspot area, which gives an indication of the thermal anomaly spatial extent, was mostly below 100,000 m2 before 20 August 2017; however, major increments in the values of the analyzed parameters were recorded during 2018, when the thermal anomaly (which was observed in a more continuous way by satellite; see Figure 2) extended above 300,000 m2 on 8 June, 25 November, and 15 December.
By analyzing S2-MSI and L8-OLI data, we found that clouds/plumes had a non-negligible impact on thermal anomaly identification by satellite. Indeed, the lowest values of the total hotspot area that were recorded before the 15 December 2018 eruption were associated with a thick and extended cloud coverage, which almost completely obscured the Ambrym volcano. On the other hand, the highest values of the total hotspot area suggested an increase in thermal activity at the craters, which is analyzed in more detail later in this paper.
Figure 3 displays a sequence of thermal anomaly maps generated using the NHI tool, where hot pixels [14] have been overlapped to create a RGB (Red = SWIR2; Green = SWIR1; Blue = NIR) image from S2-MSI/L8-OLI data, as shown in the background, and to create a relief map of the volcano (see panels in the inset).
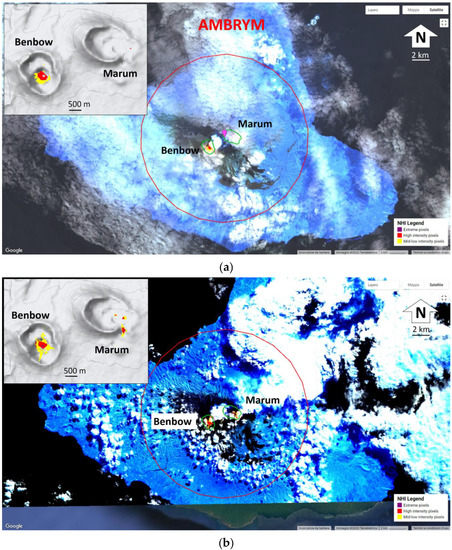
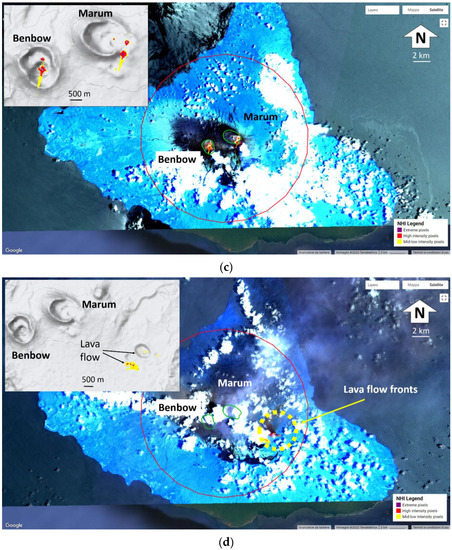
Figure 3.
Thermal anomaly maps generated from: (a) L8-OLI scene of 20 August 2017; (b) S2-MSI scene of 8 June 2018 at 23:09 UTC; (c) S2-MSI scene of 25 November 2018 at 23:09 UTC; (d) S2-MSI scene of 15 December 2018 at 23:09 UTC. In the inset, the RGB (Red = SWIR2; Green = SWIR1; Blue = NIR) imagery. On the top panel, in purple, is the center of the circular area that is depicted in red, and associated with a distance buffer (DB) of 10 km, the Benbow and Marum craters’ rims are in green.
In more detail, Figure 3a shows that on 20 August 2017, when the total hotspot area increased to values of about 195,000 m2 for the first time (Figure 2), only the Benbow crater was not affected by clouds to a significant extent. Figure 3b displays the map of the 8 June 2018, which corresponds with the peak of the total hotspot area in Figure 2 (360,000 m2 from S2-MSI scene of 23:09 UTC). It is worth noting that both craters showed evidence of the lava lake, although meteorological clouds, and/or a possible degassing plume, partially affected the scene. Moreover, some data artefacts, ascribable to the smearing of the lava lake radiance across the adjacent pixels (e.g., [14]), were also evident. These features, which led to the overestimation of the total hotspot area (e.g., see hot pixels along the NE–SW direction), seem to indicate that, on that day, thermal emissions were particularly intense at the craters.
After the aforementioned increase of the total hotspot area, a second abrupt increment of this parameter (up to 310,000 m2) was recorded on 25 November 2018. Figure 3c shows that both craters were not affected by clouds to a significant extent, and along with data artefacts, a high number of extremely hot pixels (in violet) affected the S2-MSI scene at 23:09 UTC. In addition, six clusters of hot pixels, which are ascribable to the lava lakes at the craters and an open vent located south of Marum, were identified and mapped (see also [7]). At the end of November–early December 2018, clouds strongly affected the target area. Due to these features, a thermal anomaly at the Benbow crater was partially identified by satellite the day before the eruption, whereas only a few hot pixels were detected at Marum.
The fissure eruption, which started on 14 December 2018 between 23:20 and 23:40 UTC, and was based on information that was independently retrieved from Himawari-8 AHI (Advanced Himawari Imagery) data, had a duration of about 24 h [7].
Figure 3d displays the thermal anomaly map of 15 December at 23:09 UTC, showing that the lava flow, affecting the SE flank of the Marum crater, was detected by satellite; this most likely occurred during the waning phase of eruption, as indicated by the prevalence of mid-low intensity pixels (in yellow), and by one of the two lava flow fronts, which appear even less radiant in the SWIR bands. Figure 3d also shows that the NHI algorithm did not flag hot pixels at the craters, although only the Marum crater was completely obscured by clouds. Since the day of the fissure eruption, lava lakes were no longer evident in the S2-MSI and L8-OLI scenes that were analyzed using the NHI tool (see Figure 2).
Hence, despite the impact of clouds/plumes on lava lake identification, some interesting changes in thermal volcanic activity occurred before the 15 December 2018 fissure eruption.
To investigate those changes, in Figure 4, we show the time series of the total SWIR1 (TSR1) and SWIR2 (TSR2) radiances of hot pixels, which are uncorrected for solar irradiation, and retrieved from the S2-MSI scenes of January 2017–March 2019 (see blue and orange curves).
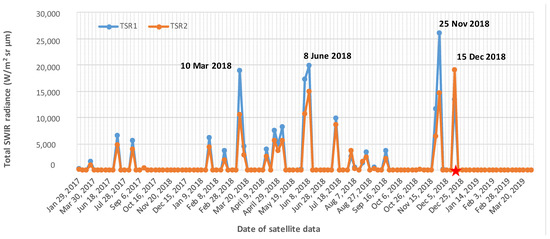
Figure 4.
Temporal trend of the total SWIR1 (TSR1) and SWIR2 (TSR2) radiances that were computed over the Ambrym volcano, and generated from the S2-MSI data of January 2017–March 2019.
The plot shows that the TSR1 was constantly below 10,000 W/m2 sr µm in 2017, by increasing above 15,000 W/m2 sr µm on 10 March, 3 June and 8 June 2018 (i.e., in correspondence of the peak of total hotspot area). Moreover, unlike the TSR1 (around 26,000 W/m2 sr µm), which peaked on 25 November, the maximum TSR2 value was retrieved during the fissure eruption. Moreover, the TSR2 was systematically lower than TSR1, as was also observed at Nyiragongo (Dem. Rep. of Congo, Africa) and Kilauea (Hawaii, USA) in the presence of active lava lakes. This was mainly because of the different saturation radiances of the SWIR channels [14,17]. On the other hand, higher TSR2 than TSR1 values were only recorded during the lava effusion, and were observed by satellite in the waning phase.
To assess the contribution of the lava lakes to changes in the total SWIR1 radiances that were recorded before the 15 December 2018 eruption, we computed the maximum value of the NHISWNIR index over the Benbow and Marum crater areas. This analysis revealed that the NHISWNIR index assumed negative values in presence of clouds/plumes, which subsequently affected the crater area. Moreover, on 25 November (i.e., corresponding with the peak of TSR1), the index increased in a more prominent way at the Marum crater (max NHISWNIR = 0.78) rather than the Benbow (max NHISWNIR = 0.64) crater, despite similarly extended cloud coverage (≈6% of cloudy pixels). This was estimated using the Sentinel Hub EO Browser [21].
Hence, when the differences in the number of extremely hot pixels at the craters are also considered (see Figure 3c), we can speculate that lava lakes at the Marum crater provided a major contribution to the increase in total SWIR1 radiances recorded by the satellite before the 15 December 2018 lava effusion.
Figure 5 displays the curves of the aforementioned indicator that was retrieved over the Benbow (blue curve) crater and the SE flank of the Marum crater (orange curve), using S2-MSI scenes from January 2017–December 2019. The plot, which integrated L8-OLI and S2-MSI observations, shows that the NHISWNIR index was always negative over the SE flank of the Marum crater regardless of cloud coverage, apart from the day of the fissure eruption, when it abruptly increased because of lava effusion. On that day, the NHI indices drastically decreased at the craters, although only the Marum was almost completely affected by clouds (≈70% of cloudy pixels at Benbow).
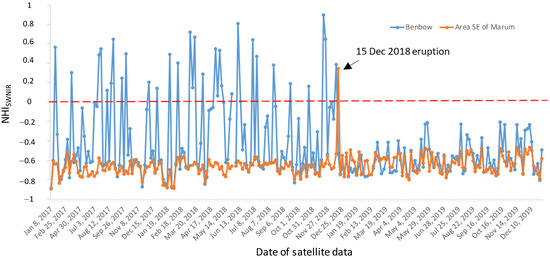
Figure 5.
Temporal trend of the maximum value of the NHISWNIR index retrieved from the L8-OLI and S2-MSI data of January 2017–December 2019, over the Benbow crater (blue curve) and the SE flank of the Marum crater (orange curve).
Results retrieved from the S2-MSI and L8-OLI data are consistent with the estimates of VRP derived from the nighttime MODIS data, which were performed by MIROVA. Indeed, Figure 6 shows that during the period 2016–2017 the VRP was mostly below 500 MW, and it increased above 700 MW on 31 October and 25 November 2018 (see dotted black circle) (i.e., corresponding with the peak of TSR1 from the S2-MSI data). After a significant reduction that may be ascribed to clouds, the VRP reached its peak, around 2680 MW, on 15 December (from the nighttime MODIS overpass at 11:10 UTC), due to the fissure eruption. Following the approach described in [12], the radiant power was associated to a Time Averaged Lava Discharge Rate (TADR) that is equal to 22.3 ± 11.1 m3 s−1. The VRP then drastically decreased, marking the end of thermal activity, thus corroborating information retrieved from the S2-MSI and L8-OLI data (see Figure 2).
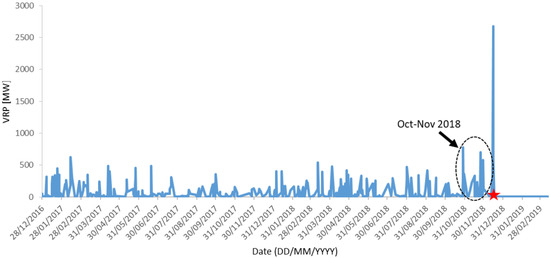
Figure 6.
Plot of volcanic radiative power (VRP) between December 2016 and March 2019 from the MIROVA system, with indications of the period that are characterized by VRP values above 700 MW (see black ellipse), and which were recorded before the 15 December fissure eruption marked in red.
4. Discussion
Based on the results shown in the previous section, thermal emissions increased at the Ambrym craters before the 15 December 2018 eruption. This increment was revealed by both NHI and MIROVA, using satellite data at different spectral, spatial, and temporal resolutions.
In more detail, even when considering the period 2000–2015, the VRP values that were retrieved by MIROVA a few weeks before the aforementioned 2018 eruption were the largest ever achieved at Ambrym. Those values were even higher than the VRP peaks recorded before the 2015 eruption (about 580 MW one month before the eruption [8]), indicating that the December 2018 lava effusion was preceded by extremely high thermal activity inside the craters, possibly associated with high lava lake levels.
This hypothesis is consistent with the results of recent studies, suggesting a rapid increase in the lava lake level in the weeks before the eruption [22,23]. In particular, in the two weeks directly preceding the eruption, the height of the main lava lake at the Marum crater increased rapidly (the rise in the lake level was about 60 m between 30 November and 14 December 2018), suggesting an increased pressurization of the magmatic system [22]. An increase in lava lake level was also reported at the Kilauea summit crater before the 2018 eruption, at Erta Ale (Ethiopia) since 2000, and prior to the 2017 fissure eruption (see [22] and references herein).
This work shows the significant increase in thermal emissions at the Ambrym craters at the end of October 2018 (from MIROVA observations). Three weeks before the eruption (i.e., on 25 November, in favourable observational conditions), those emissions appeared to still be particularly intense, especially at the Marum crater (as indicated by the analysis of NHI indices), which also showed a stronger degassing activity, as suggested by Figure 7. The latter displays the average value of the SO2 vertical column density (VCD) retrieved at the ground level (under the GEE platform), over both Ambrym craters, using Sentinel-5P TROPOMI (TROPOspheric Monitoring Instrument) data from October 2018–September 2019 [24]. In more detail, the figure shows that the SO2 emissions were generally more intense at the Marum crater, where they abruptly increased after 2 December, reaching its peak two days before the start of the lava effusion. After 17 December, a significant reduction in degassing activity was recorded at both Ambrym craters (see Figure 7).
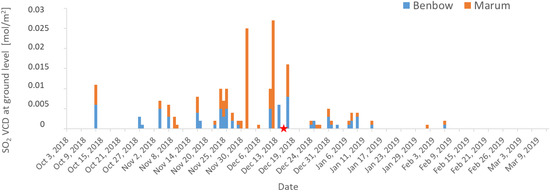
Figure 7.
Time series of the SO2 VCD (Vertical Column Density) at the ground level in units of mol/m2 retrieved from Sentinel-5P TROPOMI data (at the spatial resolution of 3.5 km × 7 km) from October 2018–March 2019. Plot displays the average VCD value retrieved over the Marum and Benbow craters; the start of the eruption is marked in red.
The drastic reduction of the NHI indices, recorded at the craters during the intra-caldera eruption, fits with the drop in the lava lake level, as suggested in previous studies (e.g., [7]). The RGB (Red = SWIR2; Green = SWIR1; Blue = NIR) maps of the Ambrym volcano shown in Figure 8, generated from SLSTR (Sea and Land Surface Temperature Radiometer) data at a 500 m spatial resolution from 14–15 December 2018, further corroborate this evidence. More specifically, Figure 8a displays the false color composite image from 14 December at 22:04 UTC (09:04 LT), which shows that about one hour before the start of the fissure eruption, both Ambrym craters were still active, and they were presumably affected by the lava lakes (see pixels from yellow to red). The day after, when meteorological clouds and an ash plume handing in the N–W direction affected the caldera, a thermal anomaly, ascribable to the lava effusion, was only evident on the SE flank of the Marum crater (see Figure 8b displaying the SLSTR image of 15 December at 22:17 UTC).
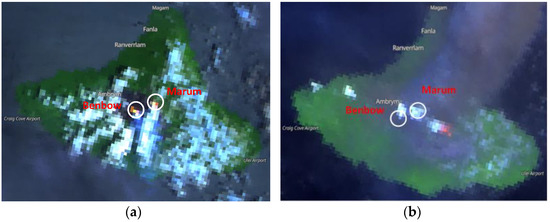
Figure 8.
SLSTR (Sea and Land Surface Temperature Radiometer) RGB (Red = SWIR2; Green = SWIR1; Blue = NIR) maps of: (a) 14 December 2018 at 22:04 UTC; (b) 15 December 2018 22:17 UTC. Red/yellow pixels indicate the thermal anomaly associated with the lava lakes at the Benbow and Marum craters (left panel), and the lava flow from the 15 December fissure eruption (right panel). Maps were generated using the Sentinel Hub EO Brower [21].
According to [7], the deflation of the Ambrym magma plumbing system, as a result of the intra-caldera eruption, induced a drop in pressure in the magma column, leading to lava lake drainage. Moreover, it was suggested that a dike, propagating from the main magmatic branch, intersected and remobilized more evolved magma from a peripheral magma chamber (magma mixing occurred less than 10 h prior to intra-caldera eruption) [22]. The intersection of the two magma bodies rose together to erupt at the surface, and probably occurred at shallow depths, thus draining the top portion of the main magmatic branch and causing the disappearance of the lava lakes [22]. A detailed description of the mechanisms triggering the Ambrym 2018 eruption can be found in [7,22,23].
This study demonstrates the capacity of the NHI tool in recognizing changes in lava lake activity which may precede effusive eruptions in open vent volcanoes. On the other hand, the impact of clouds on the results of this study also suggests that a careful analysis and interpretation of NHI products is necessary. In this context, information regarding the percentage of cloudy pixels could enable a better interpretation of changes in the total SWIR radiance and hotspot area in the target areas. This information could be retrieved from some MSI and OLI quality bands (e.g., CFmask [25]), thus further increasing the tool’s potential in supporting the active monitoring of volcanoes, and integrating information from other well-established systems such as MIROVA. The latter performs an effective characterization of thermal volcanic activity from space, as further demonstrated in this work.
5. Conclusions
Time series analyses of L8-OLI and S2-MSI data performed using the NHI tool indicate that the lava lake activity at the Ambrym craters increased about three weeks before the 15 December 2018 fissure eruption. In that period, the major state of unrest in the volcano (independently reported since 7 December 2017) continued at the craters, where lava lakes induced sustained degassing activity [26], as has also been suggested in the analysis of the Sentinel-5P TROPOMI data in this work.
Information from the NHI tool is consistent with the estimates of the VRP that were performed by MIROVA using nighttime MODIS data at a high temporal resolution. This showed the increase in this parameter, up to values of about 775 MW, during the period at the end of October–November 2018. In addition, the drastic reduction of the NHI indices, recorded at the craters since the day of the fissure eruption, may be ascribed to the drop in lava lake level that was independently suggested in previous studies; a helicopter flight performed on 16 December 2018 confirmed the drainage of the lava lakes, and the partial collapse of the craters [7].
These results show that the NHI tool may provide relevant contributions to the identification of increasing trends in lava lake activity, which may precede fissure eruptions in open vent volcanoes. In addition, they confirm the capacity of this GEE-App in accurately localizing active vents and mapping thermal anomalies, especially in the absence of clouds and/or degassing plumes (e.g., lava flows from the 15 December 2018 fissure eruption were partially detected by satellite because of cloud coverage).
Finally, this work shows that the integration of NHI and MIROVA datasets may enable an effective characterization of phases of thermal unrest in active volcanoes, thus also encouraging their joint usage in other areas. These outcomes present some challenging scenarios concerning the definition of possible threshold levels (e.g., in terms of VRP, total SWIR radiance) in open volcanic systems, which could require special attention from the local authorities for potential future eruptions.
Author Contributions
F.M. conceptualization; F.M. wrote the majority of the paper; D.C. and N.P. contributed in writing paper; D.C. provided and analyzed the MIROVA dataset; F.M., N.G. and A.F. analyzed the NHI products. All authors have read and agreed to the published version of the manuscript.
Funding
This research received no external funding.
Data Availability Statement
Data used in this study can be found at https://sites.google.com/view/nhi-tool/nhi-tool-for-volcanoes.
Acknowledgments
Sentinel-2 MSI, Landsat-8 OLI data analyzed in this work are made available by the Google Earth Engine (GEE) platform. Authors would like to thank the referees and editors for their valuable comments devoted to improve the paper.
Conflicts of Interest
The authors declare no conflict of interest.
References
- Polacci, M.; Baker, D.R.; La Rue, A.; Mancini, L.; Allard, P. Degassing behaviour of vesiculated basaltic magmas: An example from Ambrym volcano, Vanuatu Arc. J. Volcanol. Geotherm. Res. 2012, 233, 55–64. [Google Scholar] [CrossRef]
- Hamling, I.J.; Kilgour, G. Goldilocks conditions required for earthquakes to trigger basaltic eruptions: Evidence from the 2015 Ambrym eruption. Sci. Adv. 2020, 6, eaaz5261. [Google Scholar] [CrossRef] [PubMed] [Green Version]
- Allibone, R.; Cronin, S.J.; Charley, D.T.; Neall, V.E.; Stewart, R.B.; Oppenheimer, C. Dental fluorosis linked to degassing of Ambrym volcano, Vanuatu: A novel exposure pathway. Environ. Geochem. Health 2012, 34, 155–170. [Google Scholar] [CrossRef] [PubMed]
- Allard, P.; Burton, M.; Sawyer, G.; Bani, P. Degassing dynamics of basaltic lava lake at a top-ranking volatile emitter: Ambrym volcano, Vanuatu arc. Earth Planet. Sci. Lett. 2016, 448, 69–80. [Google Scholar] [CrossRef] [Green Version]
- Firth, C.; Handley, H.; Turner, S.; Cronin, S.; Smith, I. Variable conditions of magma storage and differentiation with links to eruption style at Ambrym volcano, Vanuatu. J. Petrol. 2016, 57, 1049–1072. [Google Scholar] [CrossRef] [Green Version]
- Németh, K.; Cronin, S.J. Volcanic craters, pit craters and high-level magma-feeding systems of a mafic island-arc volcano: Ambrym, Vanuatu, South Pacific. Geol. Soc. Lond. Spec. Publ. 2008, 302, 87–102. [Google Scholar] [CrossRef]
- Shreve, T.; Grandin, R.; Boichu, M.; Garaebiti, E.; Moussallam, Y.; Ballu, V.; Delgado, F.; Leclerc, F.; Vallée, M.; Henriot, N.; et al. From prodigious volcanic degassing to caldera subsidence and quiescence at Ambrym (Vanuatu): The influence of regional tectonics. Sci. Rep. 2019, 9, 18868. [Google Scholar] [CrossRef] [PubMed] [Green Version]
- Coppola, D.; Laiolo, M.; Cigolini, C. Fifteen years of thermal activity at Vanuatu’s volcanoes (2000–2015) revealed by MIROVA. J. Volcanol. Geotherm. Res. 2016, 322, 6–19. [Google Scholar] [CrossRef]
- Global Volcanism Program. Report on Ambrym (Vanuatu). In Bulletin of the Global Volcanism Network; Venzke, E. (Ed.) Smithsonian Institution, 2018; Volume 43, No. 7. [Google Scholar] [CrossRef]
- Global Volcanism Program. Report on Ambrym (Vanuatu). In Bulletin of the Global Volcanism Network; Bennis, K.L.; Venzke, E. (Eds.) Smithsonian Institution, 2020; Volume 45, No. 3. [Google Scholar] [CrossRef]
- Wright, R.; Flynn, L.; Garbeil, H.; Harris, A.; Pilger, E. Automated volcanic eruption detection using MODIS. Remote Sens. Environ. 2002, 82, 135–155. [Google Scholar] [CrossRef] [Green Version]
- Coppola, D.M.; Cigolini, C.; Delle Donne, D.; Ripepe, M. Enhanced volcanic hot-spot detection using MODIS IR data: Results from the MIROVA system. In Detecting, Modelling and Responding to Effusive Eruptions; Harris, A.J.L., De Groeve, T., Garel, F., Carn, S.A., Eds.; Geological Society, London, Special Publications: London, UK, 2016; Volume 426. [Google Scholar]
- Marchese, F.; Genzano, N.; Neri, M.; Falconieri, A.; Mazzeo, G.; Pergola, N. A Multi-Channel Algorithm for Mapping Volcanic Thermal Anomalies by Means of Sentinel-2 MSI and Landsat-8 OLI Data. Remote Sens. 2019, 11, 2876. [Google Scholar] [CrossRef] [Green Version]
- Genzano, N.; Pergola, N.; Marchese, F. A Google Earth Engine tool to investigate, map and monitor volcanic thermal anomalies at global scale by means of mid-high spatial resolution satellite data. Remote Sens. 2020, 12, 3232. [Google Scholar] [CrossRef]
- Li, J.; Chen, B. Global revisit interval analysis of Landsat-8-9 and Sentinel-2a-2b data for terrestrial monitoring. Sensors 2020, 20, 6631. [Google Scholar] [CrossRef]
- Plank, S.; Marchese, F.; Genzano, N.; Nolde, M.; Martinis, S. The short life of the volcanic island New Late’iki (Tonga) analyzed by multi-sensor remote sensing data. Sci. Rep. 2020, 10, 22293. [Google Scholar] [CrossRef]
- Marchese, F.; Genzano, N.; Nolde, M.; Falconieri, A.; Pergola, N.; Plank, S. Mapping and characterizing the Kīlauea (Hawaiʻi) lava lake through Sentinel-2 MSI and Landsat-8 OLI observations of December 2020–February 2021. Environ. Model. Softw. 2022, 148, 105273. [Google Scholar] [CrossRef]
- Marchese, F.; Genzano, N. Global volcano monitoring through the NHI (Normalized Hot Spot Indices) system. J. Geol. Soc. 2022; under review. [Google Scholar]
- Ganci, G.; Cappello, A.; Bilotta, G.; Del Negro, C. How the variety of satellite remote sensing data over volcanoes can assist hazard monitoring efforts: The 2011 eruption of Nabro volcano. Remote Sens. Environ. 2020, 236, 111426. [Google Scholar] [CrossRef]
- Wooster, M.J.; Zhukov, B.; Oertel, D. Fire radiative energy for quantitative study of biomass burning: Derivation from the BIRD experimental satellite and comparison to MODIS fire products. Remote Sens. Environ. 2003, 86, 83–107. [Google Scholar] [CrossRef]
- Sentinel Hub EO Browser. Available online: https://apps.sentinel-hub.com/eo-browser/?zoom=10&lat=41.9&lng=12.5&themeId=DEFAULT-THEME (accessed on 11 May 2022).
- Moussallam, Y.; Médard, E.; Georgeais, G.; Rose-Koga, E.F.; Koga, K.T.; Pelletier, B.; Bani, P.; Shreve, T.L.; Grandin, R.; Boichu, M. How to turn off a lava lake? A petrological investigation of the 2018 intra-caldera and submarine eruptions of Ambrym volcano. Bull. Volcanol. 2021, 83, 36. [Google Scholar] [CrossRef]
- Shreve, T.; Grandin, R.; Boichu, M. Reservoir depressurization driven by passive gas emissions at Ambrym volcano. Earth Planet. Sci. Lett. 2022, 584, 117512. [Google Scholar] [CrossRef]
- Sentinel Online Level-2 Algorithm DOAS. Available online: https://sentinels.copernicus.eu/web/sentinel/technical-guides/sentinel-5p/level-2/doas-method (accessed on 14 June 2022).
- Foga, S.; Scaramuzza, P.L.; Guo, S.; Zhu, Z.; Dilley, R.D.; Beckmann, T.; Schmidt, G.L.; Dwyer, J.L.; Hughes, M.J.; Laue, B. Cloud detection algorithm comparison and validation for operational Landsat data products. Remote Sens. Environ. 2017, 194, 379–390. [Google Scholar] [CrossRef] [Green Version]
- Government of Vanuatu, 2018. Vanuatu Volcano Alert Bulletin n°8-Ambrym Activity (15 November 2018). 2018. Available online: https://m.reliefweb.int/report/2931144/vanuatu/vanuatu-volcano-alert-bulletin-n-8-ambrym-activity-15-november-2018?lang=ru (accessed on 11 May 2022).
Publisher’s Note: MDPI stays neutral with regard to jurisdictional claims in published maps and institutional affiliations. |
© 2022 by the authors. Licensee MDPI, Basel, Switzerland. This article is an open access article distributed under the terms and conditions of the Creative Commons Attribution (CC BY) license (https://creativecommons.org/licenses/by/4.0/).