Article

Towards Classification of Architectural Styles of Chinese Traditional Settlements Using Deep Learning: A Dataset, a New Framework, and Its Interpretability

1
College of Geography and Tourism, Hengyang Normal University, Hengyang 421002, China
2
Cooperative Innovation Centre for Digitalization of Cultural Heritage in Traditional Villages and Towns, Hengyang Normal University, Hengyang 421002, China
3
National-Local Joint Engineering Laboratory on Digital Preservation and Innovative Technologies for the Culture of Traditional Villages and Towns, Hengyang Normal University, Hengyang 421002, China
4
Guangdong Province Engineering Laboratory for Geographic Spatio-temporal Big Data, Key Laboratory of Guangdong for Utilization of Remote Sensing and Geographical Information System, Guangdong Open Laboratory of Geospatial Information Technology and Application, Guangzhou Institute of Geography, Guangdong Academy of Sciences, Guangzhou 510070, China
5
Department of Civil and Environmental Engineering, The Hong Kong University of Science and Technology, Hong Kong 999077, China
6
Institute of Rural Revitalization Research, Changsha University, Changsha 410022, China
*
Author to whom correspondence should be addressed.
Remote Sens. 2022, 14(20), 5250; https://doi.org/10.3390/rs14205250
Submission received: 2 September 2022 / Revised: 8 October 2022 / Accepted: 15 October 2022 / Published: 20 October 2022
(This article belongs to the Special Issue Digitization and Visualization in Cultural Heritage)

Abstract

:
The classification of architectural style for Chinese traditional settlements (CTSs) has become a crucial task for developing and preserving settlements. Traditionally, the classification of CTSs primarily relies on manual work, which is inefficient and time consuming. Inspired by the tremendous success of deep learning (DL), some recent studies attempted to apply DL networks such as convolution neural networks (CNNs) to achieve automated classification of the architecture styles. However, these studies suffer overfitting problems of the CNNs, leading to inferior classification performance. Moreover, most of the studies apply the CNNs as a black box providing limited interpretability. To address these limitations, a new DL classification framework is proposed in this study to overcome the overfitting problem by transfer learning and learning-based data augmentation technique (i.e., AutoAugment). Furthermore, we also employ class activation map (CAM) visualization technique to help understand how the CNN classifiers work to abstract patterns from the input. Specifically, due to a lack of architectural style datasets for the CTSs, a new annotated dataset is first established with six representative classes. Second, several representative CNNs are leveraged to benchmark the new dataset. Third, to address the overfitting problem of the CNNs, a new DL framework is proposed which combines transfer learning and AutoAugment to improve the classification performance. Extensive experiments are conducted on the new dataset to demonstrate the effectiveness of our framework. The proposed framework achieves much better performance than baselines, greatly mitigating the overfitting problem. Additionally, the CAM visualization technique is harnessed to explain what and how the CNN classifiers implicitly learn for recognizing a specified architectural style.

Graphical Abstract

1. Introduction

China possesses a great treasure of tangible and intangible cultural heritage from its long history [1,2]. With the accelerated pace of industrialization and urbanization, safeguarding these intangible cultural heritage settlements has become a crucial task for cultural preservation, since these intangible heritage assets would be endangered without proper preservation strategies planned and implemented [3,4,5]. Among the preservation of cultural heritage, preserving Chinese traditional settlements (CTSs) is a crucial task, since CTSs are regarded as living fossils of vernacular culture containing rich historical and folk custom information. To safeguard and manage these CTSs purposely and efficiently, classifying the architectural style of the CTSs is important, and it lays a good foundation to develop and preserve traditional settlements for tourism. Conversely, an incorrect classification possibly results in the loss of native characteristics in tourism development and old building restoration.
Traditionally, the classification of CTSs was usually conducted by manual judgment without the evidence of analysis and revision comments, which is scope limited, time consuming, and costly. Recently, DL, especially convolutional neural networks (CNNs) has achieved remarkable success in various 2D vision tasks such as classification, detection, and semantic segmentation [6]. Inspired by the tremendous success of DL [6,7], several researchers have attempted to apply computer vision and DL techniques to automate the recognition of architecture styles. Abraham et al. [8] introduced a saliency map to select effective inputs and then trained deep convolutional neural networks (CNNs) to perceive the architectural styles of Mexican buildings. Subsequently, Jianfang et al. [9] developed a new deep learning framework to classify Chinese traditional mural images. They fused multiple levels of features to an SVM classifier for traditional mural image classification, including high-level features extracted from pre-trained VGGNets [10], low-level features from the conventional color histogram, and local traditional features. However, these studies suffer the overfitting problem of the CNNs, leading to inferior classification performance. Worse still, most of the studies apply the CNNs as a black box, providing limited interpretability of why and how the CNN classifiers thinks a given input belongs to a particular class.
To tackle these limitations, recent deep learning techniques have been investigated to achieve automated architecture style classification for CTSs. First, due to a lack of labeled datasets for CTSs, we establish a new labeled CTS image dataset with over 1200 images and six representative regional style classes such as Chinese Chuan and Jin architectural style. Second, several representative CNNs such as ResNet [11] and DenseNet [12] are benchmarked on the new dataset to demonstrate the effectiveness of the CNNs. As in previous studies, the overfitting problem is identified as a primary problem of applying the CNNs, due to the dilemma between the small-sized dataset and large capacity of the CNNs. The CNNs archives very good performance on the training set of the new dataset but generalizes very poorly on its test set. To mitigate the overfitting problem, we propose a new framework by introducing transfer learning (TL) techniques [13] and a learning-based data augmentation technique (i.e., AutoAugment) [14] to the CNNs. Extensive experiments are conducted to demonstrate the effectiveness of introducing the TL and AutoAugment to the CNNs, which achieves outstanding classification performance on the dataset, exceeding the baselines by a large margin. Lastly, we also employ the CAM visualization technique to analyze what our developed framework has implicitly learned to perceive a specified architectural style, thereby boosting interpretability of the CNNs. With the resultant activation heat maps for each architectural style, we can understand how machine perception is achieved by these CNNs. The proposed framework shed light on addressing the overfitting problem when applying CNNs over a small-size dataset and set a comprehensive example of achieve automatic heritage asset recognition using recent fancy deep learning techniques. To conclude, our primary contributions of this study are as follows:
  • Established a first new architectural style dataset for Chinese traditional settlement style classification and benchmarked the dataset with several representative CNNs.
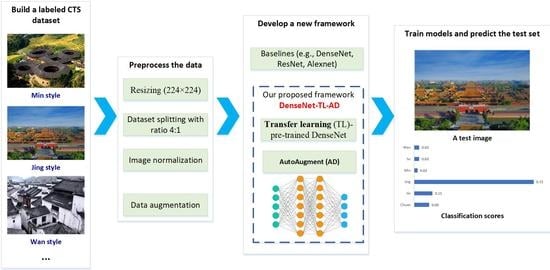
  • Developed a new DL framework to classify CTS styles effectively by introducing transfer learning and AutoAugment to the baselines, e.g., DenseNet.
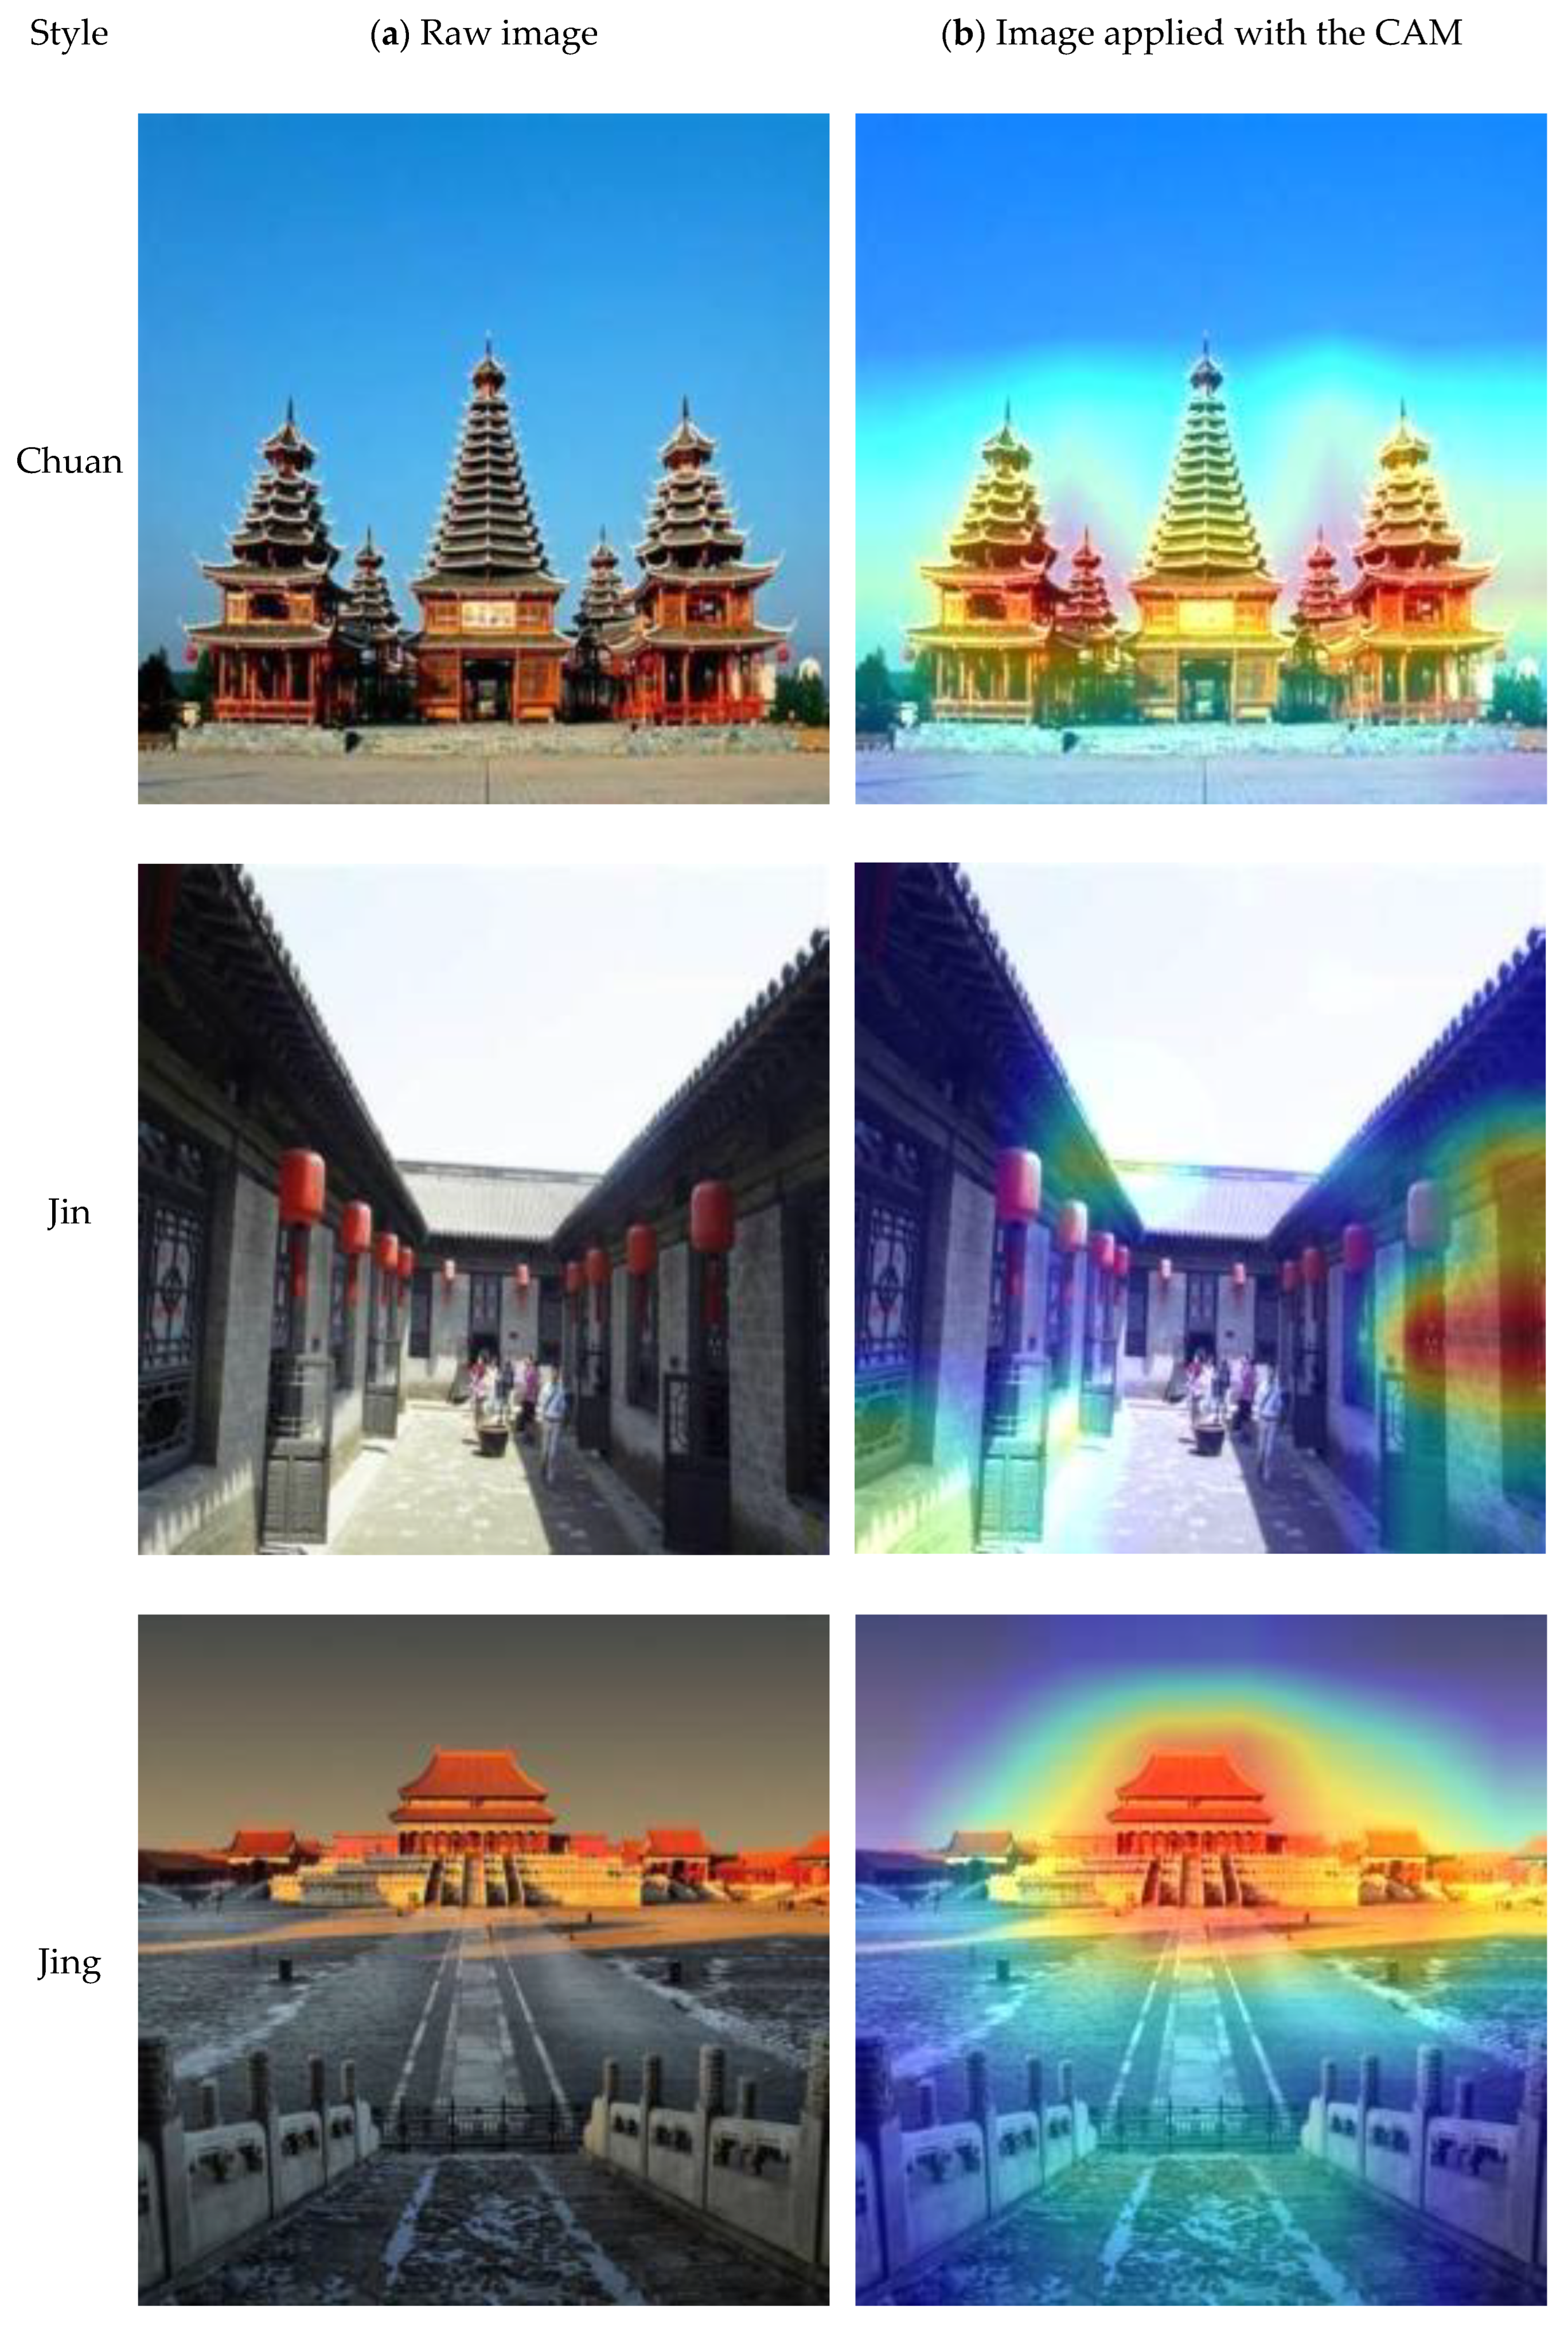
  • Interpreted the CNNs by the CAM visualization technique to reveal how the CNNs think a given image belongs to a particular architectural style.
The remainder of this article is organized as follows. Section 2 conducts a brief literature review of the classification of architectural styles, CNNs, and effective techniques to address overfitting. The methodology is elaborated in Section 3, including building a new labeled CTS dataset, our proposed framework, model evaluation metrics, and class activation map technique. The results of designed experiments for validating the proposed approach are presented in Section 4. Finally, conclusions, limitations, and future work are concluded in Section 5.

2. Literature Review

2.1. Classification of Architectural Style for Heritage Preservation

Traditional architecture was spontaneously formed in the long-term interactions between mankind and nature, with distinct regional characteristics [15,16]. The existing studies have deeply discussed the influence of the natural environment, economy, and culture on cultural heritage and architecture [17,18,19], trying to understand the reasons for the formation of settlements or architecture so as to achieve accurate heritage preservation. Shaolin Wu et al. [20] analyzed and clustered 4000 traditional settlements into five classes and found that the dominant factors of the natural environment for five zones are topographical conditions and hydrologic resources. However, it is slowly becoming accepted that the architectural style is a concentrated reflection of other aspects, which can directly distinguish the architecture and even the settlement from others. Abraham et al. [8] classified Mexican buildings into three classes according to the architectural styles to promote Mexican culture.
From the aspect of methods, the GIS and basic statistical approaches, such as correlation and regression analysis, are widely used to better understand architectural style and pattern [21,22]. PeiLin Liu [23] preliminarily divided the Chinese area into 3 large-scale traditional settlement landscape areas, 14 landscape areas, and 76 landscape sub-areas through the index system and GIS method. However, with the deepening digital research on traditional settlement architecture and cultural heritage, the progression to machine learning is natural [7,24,25], especially as clustering algorithms, SVM and random forest are often preferred [9]. Bienvenido-Huertas et al. predict environmental parameters of heritage preservation using an artificial intelligence model [17]. Shaolin Wu et al. [20] set the Chinese traditional settlements as positive samples and the other settlements as negative samples to fulfill the supervised classification of settlements using Random forests. Nicolas Gonthier et al. [26] propose a method for the weakly supervised detection of objects in paintings for helping art historians to explore large digital databases.
However, two gaps are observed in the current study. The first gap is that, in most cases, the machine learning algorithms are applied as a black box with few changes to the underlying formulation [7], resulting in an inadequate understanding of data. The other gap is how to interpret the complex nonlinear process in machine learning so that we can integrate the knowledge of traditional settlement and traditional architecture to re-interpret the results instead of just knowing a classification result value. Hence, a specialized dataset, an applicable framework, as well as a visualization scheme are needed for the classification of Chinese architecture.

2.2. Convolutional Neural Networks

Recently, deep learning (DL) has achieved tremendous success in solving visual object recognition problems such as classification, segmentation, and detection [6]. These DL techniques are very good at discerning intricate structures from visual image data and have dramatically advanced the state-of-the-art in these visual recognition problems. A plethora of DL networks have been developed in recent years. AlexNet [27] is considered a milestone in ConvNets, in which GPUs were applied to speed up deep learning training and which won the 1st prize in the ImageNet Large Scale Visual Recognition Challenge. After AlexNet, myriad CNN variants have been proposed to tackle all kinds of vision or perception tasks, and hereafter, another AI summer is emerging. An AlexNet model typically consists of five convolutional layers including max pooling layers and three fully connected layers, whereby the former layers are used to extract and down-sample representative patterns of feature maps, while the latter layers are used to classify images to output probability scores. VggNet [10] extends AlexNet, which adopts a smaller receptive field (3 × 3 kernel size with stride 1), while AlexNet uses a larger receptive field (11 × 11 kernel size with stride 4). The rationale of this design is that three convolution layers with 3 × 3 kernel size are equivalent to one convolution layer with 11 × 11 kernel size, and it can reduce computation by a large margin. Similar to AlexNet, VggNet also consists of two types of layers, i.e., convolutional layers and fully connected layers. ResNet [11] is proposed to tackle the gradient vanishing problem when training very deep convolutional networks. The basic idea of ResNet is to learn a residual mapping between two inputs and outputs instead of learning the whole complex function. Such a simple idea has robustly addressed the gradient vanishing issue when training very deep CNNs. The core component of ResNet is a Residual block that add input features to the output after a convolution layer. To date, ResNet is the de facto backbone for image classification in most practical applications. In our benchmark experiments, a ResNet50 consisting of 50 layers is used.
DenseNet [12] can serve as a strong alternative to ResNet. Unlike ResNet, which adds features together, the basic idea of DenseNet is to maintain low-level features by concatenating the inputs and outputs on the channel dimension. Specifically, DenseNet consists of two core components: dense blocks and transition layers, where the former defines a special convolution type by densely concatenating features of all previous layers, while the latter controls the number of channels to avoid the channel explosion problem of the DenseNet block. DenseNet can provide evident favorable advantages such as strong gradient flow to avoid gradient vanishing problems, being computationally efficient, and enabling more diversified features. In our benchmark experiments, DenseNet121, consisting of 121 layers, is used.

2.3. Effective Techniques to Address the Overfitting Problem

2.3.1. Transfer Learning

Transfer learning is widely used to tackle the overfitting problem when applying deep learning on small-sized image datasets where labeled data examples are in shortage. It is highly effective to mitigate overfitting and can help to greatly improve the recognition performance [28,29]. Its fundamental idea is to transfer knowledge across domains. The concept of transfer learning in the computer vision domain might originate from educational psychology. In psychology, as long as a person has a good generalization learning ability, he could easily transfer his/her knowledge of one activity to another relevant activity. For example, a child who learned the piano could learn another relevant musical instrument (e.g., Chinese erhu) much swifter than other children, as the two musical instruments might share some common knowledge or experience. Therefore, intuitively, transfer learning aims at harnessing knowledge from one domain (termed source domain) to another related domain (termed target domain), thereby improving learning capability or minimizing the number of labeled data required in training.
Typically, a pre-trained model trained on a large dataset such ImageNet dataset [30] is often served as a generic model of the visual world. Considering that the ImageNet dataset is large enough and general enough, containing over 1 million images with 1000 different classes, the hierarchical features extracted by the pre-trained model are of use to many computer-vision tasks, even when these new tasks might encompass different classification classes from those of the original task. In this study, a pre-trained CNN (trained on the gigantic ImageNet dataset) is firstly obtained and then repurposed to classify the architectural styles of CTSs.

2.3.2. Data Augmentation

Even though DL has achieved tremendous success in many computer-vision tasks, these DL models still require collecting and annotating a large-scale dataset to overcome the overfitting problem. However, annotated data for the realistic application is not feasible due to the difficulty of data collection and the expensive costs of data annotation. Apart from harnessing transfer learning to overcome the overfitting problem, another dominating technique is applying data augmentation (DA) to improve the quantity and diversity of the training data [31,32]. Typically, the data augmentation techniques can be categorized into two types: manual data augmentation and learning-based data augmentation.
Manual data augmentation. This technique is commonly used to expand the scale of the dataset so as to improve the generalizability of the DL models. The basic idea of data augmentation is to generate random images based on existing training images to increase data sufficiency and promote data diversity, allowing the CNN models to see more types of data examples, thereby improving their recognition accuracy. By doing so, the trained model can be less sensitive to certain properties, thus promoting the model’s generalization capability. For example, we can adjust the brightness, color, and other factors of the input images to reduce the model’s sensitivity to color. It is worth mentioning that DA is only applied to the training examples rather than the test examples, since definitive results are desired when making predictions. There are a variety of data augmentation techniques to overcome the overfitting problem, typically including randomly cropping images, adjusting brightness, adjusting the color, and randomly input dropout. However, this manual DA is primarily hand-designed, which is inefficient.
Learning-based data augmentation. To overcome the limitations of manual designing data augmentation, Cubuk et al. [14] propose a learning-based DA named AutoAugment to allow automated search for refined strategies for the CNNs. Unlike the conventional manual data augmentation, which manually designs data augmentation strategies (e.g., flipping and rotation), AutoAugment automates the search procedure of designing DA strategies. Subsequently, Ruihui et al. [33] extend this idea to 3D point cloud data for training a classification network. In particular, they propose a new auto-augmentation framework called PointAugment [33], which can automatically search and apply optimization and augmentation policies on point cloud examples to enrich the data diversity. Very recently, Cubuk et al. [34] also propose another learning-based network termed RandAugment. In this study, we integrate the seminal learning-based DA technique (i.e., AutoAugment) into baselines to address the overfitting problem, thereby improving model generalizability and performance.

3. Methodology

In this section, an automated neural framework is presented to classify the architectural styles of CTSs. As is shown in Figure 1, the proposed neural framework constitutes four major components. Firstly, a labeled CTS dataset is established and preprocessed for DL training. Secondly, several representative CNNs are employed to benchmark the new CTS dataset, wherein overfitting is identified as a bottleneck in classifying the architectural styles accurately and robustly. To address the overfitting problem over the small-sized CTS dataset, we propose a new DL framework by introducing transfer learning and AutoAugment to the existing CNN baselines. Thirdly, all baselines and the proposed network are trained and evaluated. Lastly, to understand how a CNN classifier thinks about a given input CTS image, the CAM visualization technique is harnessed.

3.1. Building a Labeled CTS Dataset

3.1.1. Overview of the CTSs

To date, there are hundreds of thousands of diverse CTSs across China. In this study, we focus on the first three batches of Chinese traditional villages published by the Ministry of Housing and Urban–Rural Development of the People’s Republic of China with over 2500 CTSs. Figure 2 illustrates the geographical locations of these traditional settlements with the data coming from the Digital Journal of Global Change Data Repository [35].
The CTSs are the reflection of the local environment, culture, and human activities. Therefore, as shown in Figure 2, the first to third batches of traditional villages have already covered all provinces and regions in China, but their distribution is unbalanced. At the same time, we should also see that there are too many traditional settlements to investigate one by one. Thus, the classification of architectural styles through the eye of artificial intelligence not only can help understand the traditional settlements and their mutual relations from a macro scale but also provides a reference for the zoning of CTSs. The key problem is to define representative architectural styles from the enrichment of digital visual archives of CTSs.

3.1.2. Representative Architectural Styles of the CTSs

In the long history of China, as people adapt to a local natural environment, many distinctive examples of traditional architecture have been left. Those collections of architecture with certain scales gradually develop into a particular architecture style to represent local folk customs and history. In this study, we shortlist six representative architectural styles of the national CTSs, including Min, Wan, Su, Jin, Jing, and Chuan styles. Their typical photos and detailed descriptions are shown in Table 1.

3.1.3. Data Collection and Preprocessing

Due to a lack of annotated architectural style datasets of the CTSs, we firstly collect numerous CTS images from existing CTS field research images of our research group and crawl public online images. Subsequently, rigorous quality inspection is conducted to remove irrelevant CTS images manually. Lastly, all images are preprocessed to facilitate deep learning model training, including data normalization and image size resizing.
(1)
Data collection and rigorous quality inspection
As is detailed in Section 3.1.2, six representative architectural styles of the CTSs are selected as targeted architectural styles, including Min, Wan, Su, Jin, Jing, and Chuan styles. To collect images of the targeted styles, we employed existing field CTS images from our research group and searched images on popular image search engines based on keywords (e.g., building names) of each style. For instance, we utilized key words “Dai bamboo tower” and “Sip song pan na” to find images of Chuan style on the Internet search engines. Furthermore, we also manually shortlist CTS images, retain those images with noticeable characteristics of each style and remove unclear and atypical ones. In total, we end up collecting over 1200 images, with each style about 200 images. Table 2 illustrates the number of images for each style. The new dataset is relatively small sized and might be prone to suffering overfitting problems. In Section 3.3, we present a new framework to mitigate the overfitting problem for the new small-sized dataset.
(2)
Data preprocessing
After data collection, we preprocess the dataset with three fundamental processing operations to facilitate the DL model training. First, due to inconsistent sizes of the image, all images in the new dataset are resized to the same size (i.e., 224 × 224) obeying the image resizing strategy utilized in the AlexNet [27]. Second, the training and test set are created by splitting the whole dataset randomly with a training and test ratio of 4:1. Table 3 presents details of the number of images of the training and test set for each style. Moreover, Figure 3 illustrates a graphic form of the training and test class distribution. Finally, to facilitate better model convergence, each image is normalized during the training.

3.2. Benchmarking the CTS Dataset Using Representative CNNs

After establishing the first publicly open architectural style dataset for CTSs, we benchmark the new dataset using three representative CNNs, including AlexNet [27], ResNet [11], and DenseNet [12]. Similarly to previous studies [8,9] which apply the CNNs to address the classification problem by training them on small-sized CNNs, overfitting problem is identified as a main problem which achieves almost perfect performance on the training set, whilst it suffers on the test set with a large performance gap. This is mainly due to the dilemma between the small-sized dataset and large capacity of the CNNs. These CNNs are often very deep, with millions of parameters and possess a much larger capacity, while the training dataset is small in scale. As a result, the CNNs possibly merely learn noise or random fluctuations in the small-scale training set, thus leading to poor generalizability on the unseen set (i.e., test set). These three types of networks are utilized as baselines to develop our new framework to mitigate the overfitting problem confronted with the small-sized dataset.

3.3. The Proposed Framework DenseNet-TL-Aug

To address the overfitting problem faced with applying the CNNs on the small-sized labeled dataset, we propose a new DL framework named DenseNet-TL-Aug, which integrates transfer learning (TL) and AutoAugment (Aug) component into the best performing CNN baseline DenseNet. In the following sections, TL and Aug component are elaborated in detail.

3.3.1. Transfer Learning

Transfer learning (TL) is an extremely powerful deep learning technique to overcome the overfitting problem resulting from training on a small-sized dataset. Its basic idea is transferring and reusing knowledge from one source domain to another related domain. For example, knowledge distilled while learning to recognize horses can be useful to recognize other kinds of animals, e.g., zebras. Typically, when two tasks (source and target task) are similar, using the pre-trained model from the source task to train or repurpose the target task can greatly enhance model recognition performance.
In this study, we use one common transfer learning technique—feature extraction—to tackle the overfitting problem. Specifically, a pre-trained CNN, such as DenseNet121 trained on the ImageNet dataset, is used as the backbone to extract generic features for the recognition. Subsequently, a new classifier is trained from scratch to repurpose the architectural style CTS dataset. The pre-trained CNN consists of two parts: convolutional base and densely connected classifier. Typically, the representations learned by the former convolutional base are generic, which is useful to any other computer vision problems at hand. It is worth mentioning that the transfer learning technique is still applicable and useful even when the source and target domain has very different data distributions, e.g., the CTS images are quite different from the images from ImageNet-1K. This is because the extracted meaningful features by the convolutional base are sufficiently generic and are useful for the classification for a specific target domain. However, the representations extracted by the densely connected classifier are specific to the set of categories on which the CNN was trained (i.e., the 1000 categories of the ImageNet dataset). On the other hand, the representations learned by the former convolutional base contain object location, whereas the representation extracted by the densely connected classifier no longer encompasses any location information of the objects. Therefore, the convolutional base of the CNN is reused which is frozen during training, and the densely trained classifier is substituted by a new classifier. Figure 4 illustrates the basic idea of applying the transfer learning technique to the baseline CNNs, which displaces classifiers of the pre-trained CNN to repurpose the CTS dataset, whilst freezing its convolutional base to reuse the visual knowledge from the ImageNet dataset. It is worth mentioning that the weights of the classifiers are randomly initialized, while the weights from the convolutional base are all fixed during training. In Section 4.2, results of TL-enhanced CNNs are presented.

3.3.2. AutoAugment

To further mitigate the overfitting of the baselines, a learning-based DA technique named AutoAugment (Aug) [14] is harnessed. The fundamental idea of AutoAugment is to use a reinforcement learning algorithm to increase quantity and diversity of the existing training dataset. Intuitively, it aims at making a network invariant to the input’s transformation, such that the network can be taught what image invariances are like in the current data domain. By doing so, the AutoAugment can automatically learn custom DA transformation policies for a given dataset, such as guiding toward choosing a set of image transformation operations, e.g., rotation, shearing and translation, flipping vertically or horizontally, adjusting the color brightness, etc. Usually, the AutoAugment can find an optimal policy set for a very large-sized dataset.
In this study, we follow the official AutoAugment implementation [14] to employ a reinforcement learning algorithm to learn dataset-specific data augmentation strategies brutally. For the CTS dataset, there are five policies, each of which has five sub-policies. Each sub-policy comprises two data augmentation operations, which are chosen from a predefined 16-data augmentation operation set, such as rotation, shearing and translation, flipping vertically or horizontally, adjusting the color brightness, etc. As the reinforcement learning algorithm proceeds, the optimal policy set could be searched by rewarding on the higher accuracy of classifying the validation set of CTS dataset. In the end, an optimal policy set (i.e., data augmentation set) for the CTS dataset can be searched out automatically.
In Section 4.2, results of Augmentation-enhanced CNNs are presented.

3.4. Model Evaluation Metrics

To evaluate the classification model performance, a confusion matrix is firstly presented to demonstrate classification performance visually, after which we utilize several typical multi-classification metrics (e.g., accuracy, precision, and recall) to evaluate the performance of the classification models. The detail of each metric is summarized as follows.
  • Confusion matrix (CM). A CM is a summary table of prediction results on a classifier which allows presenting the performance of the classifier visually. Typically, each row represents an actual class, while each column represents a predicted class (shown in Figure 5). CM not only enables the visualization of the performance but also allows easy identification of the confusion between classes, i.e., misclassifying one class with another class. In addition, most concise classification performance metrics, e.g., accuracy, precision, and recall, are calculated based on the components of CM, such as the number of true positives (TP), the number of false positives (FP), the number of true negatives (TN) and the number of false negatives (FN).
    Figure 5. A confusion matrix table.
    Figure 5. A confusion matrix table.
    Remotesensing 14 05250 g005
  • Overall accuracy (OA), precision, recall, and F1 score. OA is the rate of correctly predicted data points concerning the total number of data points (Equation (1)). However, OA is not sufficient for evaluating a classifier, especially when dealing with imbalanced datasets (i.e., some classes in the dataset are much more frequent than others). Therefore, we consider using more classification metrics including mean accuracy, precision, recall, and F1 score. Mean accuracy is the mean of the accuracy over all classes (Equation (2)). Precision is the accuracy of the positive predictions (Equation (3)), while recall is the ratio of positive data points that are correctly detected by the classifier (Equation (4)). To integrate the precision and recall into a single metric, the F1 score is often used which computes the harmonic mean of precision and recall (Equation (5)). Typically, the classifier gets a high F1 score if both recall, and precision are high.
A c c u r a c y = T P + T N T P + T N + F P + F N  
m e a n   A c c u r a c y = i A c c u r a c y i  
P r e c i s i o n = T P T P + F P  
R e c a l l = T P T P + F N  
F 1   s c o r e = 2 R e c a l l × P r e c i s i o n R e c a l l + P r e c i s i o n  

3.5. Interpreting the CNNs Using the Grad-CAM

Instead of applying the CNNs as black boxes, we employ the class activation map (CAM) visualization technique to promote their interpretability: why do our developed classifiers perceive a given image belongs to Jing style when they think it is Su-style-like, not otherwise? This CAM technique allows us to understand which parts of a particular CTS image contribute most to a specified class, thus revealing why a classifier (i.e., a CNN model) thinks a given image belongs to a particular class. Essentially, the CAM technique refers to creating heatmaps of class activation over the input images to understand why a classifier/CNN makes such a decision. The resultant heat map consists of a 2D grid of scores that are related to a given output class, each of which in the input image reveals how important each part is to the given class. For example, in this study, when feeding a CTS image into a CNN, the CAM visualization can produce a heat map for a particular class (e.g., Jing style) to uncover how Jing-like different parts of the image are. Similarly, other heat maps for other classes, such as Su or Wan style can also be generated.
Currently, Grad-CAM [36] is often used to visualize a CNN via gradient-based localization. The fundamental idea behind the Grad-CAM is to leverage the spatial information preserved through convolutional layers in the classifier to understand which parts of an input image are important for a final classification decision. It generates a coarse localization map highlighting important regions in the image for a targeted goal by making full use of their gradients flowing into the final convolutional layer. Essentially, comprises two core steps: (1) obtaining a feature map of a convolution layer with respect to a given input image and (2) figuring out every channel in the feature map via the gradients of the class associated with the channel. It is worth mentioning that the reason why Grad-CAM exploits feature maps of the last convolutional layer is possible that the last convolutional layer can strike a good compromise between high-level semantics and detailed spatial information. Algorithm 1 presents details of generating the class activation heatmap for given images using a pre-trained model under a specified class.
Algorithm 1: Grad-CAM visualization technique for interpreting a CNN classifier
Input: given input images X, a pre-trained model M, and a specified class k
Output: the class activation heatmaps H for a particular class
1Load a pre-trained model M
2Preprocessing given input images X to obtain X’ (in batch form)
3for each image x in X’:
4 create a classifier that maps 𝑥 to the activations of the last convolutional layer L
5 create a model that maps the activations of the last convolutional layer to the final predictions
6 compute gradients of the top predicted class for x w.r.t. the activations of the last convolution layer L
7 apply pooling and importance weighting to the gradient tensor to obtain the heatmap of class activation
8 normalize the heatmap between 0 and 1
9 generate an image that superimposes the original image on the heatmap
10end for
Simply put, the CAM allows us to interpret which parts contribute more to a given class, thus enabling to localize objects in images. From another perspective, it serves as a good tool to help “debug” the decision process of a classifier/CNN, especially when the classifier made a mistake, thereby promoting model interpretability. Keeping in mind these insights into how the classifier thinks, we may investigate the differences between the machine and human eyes and shed light on how to supplement human expertise with machine perception (i.e., how a computer vision program thinks about a given image). Experimental results of the CAM visualization are shown in Section 4.3.

4. Experiments and Results

In this section, we firstly benchmark three representative CNNs on the new CTS dataset, show their results, and then identify the overfitting as a bottleneck to classify the CTSs. Then, to mitigate the overfitting problem, we employ the proposed framework to train the dataset and compare the performance of the proposed framework with the baselines. Finally, the results of Grad-CAM on our best model are shown to reveal how a CNN classifier recognizes a specified architectural style of Chinese traditional settlement.

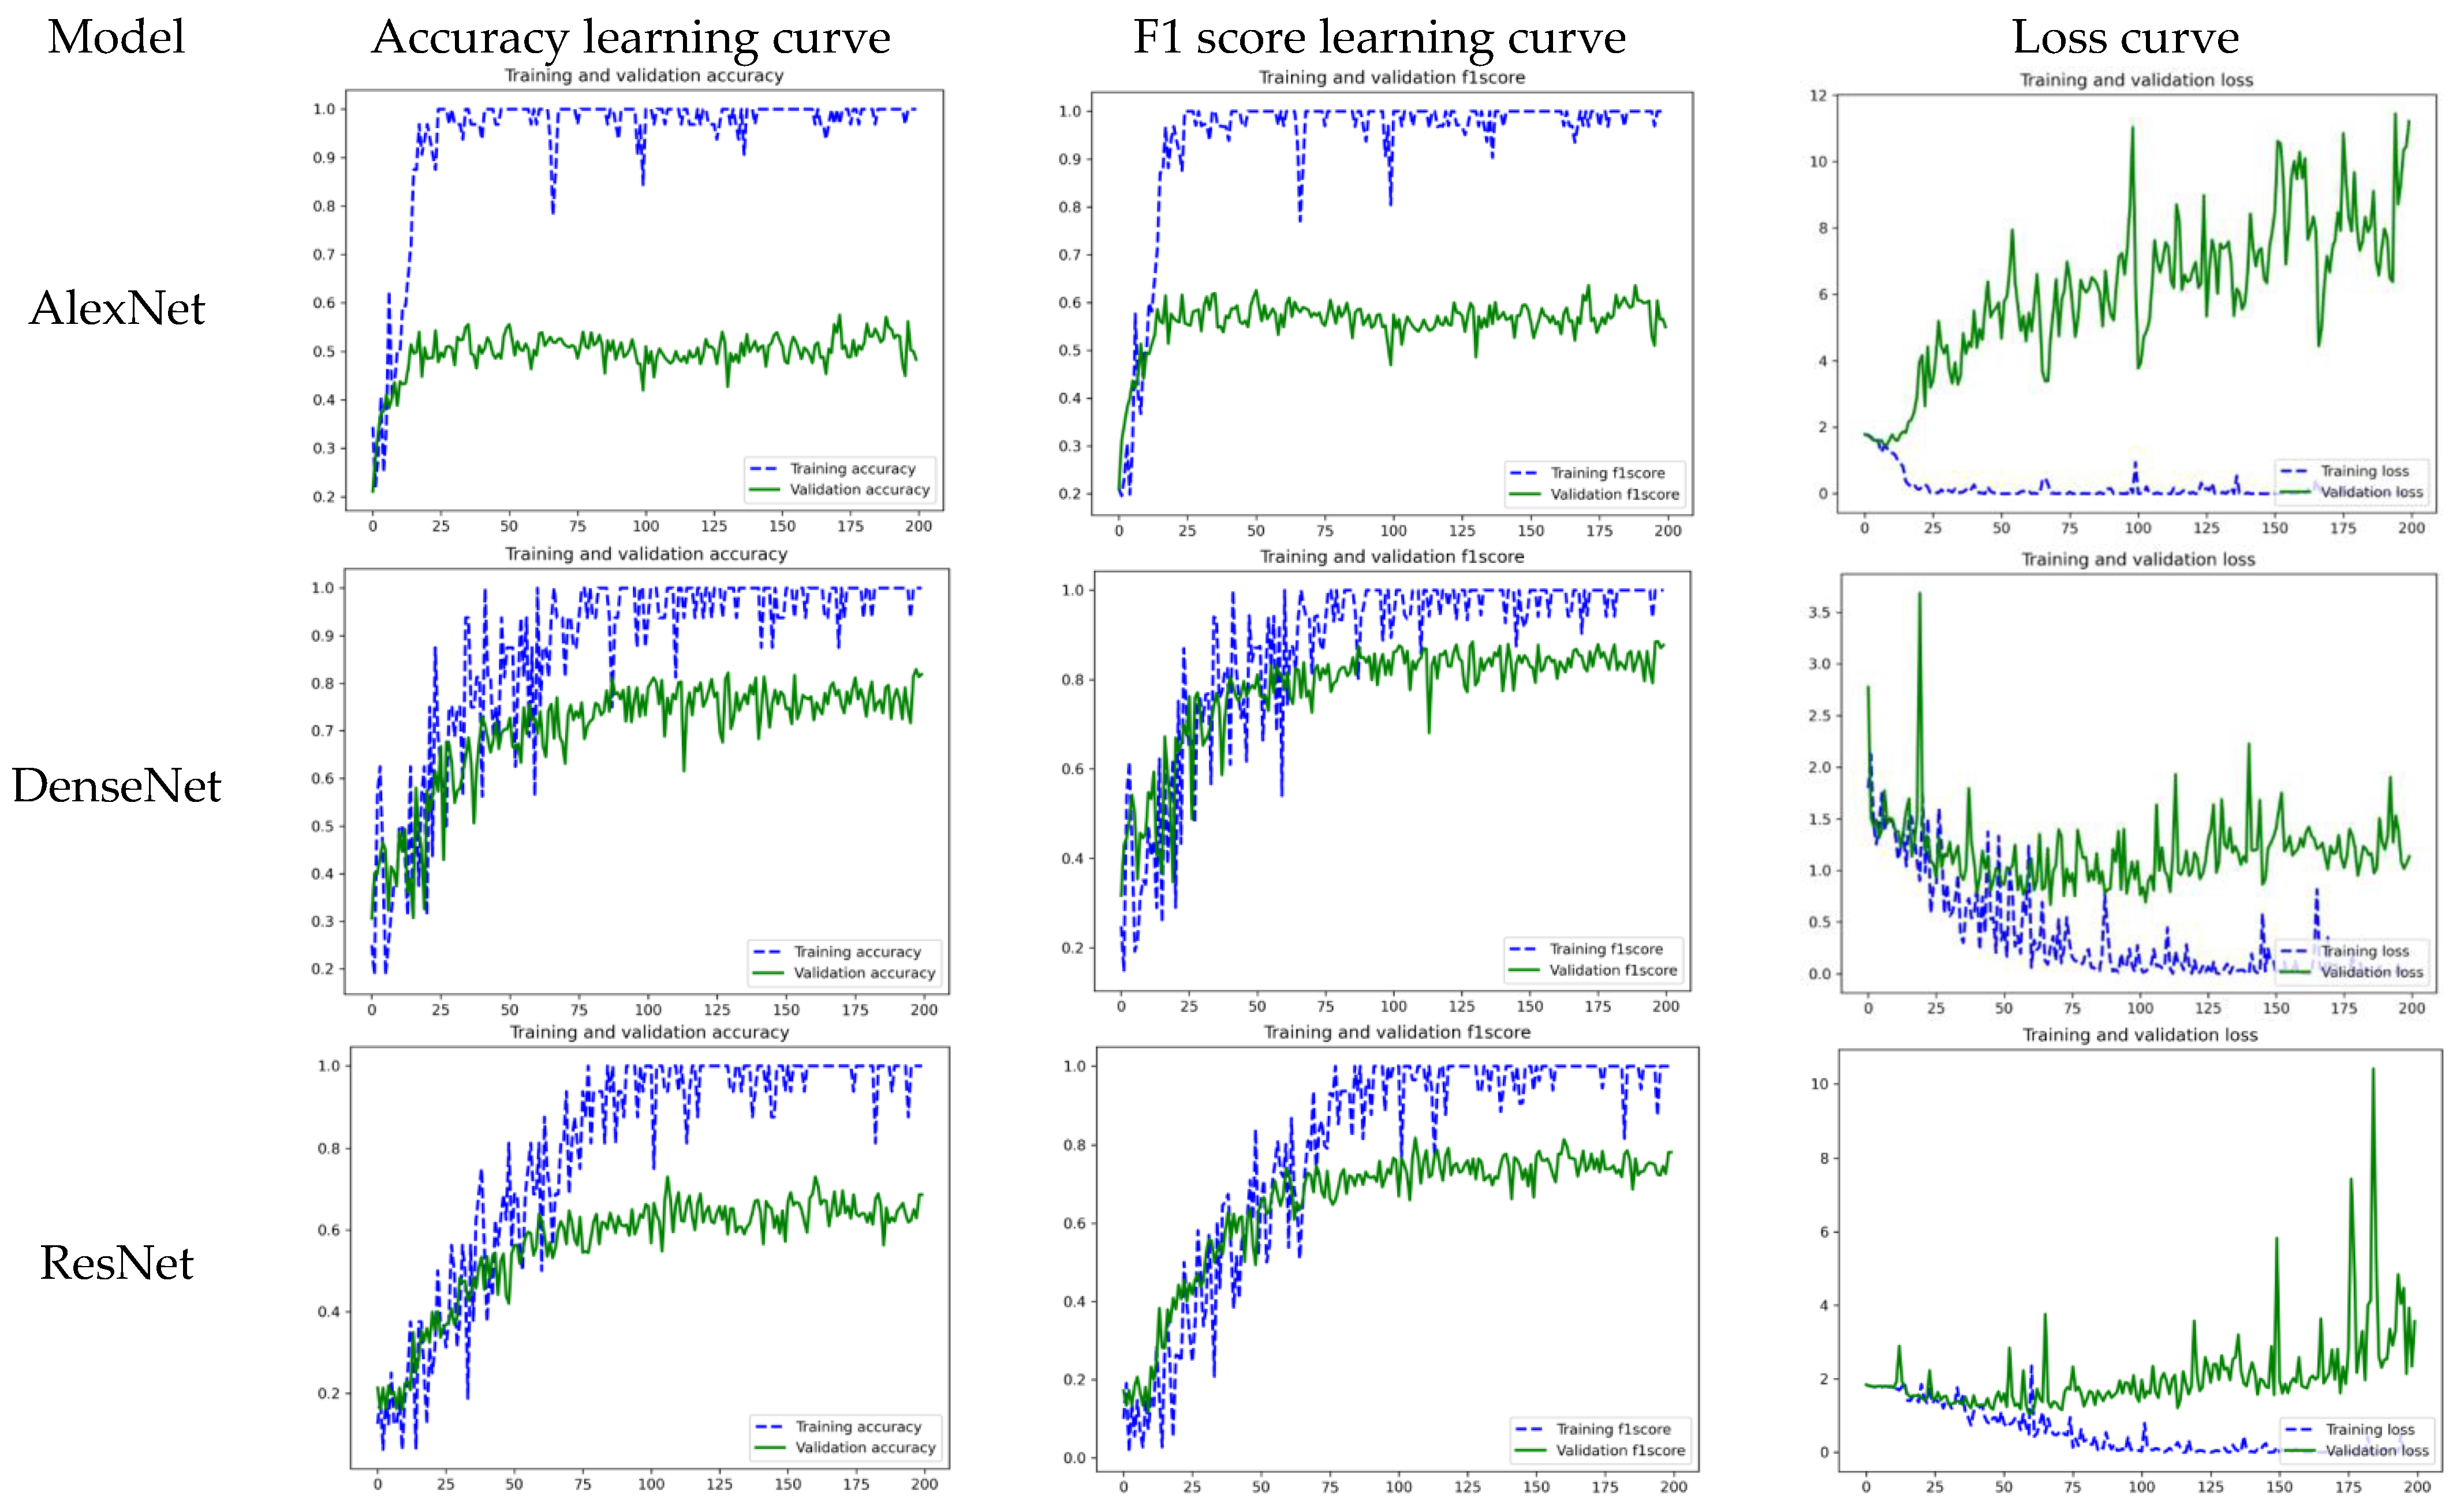
4.1. Results of the Baselines

As discussed in Section 3.2, three representative CNNs are applied to benchmark our newly established architectural style dataset. All models are trained 200 epochs on the training set with batch size 32 and Adam optimizer, detailed performance on the test set for each network is presented in Table 4. It is discovered that the DenseNet achieves the best performance with an accuracy of 82.92% and an F1 score of 88.56%, while ResNet performs slightly worse. However, as is shown in Table 4, the AlexNet classifies the CTS images very poorly, with an accuracy of below 60%.
As is shown in accuracy the learning curve of Figure 6, all three of these CNN baselines suffer from the overfitting problems; they achieve almost perfect performance on the training set, whilst performing poorly on the test set. For example, as is depicted in Figure 6, the AlexNet model achieves nearly 99% accuracy on the training set but degrades greatly on the test set, with a drop in a classification performance accuracy of 50%. Similar overfitting phenomena are also observed on the DenseNet and ResNet CNNs. Therefore, the overfitting problem is identified as the main bottleneck of applying CNNs to the small-sized dataset, which often yields poor performance on the test set.

4.2. Result of the Proposed Framework

For a fair comparison, all training settings in this section are similar to the baselines’ settings (as discussed in Section 4.1). Our proposed framework (elaborated in Section 3.3) with three different types of the backbone (i.e., AlexNet, ResNet, and DenseNet) is applied to train on the CTS dataset, leading to three corresponding CNNs with transfer learning and AutoAugment utilized, which are AlexNet-TL-Aug, DenseNet-TL-Aug, and ResNet-TL-Aug.
As is illustrated in Table 5, the proposed networks (AlexNet-TL-Aug, DenseNet-TL-Aug, and ResNet-TL-Aug) demonstrate several superior properties. First, thanks to transfer learning and data augmentation techniques, our models, including AlexNet-TL-Aug, DenseNet-TL-Aug, and ResNet-TL-Aug, exceed their corresponding baselines by a large margin. For example, compared with the AlexNet baseline, the AlexNet-TL-Aug achieve a performance boost on accuracy and F1 score by over 29.5% and 26.2%, respectively. In addition, the proposed DenseNet-TL-Aug achieves the best performance, with an accuracy of 94.15% and an F1 score of 95.06%, outperforming the baseline DenseNet by 11.2% and 6.5%, respectively. Second, the overfitting problem is greatly mitigated, whereby the model performance gap between the training and test set appears to be much smaller (as is shown in Table 5). Lastly, as is depicted in Figure 6 and Figure 7, the proposed models can converge much faster to yield the best performance, with about 30 epochs, while baselines need 100 epochs or more training epochs to converge. In Section 4.3, we will use the best model (i.e., DenseNet-TL-Aug) to study how it recognizes architectural patterns of a given CTS image.

4.3. Results of the Grad-CAM Visualization

Three typical architectural style images (shown in Figure 8a) from the test set were fed into our best-trained model (i.e., DenseNet-TL-Aug) to apply the Grad-CAM technique to test how the CNN classifier thinks these images belonging to a particular architectural style. As is shown in Figure 8b, in the chosen examined images, when perceiving the Chuang- or Jing-style images, our DenseNet-TL-Aug classifier values more on the building part in the images (more intense yellow color on the building part). Yet, when understanding the Jin-style image, the classifier attends differently, mainly focusing on both wall texture and building eave in the image, though the two sides are not equally intense. The reason why the classifier places more attention to the right side is possibly that the view angle of the picture is relatively centered from the photographer’s perspective. Interestingly, the classifier seems to perceive the visual images similarly to how we humans do. For given input images with different architectural styles, it looks at different parts of the input to judge its final style type. Interestingly, the machine perception model (i.e., the CNNs) seems to think similarly to how we humans perceive the architectural styles, which attends to similar regions of the input images for a particular style image.

5. Conclusions

This paper investigates applying the latest deep learning techniques to achieve automatic classification of architectural style for the CTSs. To the best of our knowledge, this is the first study dedicated to the automated classification of traditional settlements using DL. An automated DL framework is proposed to classify the CTS images by transfer learning and the AutoAugment technique. First, due to a lack of architectural style images of CTSs, a labeled CTS dataset is established. Second, several representative CNNs are benchmarked on the new dataset, including AlexNet, DenseNet, and ResNet. Third, to address the severe overfitting problem encountered by the representative CNNs, a new type of network is developed, which consists of two key components: (1) transfer learning and (2) learning-based data augmentation (i.e., AutoAugment).
Extensive experiments are conducted to demonstrate the effectiveness of our proposed framework. The proposed networks (AlexNet-TL-Aug, DenseNet-TL-Aug, and ResNet-TL-Aug) significantly outperform the baselines by a large margin. The DenseNet-TL-Aug achieves the best performance, with an accuracy of 94.15% and an F1 score of 95.06%. Finally, we also harness the Grad-CAM visualization technique to interpret how the CNNs perceive a specified architectural style image and which parts contribute more to a given class. This greatly helps promote model interpretability, since the CAM map images provide visual hints to “debug” the decision process of a classifier when the classifier makes a mistake.
Our contributions are three-fold. First, we build an architectural style dataset of CTSs. To the best of our knowledge, this is the first public dataset in this domain. Second, we benchmark several representative DL-based CNNs on the dataset and propose an integrated deep learning framework that makes full use of transfer learning and AutoAugment techniques to combat the overfitting problem confronted with training on the small-sized datasets. Lastly, by leveraging the Grad-CAM visualization techniques, we reveal how CNNs are capable of recognizing architectural style patterns, which shed light on interpreting the rationales of machine perception using the CNNs. The newly built CTS dataset and deep learning code in this study will be released on the authors’ GitHub page: https://github.com/PointCloudYC/CTS (accessed on 2 September 2022).
For future work, we shall investigate semi-supervised or self-supervised techniques to address the architectural style classification, thus dispensing us from collecting and annotating data [37,38]. Moreover, the CTS dataset should be enriched to involve more representative CTS categories and more diverse images should be added. Finally, recent state-of-the-art deep learning models such as ResNeSt [39] and Efficient-Net [40] are also worthwhile studying.

Author Contributions

Conceptualization, Q.H.; methodology, Q.H. and C.Y.; validation, Q.H. and C.Y.; writing, review, and editing, Q.H., C.Y., P.L. and Y.D. All authors have read and agreed to the published version of the manuscript.

Funding

This research was supported by the National Natural Science Foundation of China (grant number 42001198 and 42071195), the Science and Technology Program of Guangdong (grant number 2021B1212100006), the GDAS’ Project of Science and Technology Development (grant number 2022GDASZH-2022010202 and 2020GDASYL-20200104004), and the “Digital Preservation and Innovative Technologies for the Culture of Traditional Villages and Towns” Open Fund of National-Local Joint Engineering Laboratory (grant number CTCZ19K04).

Data Availability Statement

The new built CTS dataset and code in this study will be released on the authors’ GitHub page: https://github.com/PointCloudYC/CTS (accessed on 2 September 2022).

Acknowledgments

We also thank four undergraduate students (Huanxuan Liao, Qin Jiang, Yaling Hu, and Qifan Shi) from the College of City and Tourism at Hengyang Normal University for their help in data collection and inspection.

Conflicts of Interest

The authors declare that they have no known competing financial interests or personal relationships that could have appeared to influence the work reported in this paper.

References

  1. China Intangible Cultural Heritage, China-Ich. (n.d.). Available online: https://www.culturalheritagechina.org (accessed on 18 December 2020).
  2. UNESCO—China. (n.d.). Available online: https://ich.unesco.org/en/state (accessed on 18 December 2020).
  3. Convention for the Safeguarding of the Intangible Cultural Heritage 2003. Int. J. Cult. Prop. 2005, 12, 447–458. [CrossRef]
  4. Preservation of China’s Intangible Cultural Heritage, EESD: The Encyclopedia of Education for Sustainable Development. (n.d.). Available online: http://www.encyclopediaesd.com/blog-1/2016/5/25/preservation-of-chinas-intangible-cultural-heritage (accessed on 18 December 2020).
  5. Ahmad, Y. The Scope and Definitions of Heritage: From Tangible to Intangible. Int. J. Herit. Stud. 2006, 12, 292–300. [Google Scholar] [CrossRef]
  6. LeCun, Y.; Bengio, Y.; Hinton, G. Deep learning. Nature 2015, 521, 436–444. [Google Scholar] [CrossRef] [PubMed]
  7. Fiorucci, M.; Khoroshiltseva, M.; Pontil, M.; Traviglia, A.; Del Bue, A.; James, S. Machine Learning for Cultural Heritage: A Survey. Pattern Recognit. Lett. 2020, 133, 102–108. [Google Scholar] [CrossRef]
  8. Obeso, A.M.; Benois-Pineau, J.; Acosta, A.Á.R.; Vázquez, M.S.G. Architectural style classification of Mexican historical buildings using deep convolutional neural networks and sparse features. J. Electron. Imaging 2016, 26, 011016. [Google Scholar] [CrossRef]
  9. Cao, J.; Cui, H.; Zhang, Z.; Zhao, A. Mural classification model based on high- and low-level vision fusion. Herit Sci. 2020, 8, 121. [Google Scholar] [CrossRef]
  10. Simonyan, K.; Zisserman, A. Very Deep Convolutional Networks for Large-Scale Image Recognition. arXiv 2014, arXiv:1409.1556. Available online: http://arxiv.org/abs/1409.1556 (accessed on 15 October 2019).
  11. He, K.; Zhang, X.; Ren, S.; Sun, J. Deep Residual Learning for Image Recognition. 2015. Available online: https://arxiv.org/abs/1512.03385 (accessed on 24 October 2018).
  12. Huang, G.; Liu, Z.; van der Maaten, L.; Weinberger, K.Q. Densely Connected Convolutional Networks. arXiv 2018, arXiv:1608.06993. Available online: http://arxiv.org/abs/1608.06993 (accessed on 5 December 2020).
  13. Tan, C.; Sun, F.; Kong, T.; Zhang, W.; Yang, C.; Liu, C. A Survey on Deep Transfer Learning; Springer: Cham, Switzerland, 2018. [Google Scholar] [CrossRef]
  14. Cubuk, E.D.; Zoph, B.; Mane, D.; Vasudevan, V.; Le, Q.V. AutoAugment: Learning Augmentation Strategies from Data. In Proceedings of the IEEE/CVF Conference on Computer Vision and Pattern Recognition, Long Beach, CA, USA, 16–20 June 2019. [Google Scholar]
  15. Fu, J.; Zhou, J.; Deng, Y. Heritage values of ancient vernacular residences in traditional villages in Western Hunan, China: Spatial patterns and influencing factors. Build. Environ. 2021, 188, 107473. [Google Scholar] [CrossRef]
  16. İpekoğlu, B. An architectural evaluation method for conservation of traditional dwellings. Build. Environ. 2006, 41, 386–394. [Google Scholar] [CrossRef] [Green Version]
  17. Bienvenido-Huertas, D.; León-Muñoz, M.; Martín-del-Río, J.J.; Rubio-Bellido, C. Analysis of climate change impact on the preservation of heritage elements in historic buildings with a deficient indoor microclimate in warm regions. Build. Environ. 2021, 200, 107959. [Google Scholar] [CrossRef]
  18. Li, G.; Jiang, G.; Jiang, C.; Bai, J. Differentiation of spatial morphology of rural settlements from an ethnic cultural perspective on the Northeast Tibetan Plateau, China. Habitat Int. 2018, 79, 1–9. [Google Scholar] [CrossRef]
  19. Potosyan, A.H. Geographical features and development regularities of rural areas and settlements distribution in mountain countries. Ann. Agrar. Sci. 2017, 52, 32–40. [Google Scholar] [CrossRef]
  20. Wu, S.; Di, B.; Ustin, S.L.; Stamatopoulos, C.A.; Li, J.; Zuo, Q.; Wu, X.; Ai, N. Classification and detection of dominant factors in geospatial patterns of traditional settlements in China. J. Geogr. Sci. 2022, 32, 873–891. [Google Scholar] [CrossRef]
  21. Guo, Y.; Mo, D.; Mao, L.; Wang, S.; Li, S. Settlement distribution and its relationship with environmental changes from the Neolithic to Shang-Zhou dynasties in northern Shandong, China. J. Geogr. Sci. 2013, 23, 679–694. [Google Scholar] [CrossRef]
  22. Prieto, A.J.; Silva, A.; de Brito, J.; Macías-Bernal, J.M.; Alejandre, F.J. Multiple linear regression and fuzzy logic models applied to the functional service life prediction of cultural heritage. J. Cult. Herit. 2017, 27, 20–35. [Google Scholar] [CrossRef]
  23. Liu, P.L.; Liu, C.L. Landscape division of traditional settlement and effect elements of landscape gene in China. Acta Geogr. Sin. 2010, 65, 1496–1506. [Google Scholar]
  24. Bianco, S.; Mazzini, D.; Schettini, R. Deep Multibranch Neural Network for Painting Categorization. In Image Analysis and Processing—ICIAP 2017; Battiato, S., Gallo, G., Schettini, R., Stanco, F., Eds.; Springer International Publishing: Cham, Switzerland, 2017; pp. 414–423. [Google Scholar] [CrossRef]
  25. Xu, F.; Ho, H.C.; Chi, G.; Wang, Z. Abandoned rural residential land: Using machine learning techniques to identify rural residential land vulnerable to be abandoned in mountainous areas. Habitat Int. 2019, 84, 43–56. [Google Scholar] [CrossRef]
  26. Gonthier, N.; Gousseau, Y.; Ladjal, S.; Bonfait, O. Weakly Supervised Object Detection in Artworks. In Computer Vision—ECCV 2018 Workshops; Leal-Taixé, L., Roth, S., Eds.; Springer International Publishing: Cham, Switzerland, 2019; pp. 692–709. [Google Scholar] [CrossRef] [Green Version]
  27. Krizhevsky, A.; Sutskever, I.; Hinton, G.E. ImageNet Classification with Deep Convolutional Neural Networks. In Advances in Neural Information Processing Systems 25; Pereira, F., Burges, C.J.C., Bottou, L., Weinberger, K.Q., Eds.; Curran Associates, Inc.: Red Hook, NY, USA, 2012; pp. 1097–1105. Available online: http://papers.nips.cc/paper/4824-imagenet-classification-with-deep-convolutional-neural-networks.pdf (accessed on 7 October 2018).
  28. Pan, S.J.; Yang, Q. A Survey on Transfer Learning. IEEE Trans. Knowl. Data Eng. 2010, 22, 1345–1359. [Google Scholar] [CrossRef]
  29. Zhuang, F.; Qi, Z.; Duan, K.; Xi, D.; Zhu, Y.; Zhu, H.; Xiong, H.; He, Q. A Comprehensive Survey on Transfer Learning. Proc. IEEE 2020, 109, 43–76. [Google Scholar] [CrossRef]
  30. Deng, J.; Dong, W.; Socher, R.; Li, L.; Li, K.; Li, F.-F. ImageNet: A large-scale hierarchical image database. In Proceedings of the 2009 IEEE Conference on Computer Vision and Pattern Recognition, Miami, FL, USA, 20–25 June 2009; pp. 248–255. [Google Scholar] [CrossRef] [Green Version]
  31. Shorten, C.; Khoshgoftaar, T.M. A survey on Image Data Augmentation for Deep Learning. J. Big Data 2019, 6, 60. [Google Scholar] [CrossRef]
  32. Yang, S.; Xiao, W.; Zhang, M.; Guo, S.; Zhao, J.; Shen, F. Image Data Augmentation for Deep Learning: A Survey. arXiv 2022, arXiv:2204.08610. [Google Scholar] [CrossRef]
  33. Li, R.; Li, X.; Heng, P.-A.; Fu, C.-W. PointAugment: An Auto-Augmentation Framework for Point Cloud Classification. arXiv 2020, arXiv:2002.10876. Available online: http://arxiv.org/abs/2002.10876 (accessed on 13 August 2020).
  34. Cubuk, E.D.; Zoph, B.; Shlens, J.; Le, Q.V. RandAugment: Practical automated data augmentation with a reduced search space. arXiv 2019, arXiv:1909.13719. Available online: http://arxiv.org/abs/1909.13719 (accessed on 18 December 2020).
  35. Yu, L.; Liu, J. The Spatial Distribution Dataset of 2555 Chinese Traditional Villages. J. Glob. Chang. Data Discov. 2018, 2, 144–150. [Google Scholar] [CrossRef]
  36. Selvaraju, R.R.; Cogswell, M.; Das, A.; Vedantam, R.; Parikh, D.; Batra, D. Grad-CAM: Visual Explanations from Deep Networks via Gradient-based Localization. Int. J. Comput. Vis. 2020, 128, 336–359. [Google Scholar] [CrossRef]
  37. Zoph, B.; Ghiasi, G.; Lin, T.-Y.; Cui, Y.; Liu, H.; Cubuk, E.D.; Le, Q.V. Rethinking Pre-training and Self-training. arXiv 2020, arXiv:2006.06882. Available online: http://arxiv.org/abs/2006.06882 (accessed on 16 December 2020).
  38. Chen, T.; Kornblith, S.; Norouzi, M.; Hinton, G. A Simple Framework for Contrastive Learning of Visual Representations. arXiv 2020, arXiv:2002.05709. Available online: http://arxiv.org/abs/2002.05709 (accessed on 22 November 2020).
  39. Zhang, H.; Wu, C.; Zhang, Z.; Zhu, Y.; Zhang, Z.; Lin, H.; Sun, Y.; He, T.; Mueller, J.; Manmatha, R.; et al. ResNeSt: Split-Attention Networks. arXiv 2020, arXiv:2004.08955. Available online: http://arxiv.org/abs/2004.08955 (accessed on 15 December 2020).
  40. Tan, M.; Le, Q.V. EfficientNet: Rethinking Model Scaling for Convolutional Neural Networks. arXiv 2020, arXiv:1905.11946. Available online: http://arxiv.org/abs/1905.11946 (accessed on 15 December 2020).
Figure 1. The proposed neural framework to achieve automatic classification and interpretation of architectural styles for CTSs.
Remotesensing 14 05250 g001
Figure 2. Geographical locations of the CTSs across China.
Remotesensing 14 05250 g002
Figure 3. The number of images in the training and test set when using the split ratio of 4:1.
Remotesensing 14 05250 g003
Figure 4. Displacing classifiers of the pre-trained CNN and freezing its convolutional base.
Remotesensing 14 05250 g004
Figure 6. Accuracy, F1 score, and loss learning curve for the representative CNNs, including AlexNet, DenseNet, and ResNet.
Remotesensing 14 05250 g006
Figure 7. Accuracy, F1 score, and loss learning curve for the proposed CNNs, including AlexNet-TL-Aug, DenseNet-TL-Aug, and ResNet-TL-Aug.
Remotesensing 14 05250 g007
Figure 8. Interpreting the CNN classifier using the CAM visualization technique. (a) Raw image; (b) Image after applying the CAM visualization technique. Note that the deeper the yellow color in the images with CAM, the higher the influence on the final decision of the classifier.
Remotesensing 14 05250 g008
Table 1. Typical photographs and detailed descriptions of the six selected architectural styles.
Typical PhotographsStyleDescription
Remotesensing 14 05250 i001ChuanChuan style is widely distributed in Sichuan, Yunnan, Guizhou province of China, mostly in the ethnic minority areas. To keep ventilation, dry, and prevent poisonous wild animals in the humid environment, the residents build the house as column or semi-column structures, such as the dai bamboo houses and the stilted buildings.
Remotesensing 14 05250 i002JinJin style is named after the abbreviation of Shanxi, most of the areas are around Shanxi province. The architecture is represented as cave dwellings in the rural area and is well designed with blue brick walls in the urban area showing the steady and preciseness of Shanxi merchants.
Remotesensing 14 05250 i003JingJing style is usually in the form of a quadrangle courtyard, which is the most typical style of northern China. The most representative, of course, is the Forbidden City, which is over 600 years old. Additionally, the quadrangle courtyards with carved or painted ornaments in Beijing Hutong are like a miniature of the Forbidden City, highlighting the stately peculiarity.
Remotesensing 14 05250 i004MinMin style originated from the ancient construction technology of raw soil in the Central Plains and has been inherited for more than 500 years in the south of Fujian (Min). This bunker-style architecture is still in use today. It can not only prevent fire and shock but also resist the invasion of the enemy.
Remotesensing 14 05250 i005SuSu style is the epitome of southern and northern architectural styles, and the garden layout is one of its prominent features. The architecture with glazed tile windows, high ridge roof, and brick gate tower, faultlessly reflect the artistic characteristics of purity, lightness, elegance, and simplicity of Jiangnan Water Town.
Remotesensing 14 05250 i006WanThe Wan style is representative of the southern folk dwellings of China. The Hui style, one of the most familiar styles in the Wan style, was inscribed on the World Heritage List in 2000. The typical features of the Wan style architecture are high walls and deep courtyards with black tiles and white walls, which are full of quietly elegant characteristics, showing the infinite charm of the Wan style.
Table 2. The number of images for each architectural style class.
ChuanJinJingMinSuWanTotal
The number of images2141931942151882221226
Table 3. Training and test set of our architectural style dataset.
ClassChuanJinJingMinSuWanTotal
Training169147166175145178980
Test454628404344246
Total2141931942151882221226
Table 4. Performance of three representative CNNs on the test set. The best metrics are highlighted in bold font in the table.
ModelAccuracyPrecisionRecallF1 Score
AlexNet57.53%77.21%57.53%63.56%
DenseNet82.92%97.08%82.92%88.56%
ResNet73.02%94.80%73.02%81.41%
Table 5. Performance comparison of the proposed networks with transfer learning and AutoAugment and baselines on the test set. The best metrics are highlighted in bold font.
ModelAccuracyPrecisionRecallF1 Score
AlexNet57.53%77.21%57.53%63.56%
AlexNet-TL-Aug (ours)86.98% (+29.5%)93.48%86.98%89.73%
DenseNet82.92%97.08%82.92%88.56%
DenseNet-TL-Aug (ours)94.15% (+11.2%)96.53%94.15%95.06%
ResNet73.02%94.80%73.02%81.41%
ResNet-TL-Aug (ours)89.98% (+11.2%)94.01%89.98%91.68%
Publisher’s Note: MDPI stays neutral with regard to jurisdictional claims in published maps and institutional affiliations.

