
Spatiotemporal Evolution of Cultivated Land Non-Agriculturalization and Its Drivers in Typical Areas of Southwest China from 2000 to 2020


Abstract
:1. Introduction
2. Study Area, Data and Methods
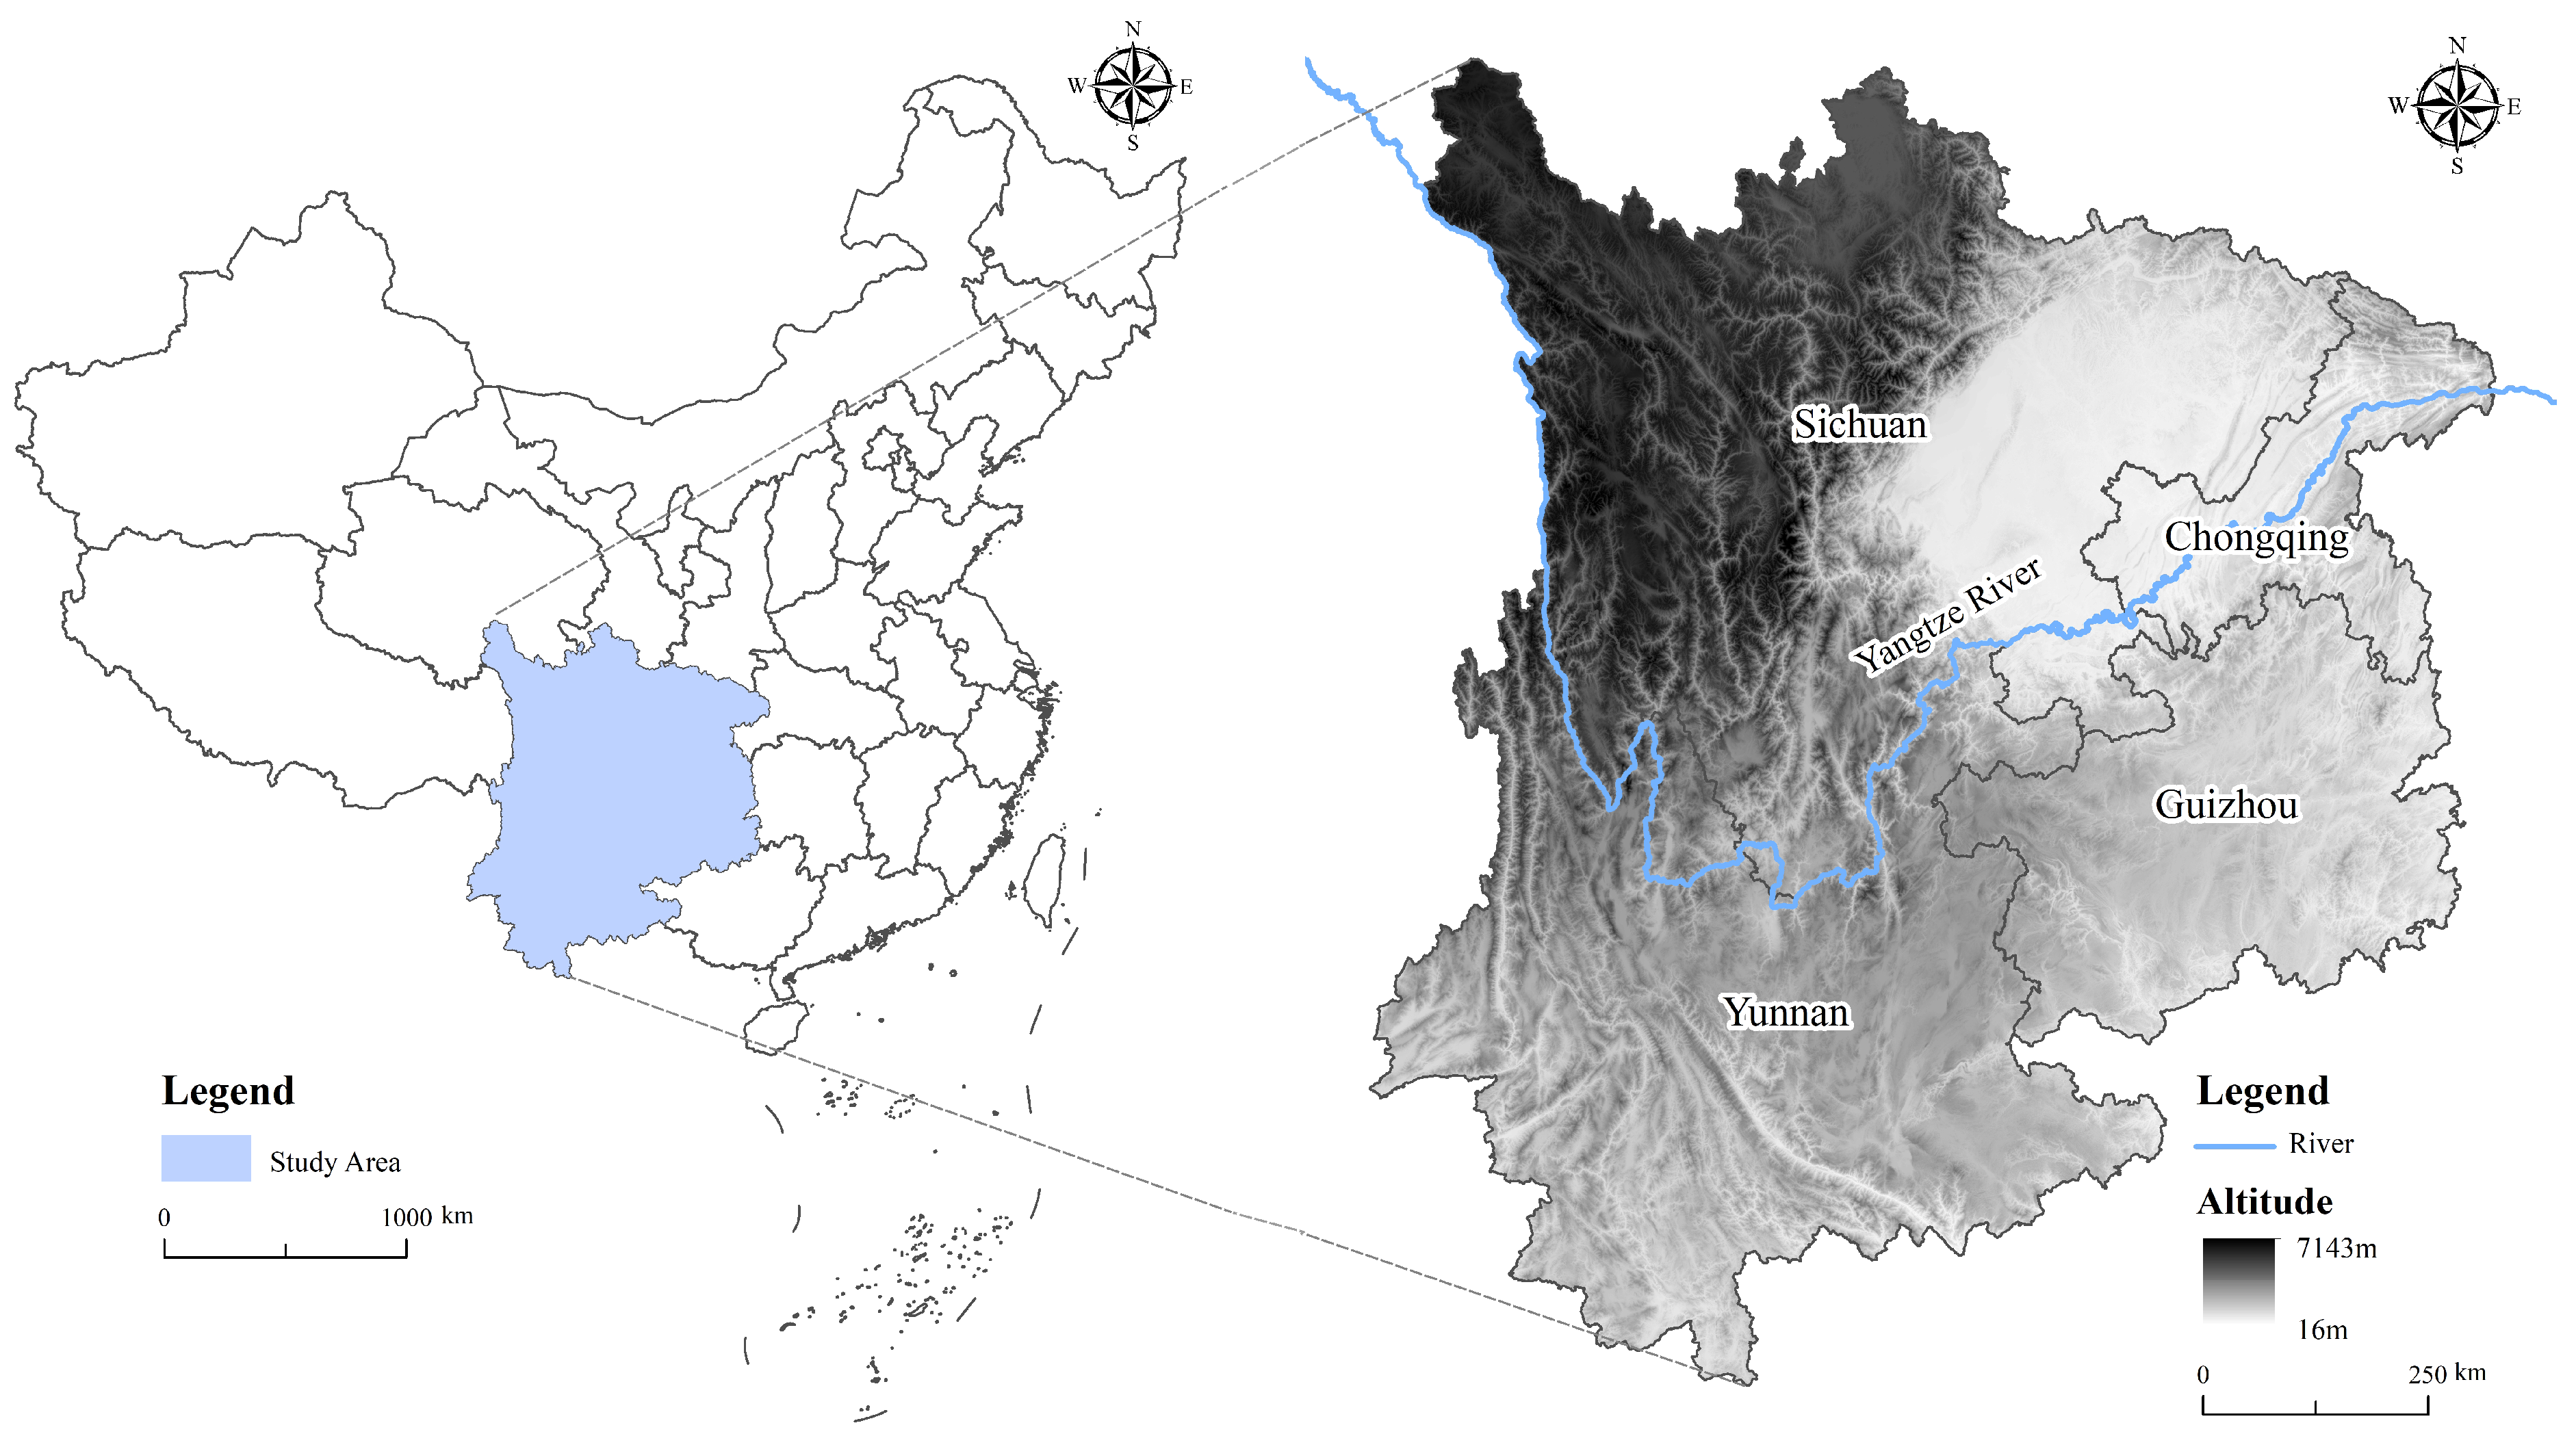
2.1. Study Area
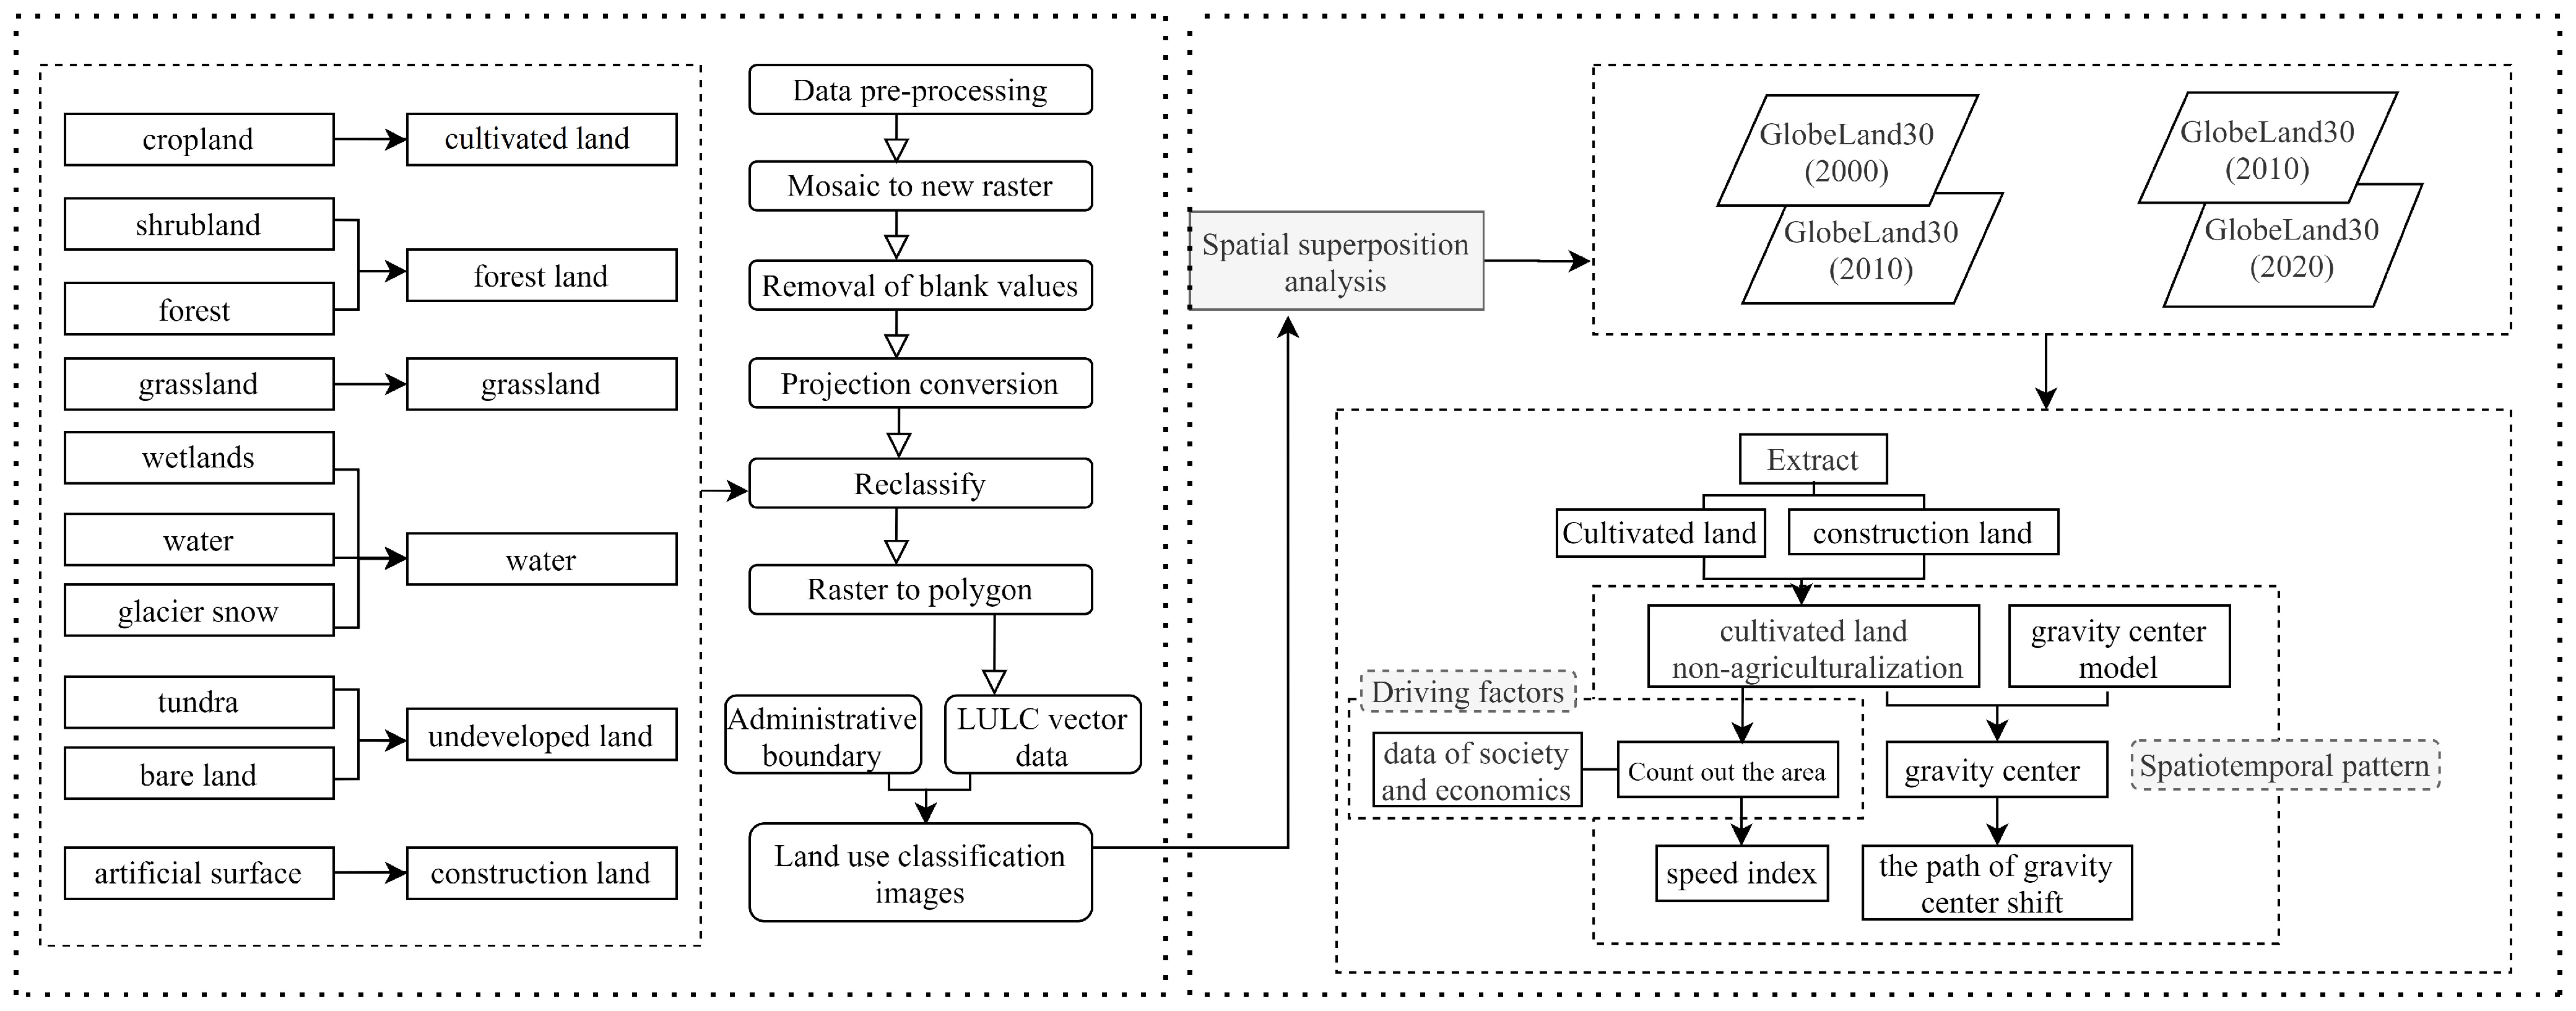
2.2. Data
2.3. Methods
2.3.1. Spatial Analysis
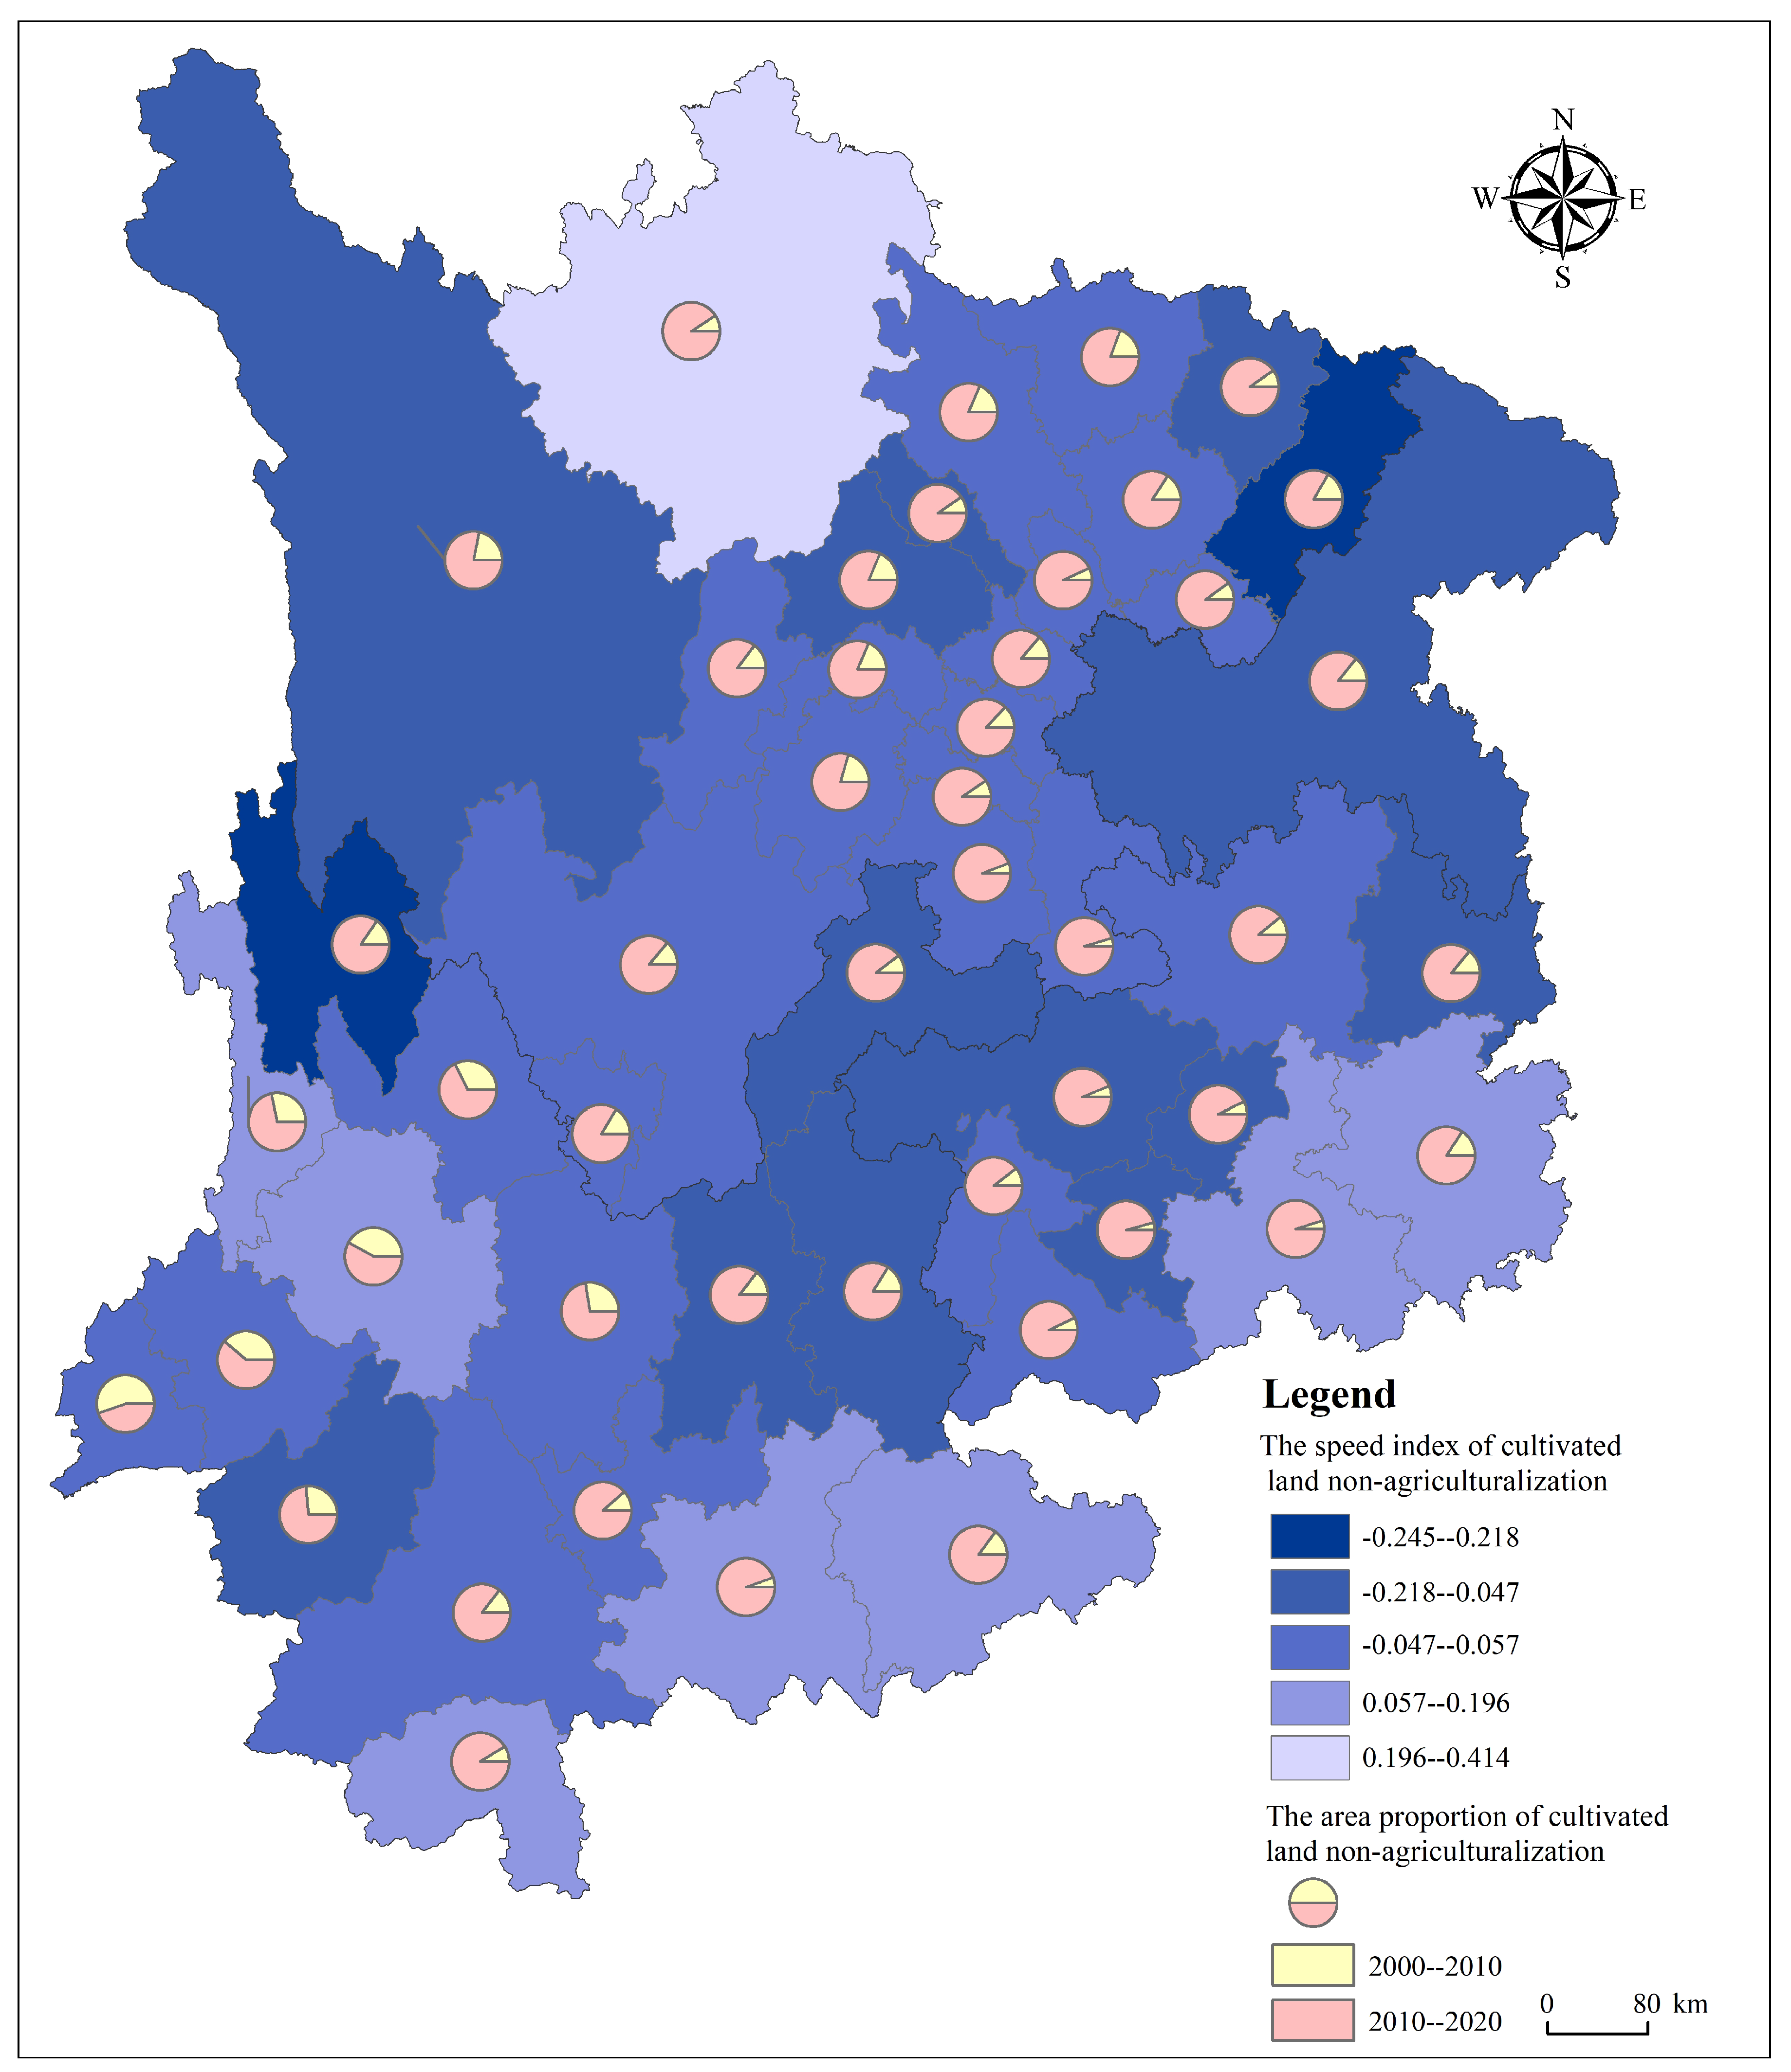
2.3.2. The Speed Index
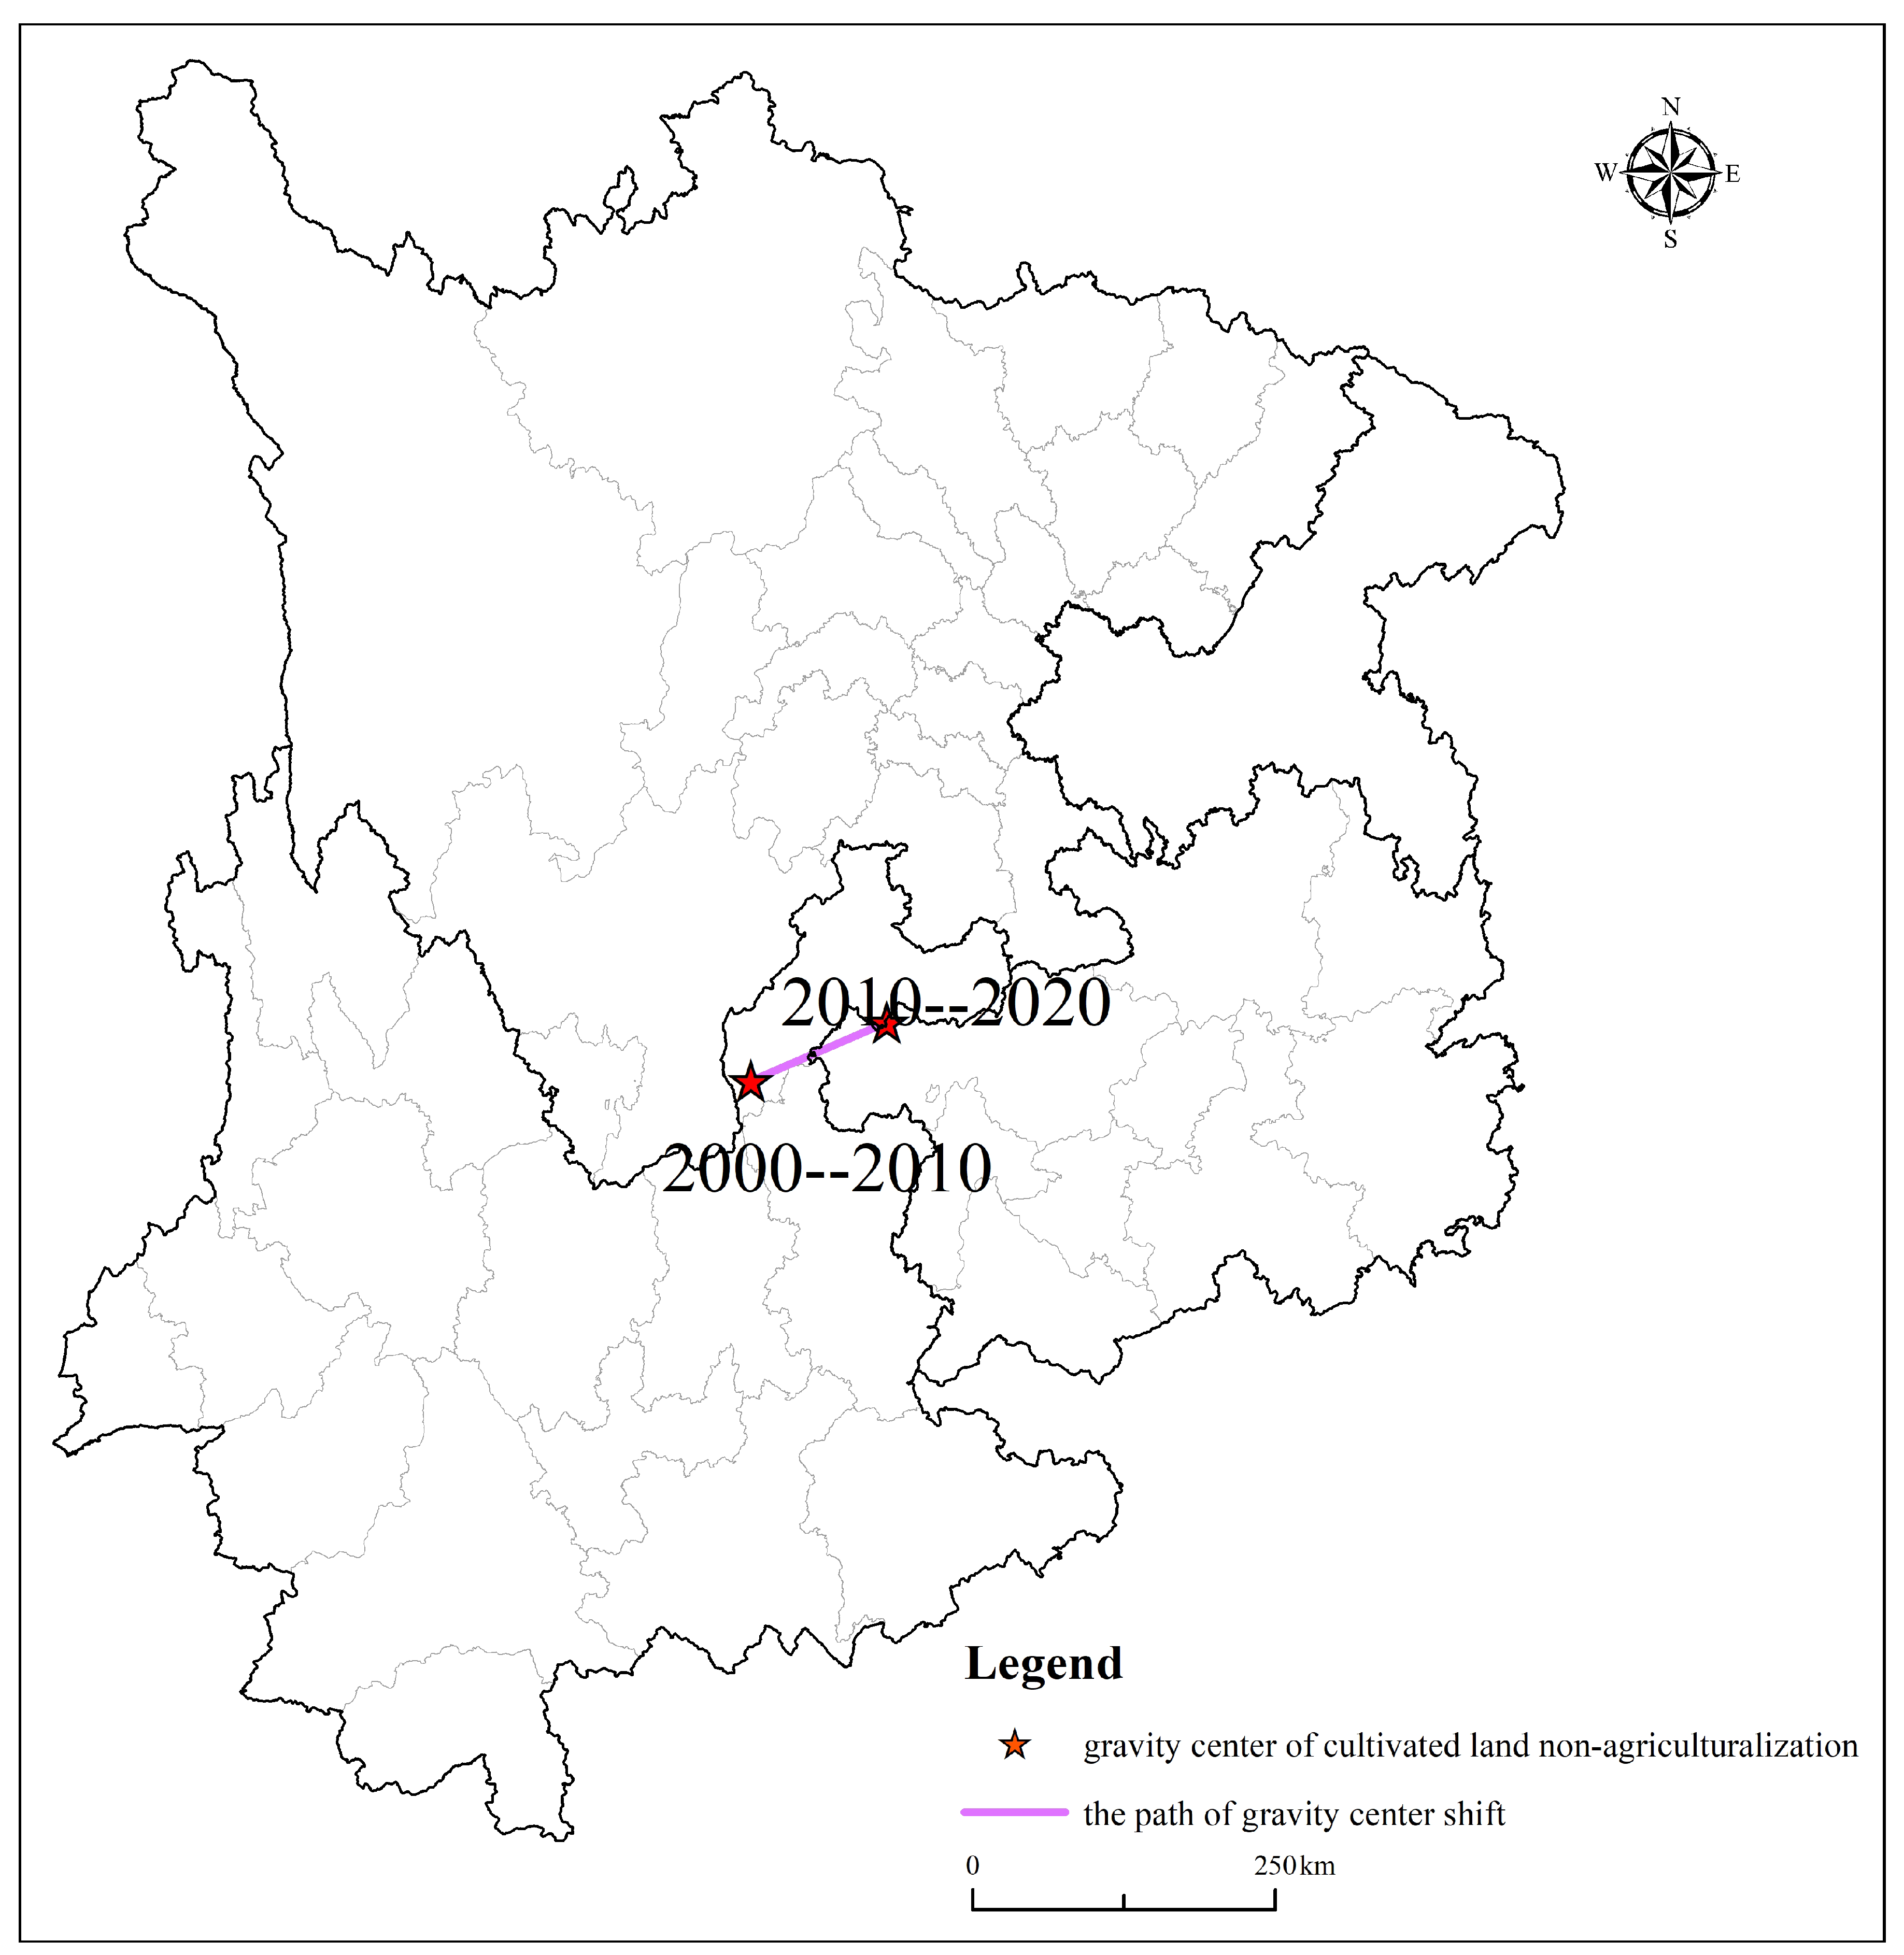
2.3.3. Gravity Center Model
2.3.4. Geographical Detector Model
3. Results
3.1. Spatiotemporal Pattern of Cultivated Land Non-Agriculturalization
3.2. Drivers of Cultivated Land Non-Agriculturalization
3.2.1. Factor Detection Analysis
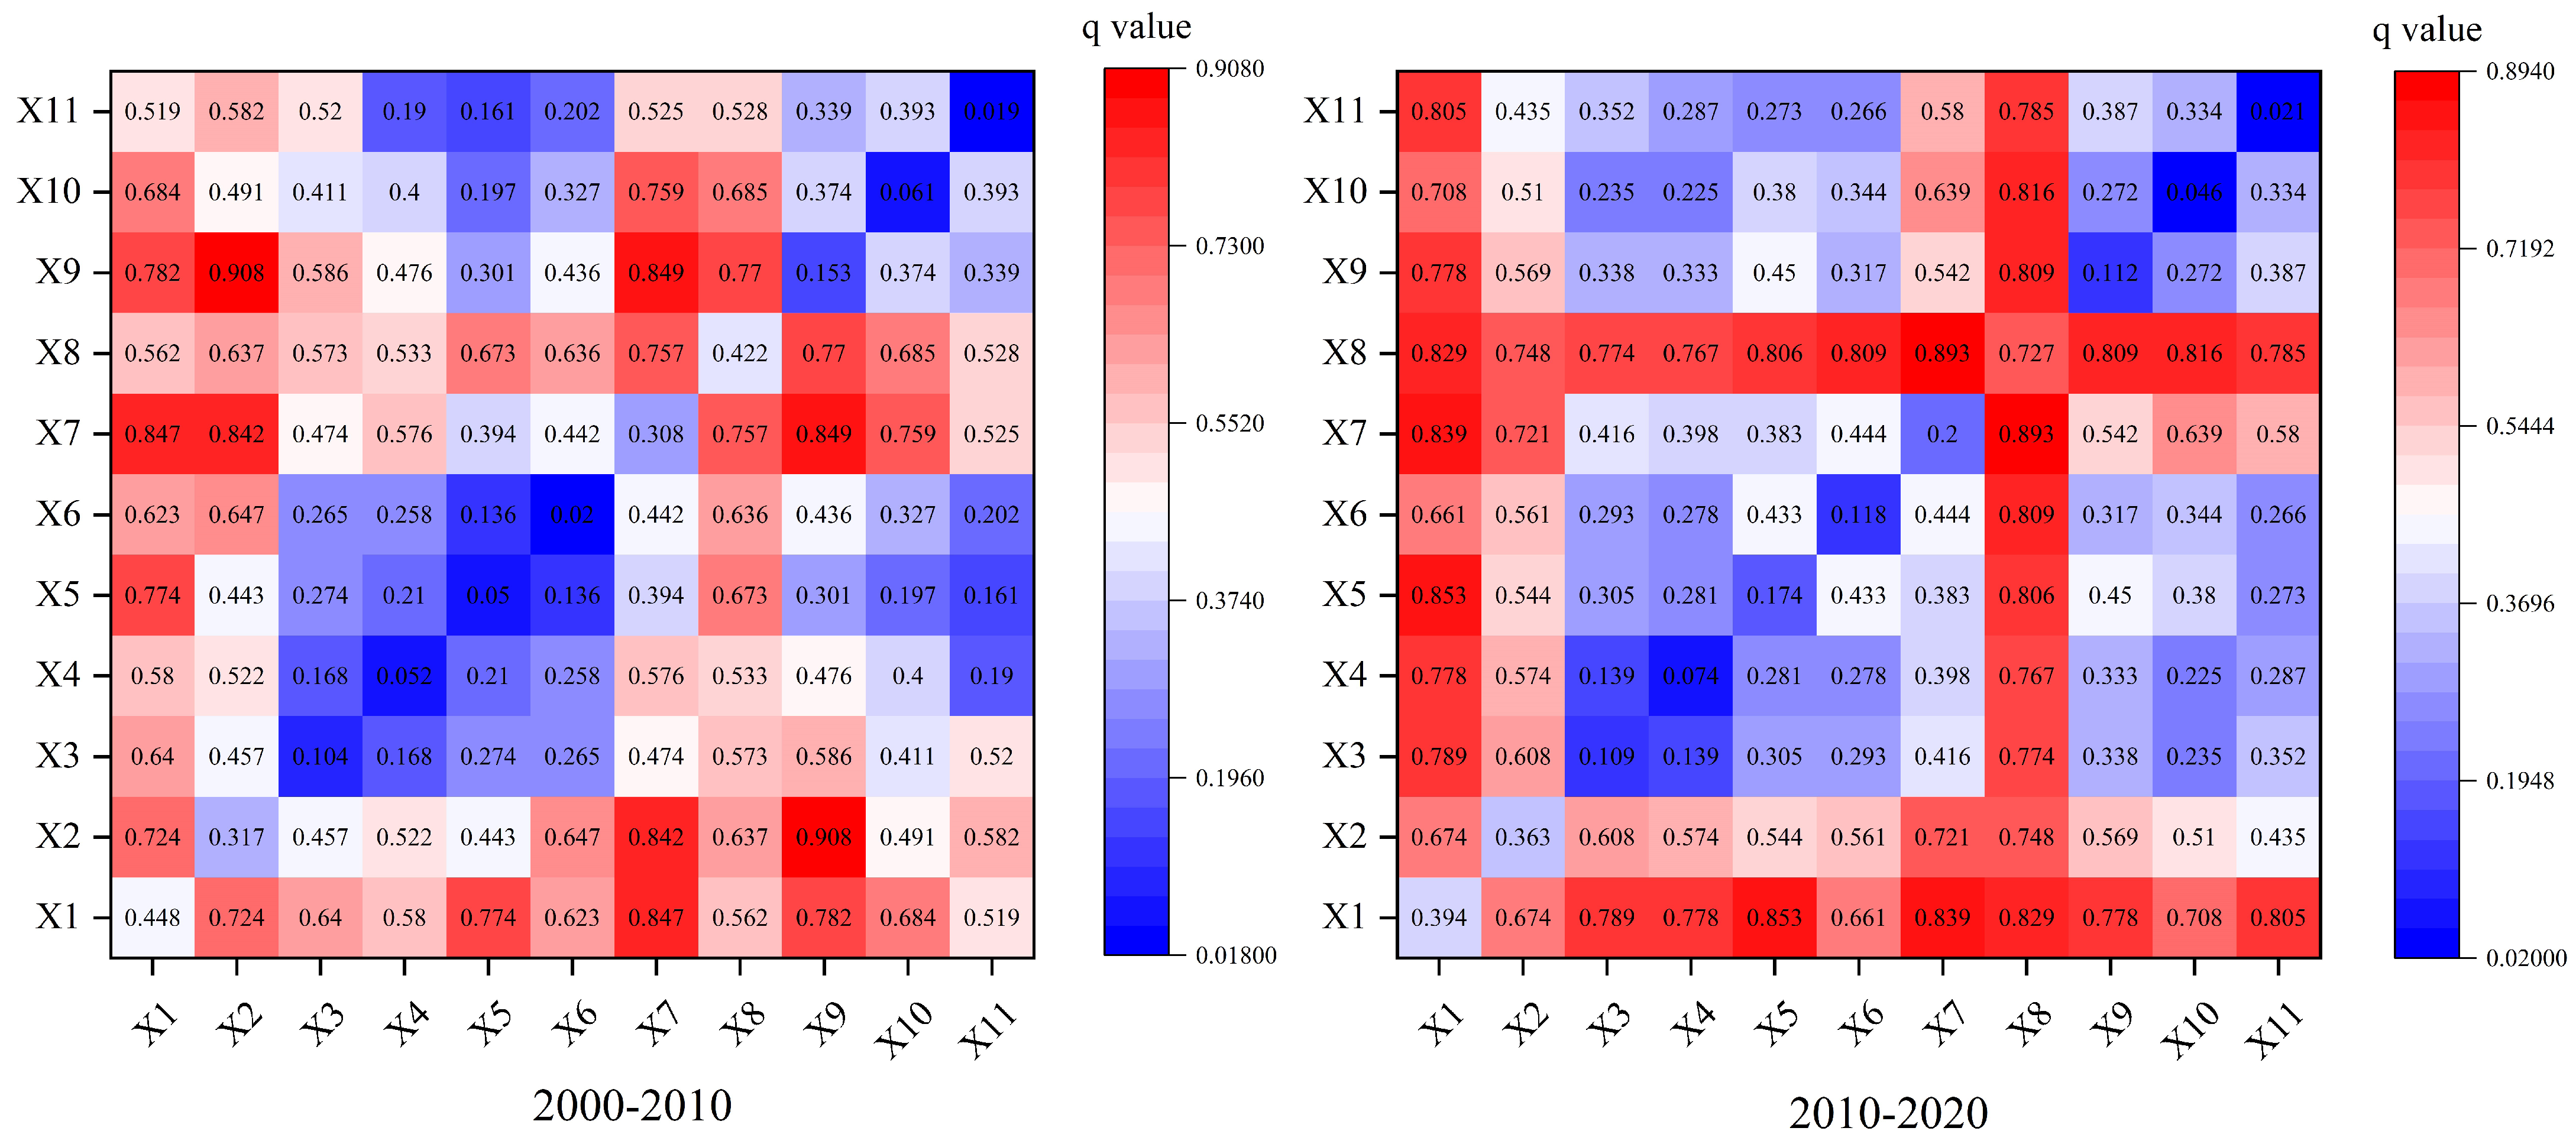
3.2.2. Interaction Detection Analysis
4. Discussion
4.1. Comparison with Other Studies
4.2. Re-Conceptualization of the Cultivated Land Non-Agriculturalization
4.3. Research Limitations
5. Conclusions and Implications
5.1. Conclusions
5.2. Policy Implications
Author Contributions
Funding
Data Availability Statement
Acknowledgments
Conflicts of Interest
References
- Bagan, H.; Yamagata, Y. Land-cover change analysis in 50 global cities by using a combination of Landsat data and analysis of grid cells. Environ. Res. Lett. 2014, 9, 064015. [Google Scholar] [CrossRef]
- Zhou, Y.; Chen, M.; Tang, Z.; Mei, Z. Urbanization, land use change, and carbon emissions: Quantitative assessments for city-level carbon emissions in Beijing–Tianjin–Hebei region. Sustain. Cities Soc. 2021, 66, 102701. [Google Scholar] [CrossRef]
- Wang, G.; Han, Q.; de vries, B. Assessment of the relation between land use and carbon emission in Eindhoven, the Netherlands. J. Environ. Manag. 2019, 247, 413–424. [Google Scholar] [CrossRef] [PubMed]
- Liu, F.; Zhang, Z.; Shi, L.; Zhao, X.; Xu, J.; Yi, L.; Liu, B.; Wen, Q.; Hu, S.; Wang, X.; et al. Urban expansion in China and its spatial-temporal differences over the past four decades. J. Geogr. Sci. 2016, 26, 1477–1496. [Google Scholar] [CrossRef]
- Qu, F.-T.; Chen, J.-L.; Chen, W. A theoretical analysis and empirical study of the economic driving mechanism of the deagrarianization of agricultural land. J. Nat. Resour. 2005, 231–241. [Google Scholar]
- Wu, H.-Z.; Tian, X.-S.; Zhang, L.-Q. Spatial and temporal distribution characteristics and dispersal paths of non-agriculturalization of arable land in Anhui Province in the last 40a. Chin. J. Agric. Resour. Reg. Plan. 2022, 1–11. Available online: http://kns.cnki.net/kcms/detail/11.3513.S.20220517.1122.004.html (accessed on 25 June 2022).
- Chen, G.; Li, X.; Liu, X.; Chen, Y.; Liang, X.; Leng, J.; Xu, X.; Liao, W.; Qiu, Y.a.; Wu, Q.; et al. Global projections of future urban land expansion under shared socioeconomic pathways. Nat. Commun. 2020, 11, 537. [Google Scholar] [CrossRef] [Green Version]
- Su, Y.; Qian, K.; Lin, L.; Wang, K.; Guan, T.; Gan, M. Identifying the driving forces of non-grain production expansion in rural China and its implications for policies on cultivated land protection. Land Use Policy 2020, 92, 104435. [Google Scholar] [CrossRef]
- Zhou, Y.; Li, X.; Liu, Y. Land use change and driving factors in rural China during the period 1995–2015. Land Use Policy 2020, 99, 105048. [Google Scholar] [CrossRef]
- Liu, Y.; Zhou, Y. Reflections on China’s food security and land use policy under rapid urbanization. Land Use Policy 2021, 109, 105699. [Google Scholar] [CrossRef]
- Bai, Y.; Liu, M.; Yang, L. Calculation of Ecological Compensation Standards for Arable Land Based on the Value Flow of Support Services. Land 2021, 10, 719. [Google Scholar] [CrossRef]
- Long, H.; Ge, D.; Zhang, Y.; Tu, S.; Qu, Y.; Ma, L. Changing man-land interrelations in China’s farming area under urbanization and its implications for food security. J. Environ. Manag. 2018, 209, 440–451. [Google Scholar] [CrossRef] [PubMed]
- Shao, Z.; Bakker, M.; Spit, T.; Janssen-Jansen, L.; Qun, W. Containing urban expansion in China: The case of Nanjing. J. Environ. Plan. Manag. 2020, 63, 189–209. [Google Scholar] [CrossRef]
- Shan, L.; Guo, Z.; Peng, Y. Cultivated land protection policies in China facing 2030: Dynamic balance system versus basic farmland zoning. Habitat Int. 2017, 69, 126–138. [Google Scholar]
- Miao, Y.; Liu, J.; Wang, R.Y. Occupation of Cultivated Land for Urban-Rural Expansion in China: Evidence from National Land Survey 1996–2006. Land 2021, 10, 1378. [Google Scholar] [CrossRef]
- Yin, D.; Li, X.; Li, G.; Zhang, J.; Yu, H. Spatio-Temporal Evolution of Land Use Transition and Its Eco-Environmental Effects: A Case Study of the Yellow River Basin, China. Land 2020, 9, 514. [Google Scholar] [CrossRef]
- Liu, Y.; Liu, S.; Sun, Y.; Wang, F.; Li, M. Driving forces of cultivated land evolution in agro-pastoral areas on the Qinghai-Tibet Plateau based on ecological niche theory. J. Clean. Prod. 2021, 313, 127899. [Google Scholar] [CrossRef]
- Belay, T.; Mengistu, D.A. Land use and land cover dynamics and drivers in the Muga watershed, Upper Blue Nile basin, Ethiopia. Remote. Sens. Appl. Soc. Environ. 2019, 15, 100249. [Google Scholar] [CrossRef]
- Huang, D.; Zhu, S.; Liu, T. Are there differences in the forces driving the conversion of different non-urban lands into urban use? A case study of Beijing. Environ. Sci. Pollut. Res. 2022, 29, 6414–6432. [Google Scholar] [CrossRef]
- Qu, S.; Hu, S.; Li, W.; Wang, H.; Zhang, C.; Li, Q. Interaction between urban land expansion and land use policy: An analysis using the DPSIR framework. Land Use Policy 2020, 99, 104856. [Google Scholar] [CrossRef]
- Wang, H.; Liu, Y.; Cai, L.; Fan, D.; Wang, Y.; Yao, Y. Regional differentiation in the ecological effects of land cover change in China. Land Degrad. Dev. 2022, 33, 346–357. [Google Scholar] [CrossRef]
- Wu, Y.; Tao, Y.; Yang, G.; Ou, W.; Pueppke, S.; Sun, X.; Chen, G.; Tao, Q. Impact of land use change on multiple ecosystem services in the rapidly urbanizing Kunshan City of China: Past trajectories and future projections. Land Use Policy 2019, 85, 419–427. [Google Scholar] [CrossRef]
- Zhang, R.; Lu, J. Simulation of Land Use Pattern Evolution from a Multi-Scenario Perspective: A Case Study of Suzhou City in Anhui Province, China. Int. J. Environ. Res. Public Health 2021, 18, 921. [Google Scholar] [CrossRef] [PubMed]
- Huang, H.; Zhou, Y.; Qian, M.; Zeng, Z. Land Use Transition and Driving Forces in Chinese Loess Plateau: A Case Study from Pu County, Shanxi Province. Land 2021, 10, 67. [Google Scholar] [CrossRef]
- Li, D.; Qu, J.-G.; Wang, S. Spatial pattern and center of gravity curve analysis of the deagriculturalisation of arable land in Heilongjiang Province. Mapp. Sci. 2021, 46, 171–177. [Google Scholar]
- Li, J.; Jiang, Z.; Miao, H.; Liang, J.; Yang, Z.; Zhang, Y.; Ma, T. Identification of cultivated land change trajectory and analysis of its process characteristics using time-series Landsat images: A study in the overlapping areas of crop and mineral production in Yanzhou City, China. Sci. Total Environ. 2022, 806, 150318. [Google Scholar] [CrossRef]
- Chen, Z.; Lu, C.; Fan, L. Farmland changes and the driving forces in Yucheng, North China Plain. J. Geogr. Sci. 2012, 22, 563–573. [Google Scholar] [CrossRef] [Green Version]
- Yu, Y.; Xu, T.; Wang, T. Outmigration Drives Cropland Decline and Woodland Increase in Rural Regions of Southwest China. Land 2020, 9, 443. [Google Scholar] [CrossRef]
- Lv, F.; Deng, L.; Zhang, Z.; Wang, Z.; Wu, Q.; Qiao, J. Multiscale analysis of factors affecting food security in China, 1980–2017. Environ. Sci. Pollut. Res. 2022, 29, 6511–6525. [Google Scholar] [CrossRef]
- Qiao, J.; Cao, Q.; Zhang, Z.; Cao, Z.; Liu, H. Spatiotemporal changes in the state of food security across mainland china during 1990–2015: A multi-scale analysis. Food Energy Secur. 2022, 11, e318. [Google Scholar] [CrossRef]
- Zhang, X.-Y.; Xie, X.-P.; Zhang, A.-L. Analysis of the spatially uneven development and spatial diffusion paths of arable land deagrarianization in Wuhan City. J. Nat. Resour. 2014, 29, 1649–1659. [Google Scholar]
- Wang, J.-F.; Zhang, T.-L.; Fu, B.-J. A measure of spatial stratified heterogeneity. Indicators 2016, 67, 250–256. [Google Scholar] [CrossRef]
- Meng, X.; Gao, X.; Li, S.; Lei, J. Spatial and Temporal Characteristics of Vegetation NDVI Changes and the Driving Forces in Mongolia during 1982–2015. Remote Sens. 2020, 12, 603. [Google Scholar] [CrossRef] [Green Version]
- Wang, J.F.; Li, X.H.; Christakos, G.; Liao, Y.L.; Zhang, T.; Gu, X.; Zheng, X.Y. Geographical Detectors-Based Health Risk Assessment and its Application in the Neural Tube Defects Study of the Heshun Region, China. Int. J. Geogr. Inf. Sci. 2010, 24, 107–127. [Google Scholar] [CrossRef]
- Ustaoglu, E. Determinants of Urban Expansion and Agricultural Land Conversion in 25 EU Countries. Environ. Manag. 2017, 60, 717–746. [Google Scholar] [CrossRef]
- Wang, J.; Lin, Y.; Glendinning, A.; Xu, Y. Land-use changes and land policies evolution in China’s urbanization processes. Land Use Policy 2018, 75, 375–387. [Google Scholar] [CrossRef]
- Zhang, Y.-S.; Feng, Y.-F.; Wang, F.; Chen, Z.-L.; Li, X.-H. Spatial and temporal variation in the non-foodification of cropland in Guangdong Province and its driving mechanisms. Resour. Sci. 2022, 44, 480–493. [Google Scholar]
- Vermeulen, W.J. Forests in sustainable mountain development. A state of knowledge report for 2000. S. Afr. For. J. 2001, 190, 119–120. [Google Scholar] [CrossRef]
- Liu, X.-H.; Wang, J.-F.; Liu, M.-L.; Meng, B. A study on the zoning of the drivers of arable land change in China. Sci. China (Ser. D Earth Sci.) 2005, 1087–1095. [Google Scholar]
- Fan, H.; Dong, J. Spatial and temporal characteristics of arable land non-farming and its relationship with food production in the Wuhan urban area. Agric. Syst. Sci. Integr. Res. 2010, 26, 264–270. [Google Scholar]
- He, Y.-B.; Chen, Y.-Q.; Yao, Y.-M.; Shi, S.-Q.; Li, Z.-B.; Wan, L. Spatial and temporal characteristics of non-agriculturalization of arable land and its relationship with food production capacity in three northeastern provinces. Resour. Sci. 2009, 31, 295–302. [Google Scholar]
- Liu, F.; Xiao, X.; Qin, Y.; Yan, H.; Huang, J.; Wu, X.; Zhang, Y.; Zou, Z.; Doughty, R.B. Large spatial variation and stagnation of cropland gross primary production increases the challenges of sustainable grain production and food security in China. Sci. Total Environ. 2022, 811, 151408. [Google Scholar] [CrossRef] [PubMed]
- Fukase, E.; Martin, W. Who Will Feed China in the 21st Century? Income Growth and Food Demand and Supply in China. J. Agric. Econ. 2016, 67, 3–23. [Google Scholar] [CrossRef]


| GlobeLand30 Classification System | CNLUCC Classification System | ||
|---|---|---|---|
| Type | Meaning | Type | Meaning |
| cropland | Land for growing crops | cultivated land | Land for growing crops |
| forest | Land with tree cover and more than 30% canopy cover | forest land | Forestry land for growing trees, shrubs, bamboos, etc. |
| shrubland | Land with shrub cover and more than 30% scrub cover | ||
| grassland | Land covered by natural herbaceous vegetation with more than 10% cover | grassland | All types of grassland with herbaceous vegetation and a cover of 5% or more |
| water | Areas covered by liquid water at the terrestrial scale | water | Refers to land with natural terrestrial waters and water facilities |
| glacier snow | Land covered by permanent snow, glaciers and ice caps | ||
| wetlands | Land located in the border zone between land and water, with shallow standing water or excessively wet soil | ||
| artificial surface | Surface formed by man-made construction activities | construction land | Refers to urban and rural settlements and the land outside them for industrial, mining and transport purposes |
| bare ground | Land with natural cover of less than 10% vegetation cover | undeveloped land | Land that is currently undevelopd, including hard-to-use land |
| tundra | Land covered by lichens, mosses, perennial hardy herbs and shrubs in boreal and alpine environments | ||
| Driving Factors | Factor Symbols | Number of Types (2000–2010) | Number of Types (2010–2020) |
|---|---|---|---|
| Population density | X1 | 5 | 7 |
| GDP per capita | X2 | 4 | 3 |
| The GDP share of the primary industry | X3 | 4 | 4 |
| The GDP share of the non-agricultural industry | X4 | 4 | 3 |
| Cultivated land area | X5 | 4 | 5 |
| Cultivated land area per capita | X6 | 4 | 5 |
| GDP per unit of land | X7 | 6 | 6 |
| Total retail sales of social consumer goods | X8 | 4 | 3 |
| Total power of agricultural machinery | X9 | 5 | 5 |
| Disposable income of rural residents | X10 | 4 | 3 |
| Percentage of mountainous area | X11 | 3 | 3 |
| 2000–2010 | 2010–2020 | |
|---|---|---|
| Area of non-agricultural cultivated land (hm) | 15.82 × | 87.03 × |
| The ratio of cultivated land non-agriculturalization area to cultivated land area (%) | 0.497 | 2.710 |
| Factor Sorting | q Values (2000–2010) | Factor Sorting | q Values (2010–2020) |
|---|---|---|---|
| X1 | 0.448 | X8 | 0.727 |
| X8 | 0.422 | X1 | 0.394 |
| X2 | 0.317 | X2 | 0.363 |
| X7 | 0.308 | X7 | 0.200 |
| X9 | 0.153 | X5 | 0.174 |
| X3 | 0.104 | X6 | 0.118 |
| X10 | 0.061 | X9 | 0.112 |
| X4 | 0.052 | X3 | 0.109 |
| X5 | 0.050 | X4 | 0.074 |
| X6 | 0.020 | X10 | 0.046 |
| X11 | 0.019 | X11 | 0.021 |
Publisher’s Note: MDPI stays neutral with regard to jurisdictional claims in published maps and institutional affiliations. |
© 2022 by the authors. Licensee MDPI, Basel, Switzerland. This article is an open access article distributed under the terms and conditions of the Creative Commons Attribution (CC BY) license (https://creativecommons.org/licenses/by/4.0/).
Share and Cite
Chen, Y.; Wang, S.; Wang, Y. Spatiotemporal Evolution of Cultivated Land Non-Agriculturalization and Its Drivers in Typical Areas of Southwest China from 2000 to 2020. Remote Sens. 2022, 14, 3211. https://doi.org/10.3390/rs14133211
Chen Y, Wang S, Wang Y. Spatiotemporal Evolution of Cultivated Land Non-Agriculturalization and Its Drivers in Typical Areas of Southwest China from 2000 to 2020. Remote Sensing. 2022; 14(13):3211. https://doi.org/10.3390/rs14133211
Chicago/Turabian StyleChen, Yan, Shiyuan Wang, and Yahui Wang. 2022. "Spatiotemporal Evolution of Cultivated Land Non-Agriculturalization and Its Drivers in Typical Areas of Southwest China from 2000 to 2020" Remote Sensing 14, no. 13: 3211. https://doi.org/10.3390/rs14133211
APA StyleChen, Y., Wang, S., & Wang, Y. (2022). Spatiotemporal Evolution of Cultivated Land Non-Agriculturalization and Its Drivers in Typical Areas of Southwest China from 2000 to 2020. Remote Sensing, 14(13), 3211. https://doi.org/10.3390/rs14133211