Article

Satellite-Based Monitoring on Green-Up Date for Optimizing the Rest-Grazing Period in Xilin Gol Grassland

1
Institute of Geographic Sciences and Natural Resources Research, Chinese Academy of Sciences, Beijing 100101, China
2
University of Chinese Academy of Sciences, Beijing 100049, China
3
Institute of Soil and Water Conservation, Chinese Academy of Sciences and Ministry of Water Resources, Yangling 712100, China
4
School of Resources and Environmental Engineering, Ludong University, Yantai 264025, China
*
Author to whom correspondence should be addressed.
Remote Sens. 2022, 14(14), 3443; https://doi.org/10.3390/rs14143443
Submission received: 10 June 2022 / Revised: 15 July 2022 / Accepted: 15 July 2022 / Published: 18 July 2022
(This article belongs to the Special Issue Remote Sensing in Land Use and Management)

Abstract

:
Ecological degradation has occurred in global grasslands and has impaired their ecosystem services severely, so ecological conservation of grasslands should be focused more on the effectiveness of management measures. The green-up process decides the year-round forage yield and ecological conditions of grasslands. Adopting rest-grazing during the green-up process can guarantee a successful green-up, thus realizing more economic benefits without grassland degradation. Therefore, studies should pay more attention to whether the green-up process is really covered by the rest-grazing period or not. We analyze the spatiotemporal variations and the stability of the annual green-up date in Xilin Gol Grassland from 2000 to 2018 based on MODIS time series images and compare the green-up date with the rest-grazing period to assess the effectiveness of the rest-grazing policy. The results show that the green-up date of Xilin Gol Grassland had advanced 15 days on average because of the increasing trend of both temperature and precipitation during 2000~2018. The green-up date is mostly 120~130 d in the east, about 10 days earlier than the west (130~140 d) and 20 days earlier than in the central areas (140~150 d), also because of the spatial variations of temperature and precipitation. The coefficient of variation (CV) of the green-up date showed a significant negative correlation with precipitation, so the green-up date is more unstable in the arid areas. The rest-grazing period started more than 45 days earlier than the green-up date and failed to cover it in several years, which occurred more frequently in southern counties. The average green-up date appeared after rest-grazing started in over 98% of areas, and the time gap is 15~45 days in 88% of areas, which not only could not avoid grassland degradation effectively but also increased herdsmen’s life burden. This study aims to accurately grasp the temporal and spatial variations of the green-up date in order to provide references for adjusting a more proper rest-grazing period, thus promoting ecological conservation and sustainable development of animal husbandry.

1. Introduction

Nearly 50% of global grasslands have suffered from or faced the risk of ecological degradation, which could impair the important ecosystem services of grasslands and also human well-being [1]. The ecological conservation of grasslands, however, has usually been neglected in the sustainable development goal so far but should be attached to more importance in the future [1]. The green-up process, which indicates the beginning of vegetation growth every year, is a very important period for the ecological conservation of grasslands because it largely decides later vegetation growth in a year [2]. Moreover, for animal husbandry, the successful green-up of grasslands can ensure sufficient annual forage yields and economic profits. However, the grassland is much more vulnerable during the green-up process. Any interference may undermine the structure and function of the grassland and lead to severe ecological degradation [3,4,5]. Traditional grazing usually lasts for the whole year, including the green-up process, which seriously hinders the green-up process and brings much pressure on grasslands [6,7]. Therefore, it is very important to take appropriate measures to avoid disturbances during the green-up process of grasslands so as to support ecological conservation and sustainable development of animal husbandry.
Rest-grazing is an effective way to protect the green-up of grasslands from grazing disturbances. It has been widely adopted in the pastoral areas of many countries and has brought obvious improvements to several ecosystem services. China has the largest grassland area in the world (about 4 million km2), and many studies in Northern China and the Qinghai-Tibet Plateau have shown that banning and rest-grazing during the green-up process has effectively promoted plant height [8,9], vegetation coverage [10,11], total aboveground biomass and species richness [12,13,14,15]. Studies in several regions in China also showed that adopting rest-grazing during the green-up process can also improve the soil water content and carbon storage of grasslands, thus greatly improving their primary productivity [16,17,18,19]. Similar ecological benefits of rest-grazing are also reflected in the grasslands of other countries, which own prosperous animal husbandry, such as increasing species diversity and abundance in Australia and the United States [20,21,22] and improving the soil carbon storage in Canada [23].
However, there exists a dilemma that the rest-grazing period cannot accurately cover the green-up date, which limits the ecological benefits of rest-grazing. For example, in Xilin Gol Grassland, a very typical pastoral area in China, rest-grazing always starts at a fixed date according to subjective experience, while the actual green-up date always changes due to variations in geographical background conditions [24,25,26,27]. The rest-grazing policy has been implemented for many years, but it is still unclear whether the rest-grazing period is consistent with the green-up process of grasslands. Moreover, a too-long rest-grazing period may reduce the forage supply for livestock, which compels herdsmen to purchase more extra forages for livestock feeding, thus increasing the life burden of herdsmen and causing poverty [28,29,30]. Therefore, it is necessary to monitor the green-up date accurately and start rest-grazing at the proper date every year in order to protect the grasslands from grazing interference during the green-up process effectively and also avoid hindering the normal grazing activities for too long a time. Unfortunately, due for the lack of monitoring data of the green-up date, there is still no sufficient reference for adjusting the rest-grazing period.
Many studies have applied remote sensing to the monitoring of green-up dates and other phenological information since the end of the 20th century. Some have calculated the greenness index (GI) based on the near-ground remote sensing data to monitor the green-up date, which was easy to realize and could effectively reflect the changes in the vegetation canopy but was very sensitive to weather conditions and could cause huge deviations in the meantime [31]. In contrast, the satellite-based remote sensing data were more widely used in relevant studies, among which normalized difference vegetation index (NDVI) is the most popular indicator [32,33,34,35,36,37]. Different methods have been used to monitor the green-up date based on NDVI, including the threshold-based method, delayed moving average method, curve fitting method, and other methods [38,39,40]. Each method has its own advantages and disadvantages, for example, the threshold-based method is simple and effective, but such a threshold should be set according to the environment; the delayed moving average method is steadier than the threshold-based method but the accuracy is sensitive to the size of the sliding window; the curve fitting method is convenient and universal but disabled in bare vegetation areas [41,42,43,44]. Recently, in order to avoid the green saturation phenomenon of NDVI, some studies have begun to use the enhanced vegetation index (EVI) together with or instead of NDVI, with the aim of obtaining more accurate results [45,46,47,48,49]. At the same time, with the improvement of research accuracy, those remote sensing images with much higher spatial and temporal resolution are gradually becoming the preferred data source for monitoring the green-up date. As for Xilin Gol Grassland, there is high spatial homogeneity on grasslands, different from other land cover types such as croplands and settlements, and according to our survey, the area of a single pasture of herdsmen is usually more than 25 hm2, in which there is no obvious heterogeneity. Therefore, the remote sensing images with finer temporal resolution but not very fine spatial resolution are suitable enough for monitoring the green-up date there.
So, in this study, we extracted the green-up date of Xilin Gol Grassland from 2000 to 2018 based on MODIS images and analyzed its spatiotemporal variations and inter-annual stability. Meanwhile, we compared the green-up date with the actual rest-grazing period of each county to analyze their differences. The purpose of this study is to provide references for adopting more appropriate policies of rest-grazing so as to promote regional ecological conservation of grasslands and sustainable development of animal husbandry.

2. Materials and Methods
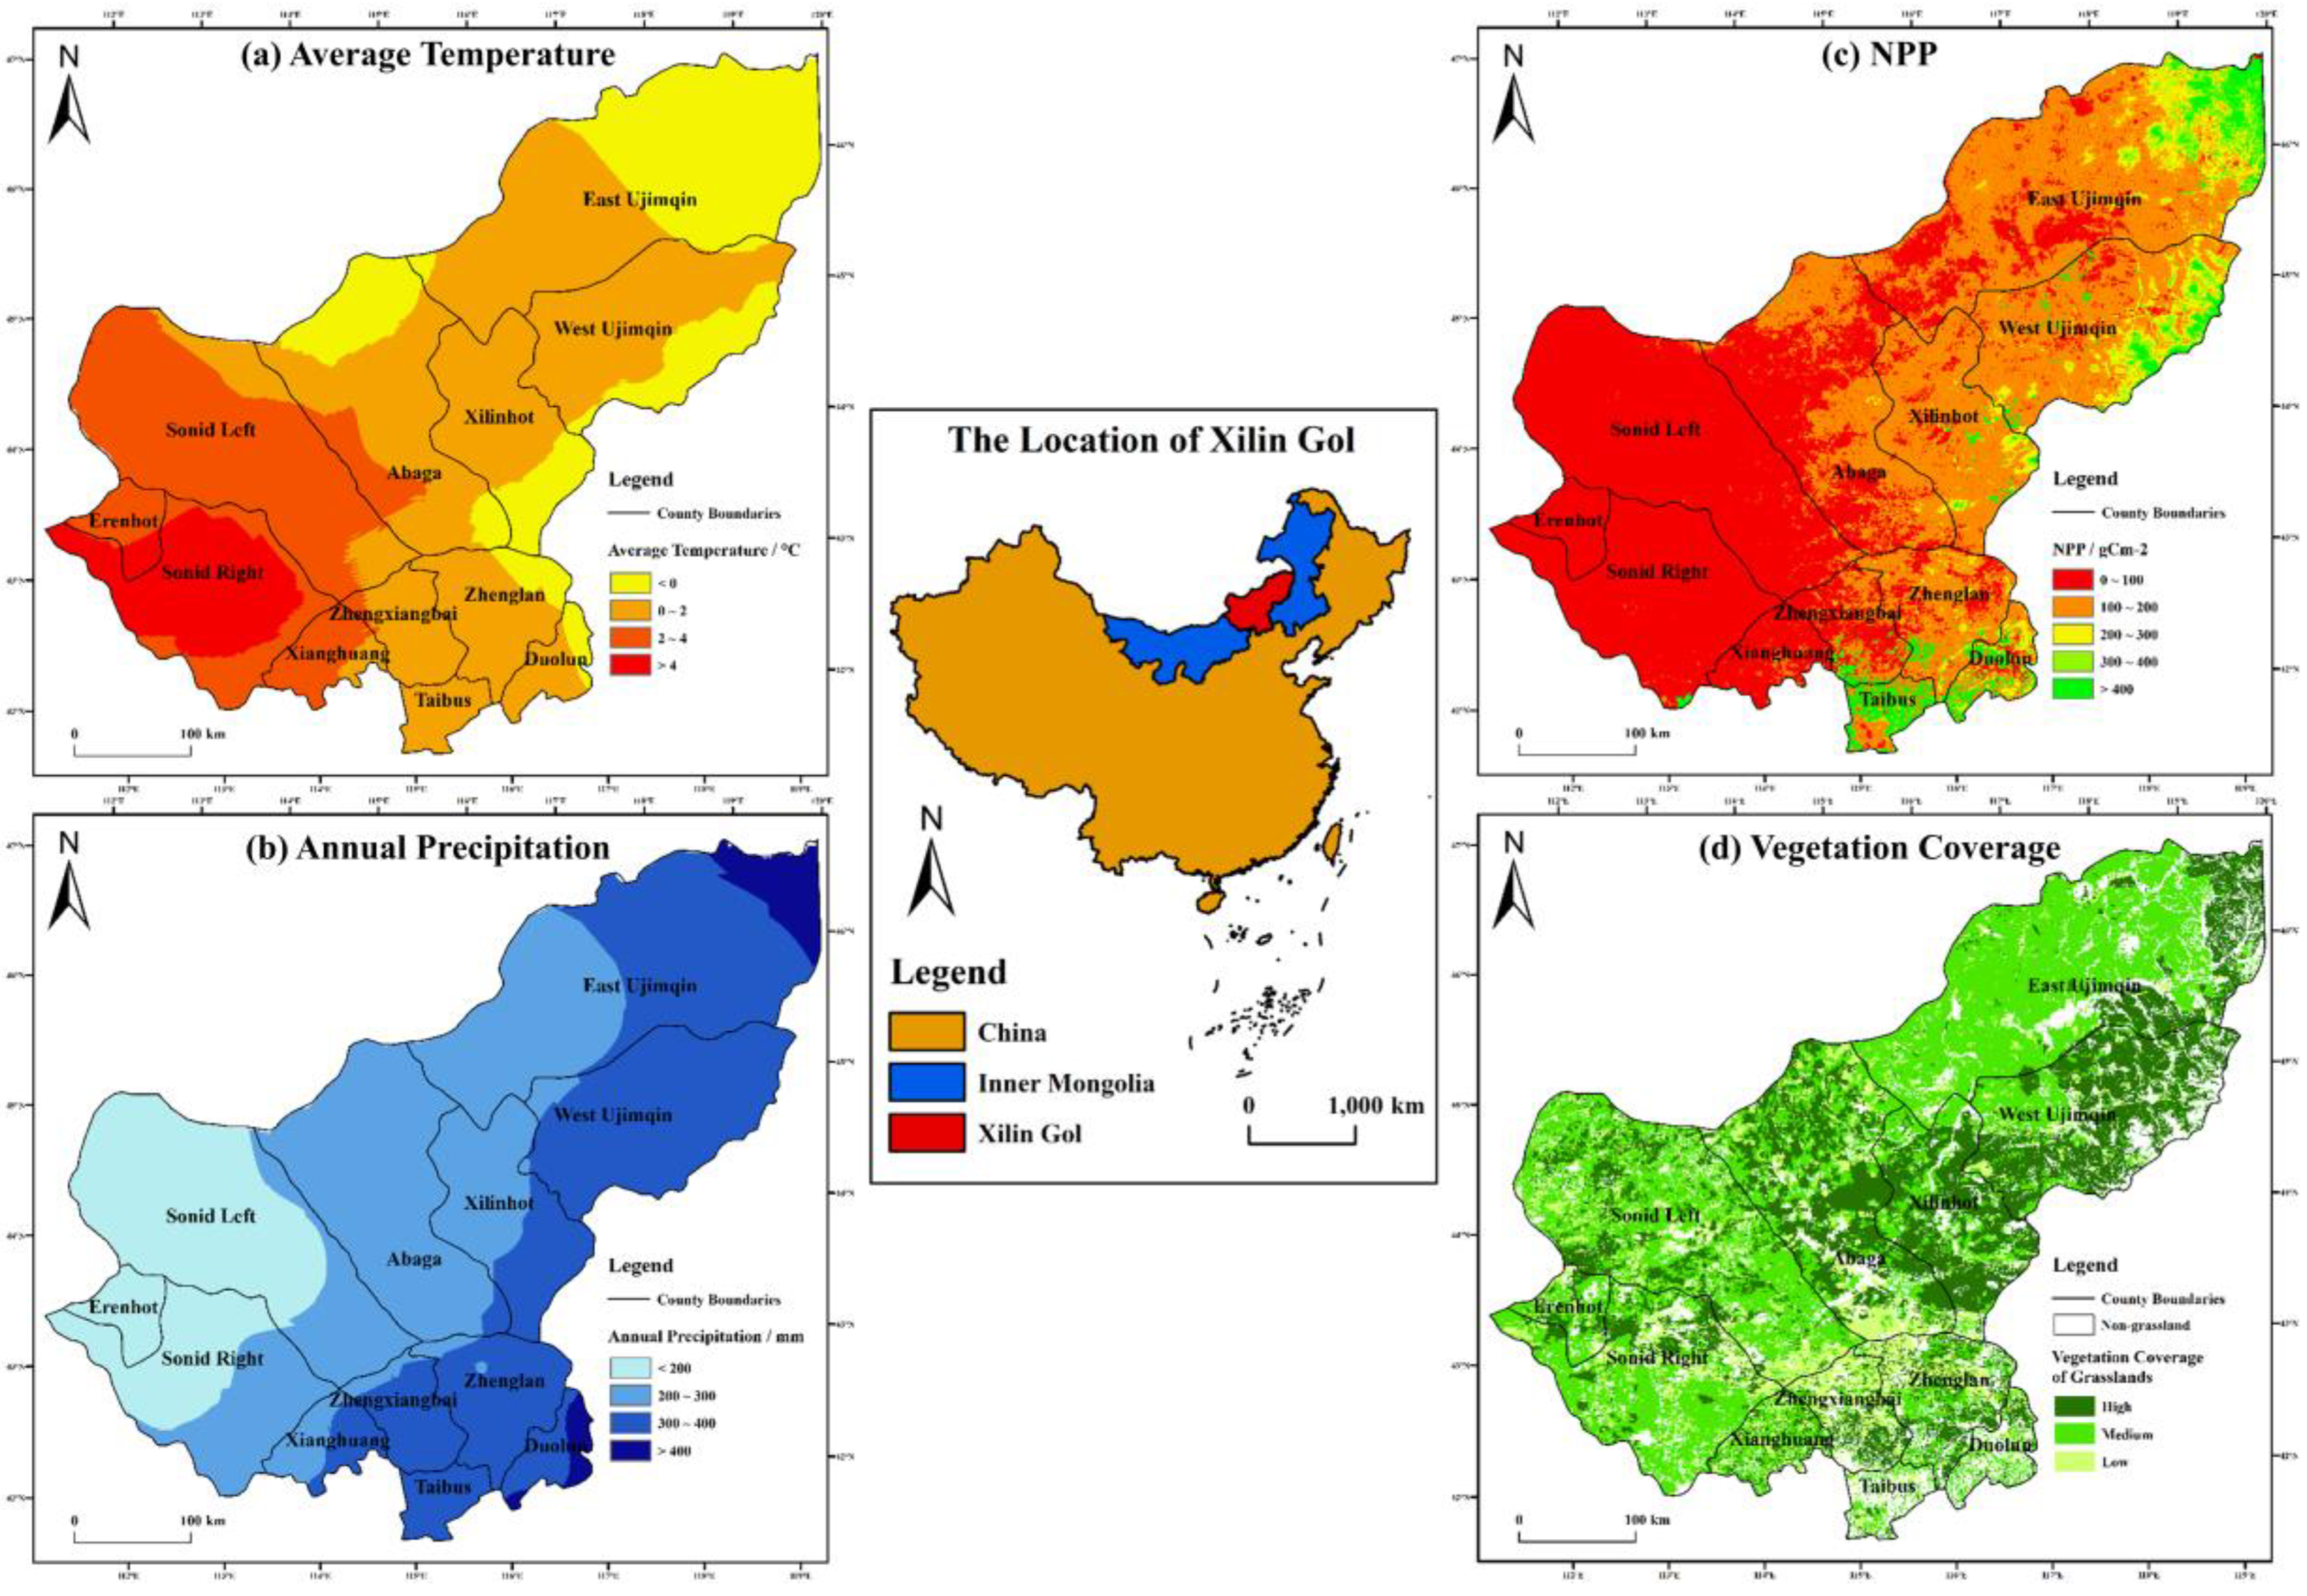
2.1. Study Area

Xilin Gol Grassland is located in the central part of Inner Mongolia and northern border of China, with a total land area of 202,600 km2, 88.60% of which is occupied by grassland. Xilin Gol Grassland is generally under the control of temperate continental climate, and the average temperature generally decreases from more than 4 °C in the west to less than 0 °C in the east (Figure 1a), while the annual precipitation decreases from more than 400 mm in the east to less than 200 mm in the west (Figure 1b). The climate variations decide the spatial distributions of NPP, which was much higher in the east than the west (Figure 1c). As for the grassland types, the east is dominated by meadow grasslands (high vegetation coverage), the west and south are dominated by desert grasslands (low vegetation coverage), and the rest typical grasslands (medium vegetation coverage) (Figure 1d). Different grassland types correspond to different production patterns of animal husbandry, so Xilin Gol Grassland has more diverse grassland management measures than other pastoral areas. Therefore, Xilin Gol Grassland is always regarded as the epitome of animal husbandry development in China and has a very high research value in grassland management.
Xilin Gol Grassland is the major supply base of livestock products in China, which is very important to ensure daily nutrient intake of many Chinese people. At the same time, Xilin Gol Grassland is an extremely vital ecological barrier in Northern China, which plays an important role in maintaining ecological safety [50,51,52]. Xilin Gol Grassland and even Northern China have experienced serious ecological degradation in the past few decades and will still face huge such risk in the future [53,54,55,56]. Therefore, economic-ecological coordination is required in Xilin Gol Grassland, and the local government has adopted rest-grazing since the beginning of the 21st century. Each herdsman will be given a financial subsidy of 112.5 RMB/hm2 per month during the rest-grazing period, and so far, Xilin Gol government has invested about 168 million RMB every year to promote rest-grazing, which has already included about 15 million hm2 pastures.

2.2. Data Preparation

(1)
Climatic data. The data on temperature, precipitation (spatial resolution = 1 km) and solar radiation (spatial resolution = 10 km) were all from the National Earth System Science Data Center [57]. We acquired both the annual and monthly data of China and then extracted them by the mask of Xilin Gol Grassland in ArcGIS;
(2)
NPP. We acquired the 2000~2016 NPP in China from the Earth Databank of Chinese Academy of Sciences [58], with a temporal resolution of 8 days and spatial resolution of 500 m. We calculated the annual average NPP using raster calculator in ArcGIS and also extracted it in Xilin Gol Grassland;
(3)
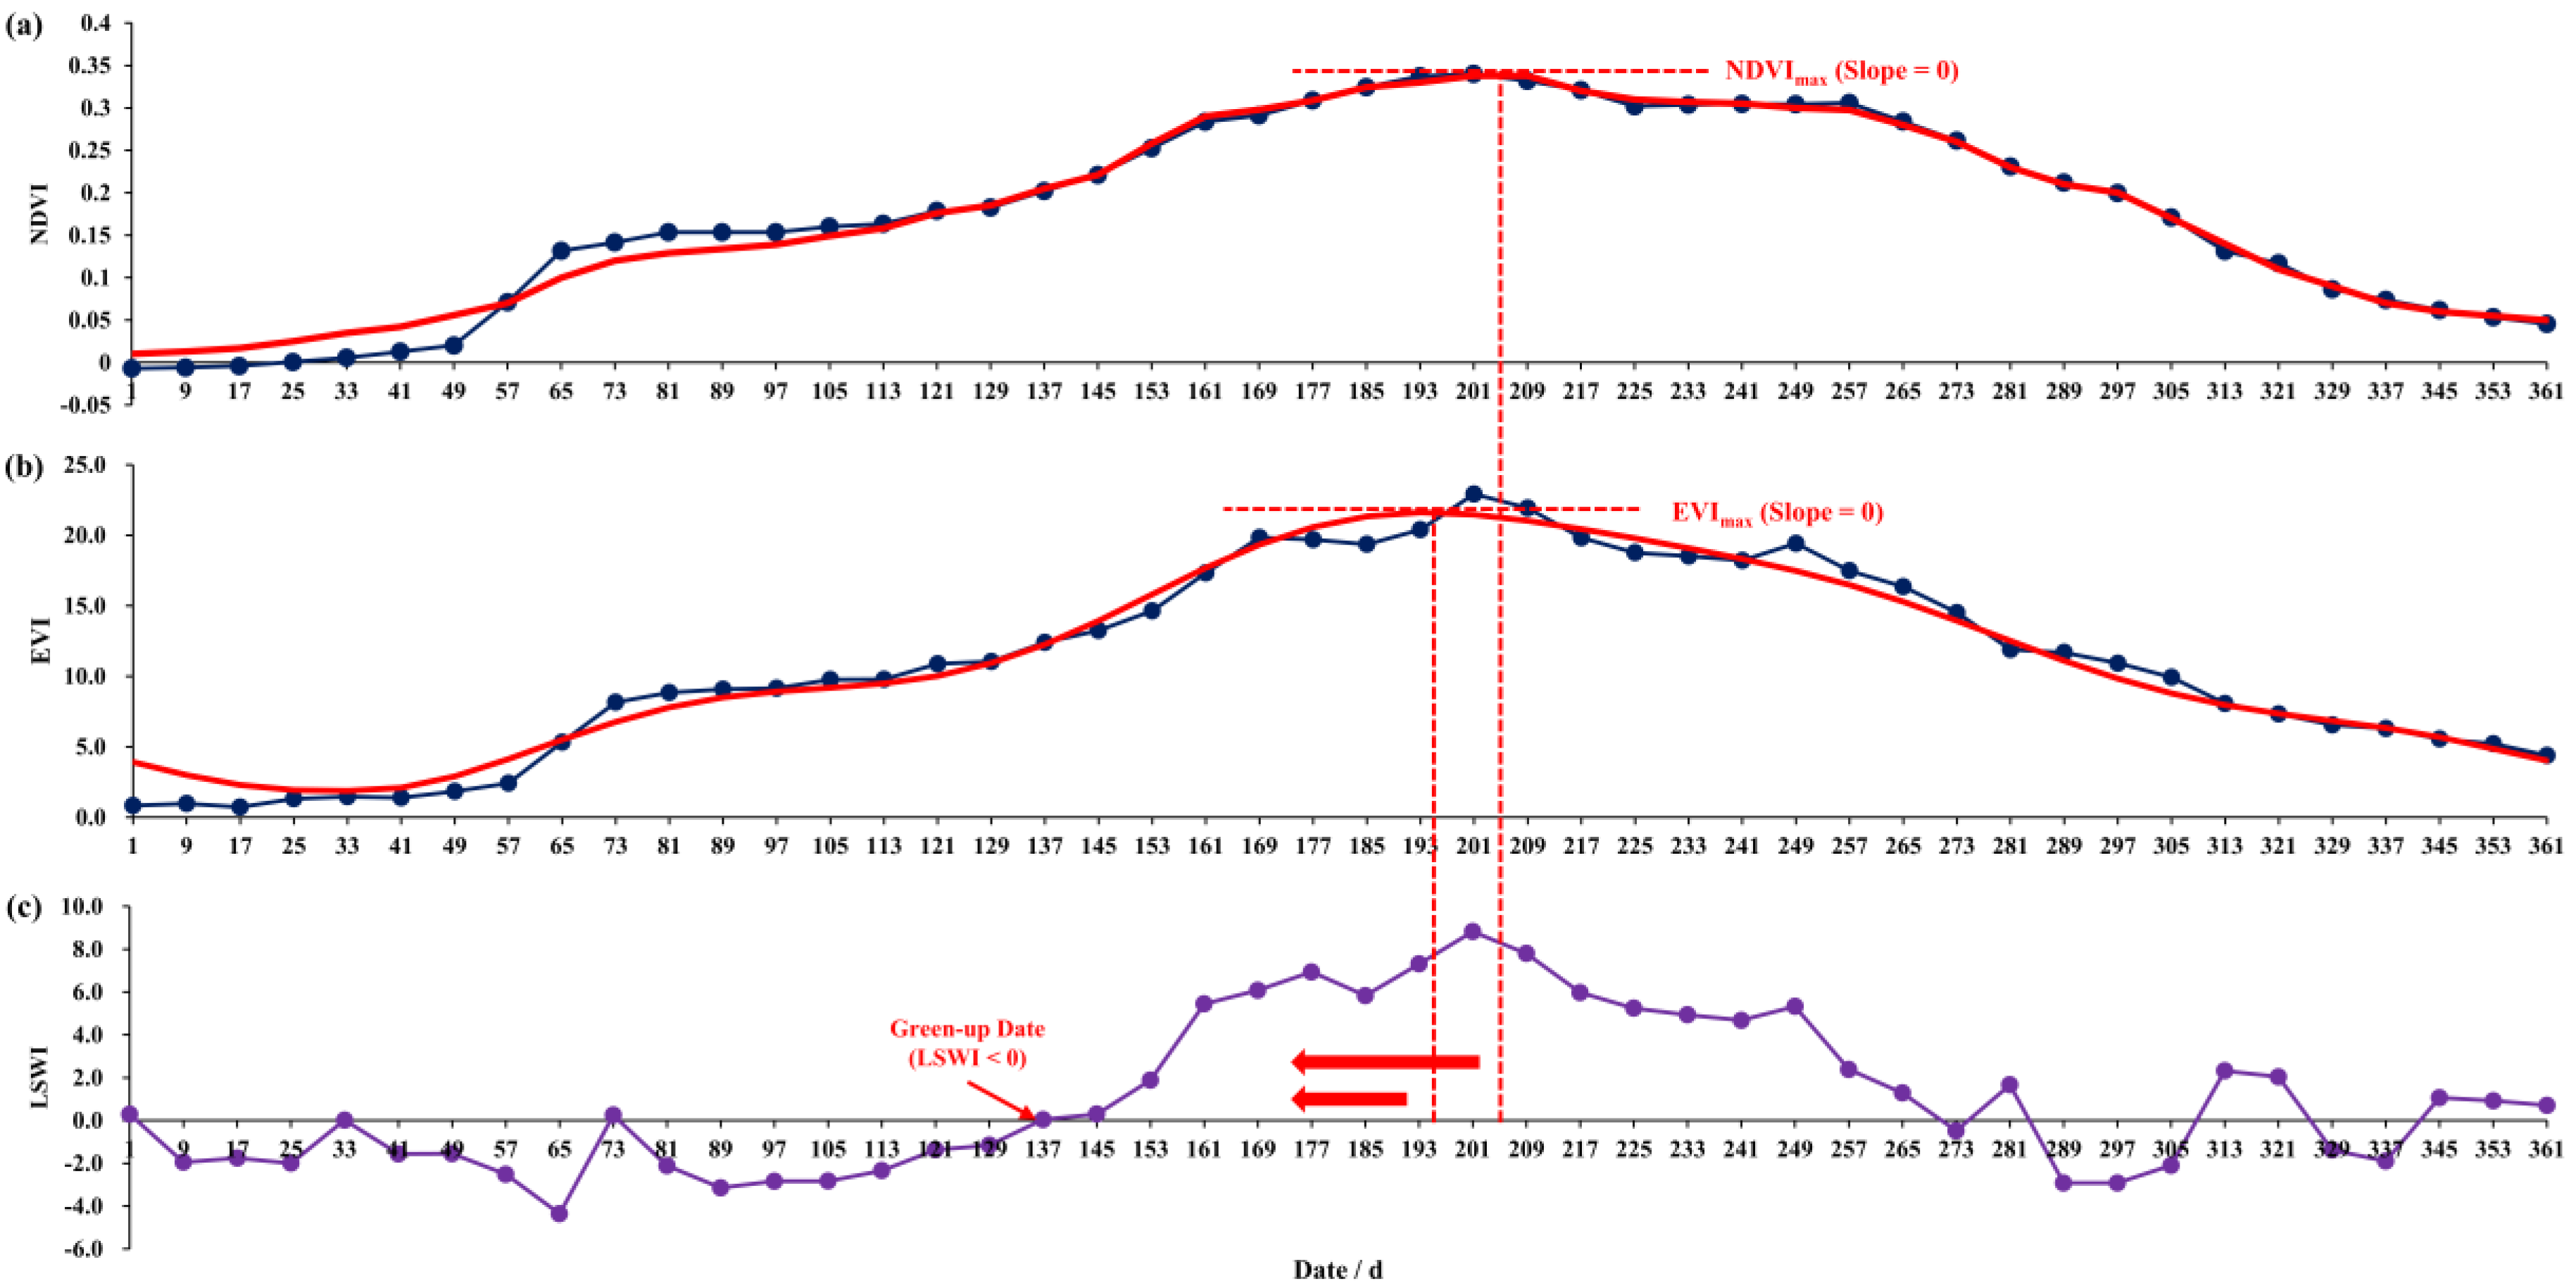
NDVI, EVI and LSWI. EVI considers the blue band on the basis of infrared and near-infrared bands, which further reduces the noises and the saturation phenomenon of NDVI [45,46,47,48,49]. However, for grasslands whose structure is not as complicated as forests, the saturation phenomenon of NDVI can hardly appear, so both NDVI and EVI are effective indicators for reflecting the monitoring the green-up date of grasslands. In this study, we compared the temporal variations of NDVI and EVI to verify the accuracy of such two time series, based on which we monitored the green-up date. The short-wave infrared band is very sensitive to moisture, whose combination with the near-infrared band generates the Land Surface Water Index (LSWI), an effective reflection of the moisture content of vegetation and soil [59,60]. We selected MODIS (MOD09AI) data from 2000 to 2018, with a temporal resolution of 8 days and spatial resolution of 500 m, and calculated the NDVI, EVI and LSWI of each image (46 images per year). The calculation formula is as follows:
NDVI = ρ NIR ρ RED ρ NIR + ρ RED
EVI = 2.5 × ρ NIR ρ RED ρ NIR + 6 ρ RED 7.5 ρ BLUE + 1
LSWI = ρ NIR ρ SWIR ρ NIR + ρ SWIR
Specifically, ρNIR, ρRED, ρBLUE and ρSWIR reflect the near-infrared, red, blue and short-wave infrared band, respectively.
(4)
Spatial distributions of grasslands. We selected China’s land cover data in 2000, 2005, 2010, 2013, 2015 and 2018 from the Resources and Environmental Sciences Data Center of Chinese Academy of Sciences [61], with a spatial resolution of one kilometer. We first extracted the grasslands in these years respectively and selected those areas that were always grasslands during this period. Then we use the administrative boundaries of Xilin Gol to extract them in ArcGIS, to acquire the spatial distribution of grasslands in Xilin Gol;
(5)
Surface observation data of green-up date. During our survey in 2019, we obtained a series of surface observation data of green-up dates in seven sites in different years, based on which we verified the green-up date monitored through remote sensing (Table 1). Meanwhile, we also collected the starting date of rest-grazing in each county according to our surveys and relevant policies.

2.3. Extraction, Verification and Analysis of Green-Up Date

2.3.1. Extraction of Green-Up Date

During the grass growth every year, NDVI and EVI both show an increasing trend at first and a decreasing trend after reaching the maximum. Due to the noises such as cloud and atmospheric disturbances, NDVI and EVI usually present a rough fluctuation, which cannot be directly used for the extraction of green-up date. Therefore, we used the Harmonic Analysis of NDVI Time Series (HANTS) method to eliminate the noises and obtain a relatively smooth NDVI and EVI curve (Figure 2a,b). The advantage of this method is that the periodic information can be described more clearly [62,63]. We used HANTS mainly because we needed to extract the NDVI and EVI maximums and their appearing times for later extraction of green-up date, but such information is very hard to extract through a rough fluctuation, while a smooth curve could give such information more clearly and accurately. We took the NDVI and EVI in 2016 as an example. The NDVI maximum appeared a little bit later than EVI maximum, but both of them appeared much later than the latest “LSWI < 0” point (Figure 2a–c). Therefore, the use of NDVI or EVI will acquire the same monitoring results in our paper. The results were similar to other years, and we chose the NDVI or EVI maximum, which appeared earlier as the starting point for searching the green-up date. No matter NDVI and EVI, they play the same role in extracting the green-up date, which was to determine the starting point of searching the green-up date according to the appearing time of their maximums. The LSWI curve finally decided the specific green-up date.
Existing studies have shown that LSWI is almost less than 0 when there is no vegetation growth (especially in winter and early spring) [64,65]. The green-up date is the beginning of grassland growth in a year, so it indicated that LSWI would change from “<0” to “>0”. Before the green-up date, there is no grass growth and LSWI is mostly less than 0, while after the green-up date and during the later growth, LSWI is mostly greater than 0 (Figure 2c). We combined LSWI with the smooth NDVI and EVI curve to extract the green-up date in this study. Specifically, we took the time when NDVI or EVI maximum appeared as the starting point, from which we traced back on the LSWI curve point by point (interval = 8 d) to the time when the earliest “LSWI < 0” point appeared and defined it as the green-up date (Figure 2c). There is no need to acquire a smooth LSWI curve using HANTS to replace the rough one because a smooth LSWI curve could not give the specific appearing time of such earliest “LSWI < 0” point, and we only needed to find such “LSWI < 0” point rather than detect a threshold such as NDVI and EVI.

2.3.2. Verification of Green-Up Date

After extracting the green-up date, we used the surface observation data to verify our results. We calculated the root mean squared error (RMSE) and R2 to assess the accuracy of our results. The calculation formula is as follows:
RMSE = i = 1 n R i S i 2 n
R 2 = i = 1 n R i S a 2 i = 1 n S i S a 2
Specifically, n is the number of samples; Ri indicates the green-up date monitored through remote sensing; Si is the green-up date from surface observation. The RMSE calculation result was 6.8 d, The RMSE of our results was 6.8 d, smaller than the interval of MODIS time series (8 d), and also smaller than those of similar existing studies in Xilin Gol Grassland (8.7~10 d) [32,66]. The R2 was 0.7176 > 0.7, which also indicated that there was a relatively high consistency between the monitoring and surface observation results. Therefore, the green-up date extracted through remote sensing is accurate enough and can effectively reflect the actual conditions of Xilin Gol Grassland in general.

2.3.3. Analysis on the Spatiotemporal Variations of Green-Up Date

The green-up date showed different changing characteristics in different periods, so we use the piecewise linear regression to assess the temporal variations of green-up date from 2000 to 2018 and acquired the slope and p-value to reflect the trend and significance. Moreover, we also calculated the overall slope of each pixel in MATLAB to analyze the spatial variations of changing trend of green-up date.

3. Results and Analysis

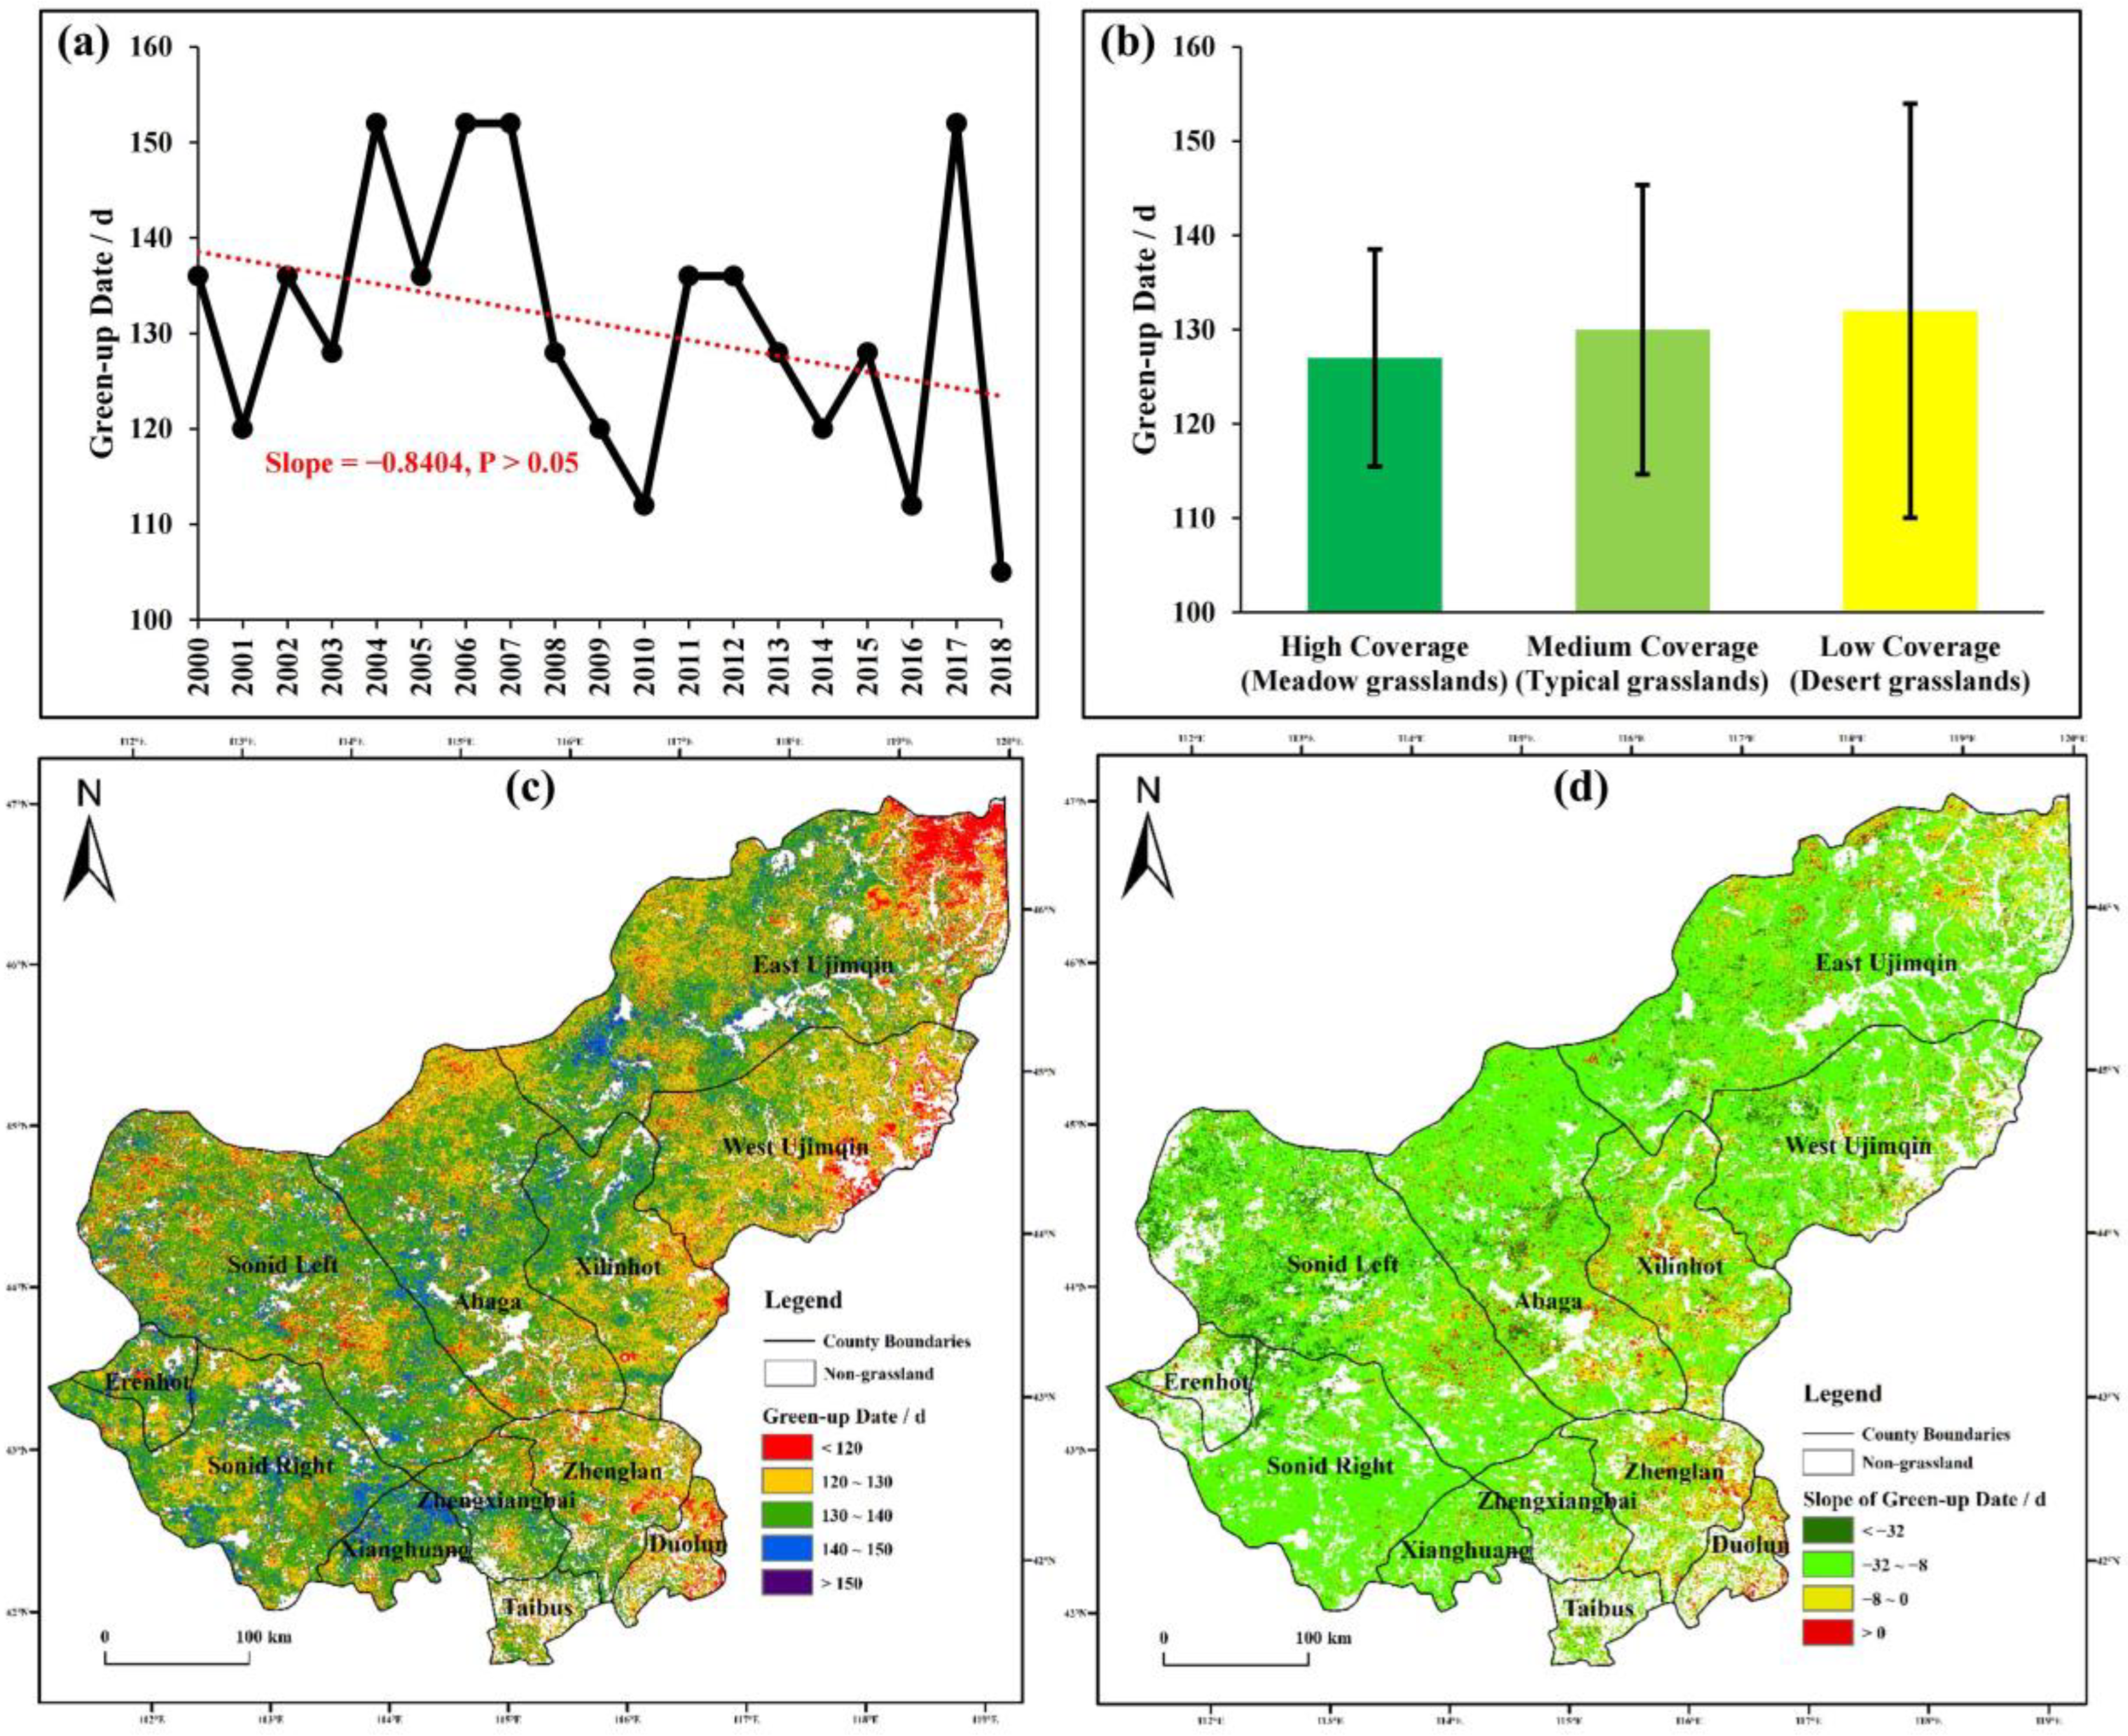
3.1. Spatiotemporal Variations of Green-Up Date

As for temporal variations, the average green-up date of Xilin Gol Grassland was fluctuated 2000 to 2018. Specifically, the green-up date showed a delaying trend from 2000 to 2006 and an advancing trend from 2007 to 2010 and fluctuated between 110 d and 140 d after 2010 (Figure 3a). Overall, the green-up date of Xilin Gol Grassland showed an insignificant advance trend and advanced 15 days on average (Figure 3a). We also analyzed the green-up dates of different grassland types, and the results showed that the average green-up date was delayed with the declining vegetation coverage of grasslands. The green-up date of high coverage grasslands was about 127 d, while those of medium- and low-overage grasslands were 130 d and 132 d, respectively (Figure 3b). Moreover, the standard deviation of green-up date was also different among different grassland types, for it was about 11 days in high coverage grasslands, 15 days in medium coverage grasslands, and 21 days in low coverage grasslands, which indicated the differences in stability of green-up date (Figure 3b).
As for spatial variations, the green-up date was earlier in the east but later in the western and central areas of Xilin Gol Grassland. Specifically, the earliest green-up date was before 120 d and appeared near the northeastern borders, mainly in the east of East Ujimqin and West Ujimqin (Figure 3c). The green-up dates of most areas were 120~140 d, which were mostly 120~130 d in eastern areas dominated by high coverage grasslands and 130~140 d in western areas dominated by medium coverage grasslands (Figure 3c). The latest green-up date was 140~150 d and appeared in the central areas, mainly distributed in Xianghuang, southeast of Sonid Left, Abaga and southwest of East Ujimqin where there are more low-coverage grasslands (Figure 3c). The green-up date has advanced in most areas and is delayed in only a few areas of Xilin Gol Grassland, but the advancing or delaying trend was not significant (p > 0.05). specifically, the green-up date has advanced by 8~32 days (more than one week but less than one month) in most areas, 0~8 days (within a week) or delayed in several eastern and southern areas, including Duolun, Zhenglan, Xilinhot and East Ujimqin, and more than 32 d in only a few central and western areas (Figure 3d).

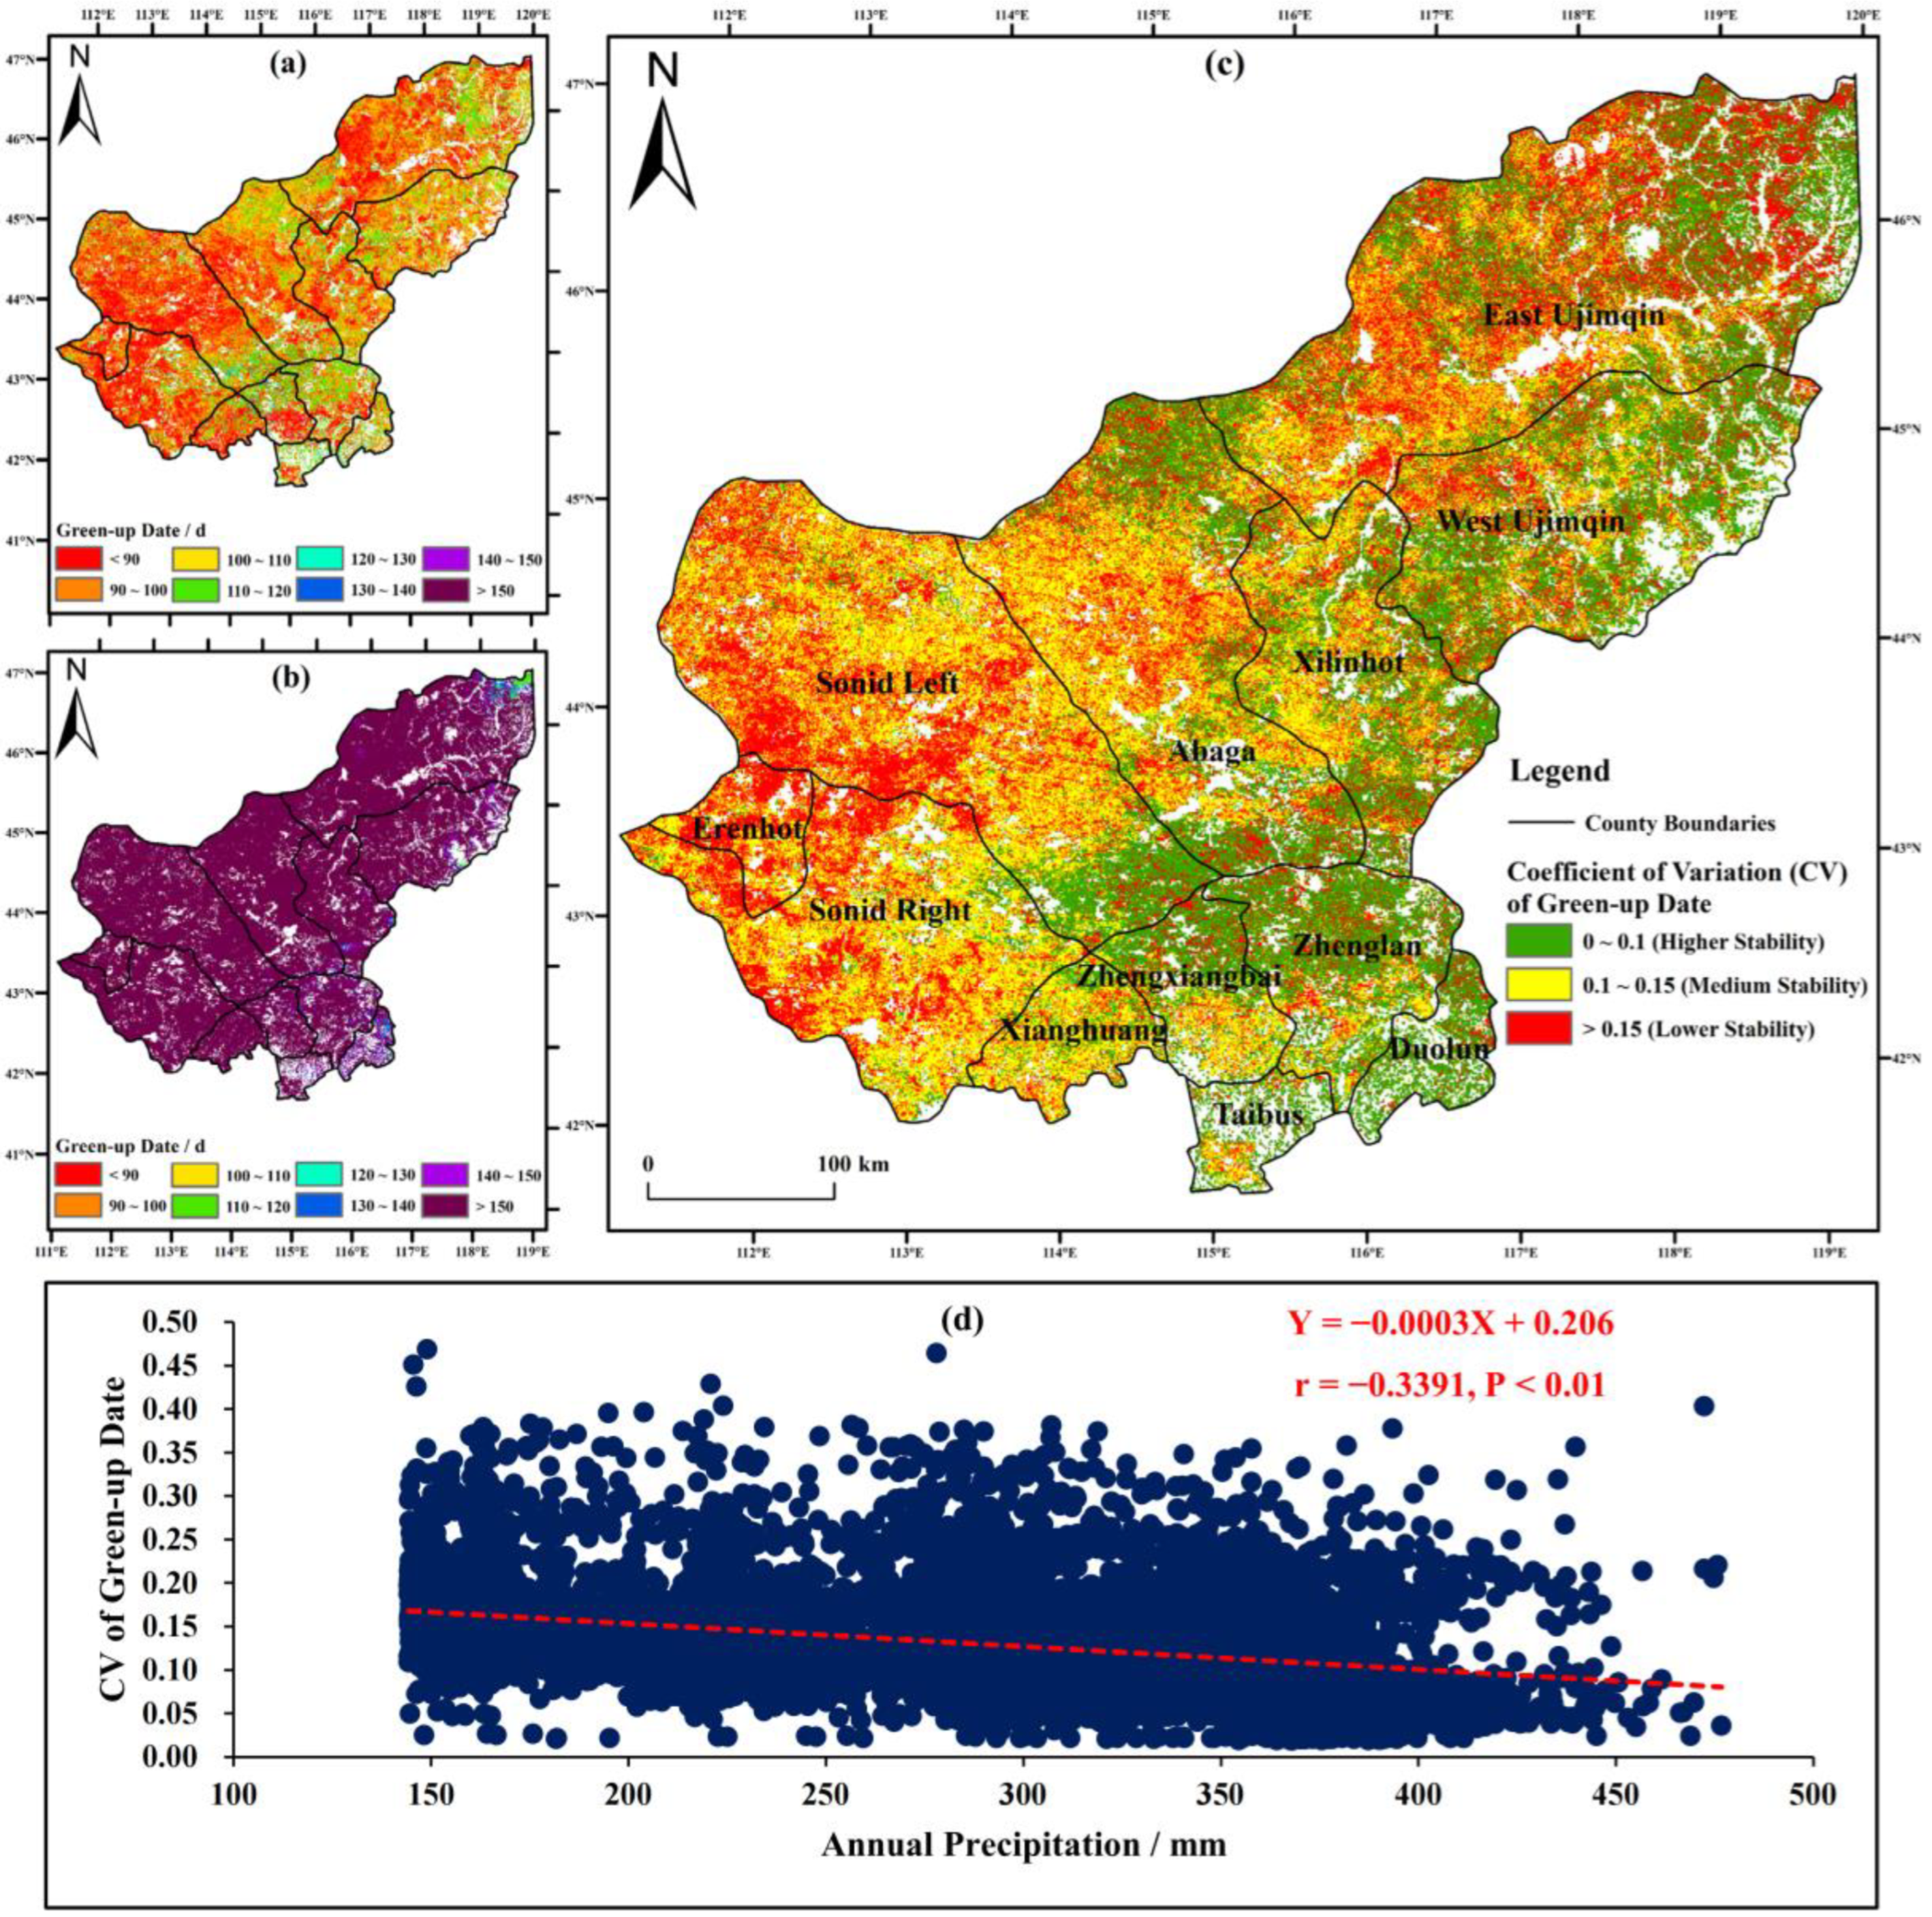
3.2. Stability of Green-Up Date

We further calculated the earliest, latest and coefficient of variation (CV) of green-up dates from 2000 to 2018 in Xilin Gol Grassland. The results showed that the earliest green-up date was mostly before 120 d. Specifically, the earliest green-up date of most western grasslands was 90~100 d (early April), mainly including Erenhot, Sonid Left, Sonid Right, Xianghuang and Abaga, while that of most eastern grasslands was after 110 d, mainly including West Ujimqin, Zhenglan, Taibus, Duolun and the east of East Ujimqin (Figure 4a). In general, the earliest green-up date was gradually delayed from the northwest to the southeast. The latest green-up date, however, advanced from west to east, for it was after 170 d in most western grasslands but about 150~170 d in most eastern grasslands (Figure 4b). Therefore, the fluctuation of the green-up date in the west was larger than that in the east of Xilin Gol Grassland, which can also be confirmed through the CV results. The CV of green-up date was mostly less than 0.15 in eastern grasslands, mainly including East Ujimqin, West Ujimqin, Xilinhot, Zhenglan, Zhengxiangbai and Duolun, while that of most western grasslands was greater than 0.15, mainly including Erenhot, Sonid Left, Sonid Right and Abaga (Figure 4c). Moreover, we discovered that the spatial distributions of the CV of green-up date were very similar to the annual precipitation, which decreases gradually from the east to the west (Figure 1b). The CV of the green-up date also showed a significant negative correlation with the annual precipitation (Figure 4d). These results indicated that the green-up date became more unstable generally with the decreasing annual precipitation in Xilin Gol Grassland, so there were more variations in green-up dates in the arid areas.

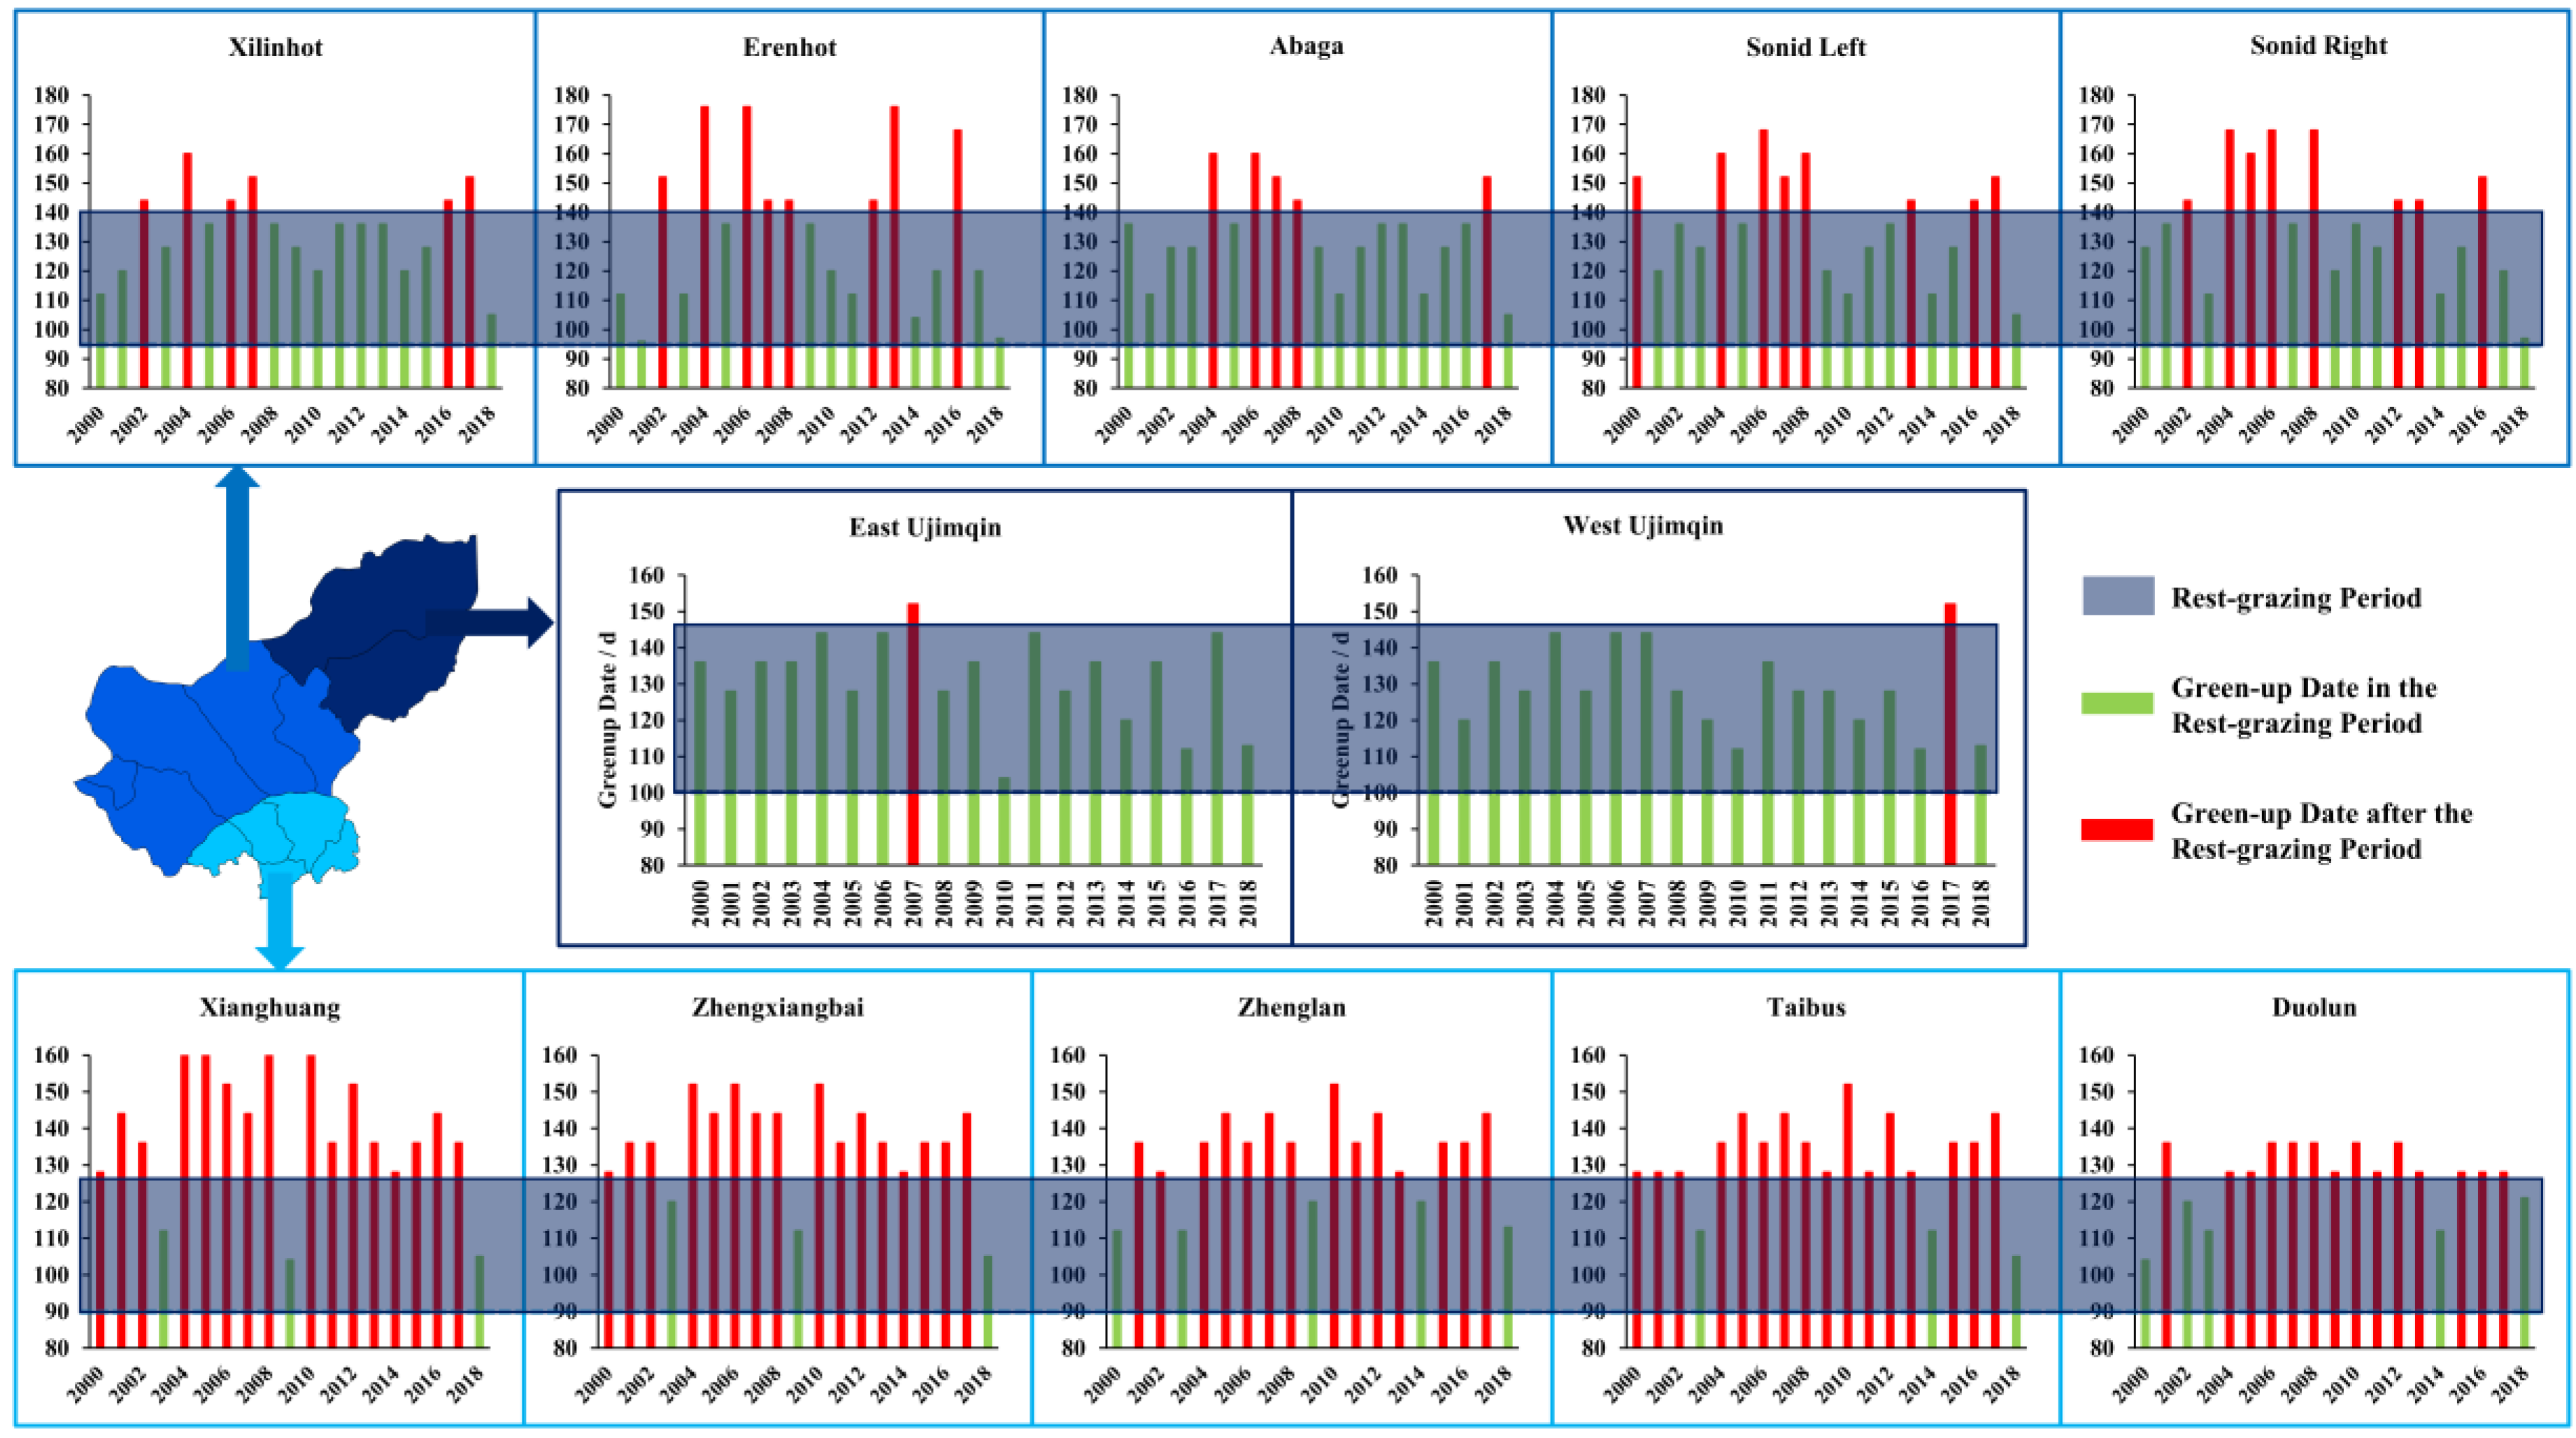
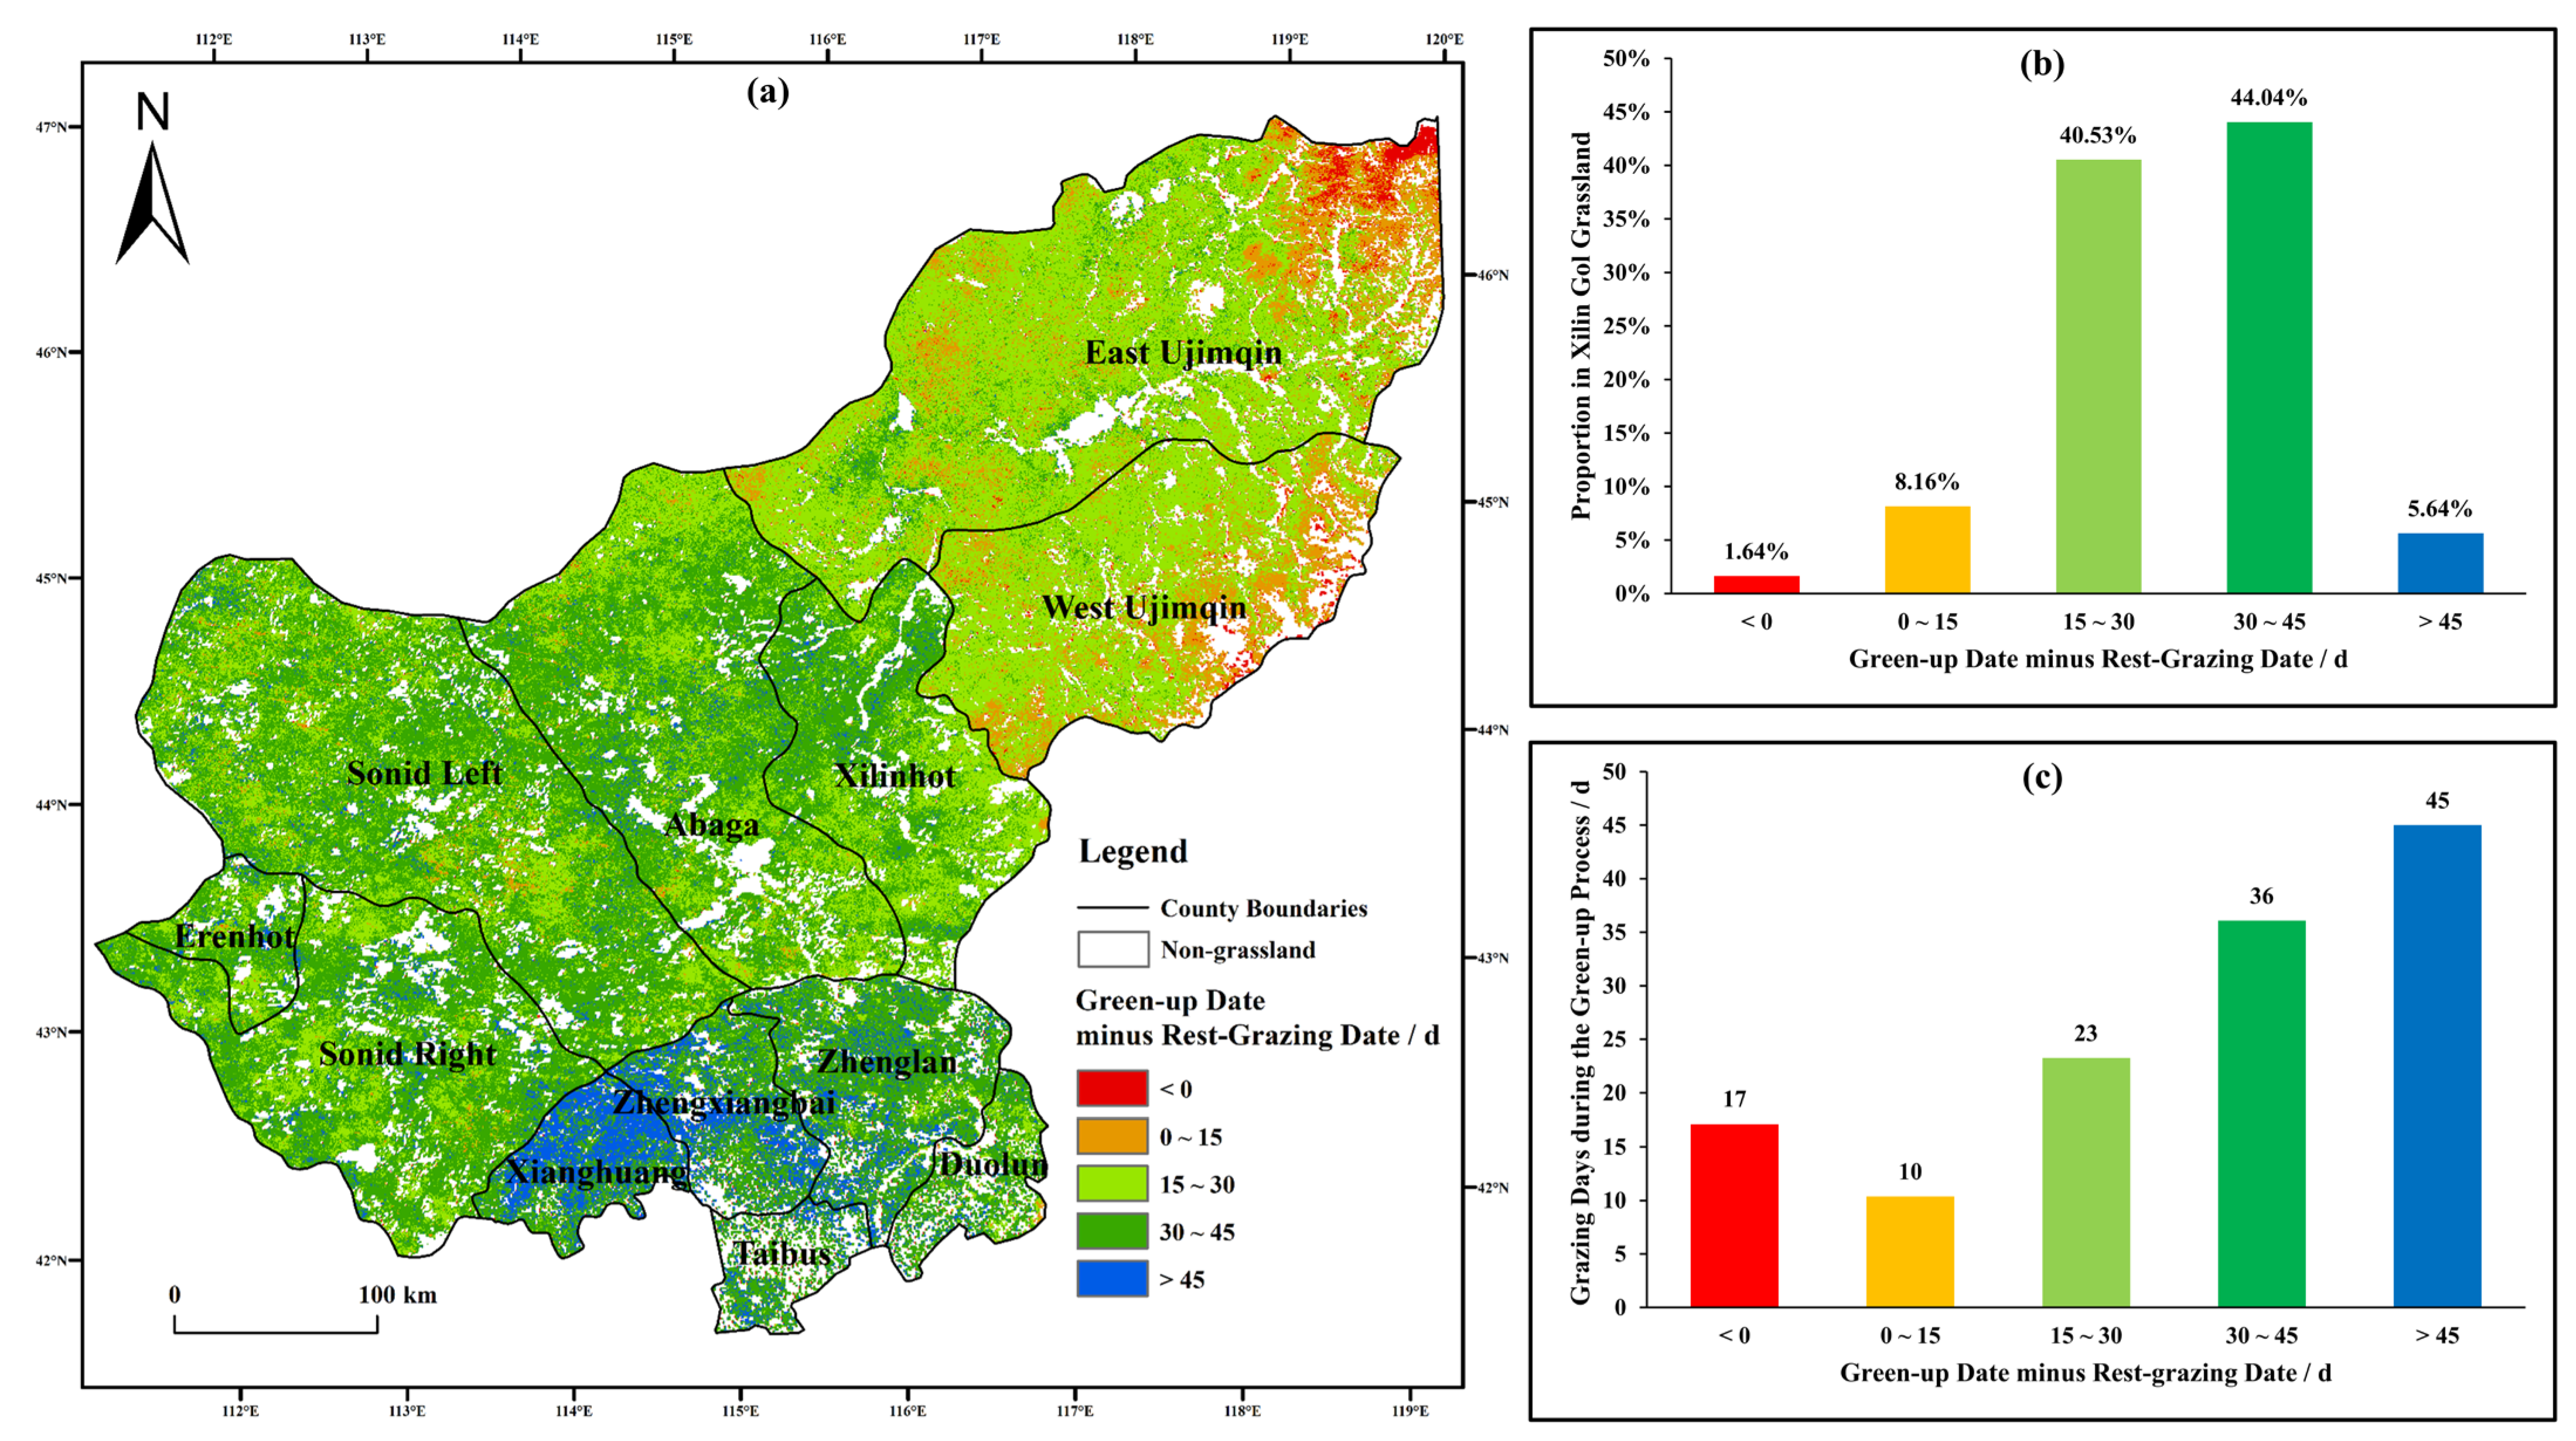
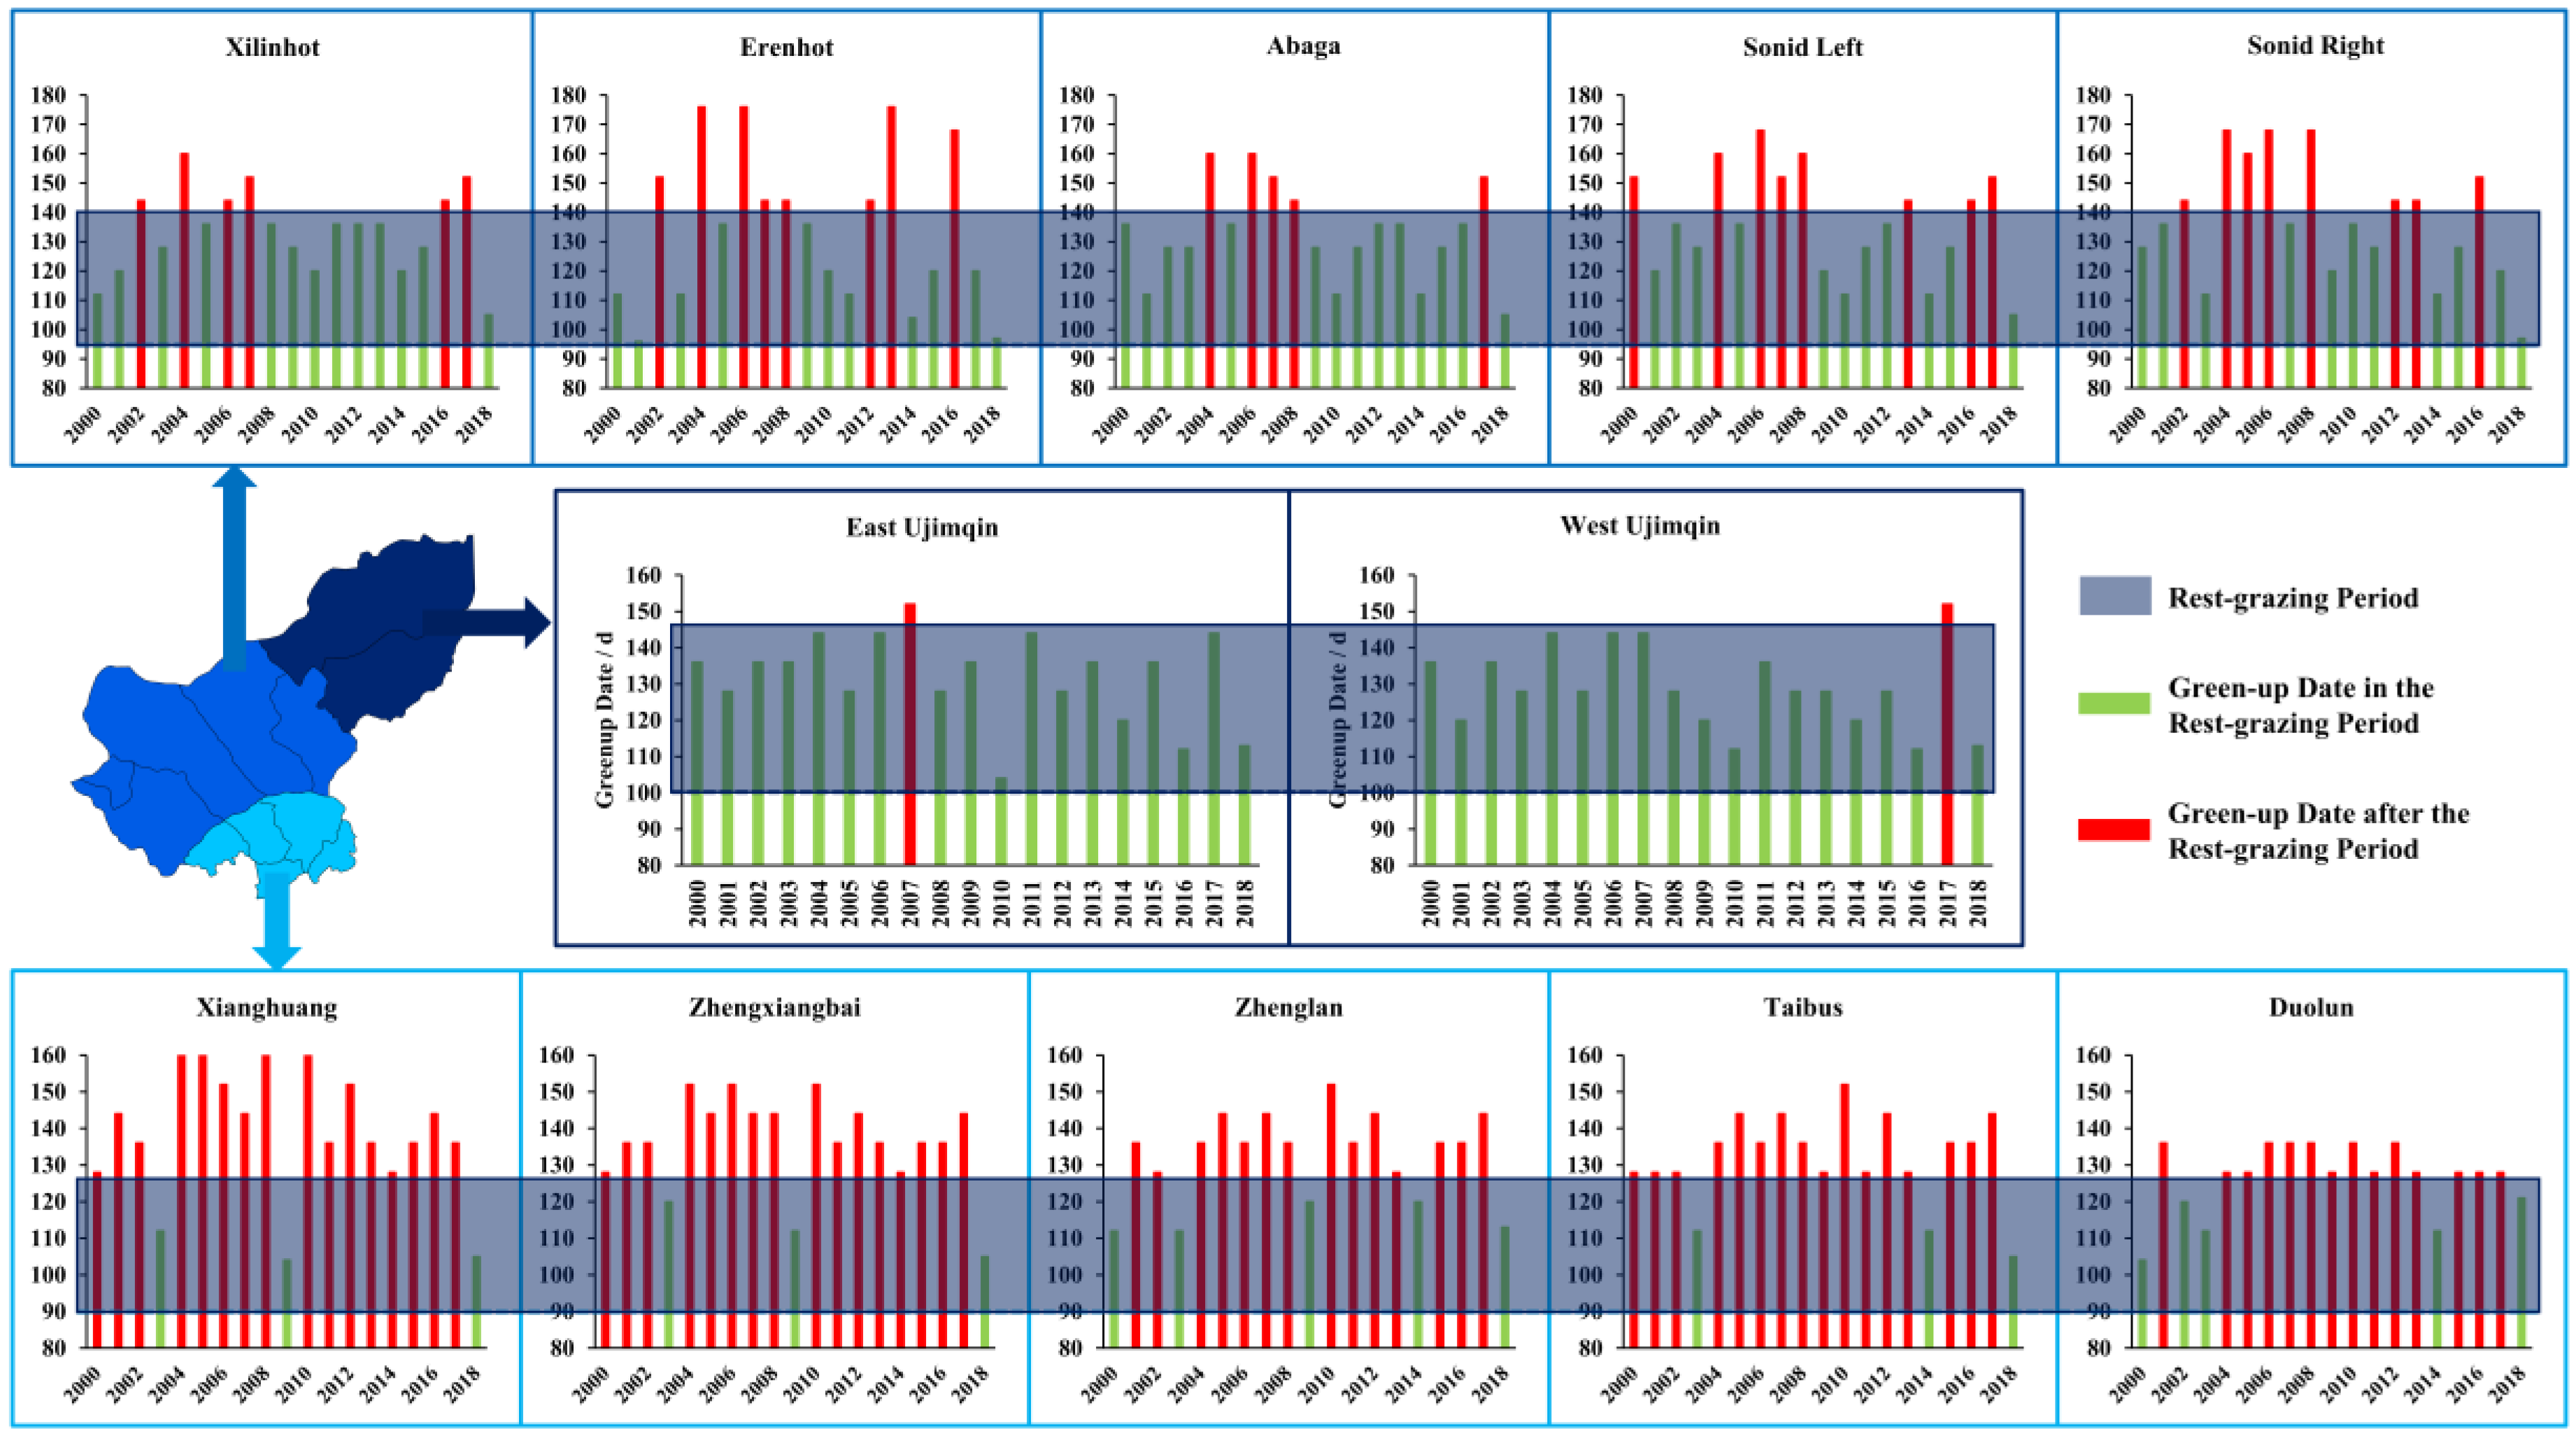
3.3. Discrepancies between Green-Up Process and Rest-Grazing Period

According to the current policies of Xilin Gol Grassland, rest-grazing starts at 90 d (1 April) in the southern counties (Xianghuang, Zhengxiangbai, Taibus, Zhenglan and Duolun), at 95 d (5 April) in central and western counties (Erenhot, Xilinhot, Abaga, Sonid Right and Sonid Left), and at 100 d (10 April) in northeastern counties (East Ujimqin and West Ujimqin). Rest-grazing period lasts for 45 days every year, and the green-up process usually has a similar length as well. We compared the annual green-up dates of each county with the rest-grazing periods. The results showed that rest-grazing started much earlier than the green-up date in most years and also ended before the green-up date in several years in each county. Specifically, there was only one year in East Ujimqin and West Ujimqin when rest-grazing ended before the green-up date (Figure 5). In central and western counties, there were 5~8 years when rest-grazing ended before the green-up date (Figure 5). In southern counties, however, rest-grazing ended before the green-up date in most years, for there were only 3~5 years when the green-up date appeared during the rest-grazing period (Figure 5). Even among the rest of the green-up date records, there were only four records appearing less than 7 days after the rest-grazing started, including Sonid Right in 2018, East Ujimqin in 2010 and Erenhot in 2001 and 2018, while in other years there was a too short time of rest-grazing (less than 38 days) left after the green-up date (Figure 5). The above results showed that starting rest-grazing too early was a common phenomenon in Xilin Gol Grassland, which was much more obvious in southern counties.
We further compared the average green-up date with the rest-grazing date, and the results once again showed the phenomenon of too early rest-grazing. The rest-grazing started after the green-up date in only a few grasslands, which were distributed in the northeast of East Ujimqin and occupied 1.64% of Xilin Gol Grassland (Figure 6a,b). In all the other areas, the green-up dates all appeared after the rest-grazing started. Specifically, the rest-grazing mainly started less than 15 days before the green-up date in the east of East Ujimqin and West Ujimqin, occupying 8.16% of Xilin Gol Grassland (Figure 6a,b). The rest-grazing started 15~30 days or 30~45 days before the green-up date in most areas of central and western counties and some areas of southern counties, which were the two major groups and occupied 40.53% and 44.04% respectively (Figure 6a,b). In the southern counties, there were also some areas occupying 5.64% of Xilin Gol Grassland where the rest-grazing started more than 45 days before the green-up date, which means the green-up date appeared after the rest-grazing period had ended (Figure 6a,b). The discrepancy between the green-up date and the rest-grazing date caused that there must be several days during the green-up process when grazing was not prohibited. We calculated the average grazing days during the green-up process in each group. The grazing days were 17 in such areas where rest-grazing started later than the green-up date (Figure 6c). In the other areas where rest-grazing started before the green-up date, the grazing days were 10, 23, 36 and 45 in such areas where the gaps between the two dates were 0~15, 15~30, 30~45 and >45, respectively (Figure 6c). The grazing days during the green-up process increased gradually with the widening gap between the green-up date and rest-grazing date, which also means the increasing ecological pressure on the grasslands.

4. Discussion

4.1. Monitor the Changes of Green-Up Date and Climate Driving Forces

The green-up date had obvious temporal and spatial variations in Xilin Gol Grassland because it was greatly affected by climate driving forces. Precipitation is probably the most important influence factor on the green-up date because Xilin Gol Grassland mostly belongs to the semi-arid areas where precipitation is the main limitation for vegetation growth [67,68]. The annual precipitation in Xilin Gol Grassland has shown a significant increasing trend during 2000~2018, which could result in the advance of the green-up date (Figure 7a). Compared with precipitation, temperature is not the dominant influence factor in the semi-arid areas, but the increase in temperature will cause the accumulated temperature threshold for green-up to arrive more quickly, thus also resulting in the advance of the green-up date. Many existing studies have shown that there has been a warming trend in Northern China in recent years [69,70,71,72], and the temperature in Xilin Gol Grassland has also experienced an increase that was not significant (Figure 7b). In contrast, the influence of solar radiation on the green-up date was limited because it mainly affected the later grassland growth after the green-up period through photosynthesis but cannot affect the arrival of the green-up date obviously [73,74,75]. There were also little variations in the solar radiation of Xilin Gol Grassland during 2000~2018 (Figure 7c). Because the green-up dates were mostly in May, considering the hysteretic effect of climate, we further analyzed the correlation between green-up dates and precipitation, temperature and solar radiation in April. We found that only April precipitation had a significant negative correlation with the green-up date, while temperature and solar radiation did not (Figure 7d–f). The spatial distributions showed similar results again, for only the precipitation in April had a relatively strong correlation with the green-up date, and its spatial distribution characteristics were also similar to the green-up date (Figure 7g). In contrast, the spatial distributions of temperature and solar radiation were different from the green-up date, and also showed a very weak correlation (Figure 7h,i). This means that the precipitation in April could have a key impact on the green-up date, which has also been confirmed in other studies [76,77,78]. Additionally, according to our survey results, the first sufficient rain in spring usually indicated the green-up date was coming soon, and such rain usually occurred in April. Therefore, the increased precipitation in April could increase the moisture accumulation and then probably bring a huge advance on the green-up date.
Moreover, as the major water source, the higher precipitation usually brings an increase in NPP and vegetation coverage of grasslands. The grassland ecosystems with higher precipitation and NPP also have more intact structures and stronger resilience, which can keep the green-up date more stable under climate variations. Therefore, there was no obvious fluctuation in the green-up date caused by climate variations in such areas, and this is also an important reason why the green-up date was more stable in the east than that in the west of Xilin Gol Grassland [79,80]. In summary, climate variations largely affect the green-up date, so the local government should strengthen the monitoring of the green-up date and also climate driving forces (temperature and precipitation) is timely in the future in order to make up for the lack of monitoring data and provide accurate guidance for grassland management.

4.2. Optimize Rest-Grazing Period to Avoid Starting Rest-Grazing Too Early

As a main grassland management policy, rest-grazing is aimed at protecting vegetation growth from grazing disturbances during the green-up period, and existing studies have already shown that rest-grazing can bring huge improvements in biomass increase, carbon storage, water content, biodiversity conservation and other important ecosystem services [8,10,11,16]. However, such ecological benefits will be limited unless the green-up process is totally covered by the rest-grazing period. According to the introduction of local governors and experts in Xilin Gol Grassland, rest-grazing should start within one week before the green-up date in order to protect the green-up process from grazing disturbances effectively, and meanwhile also not to occupy too much time for grazing.
The results above showed that the green-up date was constantly fluctuating, especially in the arid areas with less precipitation, where the green-up date was much more unstable. However, rest-grazing always started on a fixed date and lasted for fixed days every year, which will inevitably lead to non-correspondence between the two. Starting rest-grazing too early is a common phenomenon in Xilin Gol Grassland, especially in southern counties, which can easily cause the green-up date to fall behind the rest-grazing period. Even if the green-up date is covered by a rest-grazing period, it may leave only a little time for rest-grazing after the green-up date and waste too much time for grazing before the green-up date. As a result, the ecological pressure on grasslands cannot be relieved effectively, and meanwhile, herdsmen are compelled to take substitute measures instead of grazing, among which house feeding is the most widely used according to our survey. House feeding, however, requires huge forage purchase and storage, livestock sheds and necessary supporting facilities, which raise the economic and labor costs and increase the life burden of herdsmen [28,29,30]. Therefore, too early rest-grazing will bring much unsustainability to the economic-ecological system on grasslands.
Starting rest-grazing too early essentially lies in the discrepancy between the green-up process and the rest-grazing period. In the future, the rest-grazing period should be adjusted dynamically based on the monitoring of the green-up date rather than fixed, so as to reduce the life burden of herdsmen brought by rest-grazing as much as possible on the premise of ecological conservation. In addition, the rest-grazing policies also include financial subsidies, education, supervision, reward or punishment and so on [81,82,83]. Therefore, based on the monitoring of the green-up date, the relevant policies must also consider the above socio-economic factors so as to adapt to the geographical and social backgrounds, thus having the greatest effectiveness in ecological conservation and animal husbandry development.

5. Conclusions

In this study, we extracted the annual green-up date of Xilin Gol Grassland from 2000 to 2018 based on MODIS images, and then analyzed the spatiotemporal variations and stability of the green-up date. At the same time, we also compared the green-up date with the rest of the grazing period. The results showed that the overall green-up date has advanced from 2000 to 2018, which was earlier in the east and west but later in the central areas of Xilin Gol Grassland. Moreover, the CV of the green-up date showed a significant negative correlation with precipitation, so the green-up date was more stable in humidity than in arid areas. In addition, the rest-grazing period has failed to cover the green-up date in many years, and the average green-up date was much later than the rest-grazing date in most areas, which reflected that starting rest-grazing too early was a common phenomenon in Xilin Gol Grassland. In the future, the local government should strengthen the monitoring of green-up dates so as to accurately grasp the changes in green-up dates in time and provide references for starting rest-grazing at the proper date and optimize relevant policies, thus promoting both ecological conservation of grasslands and sustainable development of animal husbandry.

Author Contributions

Conceptualization, B.W. and H.Y.; methodology, X.W.; software, Z.N.; investigation, B.W., H.Y. and X.W.; data curation, Z.N.; writing—original draft preparation, B.W. and X.W.; writing—review and editing, B.W. and H.Y.; visualization, B.W.; supervision, H.Y.; project administration, H.Y.; funding acquisition, H.Y. All authors have read and agreed to the published version of the manuscript.

Funding

This research was supported by the Second Tibetan Plateau Scientific Expedition and Research Program (2019QZKK1006), and Strategic Priority Research Program of the Chinese Academy of Sciences (XDA23100202).

Data Availability Statement

The data presented in this study are available on request from the corresponding author.

Acknowledgments

We would like to thank all the experts for their contributions to improving the quality of the paper. We also want to express our deepest gratitude to the local government and herdsmen in Xilin Gol grassland.

Conflicts of Interest

The authors declare no conflict of interest.

References

  1. Bardgett, R.D.; Bullock, J.M.; Lavorel, S.; Manning, P.; Schaffner, U.; Ostle, N.; Chomel, M.; Durigan, G.; Fry, E.L.; Johnson, D.; et al. Combating global grassland degradation. Nat. Rev. Earth Environ. 2021, 2, 720–735. [Google Scholar] [CrossRef]
  2. Mishra, N.B.; Crews, K.A.; Neeti, N.; Meyer, T.; Young, K.R. MODIS derived vegetation greenness trends in African Savanna: Deconstructing and localizing the role of changing moisture availability, fire regime and anthropogenic impact. Remote Sens. Environ. 2015, 169, 192–204. [Google Scholar] [CrossRef]
  3. He, F.Q.; Chen, D.D.; Li, Q.; Huo, L.L.; Zhao, L.; Li, C.L.; Chen, X. Temporal and Spatial Patterns of Herbage and Nutrient Carrying Capacity of Alpine Grassland of Sanjiangyuan. Acta Agrestia Sin. 2021, 29, 2808–2816. [Google Scholar]
  4. Wang, H.; Zhou, Y.K.; Wang, X.Y.; Zhou, C.H. Spatiotemporal Changes in Vegetation Growth Peak and the Response to Climate and Phenology over Northeast China. Remote Sens. Technol. Appl. 2021, 36, 3977. [Google Scholar] [CrossRef]
  5. Xu, Z.C.; Song, Y.T.; Wu, Y.N.; Huo, G.W.; Wang, X.M.; Dao, R.N. Effect of grazing intensities on soil enzyme activities and soil microbial biomass of Stipa krylovii steppe in different phenological periods. Chin. J. Ecol. 2016, 35, 2022–2028. [Google Scholar]
  6. Cai, H.Y.; Yang, X.H.; Xu, X.L. Human-induced grassland degradation/restoration in the central Tibetan Plateau: The effects of ecological protection and restoration projects. Ecol. Eng. 2015, 83, 112–119. [Google Scholar] [CrossRef]
  7. Zhou, W.; Gang, C.C.; Zhou, L.; Chen, Y.Z.; Li, J.L.; Ju, W.M.; Odeh, I. Dynamic of grassland vegetation degradation and its quantitative assessment in the northwest China. Acta Oecol. 2014, 55, 86–96. [Google Scholar] [CrossRef]
  8. Qin, J.P.; Liu, Y.; Ma, Y.S.; Wang, Y.L.; Li, S.X. Effects of Rest Grazing on Vegetation Characteristics and Photosynthetic Physiology of Dominant Species in Degraded Alpine Grasslands During Greenup Period. Acta Agrestia Sin. 2021, 29, 1034–1042. [Google Scholar]
  9. Ma, Y.S.; Li, S.X.; Wang, Y.L.; Sun, X.D.; Jing, M.L.; Li, S.Y.; Li, L.Q.; Wang, X.L. Effect of Rest-grazing in the Greenup Period on Degraded Vegetation in Alpine Meadow. Acta Agrestia Sin. 2017, 25, 290–295. [Google Scholar]
  10. Gao, X.Y.; Lu, X.Y. Effects of rest grazing on vegetation and soil characteristics of alpine steppe and alpine meadow in Tibet. Pratacult. Sci. 2020, 37, 486–496. [Google Scholar]
  11. Li, L.Q.; Ma, Y.S.; Li, S.X.; Wang, X.L.; Wang, Y.L.; Jing, M.L.; Li, S.Y.; Nian, Y.; Han, H.L. Effects of rest-grazing in the regreen-up period on moderately degraded steppification meadow of Qilian Mountain. Pratacult. Sci. 2017, 34, 2016–2022. [Google Scholar]
  12. Wang, T.W.; Zhang, Z.; Li, Z.B.; Li, P. Grazing management affects plant diversity and soil properties in a temperate steppe in northern China. CATENA 2017, 158, 141–147. [Google Scholar] [CrossRef]
  13. Liu, Y.; Chang, X.F.; Tian, F.P.; Liu, Z.H.; Dang, Z.Q.; Wu, G.L. Effects of Grazing on Community and Soil Characteristics in the Semi-arid Grassland. Acta Bot. Boreali-Occident. Sin. 2016, 36, 2524–2532. [Google Scholar]
  14. Gu, W.R.; Zhang, X.H.; Zhu, J.Z.; Sun, Z.J.; Mu, X.Y.; Wang, X.J. Impact of Seasonal Rest Grazing on Plant Community Quantity Characteristics under Different Grazing Intensities. Xinjiang Agric. Sci. 2013, 50, 1145–1149. [Google Scholar]
  15. Zhou, J.Q.; Tian, Y.; Wu, Y.Q.; Liu, J.K.; Zhang, K.B. Characteristics of Grassland Vegetation Community under Different Grazing Management and Its Relationship with Soil Factors: A Case Study of Xin Barag Zuoqi. Ecol. Environ. Sci. 2019, 28, 1117–1126. [Google Scholar]
  16. Wang, X.L.; Wen, J.; Ma, Y.S.; Wang, Y.L.; Shi, J.J.; Zhou, H.K. Utilization of Different Carbon Source Types in Biology-GN Microplates by Soil Microbial Community from Different Rest-grazing Periods in Green-up Spring. Ecol. Environ. Sci. 2020, 29, 961–970. [Google Scholar]
  17. Li, Y.J.; Song, X.L.; Xiu, W.M.; Zhang, G.L.; Liu, H.M.; Zhao, J.N.; Yang, D.L. Effects of Spring Rest Grazing on Organic Carbon Storage in Leymus Chinensis Steppe in Inner Mongolia, China. J. Agro-Environ. Sci. 2013, 32, 2221–2230. [Google Scholar]
  18. Lang, M.; Li, P.; Long, G.Q.; Yuan, F.J.; Yu, Y.J.; Ma, E.D.; Shan, J.; Muller, C.; Zhu, T.B. Grazing rest versus no grazing stimulates soil inorganic N turnover in the alpine grasslands of the Qinghai-Tibet plateau. CATENA 2021, 204, 105382. [Google Scholar] [CrossRef]
  19. Zhang, Y.J.; Huang, D.; Badgery, W.B.; Kemp, D.R.; Chen, W.Q.; Wang, X.Y.; Liu, N. Reduced grazing pressure delivers production and environmental benefits for the typical steppe of north China. Sci. Rep. 2015, 5, 16434. [Google Scholar] [CrossRef] [Green Version]
  20. Zimmer, H.C.; Turner, V.B.; Mavromihalis, J.; Dorrough, J.; Moxham, C. Forb responses to grazing and rest management in a critically endangered Australian native grassland ecosystem. Rangel. J. 2010, 32, 187–195. [Google Scholar] [CrossRef]
  21. Golding, J.D.; Dreitz, V.J. Songbird response to rest-rotation and season-long cattle grazing in a grassland sagebrush ecosystem. J. Environ. Manag. 2017, 204, 605–612. [Google Scholar] [CrossRef]
  22. Vold, S.T.; Berkeley, L.I.; McNew, L.B. Effects of Livestock Grazing Management on Grassland Birds in a Northern Mixed-Grass Prairie Ecosystem. Rangel. Ecol. Manag. 2019, 72, 933–945. [Google Scholar] [CrossRef]
  23. Thomas, B.W.; Gao, X.L.; Zhao, M.L.; Bork, E.W.; Hao, X.Y. Grazing altered carbon exchange in a dry mixed-grass prairie as a function of soil texture. Can. J. Soil Sci. 2018, 98, 136–147. [Google Scholar]
  24. Chen, X.Q.; Li, J.; Xu, L.; Liu, L.; Ding, D. Modeling greenup date of dominant grass species in the Inner Mongolian Grassland using air temperature and precipitation data. Int. J. Biometeorol. 2014, 58, 463–471. [Google Scholar] [CrossRef]
  25. Wang, L.H.; Tian, F.; Wang, Y.H.; Wu, Z.D.; Schurgers, G.; Fensholt, R. Acceleration of global vegetation greenup from combined effects of climate change and human land management. Glob. Chang. Biol. 2018, 24, 5484–5499. [Google Scholar] [CrossRef]
  26. Yu, Z.; Sun, P.; Liu, S.; Wang, J.; Everman, A. Sensitivity of large-scale vegetation greenup and dormancy dates to climate change in the north-south transect of eastern China. Int. J. Remote Sens. 2013, 34, 7312–7328. [Google Scholar] [CrossRef]
  27. Zhang, X.Y.; Goldberg, M.; Tarpley, D.; Friedl, M.A.; Morisette, J.; Kogan, F.; Yu, Y.Y. Drought-induced vegetation stress in southwestern North America. Environ. Res. Lett. 2010, 5, 024008. [Google Scholar] [CrossRef]
  28. Jia, Y.S.; Li, Q.F. The Research on the Forage Supplying Module on the Grassland during the Delaying and Resting Grazing Periods. Chin. J. Grassl. 2006, 28, 60–65. [Google Scholar]
  29. Leisher, C.; Brouwer, R.; Boucher, T.M.; Vogelij, R.; Bainbridge, W.R.; Sanjayan, M. Striking a Balance: Socioeconomic Development and Conservation in Grassland through Community-Based Zoning. PLoS ONE 2011, 6, e28807. [Google Scholar] [CrossRef]
  30. Briske, D.D.; Zhao, M.; Han, G.; Xiu, C.; Kemp, D.R.; Willms, W.; Havstad, K.; Kang, L.; Wang, Z.; Wu, J.; et al. Strategies to alleviate poverty and grassland degradation in Inner Mongolia: Intensification vs production efficiency of livestock systems. J. Environ. Manag. 2015, 152, 177–182. [Google Scholar] [CrossRef]
  31. Ahrends, H.E.; Etzold, S.; Kutsch, W.L.; Stöckli, R.; Brügger, R.; Jeanneret, F.; Wanner, H.; Buchmann, N.; Eugster, W. Tree phenology and carbon dioxide fluxes: Use of digital photography for process-based interpretation at the ecosystem scale. Clim. Res. 2009, 39, 261–274. [Google Scholar] [CrossRef] [Green Version]
  32. Guo, J.; Chen, S.; Xu, B.; Shen, G.; Jin, Y.X.; Zhang, Y.J.; Yang, X.C. Remote sensing monitoring of grassland vegetation greenup based on SPOT-VGT in Xilingol League. Geogr. Res. 2017, 36, 37–48. [Google Scholar]
  33. Song, C.Q.; You, S.C.; Ke, L.H.; Liu, G.H.; Zhong, X.K. Spatio-temporal variation of vegetation phenology in the Northern Tibetan Plateau as detected by MODIS remote sensing. Acta Phytoecol. Sin. 2011, 35, 853–863. [Google Scholar]
  34. An, S.; Zhang, X.Y.; Chen, X.Q.; Yan, D.; Henebry, G.M. An Exploration of Terrain Effects on Land Surface Phenology across the Qinghai-Tibet Plateau Using Landsat ETM plus and OLI Data. Remote Sens. 2018, 10, 1069. [Google Scholar] [CrossRef] [Green Version]
  35. Xu, X.Y.; Riley, W.J.; Koven, C.D.; Jia, G.S. Observed and Simulated Sensitivities of Spring Greenup to Preseason Climate in Northern Temperate and Boreal Regions. J. Geophys. Res.-Biogeosci. 2018, 123, 60–78. [Google Scholar] [CrossRef] [Green Version]
  36. Deng, G.R.; Zhang, H.Y.; Yang, L.B.; Zhao, J.J.; Guo, X.Y.; Hong, Y.; Wu, R.H.; Dan, G. Estimating Frost during Growing Season and Its Impact on the Velocity of Vegetation Greenup and Withering in Northeast China. Remote Sens. 2020, 12, 1355. [Google Scholar] [CrossRef]
  37. Zhang, X.Y.; Jayavelu, S.; Liu, L.L.; Friedl, M.A.; Henebry, G.M.; Liu, Y.; Schaaf, C.B.; Richardson, A.D.; Gray, J. Evaluation of land surface phenology from VIIRS data using time series of PhenoCam imagery. Agric. For. Meteorol. 2018, 256, 137–149. [Google Scholar] [CrossRef]
  38. Justice, C.O.; Townshend, J.R.G.; Holben, B.N.; Tucker, C.J. Analysis of the phenology of global vegetation using meteorological satellite data. Int. J. Remote Sens. 1985, 6, 1271–1318. [Google Scholar] [CrossRef]
  39. Reed, B.C.; Brown, J.F.; Van der Zee, D.; Loveland, T.R.; Merchant, J.W.; Ohlen, D.O. Measuring phenological variability from satellite imagery. J. Veg. Sci. 1994, 5, 703–714. [Google Scholar] [CrossRef]
  40. Zhang, X.Y.; Friedl, M.A.; Schaaf, C.B.; Strahler, A.H.; Hodges, J.C.F.; Gao, F.; Reed, B.C.; Huete, A. Monitoring vegetation phenology using MODIS. Remote Sens. Environ. 2003, 84, 471–475. [Google Scholar] [CrossRef]
  41. Dall’Olmo, G.; Karnieli, A. Monitoring phenological cycles of desert ecosystems using NDVI and LST data derived from NOAA-AVHRR imagery. Int. J. Remote Sens. 2002, 23, 4055–4071. [Google Scholar] [CrossRef]
  42. Jönsson, P.; Eklundh, L. TIMESAT-a program for analyzing time-series of satellite sensor data. Comput. Geosci. 2004, 30, 833–845. [Google Scholar] [CrossRef] [Green Version]
  43. Sakamoto, T.; Yokozawa, M.; Toritani, H.; Shibayama, M.; Ishitsuka, N.; Ohno, H. A crop phenology detection method using time-series MODIS data. Remote Sens. Environ. 2005, 96, 366–374. [Google Scholar] [CrossRef]
  44. Xia, C.F.; Li, J.; Liu, Q.H. Review of advances in vegetation phenology monitoring by remote sensing. J. Remote Sens. 2013, 17, 1–16. [Google Scholar]
  45. Song, C.Q.; You, S.C.; Ke, L.H.; Liu, G.H.; Zhong, X.K. Phenological variation of typical vegetation types in northern Tibet and its response to climate changes. Acta Ecol. Sin. 2012, 32, 1045–1055. [Google Scholar] [CrossRef] [Green Version]
  46. Zhou, Y.K. Greenness Index from Phenocams Performs Well in Linking Climatic Factors and Monitoring Grass Phenology in a Temperate Prairie Ecosystem. J. Resour. Ecol. 2019, 10, 481–493. [Google Scholar]
  47. Xu, D.D.; An, D.S.; Guo, X.L. The Impact of Non-Photosynthetic Vegetation on LAI Estimation by NDVI in Mixed Grassland. Remote Sens. 2020, 12, 1979. [Google Scholar] [CrossRef]
  48. Jiang, Z.Y.; Huete, A.R. Linearization of NDVI Based on its Relationship with Vegetation Fraction. Photogramm. Eng. Remote Sens. 2010, 76, 965–975. [Google Scholar] [CrossRef]
  49. Tian, F.; Brandt, M.; Liu, Y.Y.; Verger, A.; Tagesson, T.; Diouf, A.A.; Rasmussen, K.; Mbow, C.; Wang, Y.J.; Fensholt, R. Remote sensing of vegetation dynamics in drylands: Evaluating vegetation optical depth (VOD) using AVHRR NDVI and in situ green biomass data over West African Sahel. Remote Sens. Environ. 2016, 177, 165–176. [Google Scholar] [CrossRef] [Green Version]
  50. Zhang, T.R.; Chai, X.M.; Li, Z.Z. Characteristics of Vegetation Coverage in Northern China and Its Relationship with Sandstorm. Plateau Meteorol. 2010, 29, 137–145. [Google Scholar]
  51. Zhang, Q.Y.; Zhang, Y.; Li, L. Preliminary Study on Sand—Dust Storm in the Northern China and Its Prevention and Control. Urban Environ. Urban Ecol. 2002, 15, 48–50. [Google Scholar]
  52. Su, Q.H.; Sun, L.; Yang, Y.K.; Zhou, X.Y.; Li, R.B.; Jia, S.F. Dynamic Monitoring of the Strong Sandstorm Migration in Northern and Northwestern China via Satellite Data. Aerosol Air Qual. Res. 2017, 17, 3244–3252. [Google Scholar] [CrossRef] [Green Version]
  53. Miao, L.J.; Jiang, C.; Xue, B.L.; Liu, Q.; He, B.; Nath, R.; Cui, X.F. Vegetation dynamics and factor analysis in arid and semi-arid Inner Mongolia. Environ. Earth Sci. 2015, 73, 2343–2352. [Google Scholar] [CrossRef]
  54. Yang, Q.; Wang, T.T.; Chen, H.; Wang, Y.D. Characteristics of vegetation cover change in Xilin Gol League based on MODIS EVI data. Trans. Chin. Soc. Agric. Eng. 2015, 31, 191–198. [Google Scholar]
  55. Wu, X.; Xu, K.; Zhang, J.Y.; Li, J.F. Sand Source of Grassland Desertification and Its Geological Origin in Xilin Gol Steppe of China. J. Desert Res. 2018, 38, 92–100. [Google Scholar]
  56. Zhuo, L.; Cao, X.; Chen, Z.X.; Shi, P.J. Assessment of Grassland Ecological Restoration Project in Xilin Gol Grassland. Acta Geogr. Sin. 2007, 62, 471–480. [Google Scholar]
  57. National Earth System Science Data Center. Available online: http://www.geodata.cn/ (accessed on 8 June 2022).
  58. Earth Databank of Chinese Academy of Sciences. Available online: https://data.casearth.cn/ (accessed on 6 June 2022).
  59. Ceccato, P.; Gobron, N.; Flasse, S.; Pinty, B.; Tarantola, S. Designing a spectral index to estimate vegetation water content from remote sensing data: Part 1—Theoretical approach. Remote Sens. Environ. 2002, 82, 188–197. [Google Scholar] [CrossRef]
  60. Ceccato, P.; Flasse, S.; Gregoire, J.M. Designing a spectral index to estimate vegetation water content from remote sensing data—Part 2. Validation and applications. Remote Sens. Environ. 2002, 82, 198–207. [Google Scholar] [CrossRef]
  61. Resources and Environmental Sciences Data Center of Chinese Academy of Sciences. Available online: http://www.resdc.cn (accessed on 9 June 2022).
  62. Zhou, J.; Jia, L.; Menenti, M.; Liu, X. Optimal Estimate of Global Biome-Specific Parameter Settings to Reconstruct NDVI Time Series with the Harmonic Analysis of Time Series (HANTS) Method. Remote Sens. 2021, 13, 4251. [Google Scholar] [CrossRef]
  63. Jiang, X.G.; Wang, D.; Tang, L.L.; Hu, J.; Xi, X.H. Analysing the vegetation cover variation of China from AVHRR-NDVI data. Int. J. Remote Sens. 2008, 29, 5301–5311. [Google Scholar] [CrossRef]
  64. Xiao, X.M.; Boles, S.; Liu, J.Y.; Zhuang, D.F.; Frolking, S.; Li, C.S.; Salas, W.; Moore, B. Mapping paddy rice agriculture in southern China using multi-temporal MODIS images. Remote Sens. Environ. 2005, 95, 480–492. [Google Scholar] [CrossRef]
  65. Xiao, X.; Hagen, S.; Zhang, Q.; Keller, M.; Moore, B., III. Detecting leaf phenology of seasonally moist tropical forests in South America with multi-temporal MODIS images. Remote Sens. Environ. 2006, 103, 465–473. [Google Scholar] [CrossRef]
  66. Liu, A.J.; Han, J.G. Remote sensing for monitoring the key phonological stages of rangeland—A case study in Xilingol. Pratacult. Sci. 2007, 24, 1–5. [Google Scholar]
  67. Dai, H.Y.; Du, W.L.; Wang, X.J.; Li, D.; Su, D.Y. Climate Type and Net Primary Productivity Evolution Process in Inner Mongolia During 1981~2010. Res. Soil Water Conserv. 2018, 25, 222–226. [Google Scholar]
  68. Zhao, X.H.; Zhang, F.M.; Han, D.C.; Weng, S.H. Evapotranspiration changes and its attribution in semi-arid regions of Inner Mongolia. Arid Zone Res. 2021, 38, 1614–1623. [Google Scholar]
  69. Dong, L.L.; Li, Q.Q.; Ding, Y.H. Spatial and temporal characteristics of air temperature over China in spring under the background of global warming. Meteorol. Mon. 2015, 41, 1177–1189. [Google Scholar]
  70. Wang, H.J.; Zhang, B.; Zhao, C.Y.; Jin, X.H.; Wang, X.M.; Dai, S.P.; Wang, Y.M.; Kang, S.Y.; Liu, Y.Y.; Li, D. The Spatio-temporal Characteristics of Temperature Change in Recent 57 Years in Northern China. Prog. Geogr. 2009, 28, 643–650. [Google Scholar]
  71. Lin, C.C.; Wang, K.; Sun, Y.M. Study on the change of temperature time series in medium section of agro-pastoral ecotone of northern China during the last 60 years. Acta Agrestia Sin. 2016, 24, 747–753. [Google Scholar]
  72. Jiao, W.H.; Zhang, B.; Ma, B.; Cui, Y.Q.; Huang, H.; Wang, X.D. Temporal and spatial changes of extreme temperature and its influencing factors in northern China in recent 58 years. Arid Land Geogr. 2020, 43, 1220–1230. [Google Scholar]
  73. Qiu, B.; Li, W.; Wang, X.; Shang, L.; Song, C.; Guo, W.; Zhang, Y. Satellite-observed solar-induced chlorophyll fluorescence reveals higher sensitivity of alpine ecosystems to snow cover on the Tibetan Plateau. Agric. For. Methodol. 2019, 271, 126–134. [Google Scholar] [CrossRef]
  74. Ren, Y.; Yang, K.; Wang, H.; Zhao, L.; Chen, Y.; Zhou, X.; La, Z. The South Asia Monsoon Break Promotes Grass Growth on the Tibetan Plateau. J. Geogr. Res. Biogeosci. 2022, 126, e2020JG005951. [Google Scholar] [CrossRef]
  75. Jones, M.O.; Kimball, J.S.; Nemani, R.R. Asynchronous Amazon forest canopy phenology indicates adaptation to both water and light availability. Environ. Res. Lett. 2014, 9, 124021. [Google Scholar] [CrossRef]
  76. Zhang, W.; Bao, G.; Bao, Y.H. Vegetation SOS dynamic monitoring in Inner Mongolia from 1982 to 2013 and Its responses to climatic changes. China Agric. Inform. 2018, 30, 63–75. [Google Scholar]
  77. Li, X.H.; Chen, S.H.; Han, F. Vegetation SOS dynamic monitoring in Inner Mongolia from 1982 to 2013 and Its responses to climatic changes. Pratacultural Sci. 2013, 30, 452–456. [Google Scholar]
  78. Yan, M.; Zuo, H.J.; Zhang, Y.; Chang, H. Reviving characteristic of Stipa grandis and its relationship with meteorological factors in xilinhot steppe. Ecol. Environ. Sci. 2019, 28, 1307–1312. [Google Scholar]
  79. Liu, Y.Y.; Ren, H.Y.; Zhang, Z.Y.; Zhang, W.; Zhang, Z.X.; Basang, C.; Wang, Y.B.; Wen, Z.M. Temporal and Spatial Dynamic Pattern of Grassland Coverage and Its Influencing Factors in China. Res. Soil Water Conserv. 2022, 29, 221–230. [Google Scholar]
  80. Chen, K. Analysis on the Change of Vegetation Coverage and Its Influencing Factors in Xilingol League; Inner Mongolia University: Hohhot, China, 2021. [Google Scholar]
  81. Wang, Z. Discussion on the regulatory legislation of banning grazing and delay grazing. Pratacult. Sci. 2016, 33, 1440–1446. [Google Scholar]
  82. Fan, S.-Y.; Xu, Y.-C.; Duan, S.-Q.; Lan, J.; Xu, J. Measurement of transaction cost of rest-grazing policy. Chin. J. Eco-Agric. 2012, 20, 1248–1253. [Google Scholar] [CrossRef]
  83. Luo, Q.; Zhen, L.; Yang, W.N.; Xu, Z.R. The influence of ecological restoration projects on cultural ecosystem services in the Xilin Gol Grassland. J. Nat. Resour. 2020, 35, 119–129. [Google Scholar]
Figure 1. (a) The average temperature, (b) annual precipitation, (c) NPP and (d) vegetation coverage in Xilin Gol Grassland.
Remotesensing 14 03443 g001
Figure 2. (a) Temporal variations of (a) NDVI (both original and after HANTS), (b) EVI (both original and after HANTS) and (c) LSWI.
Remotesensing 14 03443 g002
Figure 3. (a) Temporal variations of green-up date; (b) green-up date of different grassland types; (c) spatial variations and (d) the changing slope of green-up date in Xilin Gol grassland from 2000 to 2018.
Remotesensing 14 03443 g003
Figure 4. The (a) earliest, (b) latest and (c) CV of green-up date in Xilin Gol grassland; (d) correlation between annual precipitation and the CV of green-up date.
Remotesensing 14 03443 g004
Figure 5. Comparison between annual green-up date and rest-grazing period in each county.
Remotesensing 14 03443 g005
Figure 6. (a) Spatial distributions of the gap between green-up date and rest-grazing date; (b) area proportions of grasslands with different gaps between the two dates; (c) grazing days during the green-up process in the grasslands with different gaps between the two dates.
Remotesensing 14 03443 g006
Figure 7. (a) Temporal variations of (a) precipitation, (b) temperature and (c) solar radiation; correlation between the (d) precipitation, (e) temperature and (f) solar radiation in April with the green-up date; spatial variations of (g) precipitation, (h) temperature and (i) solar radiation in April in Xilin Gol Grassland.
Remotesensing 14 03443 g007
Table 1. The specific times and geographical locations of surface observation data.
Surface Observation SitesLongitudesLatitudesYears
Xilinhot116°12′43°57′2015, 2016, 2017, 2018
East Ujimqin116°58′45°27′2016, 2017
West Ujimqin117°56′44°40′2016, 2017
Zhenglan115°51′42°33′2003, 2004, 2005, 2006,
2007, 2008, 2016, 2017
Abaga114°49′44°15′2016, 2017
Sonid Right112°42′42°47′2016, 2017
Taibus115°20′41°52′2016, 2017
Publisher’s Note: MDPI stays neutral with regard to jurisdictional claims in published maps and institutional affiliations.

