Article

Rice Mapping in a Subtropical Hilly Region Based on Sentinel-1 Time Series Feature Analysis and the Dual Branch BiLSTM Model

1
Key Laboratory of Digital Earth Science, Aerospace Information Research Institute, Chinese Academy of Sciences, Beijing 100094, China
2
International Research Center of Big Data for Sustainable Development Goals, Beijing 100094, China
3
College of Resources and Environment, University of Chinese Academy of Sciences, Beijing 100049, China
*
Author to whom correspondence should be addressed.
Remote Sens. 2022, 14(13), 3213; https://doi.org/10.3390/rs14133213
Submission received: 6 June 2022 / Revised: 24 June 2022 / Accepted: 1 July 2022 / Published: 4 July 2022

Abstract

:
Timely and accurate information on rice cultivation makes important contributions to the profound reform of the global food and agricultural system, and promotes the development of global sustainable agriculture. With all-day and all-weather observing ability, synthetic aperture radar (SAR) can monitor the distribution of rice in tropical and subtropical areas. To solve the problem of misclassification of rice with no marked signal during the flooding period in subtropical hilly areas, this paper proposes a new feature combination and dual branch bi-directional long short-term memory (DB-BiLSTM) model to achieve high-precision rice mapping using Sentinel-1 time series data. Based on field investigation data, the backscatter time series curves of the rice area were analyzed, and a characteristic index (VV − VH)/(VV + VH) (VV: vertical emission and vertical receipt of polarization, VH: vertical emission and horizontal receipt of polarization) for small areas of hilly land was proposed to effectively distinguish rice and non-rice crops with no marked flooding period. The DB-BiLSTM model was designed, ensuring the independent learning of multiple features and effectively combining the time series information of both (VV − VH)/(VV + VH) and VH features. The city of Shanwei, Guangdong Province, China, was selected as the study area. Experimental results showed that the overall accuracy of the rice mapping results was 97.29%, and the kappa coefficient reached 0.9424. Compared to other methods, the rice mapping results obtained by the proposed method maintained good integrity and had less misclassification, which demonstrated the proposed method’s practical value in accurate and effective rice mapping tasks.

1. Introduction

In Transforming Our World: The 2030 Agenda for Sustainable Development of the United Nations, the goals of eradicating hunger, achieving food security, improving nutritional status and promoting sustainable agriculture are regarded as important components [1]. Rice supports more than half of the world’s population as a staple food [2] and accounts for more than 12% of global arable land area [3]. Therefore, rice monitoring is critical to global sustainable development [4,5].
Optical remote sensing has become a key technology to determine regional- and global-scale crop area estimations, growth monitoring and yield predictions. However, rice is primarily grown in tropical and subtropical climate zones with perennial rain and heavy clouds, making it challenging to obtain high-quality optical remote sensing data in such regions [6,7]. Compared with traditional optical remote sensing, synthetic aperture radar (SAR) is not affected by weather and can penetrate clouds, and is sensitive to the dielectric and geometric properties of plants [8]. Therefore, SAR data are used for rice monitoring [9,10,11], and with the improvement of time resolution, multitemporal SAR data have been successfully applied to continuous observations of rice [12,13].
The rice mapping method using multitemporal SAR data typically consists of features and classifiers. Currently, multitemporal Sentinel-1 data are the primary data source for these evaluations. First, features to discriminate rice from non-rice crops are defined by analyzing the characteristics of each phase and the variations in the backscattering coefficients during the rice growth cycle [14,15]. For example, empirical methods are used to extract phenological indicators [16,17], or mathematical equations are established to fit time series curves [18,19]. More often, the time series backscattering coefficient is used as the feature directly [20,21], among which vertical emission and horizontal receipt (VH) polarization data are primarily used. Chang et al. used Sentinel-1 VH and vertical emission and vertical receipt (VV) time series data to perform rice mapping in Central Taiwan. Results showed that the overall accuracy of VH polarization was better than that of VV polarization [20]. Pan et al. used Sentinel-1 VH polarization time series data and time-weighted dynamic time warping to complete rice mapping in nine provinces in southern China [21]. Some studies have also used VH and VV polarization to perform feature combination. Ndikumana et al. used 25 Sentinel-1 VH and VV polarization data and deep learning and traditional machine learning classifiers to conduct a comparative study on crop classification [22]. Mansaray et al. used 2017 Sentinel-1 VH and VV polarization time series data and a random forest classifier (RF) to map rice in Jiaxing, China [23]. Yang et al. completed crop mapping including rice in some regions of the United States based on Sentinel-1 VH and VV polarization time series data and the proposed temporal feature-based segmentation model [24].
Extracted features are typically combined with empirical models [25] or machine learning classifiers such as K-means [26], decision trees (DTs) [27,28], support vector machines (SVMs) [10,29] or RF [30,31] for rice mapping. In recent years, the RF classifier has been widely used in crop classification studies due to its capability to process large amounts of data quickly and its strong generalizability [32]. However, rice mapping methods based on empirical models and traditional machine learning have some drawbacks. These methods typically rely heavily on crop phenology knowledge and require more manual intervention.
In recent years, deep learning models, such as convolutional neural networks (CNNs) and recurrent neural networks (RNNs), have provided strong technical support for crop mapping [33,34]. Kussul et al. used 19 scenes of Sentinel-1A and Landsat-8 data and a shallow CNN for crop classification in Ukraine, which showed that the CNN architecture outperformed the multilayer perceptron architecture, resulting in accuracies above 85% for major crops [35]. Xu et al. extracted temporal statistical features based on 758 scenes of Sentinel-1 images from late 2018 to 2019, covering Thailand, and fed the features into a U-Net model with a fully connected conditional random field to generate an annual rice map [36]. Experimental results showed that the method achieved the best overall performance compared to the SVM classifier and the feature selection strategy-based U-Net model, and the overall accuracy reached 91%.
Compared to full CNNs, RNNs can learn temporal features from observations of adjacent time steps and have been shown to be more suitable for tasks that require time-dimensional analysis, such as crop mapping, phenology identification and production prediction. Thorp et al. used multitemporal Sentinel-1 and Sentinel-2 data acquired from November 2018 to April 2019 and long short-term memory (LSTM) to identify the growth stages of rice in West Java, Indonesia, and achieved optimal classification results with an overall accuracy of 79.6% [37]. Sun et al. used the attention mechanism with the bi-directional long short-term memory (BiLSTM) model to extract the distribution of rice in Zhanjiang, China, using the VH polarization of multitemporal Sentinel-1A data. Experimental results achieved an overall accuracy of 0.9351, which was better than that of the LSTM and RF classifiers [38]. Liu et al. proposed a hybrid structure of the CNN and attentional LSTM to map the rotation cultivation of crops in the river plains of Hunan Province, China, with time series SAR and optical data [39]. Experimental results showed that the method achieved reasonable accuracy (higher than 0.85) and outperformed other LSTM models and RF classifiers. Lin et al. proposed a multitask spatiotemporal deep learning LSTM-MTL model to perform rice mapping in the primary rice production areas of the United States using Sentinel-1 SAR time series data from 2018–2019 [40]. The model took spatial variability into consideration and demonstrated superior performance compared with RF and attention-based BiLSTM, achieving a rice mapping accuracy as high as 98.3%. The proposal of convolutional LSTM (ConvLSTM) made it possible to use spatial–temporal features in crop monitoring [41,42]. Chang et al. proposed a new spatial–temporal neural network called the ConvLSTM Rice Field Classifier to conduct rice field classification in Yunlin County and Jiayi County, Taiwan. Experimental results showed that compared with the gated recurrent unit and ConvLSTM, the accuracy of the model was the highest of tested models and reached 98.08% [43].
These results show that deep learning models can achieve higher performance and application prospects than traditional machine learning models in the field of rice monitoring. The existing studies primarily focused on rice growing areas with flat topography. VH polarization timing features are often used. The VH polarization time series characteristics of rice in these study areas show clear flooding period signals at the early stage of rice transplanting, primarily in the form of a “bell curve” [21,38]. However, the rice planting area in the hilly region of southeast China is small and scattered, and the time series curve of the VH polarization data has no strong signal during the flooding period. Relying on the traditional characteristic curve will cause many missed detections. Therefore, it is necessary to extract a new SAR rice characteristic parameter according to the rice sowing characteristics in the study area, which is used to increase the difference between rice and other crops where the signal of the flooding period is not marked. In addition, considering the application of multiple scenarios, it is necessary to combine multiple characteristic parameters, which proposes new requirements for existing models. Most studies have superimposed multiple features and then input them into the classifier. When extracting high-dimensional time information from the model, the different magnitudes of different time features and the mutual interference of different input time features are ignored.
In this study, a new rice mapping method was proposed to solve the above problems. The primary contributions of this study include the following:
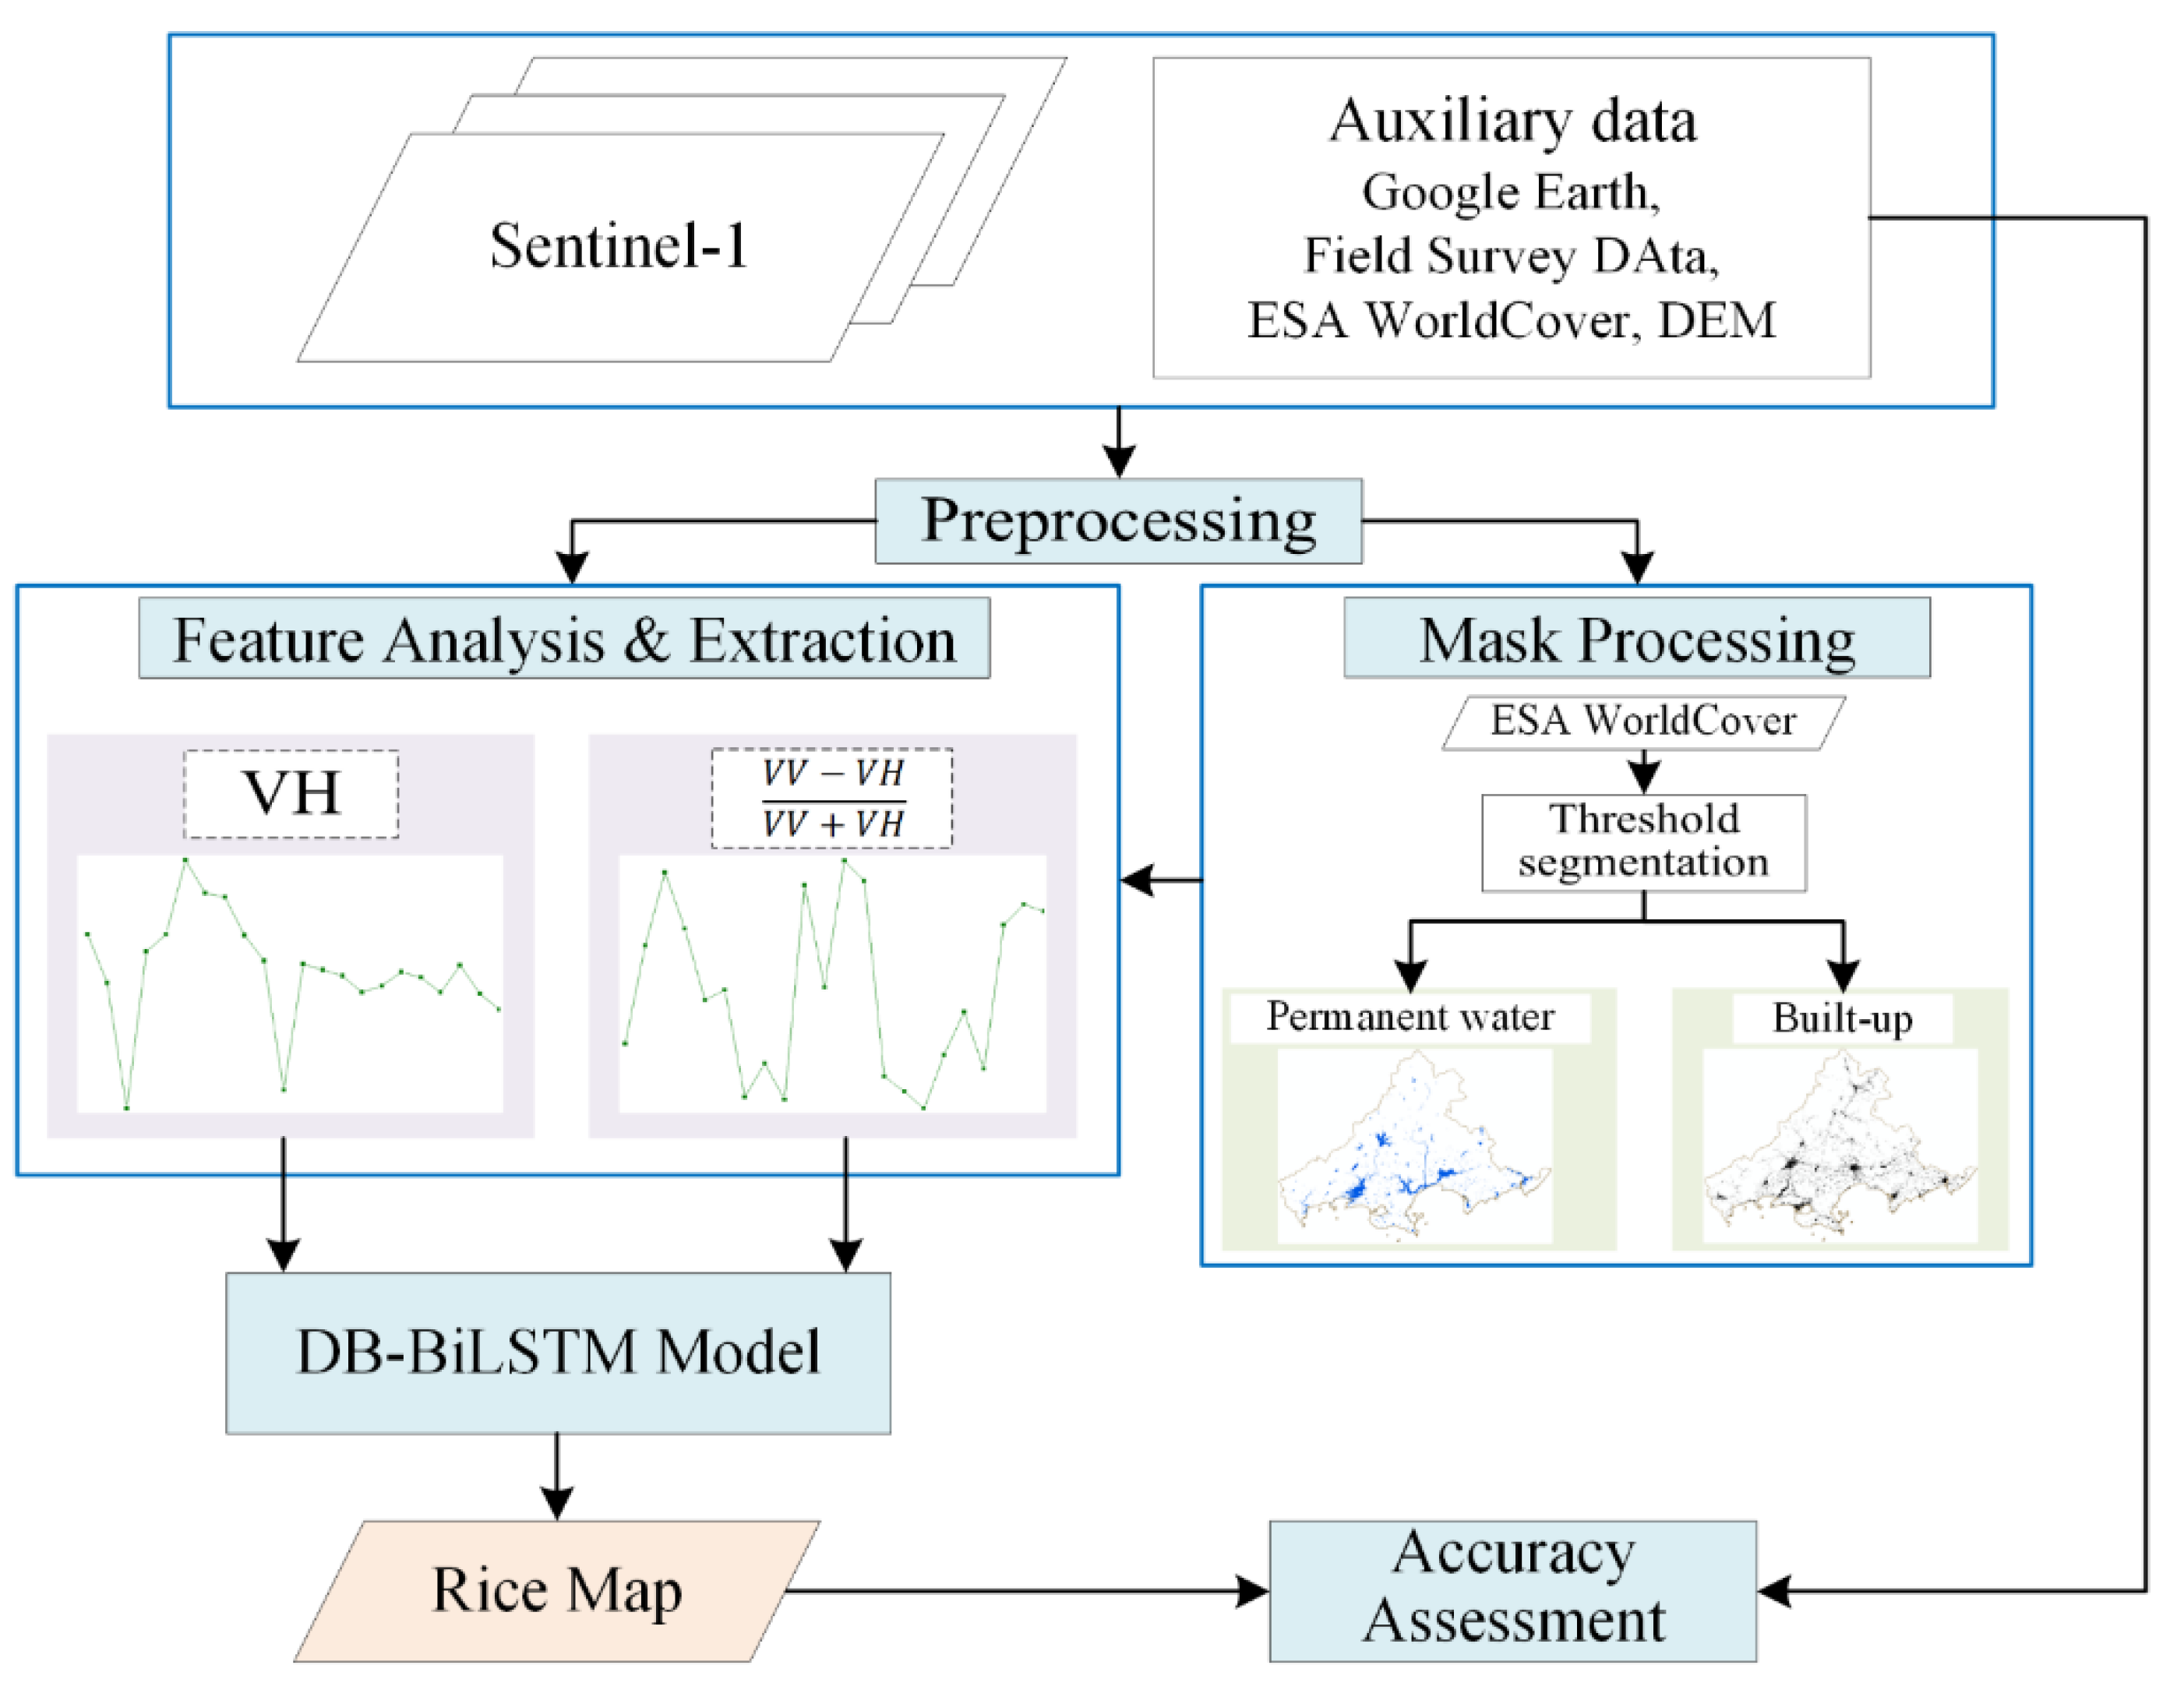
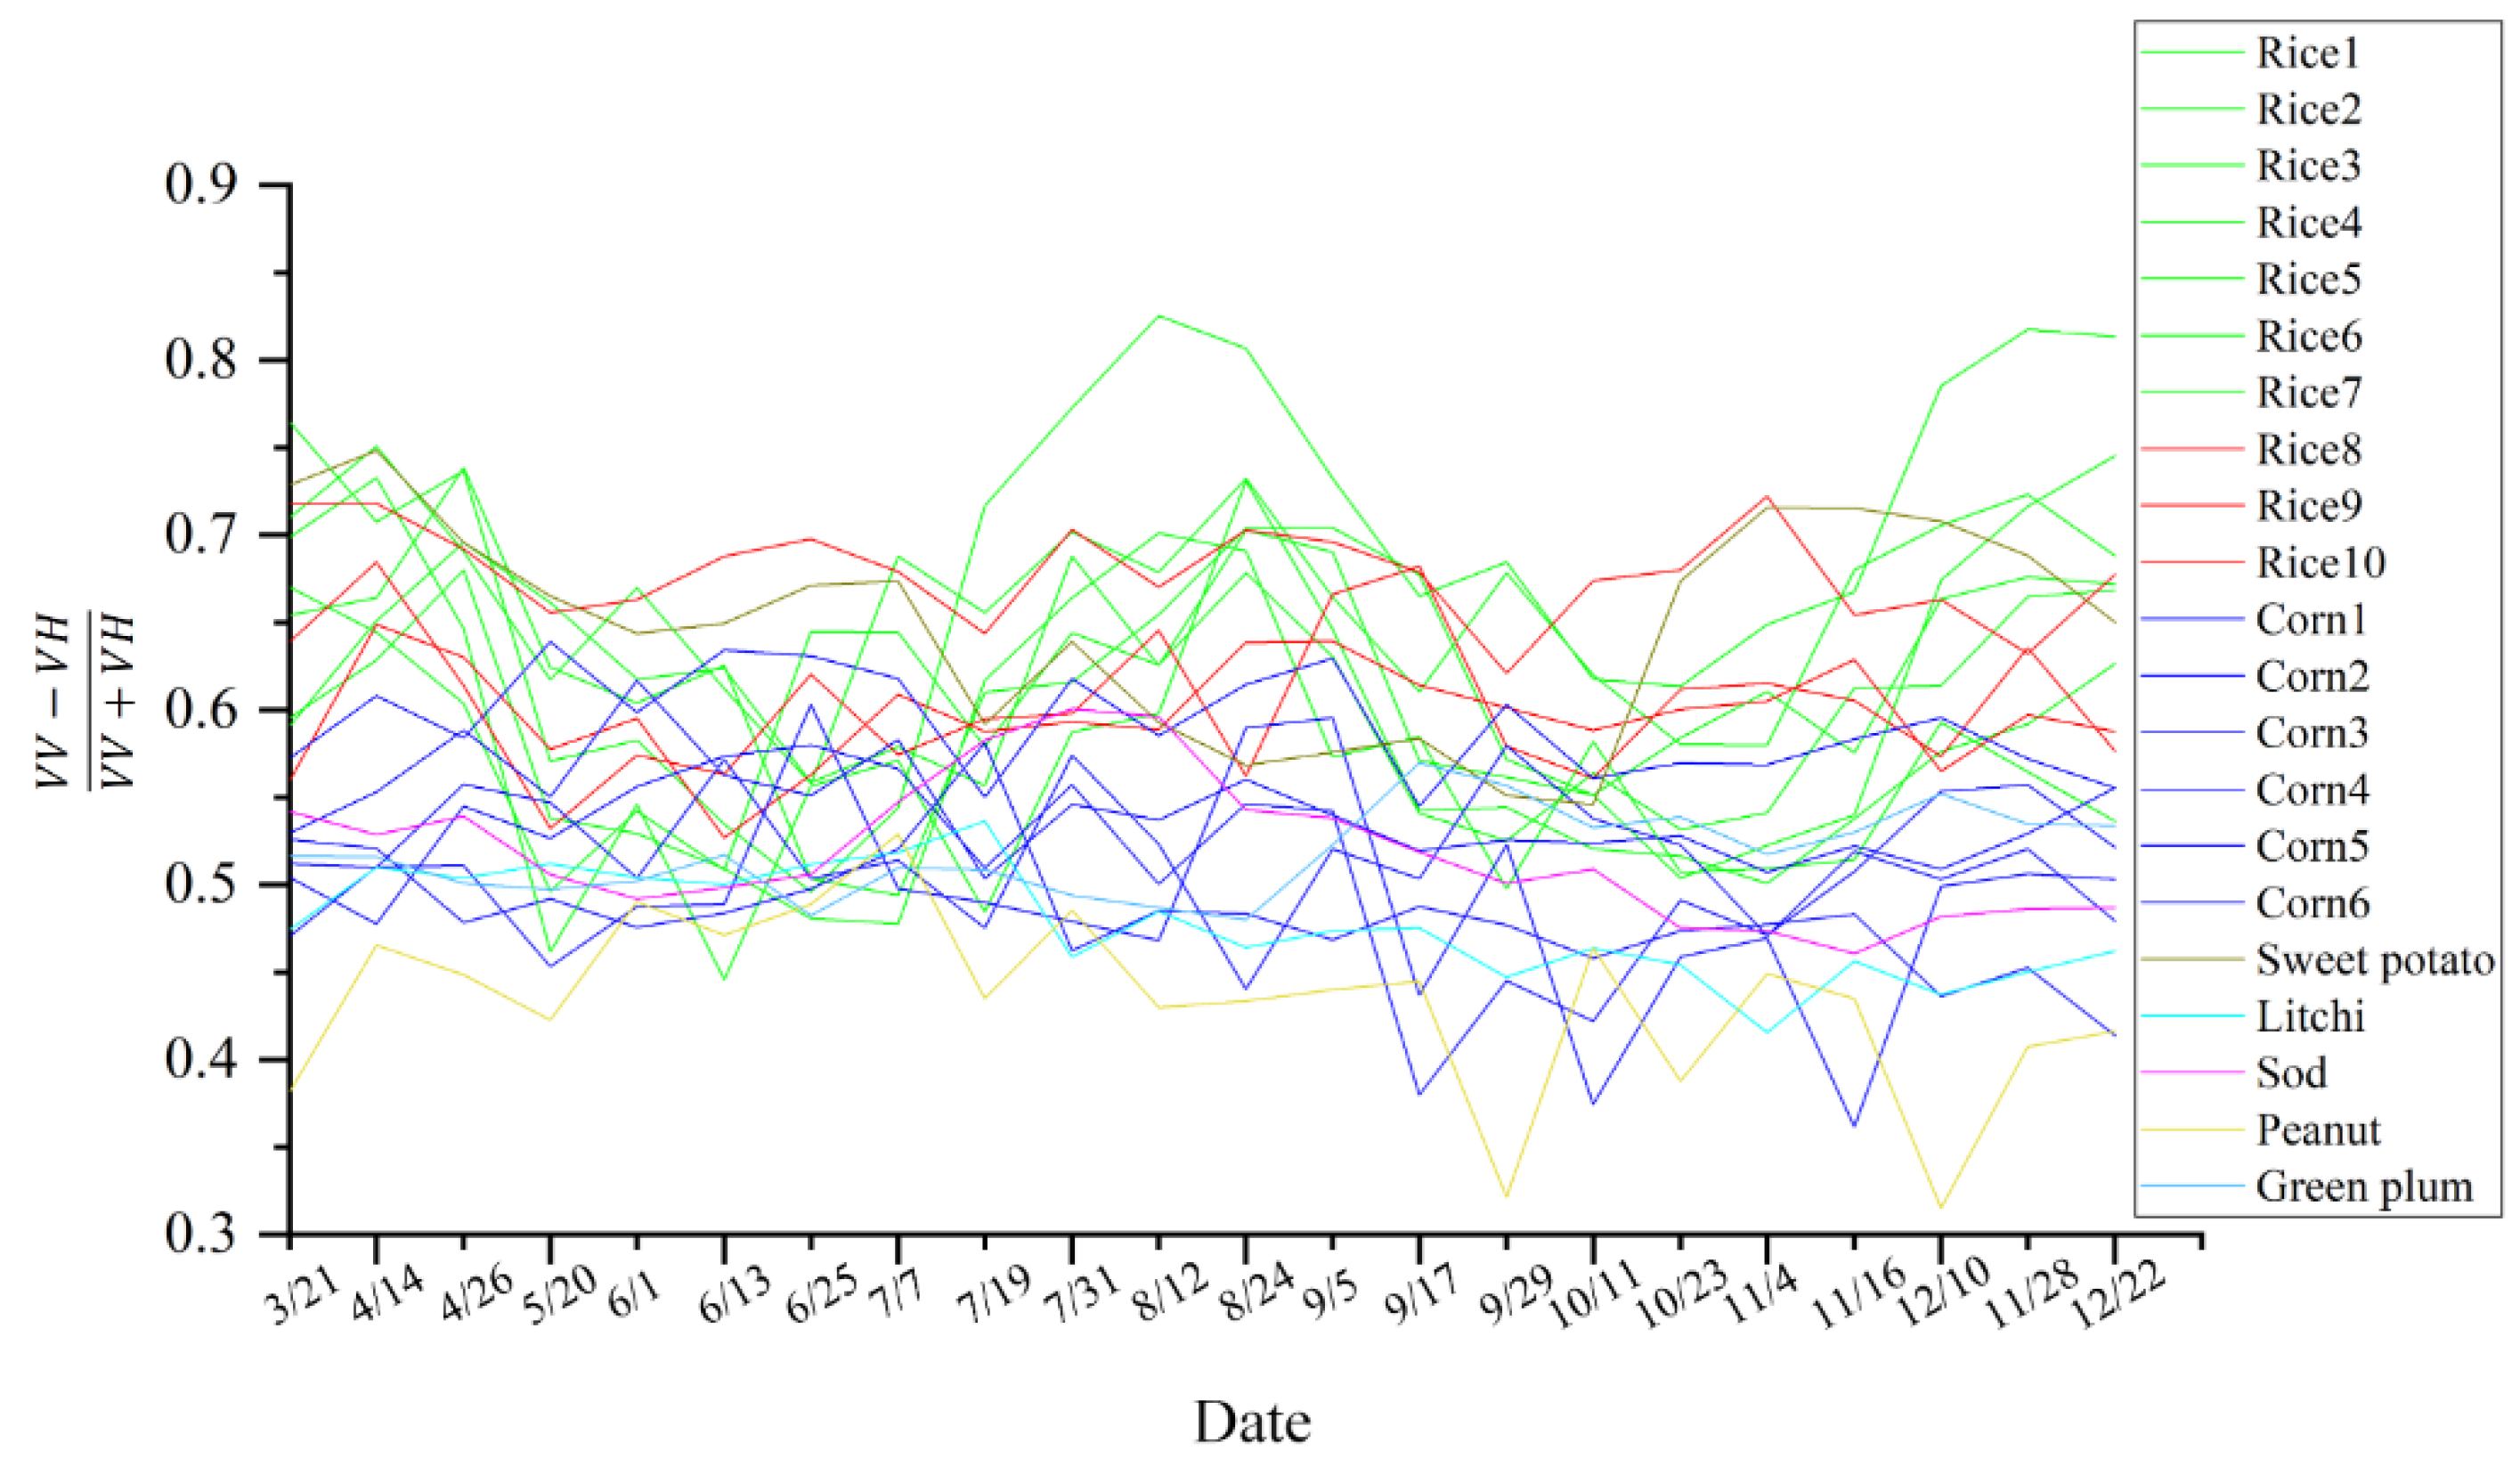
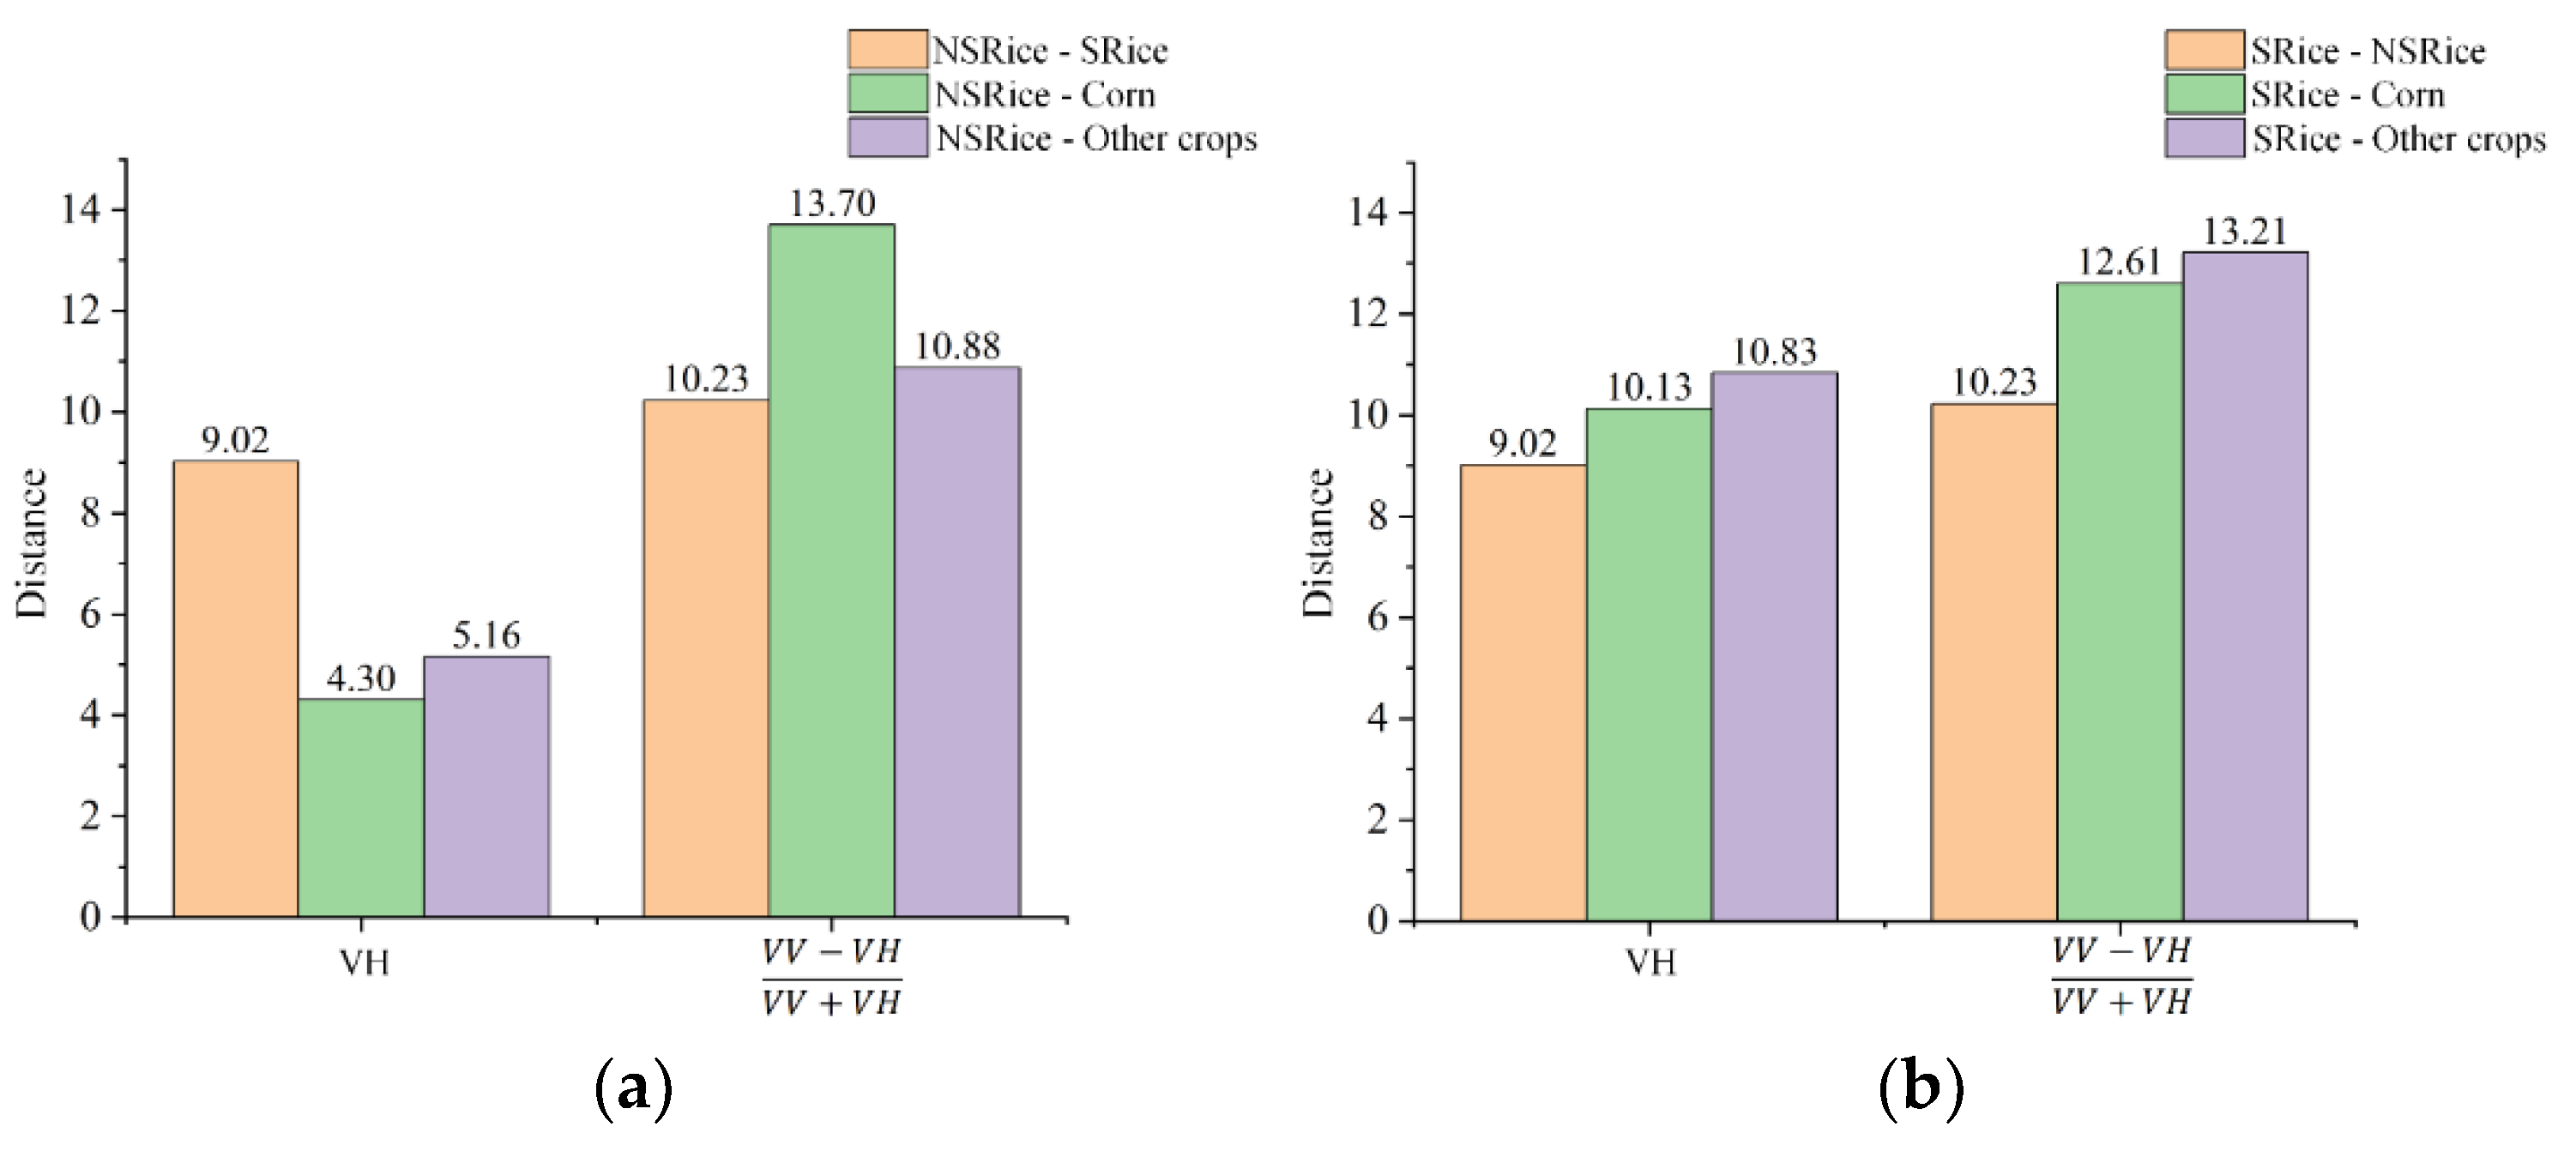
  • This study proposes a new feature combination, (VV − VH)/(VV + VH) feature combination, which can increase the difference between rice and non-rice crops in tropical or subtropical hilly areas.
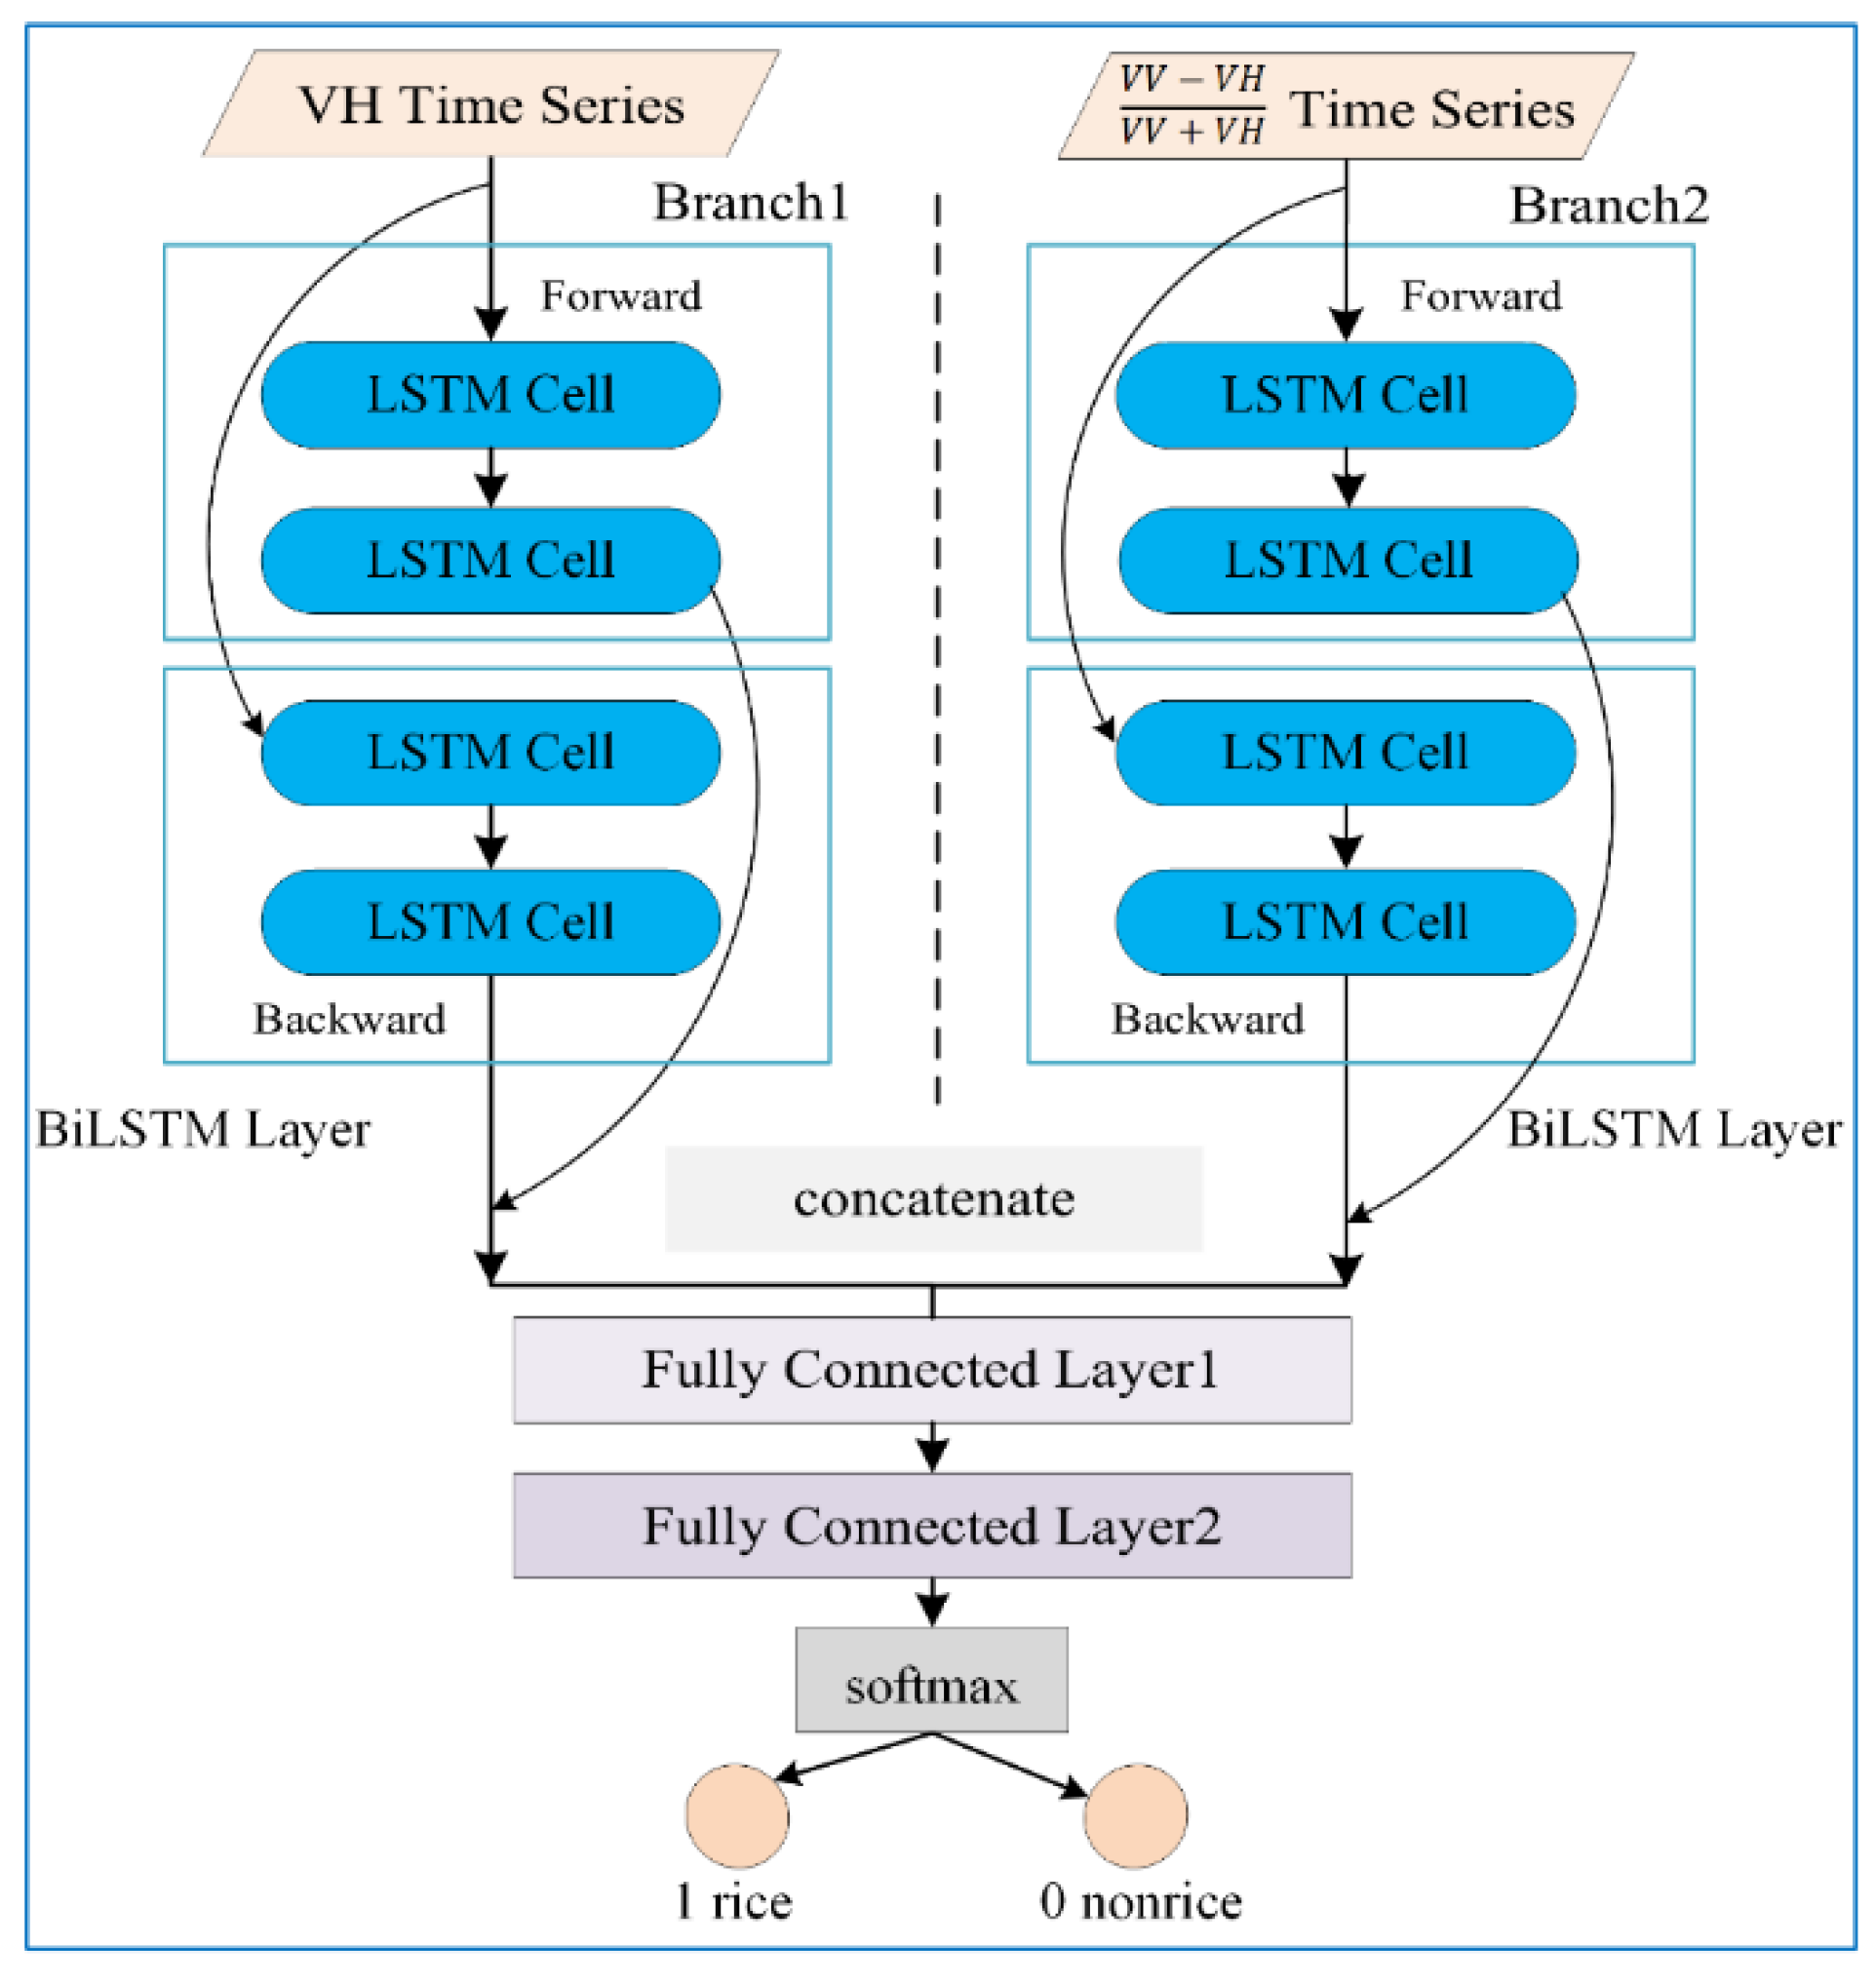
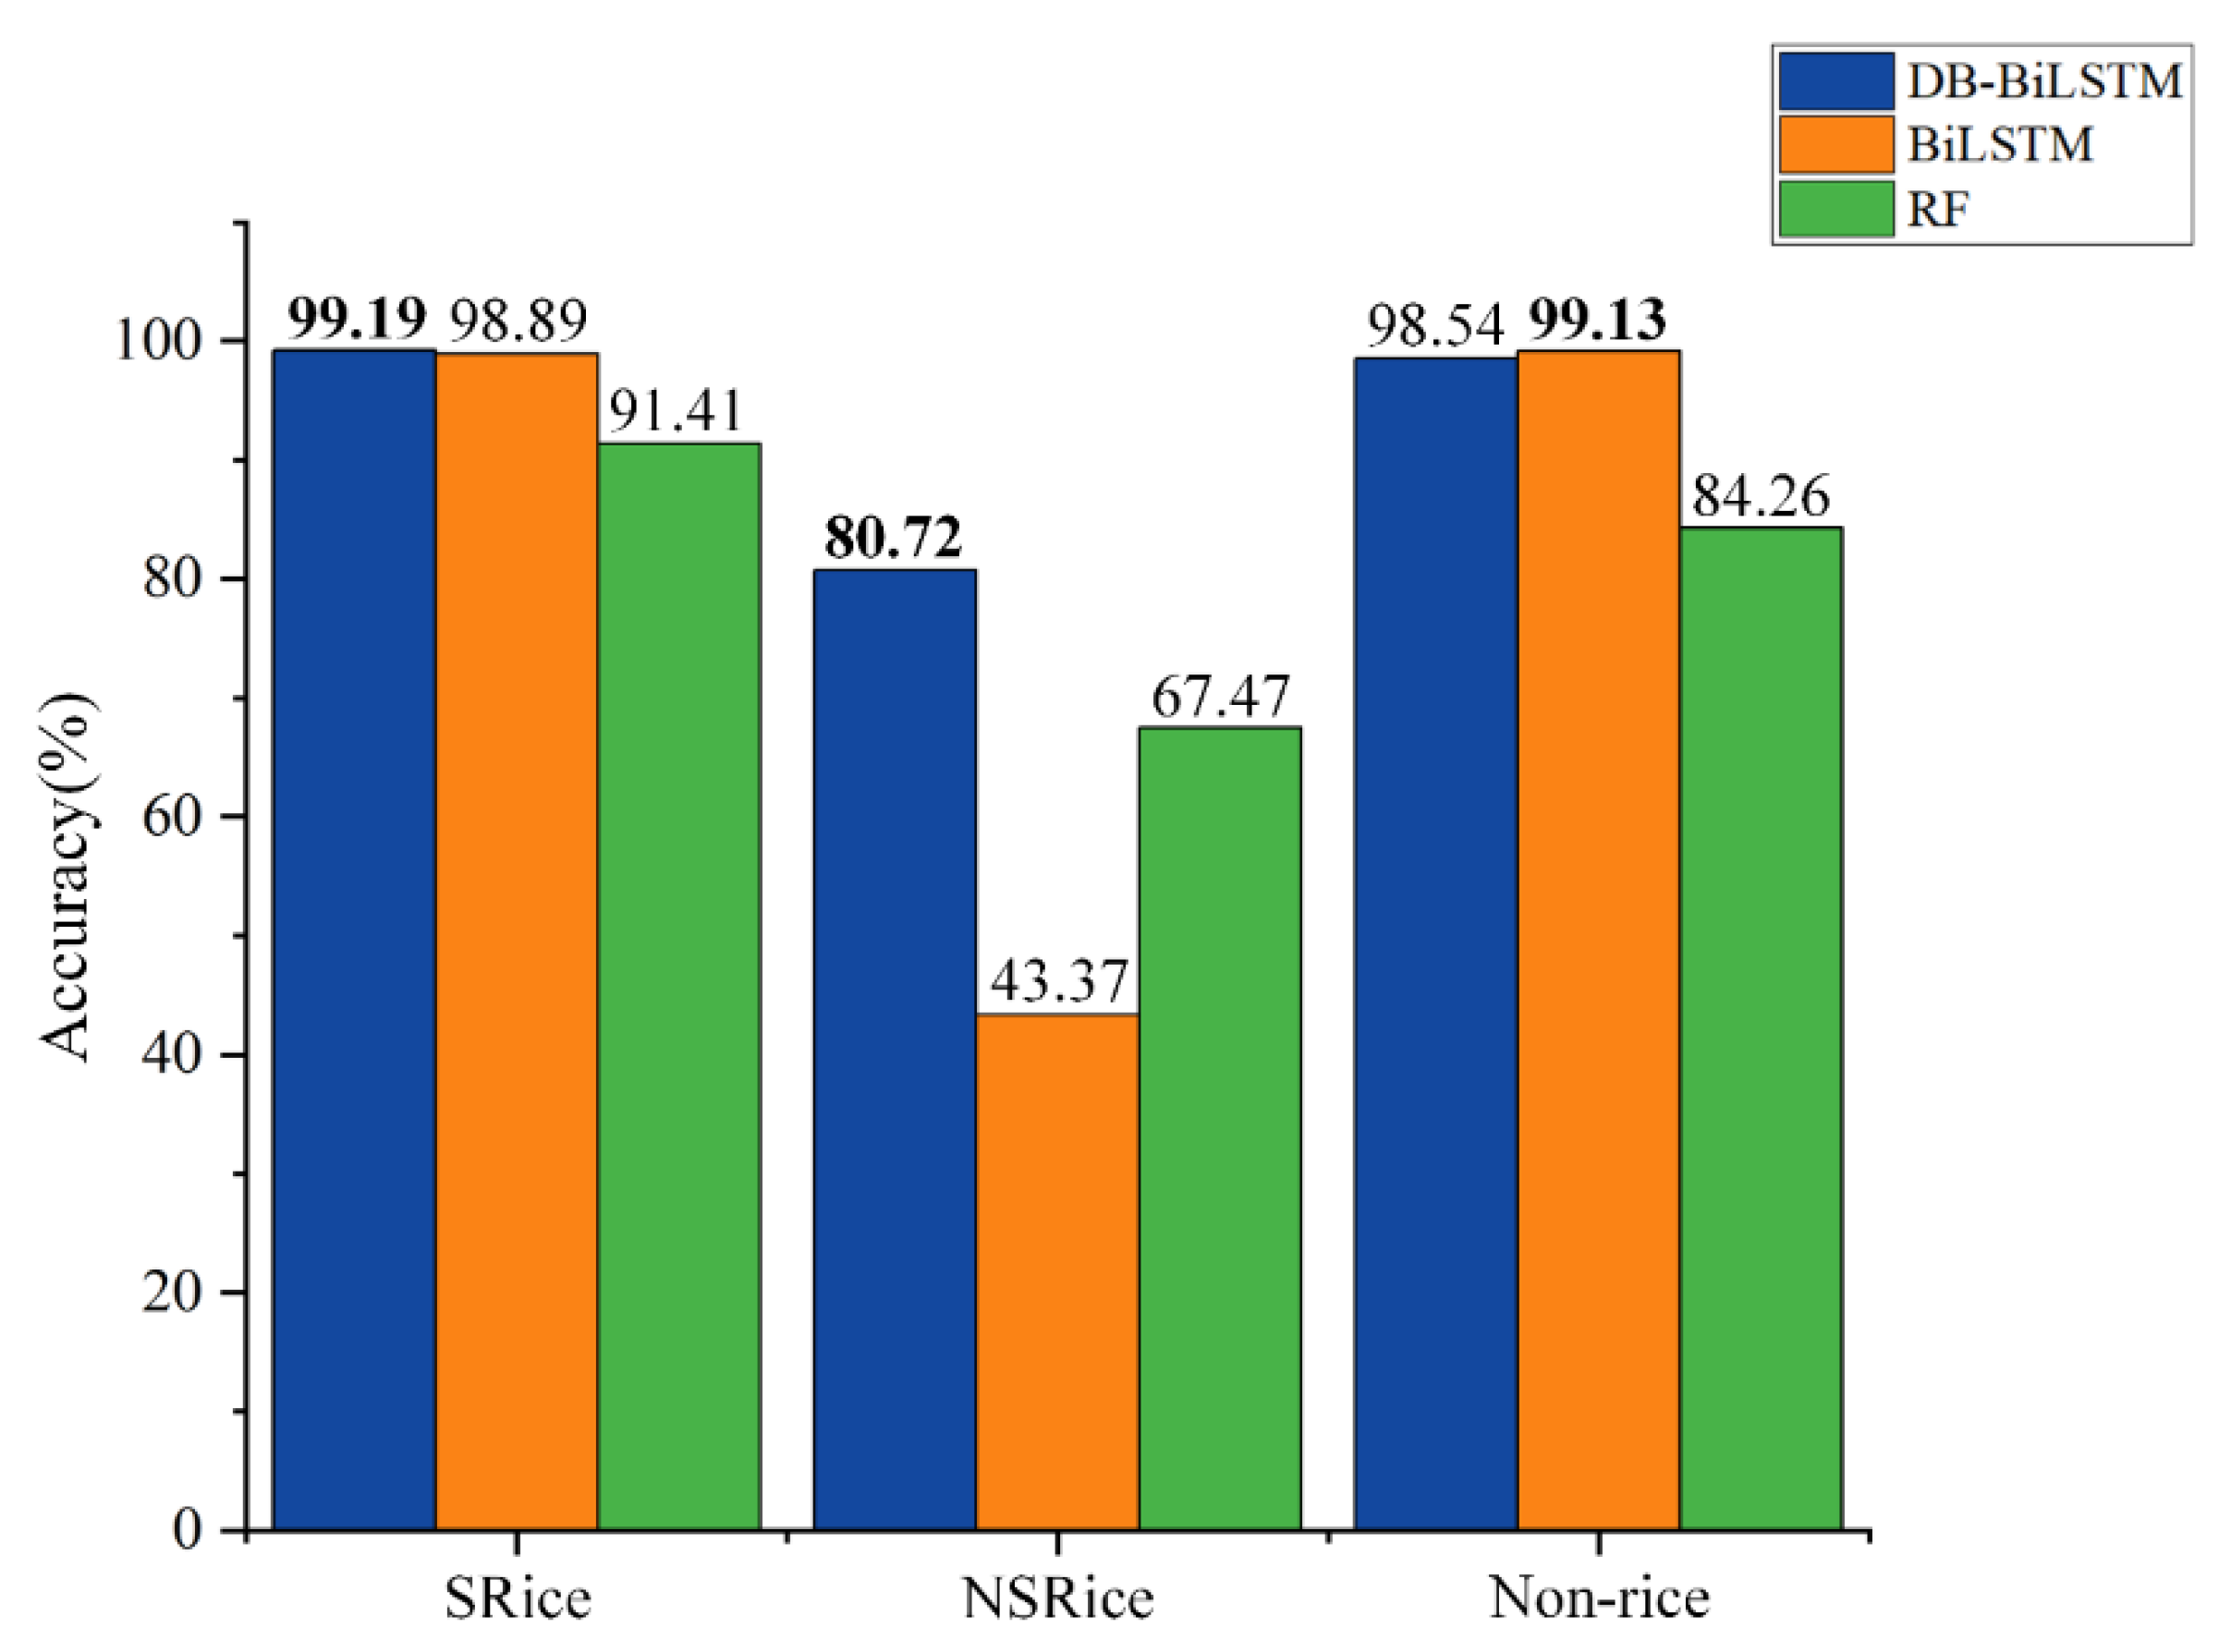
  • A dual branch BiLSTM network (DB-BiLSTM) is designed, which can ensure the independent learning of multiple features and realize the effective combination of (VV − VH)/(VV + VH) and VH polarization features.
The remainder of this paper is organized as follows. Section 2 describes the study area and experimental data and presents the structural details of the proposed method. Section 3 shows the experimental results. Section 4 discusses the advantages of this study. Finally, Section 5 reviews the primary findings of this study.

2. Materials and Methods
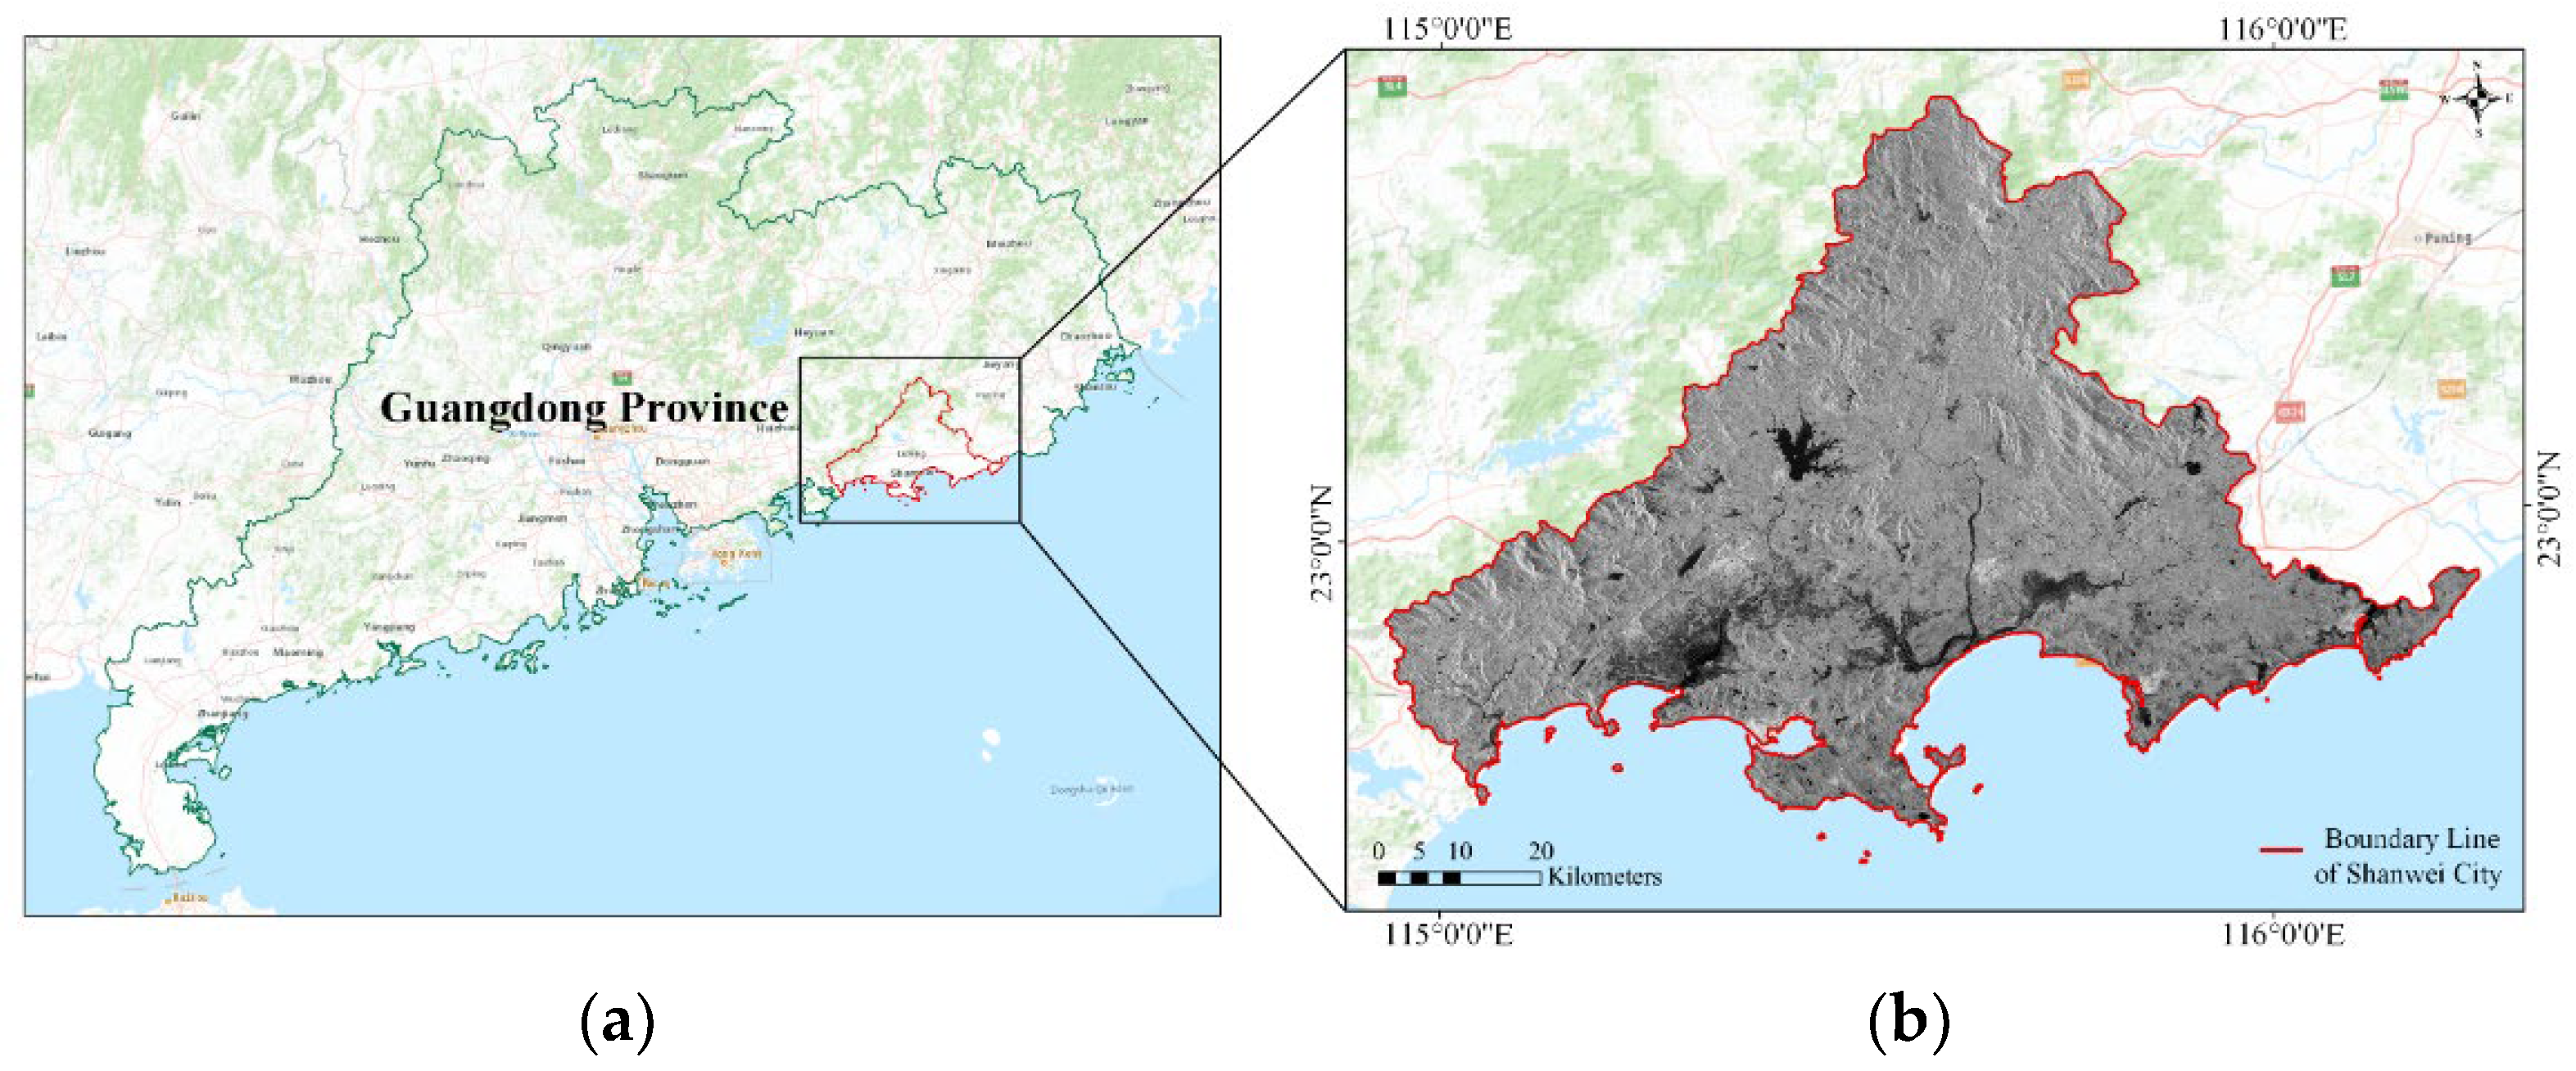
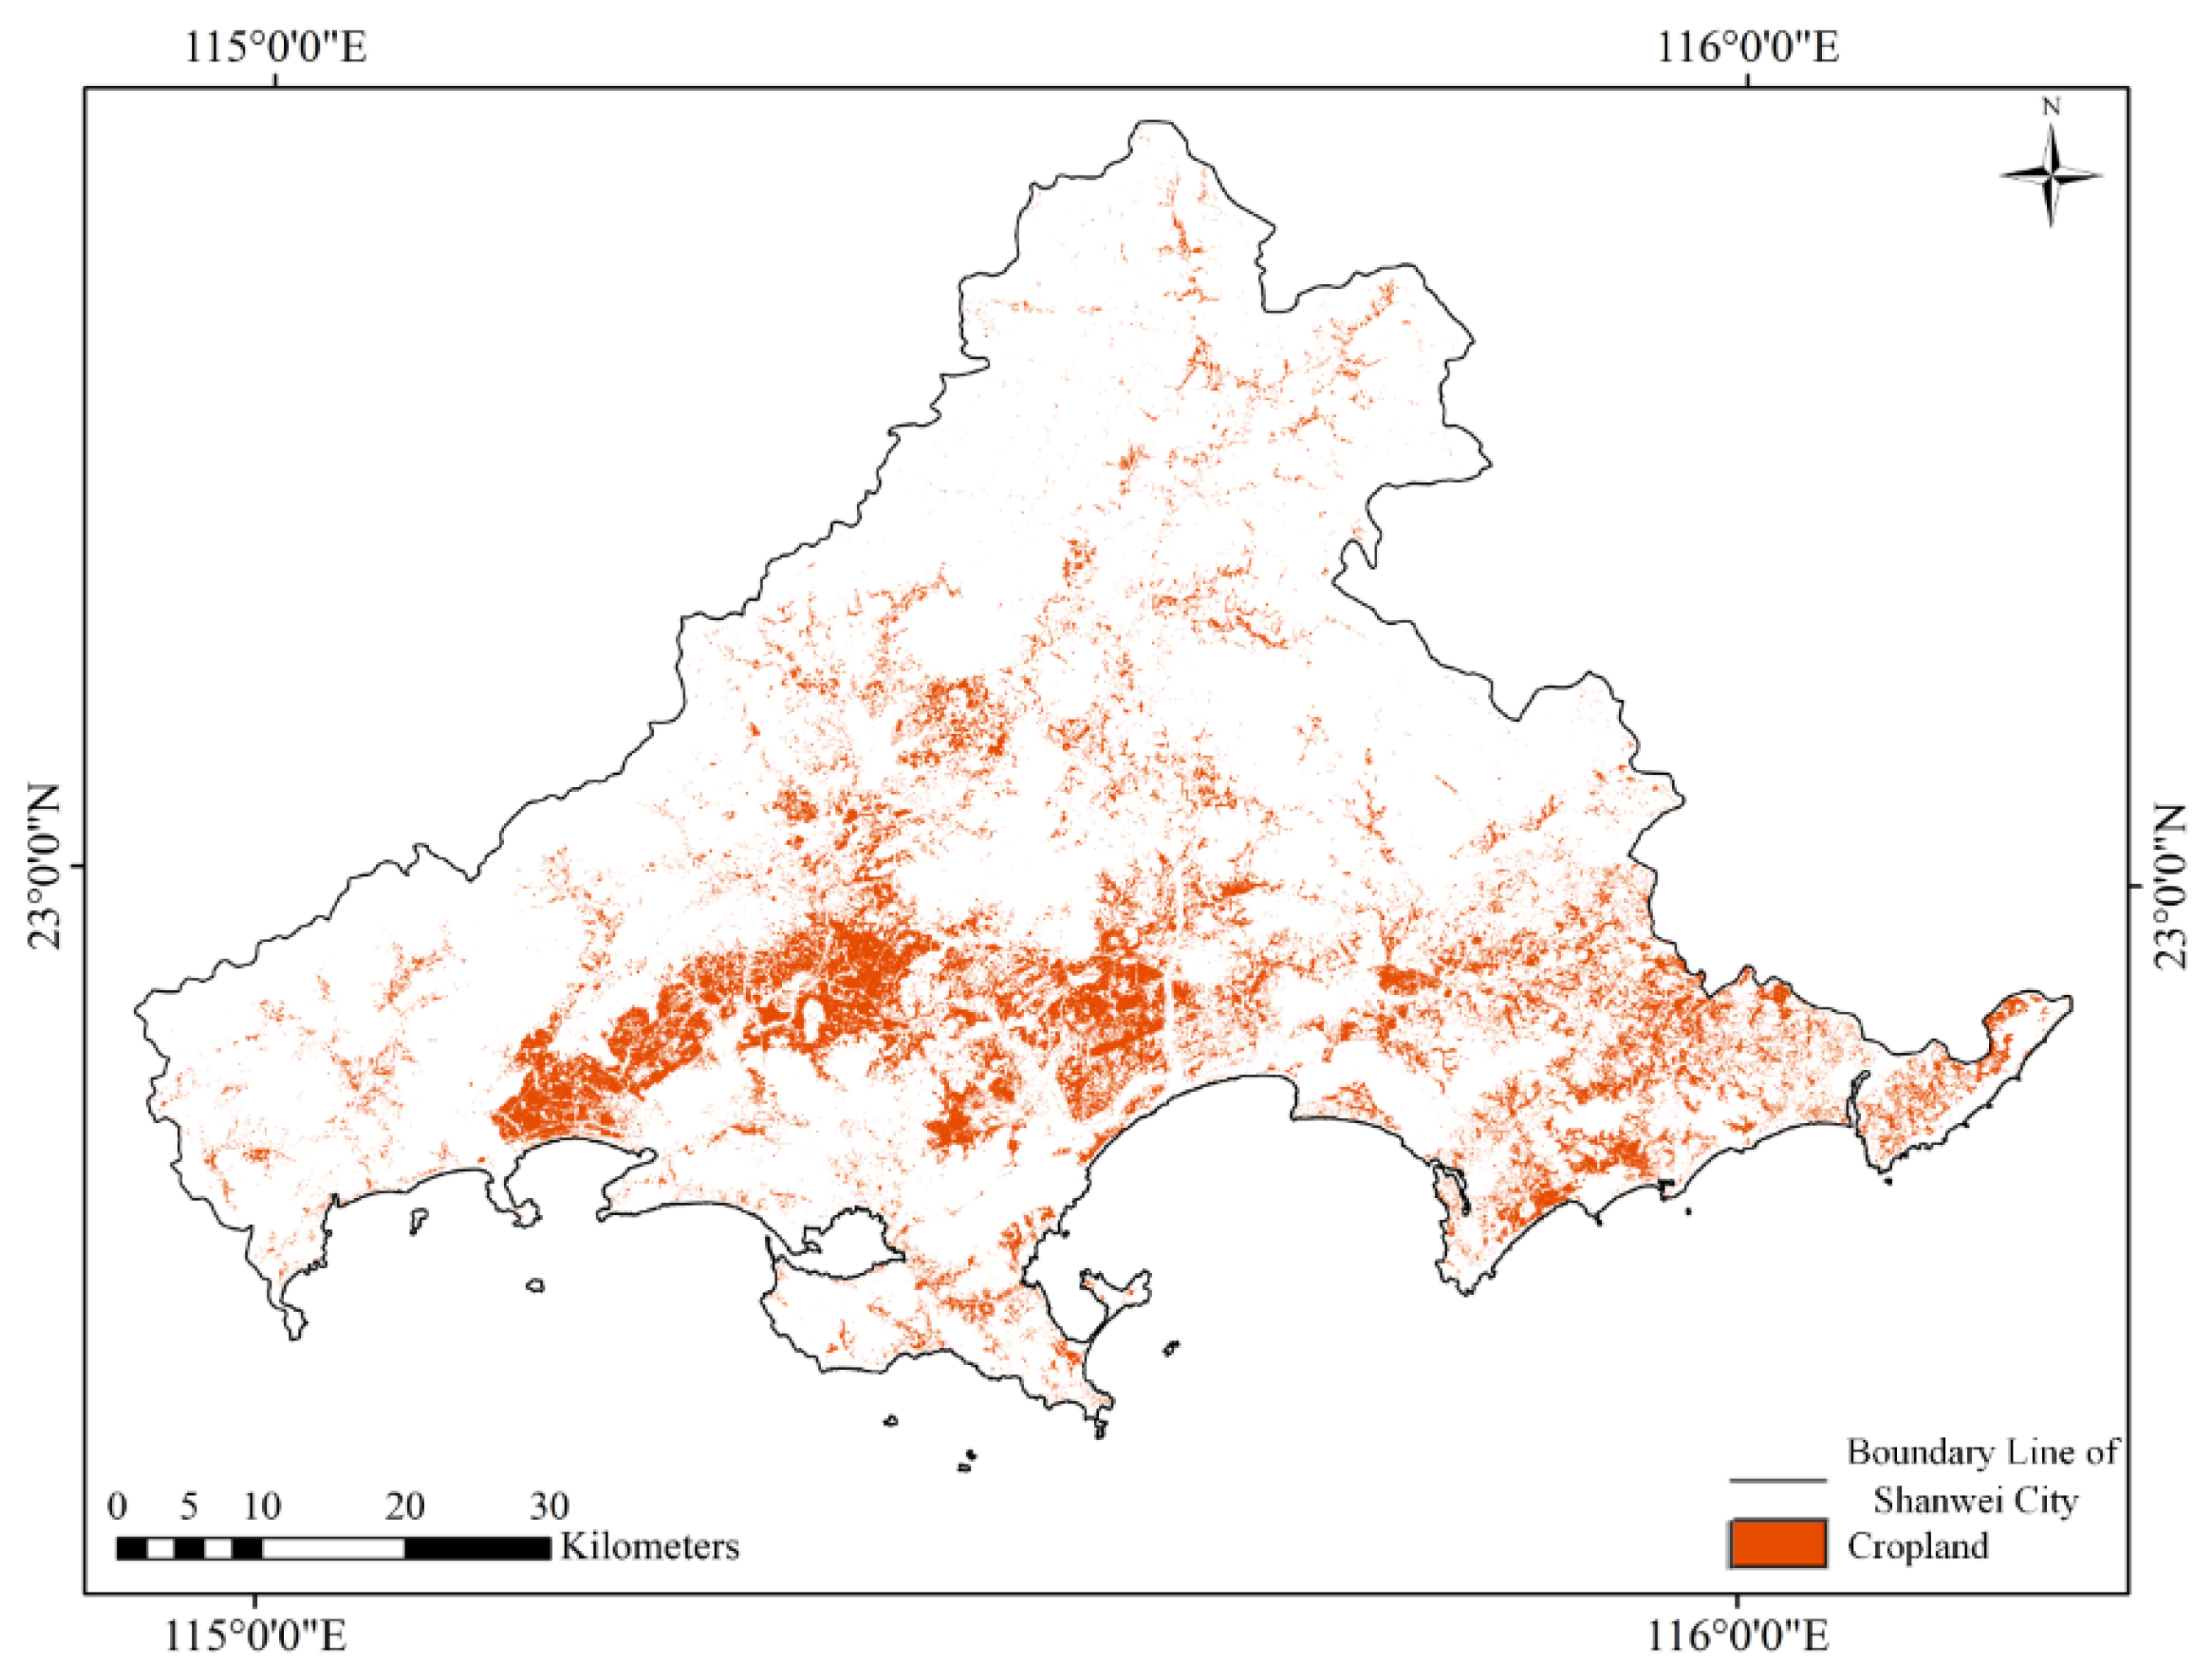
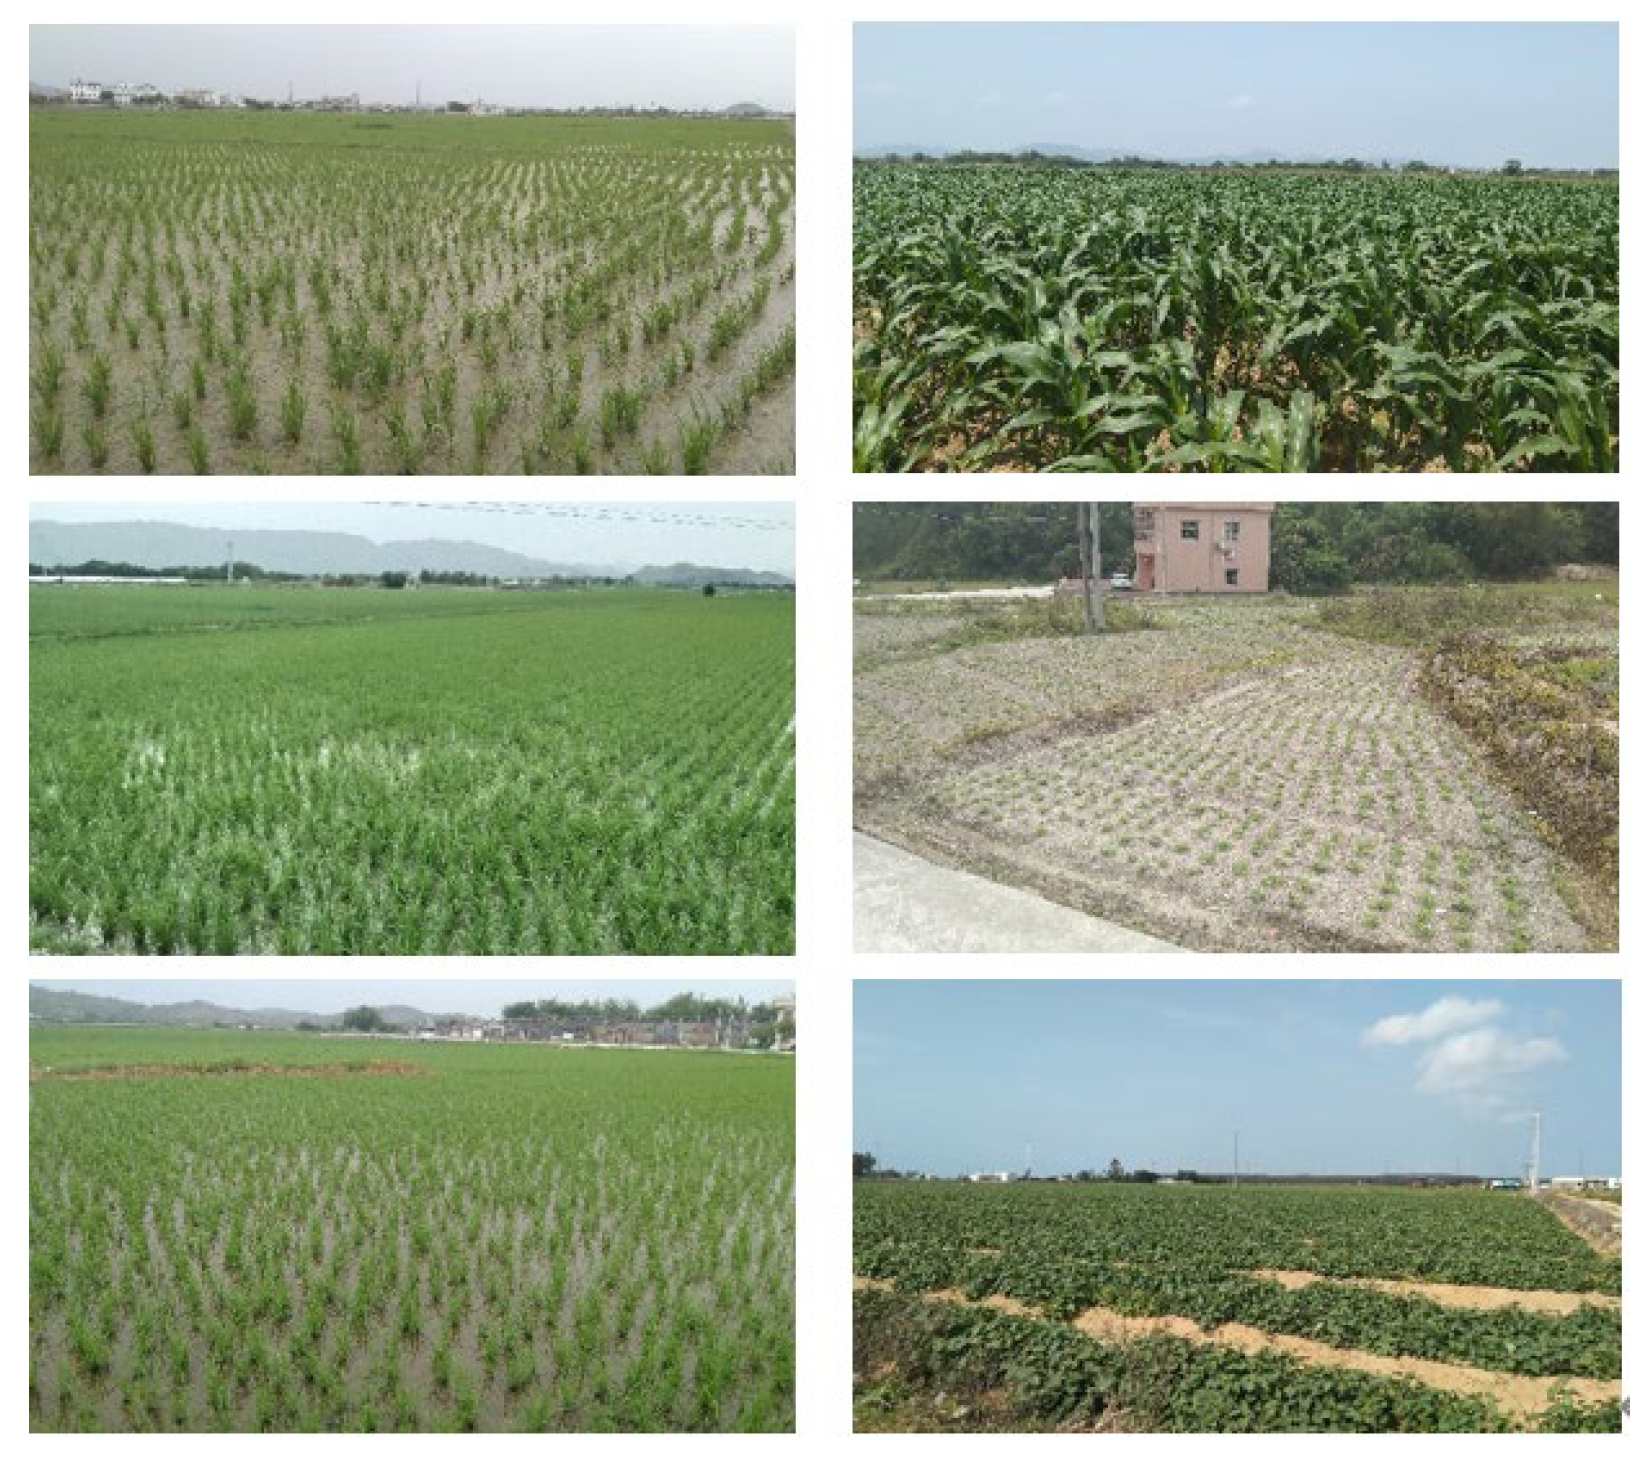
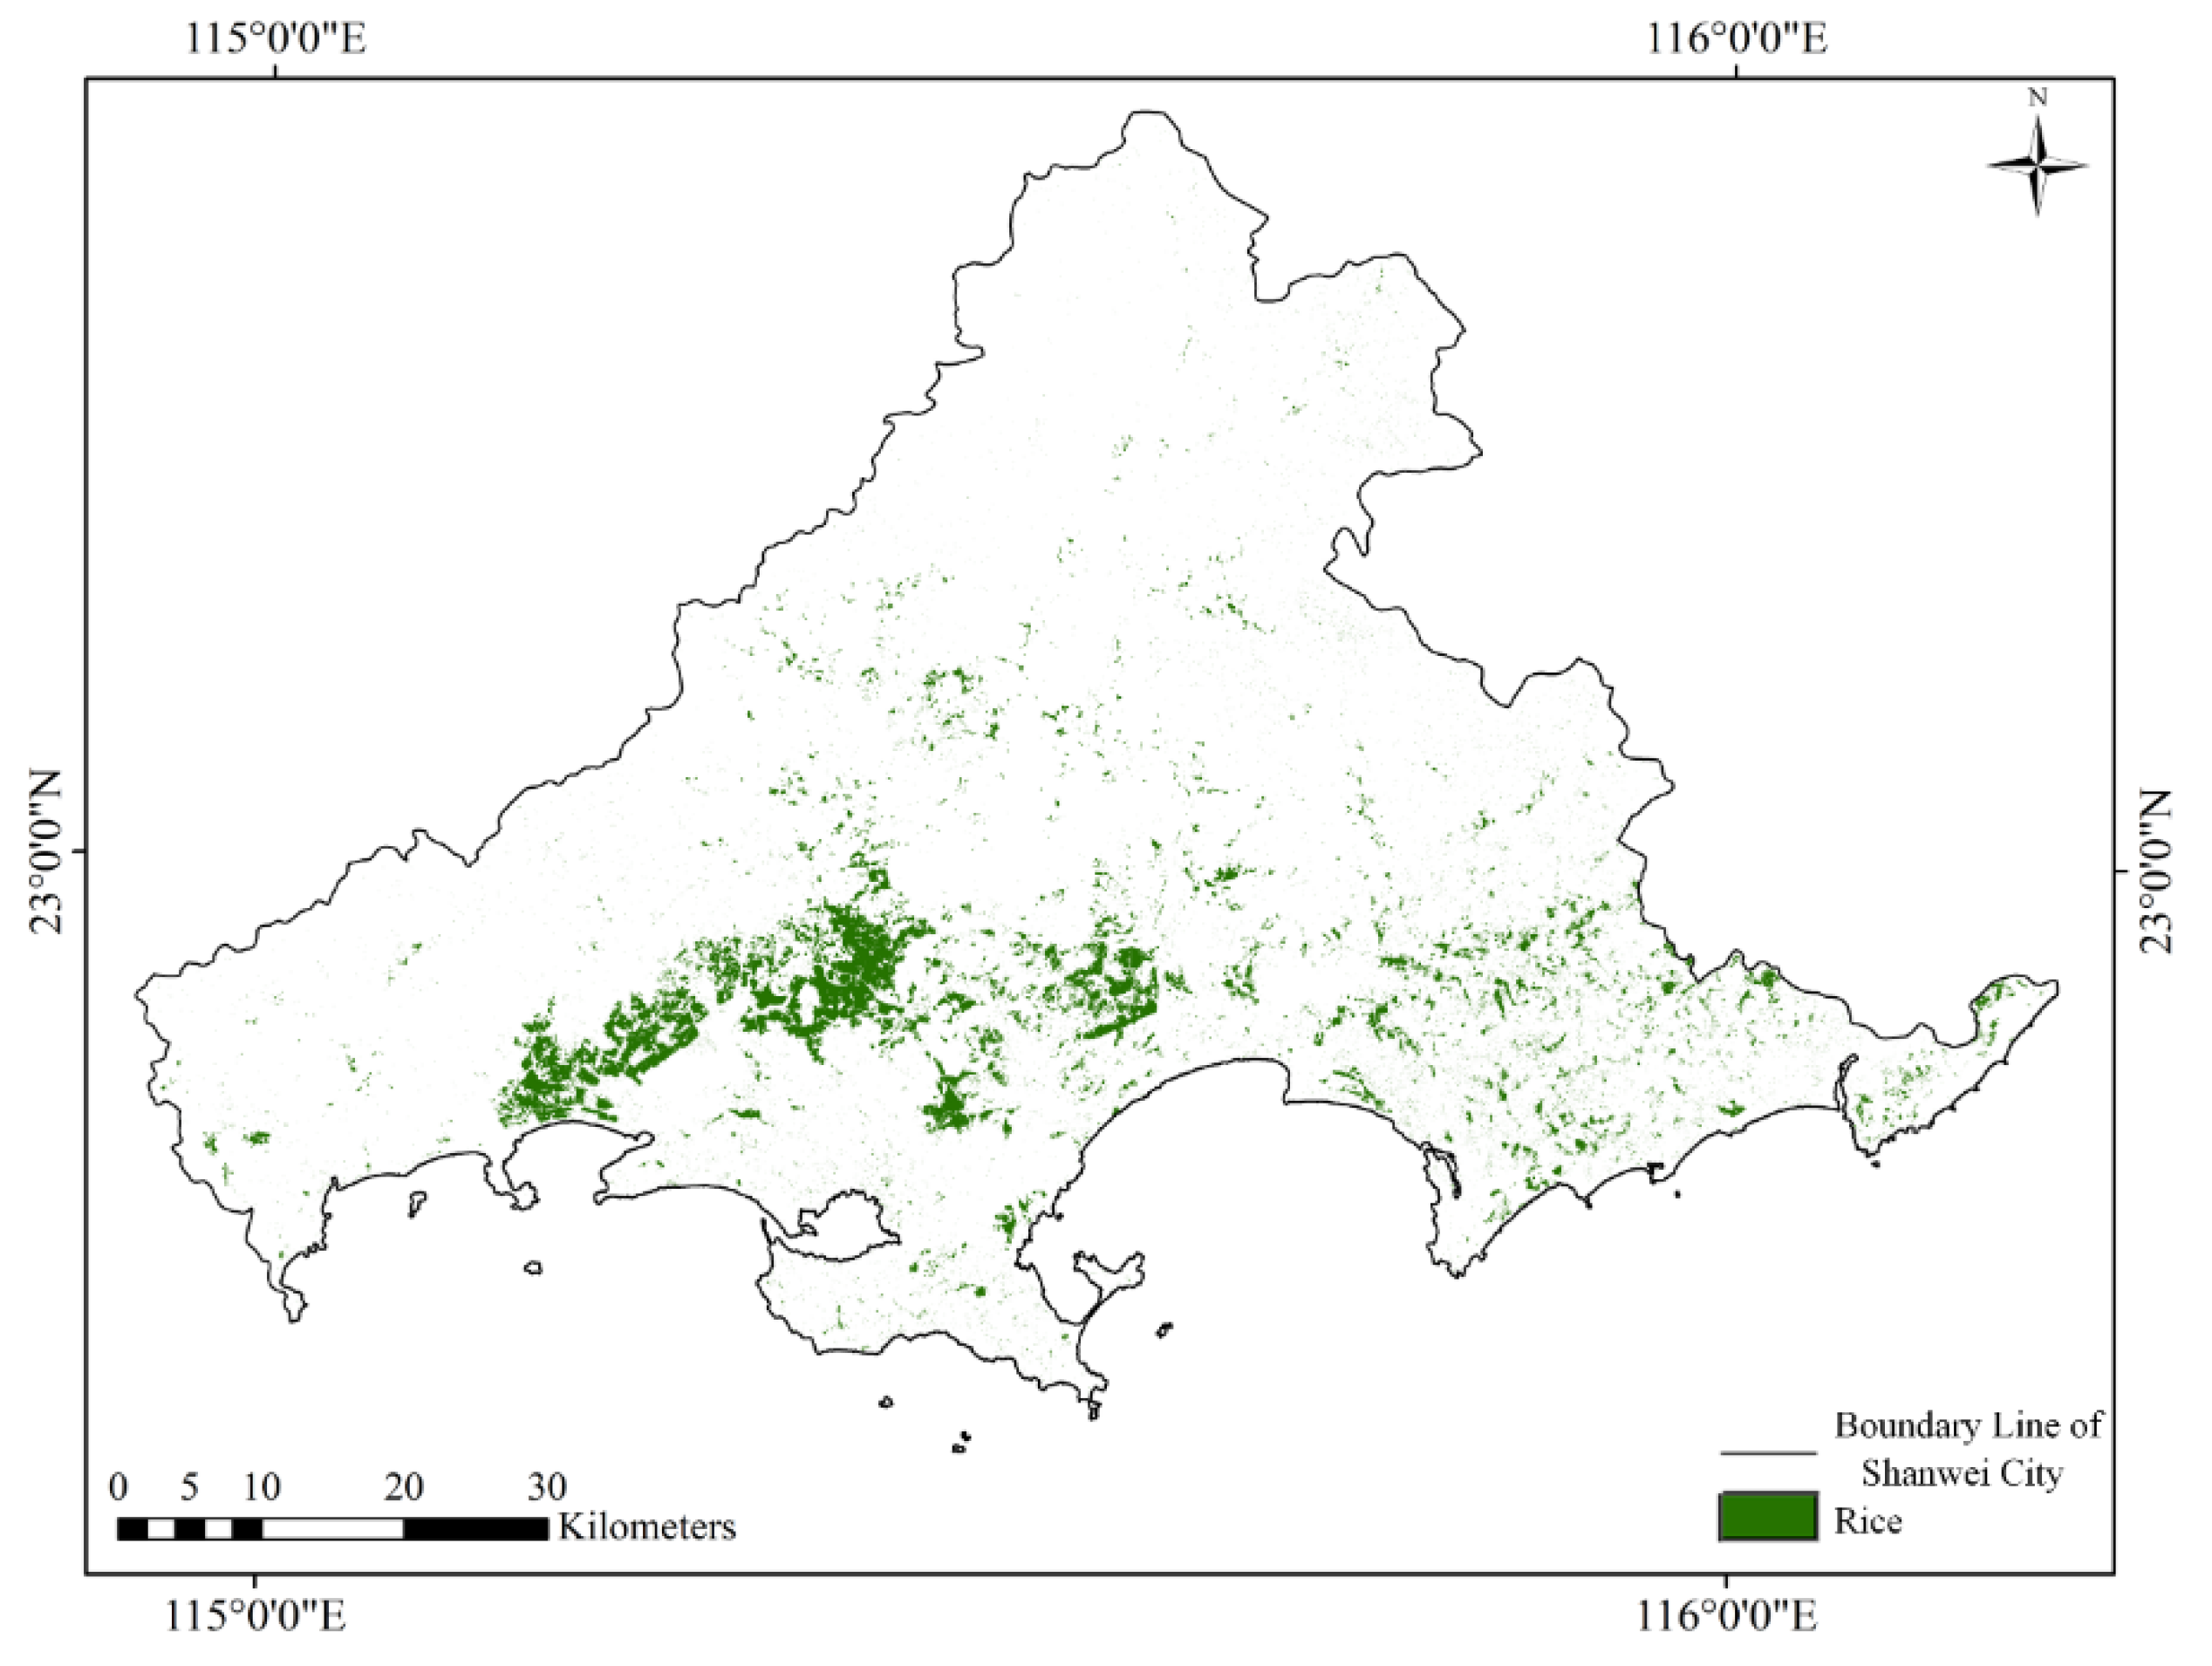
2.1. Study Area

The study area was located in the city of Shanwei, Guangdong Province, China (114°54′W–116°13′24″W, 22°37′40″N–23°38′35″N), as shown in Figure 1. Shanwei is located on the southeastern coast of mainland China, with a total area of 4865.05 km2. Shanwei belongs to the southern subtropical monsoon climate zone and has a typical oceanic climate and abundant light, heat and water resources. Mountainous terrain covers 43.7% of the total area. Hills and mountains are dominant in the northern part of Shaiwei; the middle region is primarily composed of both hills and plateaus; on the southern coast, plateaus and plains are present. The primary food crops in Shanwei are rice, sweet potato, potato and corn. Double-season rice is common in this area; early rice is cultivated from late April to August, and late rice is cultivated from the end of July to December.

2.2. Experimental Data and Sample Dataset

Corresponding to the rice phenology of the study area, all Sentinel-1 VV and VH polarized SAR images [44] from March to December 2019 were acquired and selected, and the data list is shown in Table 1.
To collect reliable rice samples for feature analysis and model training, 21 regions were investigated through field research. The croplands in some areas are shown in Figure 2.
According to the field data, the sample sets were separated into rice and non-rice. The temporal variation characteristics of different fields were discussed and summarized, and the sample set was supplemented based on the time series analysis of SAR data and the visual inspections of Google Earth optical images. The sample set was then divided into training and test sets at a ratio of 8:2; the former was used for model training, and the latter was used for validation. The information of the sample set is given in Table 2.

2.3. Methods

Using Sentinel-1 time series data, the flow chart of the proposed new rice mapping method is shown in Figure 3.
First, the multitemporal intensity images are generated using the SLC data and the precision orbit data, registered together, and then temporally and spatially filtered using a De Grandi spatiotemporal filter. Intensity images are calibrated to sigma zero ( σ 0 ) in decibel (dB) scale and geocoded with the SRTM-90 m DEM to generate 20 m resolution images under WGS84 UTM 49 N projection.
For rice detection, water bodies will confuse the flood signal of rice, and buildings and roads may lead to false positive results. Using high-precision land cover products to generate masks of water bodies and buildings can reduce false alarms to a certain extent, reduce calculation by a certain amount and improve processing speed. The use of masks can eliminate most water bodies, roads and buildings; reduce false alarms to a certain extent; and improve processing speed. WorldCover is a 2020 global land cover product with a resolution of 10 m [45] that is produced by ESA and several scientific research institutions around the world using Sentinel-1 and -2 data. The product includes 11 land cover types, with an overall accuracy of 80.7% in Asia. In this study, WorldCover is used to generate water masks and building masks to remove false positive results.
Then, the backscattering characteristics of these time series data are analyzed, and two characteristic quantities VH backscattering coefficient and (VV − VH)/(VV + VH) are constructed to describe rice in different geographical environments. Both the time series of VH and (VV − VH)/(VV + VH) are input into the designed DB-BiLSTM model to map rice.

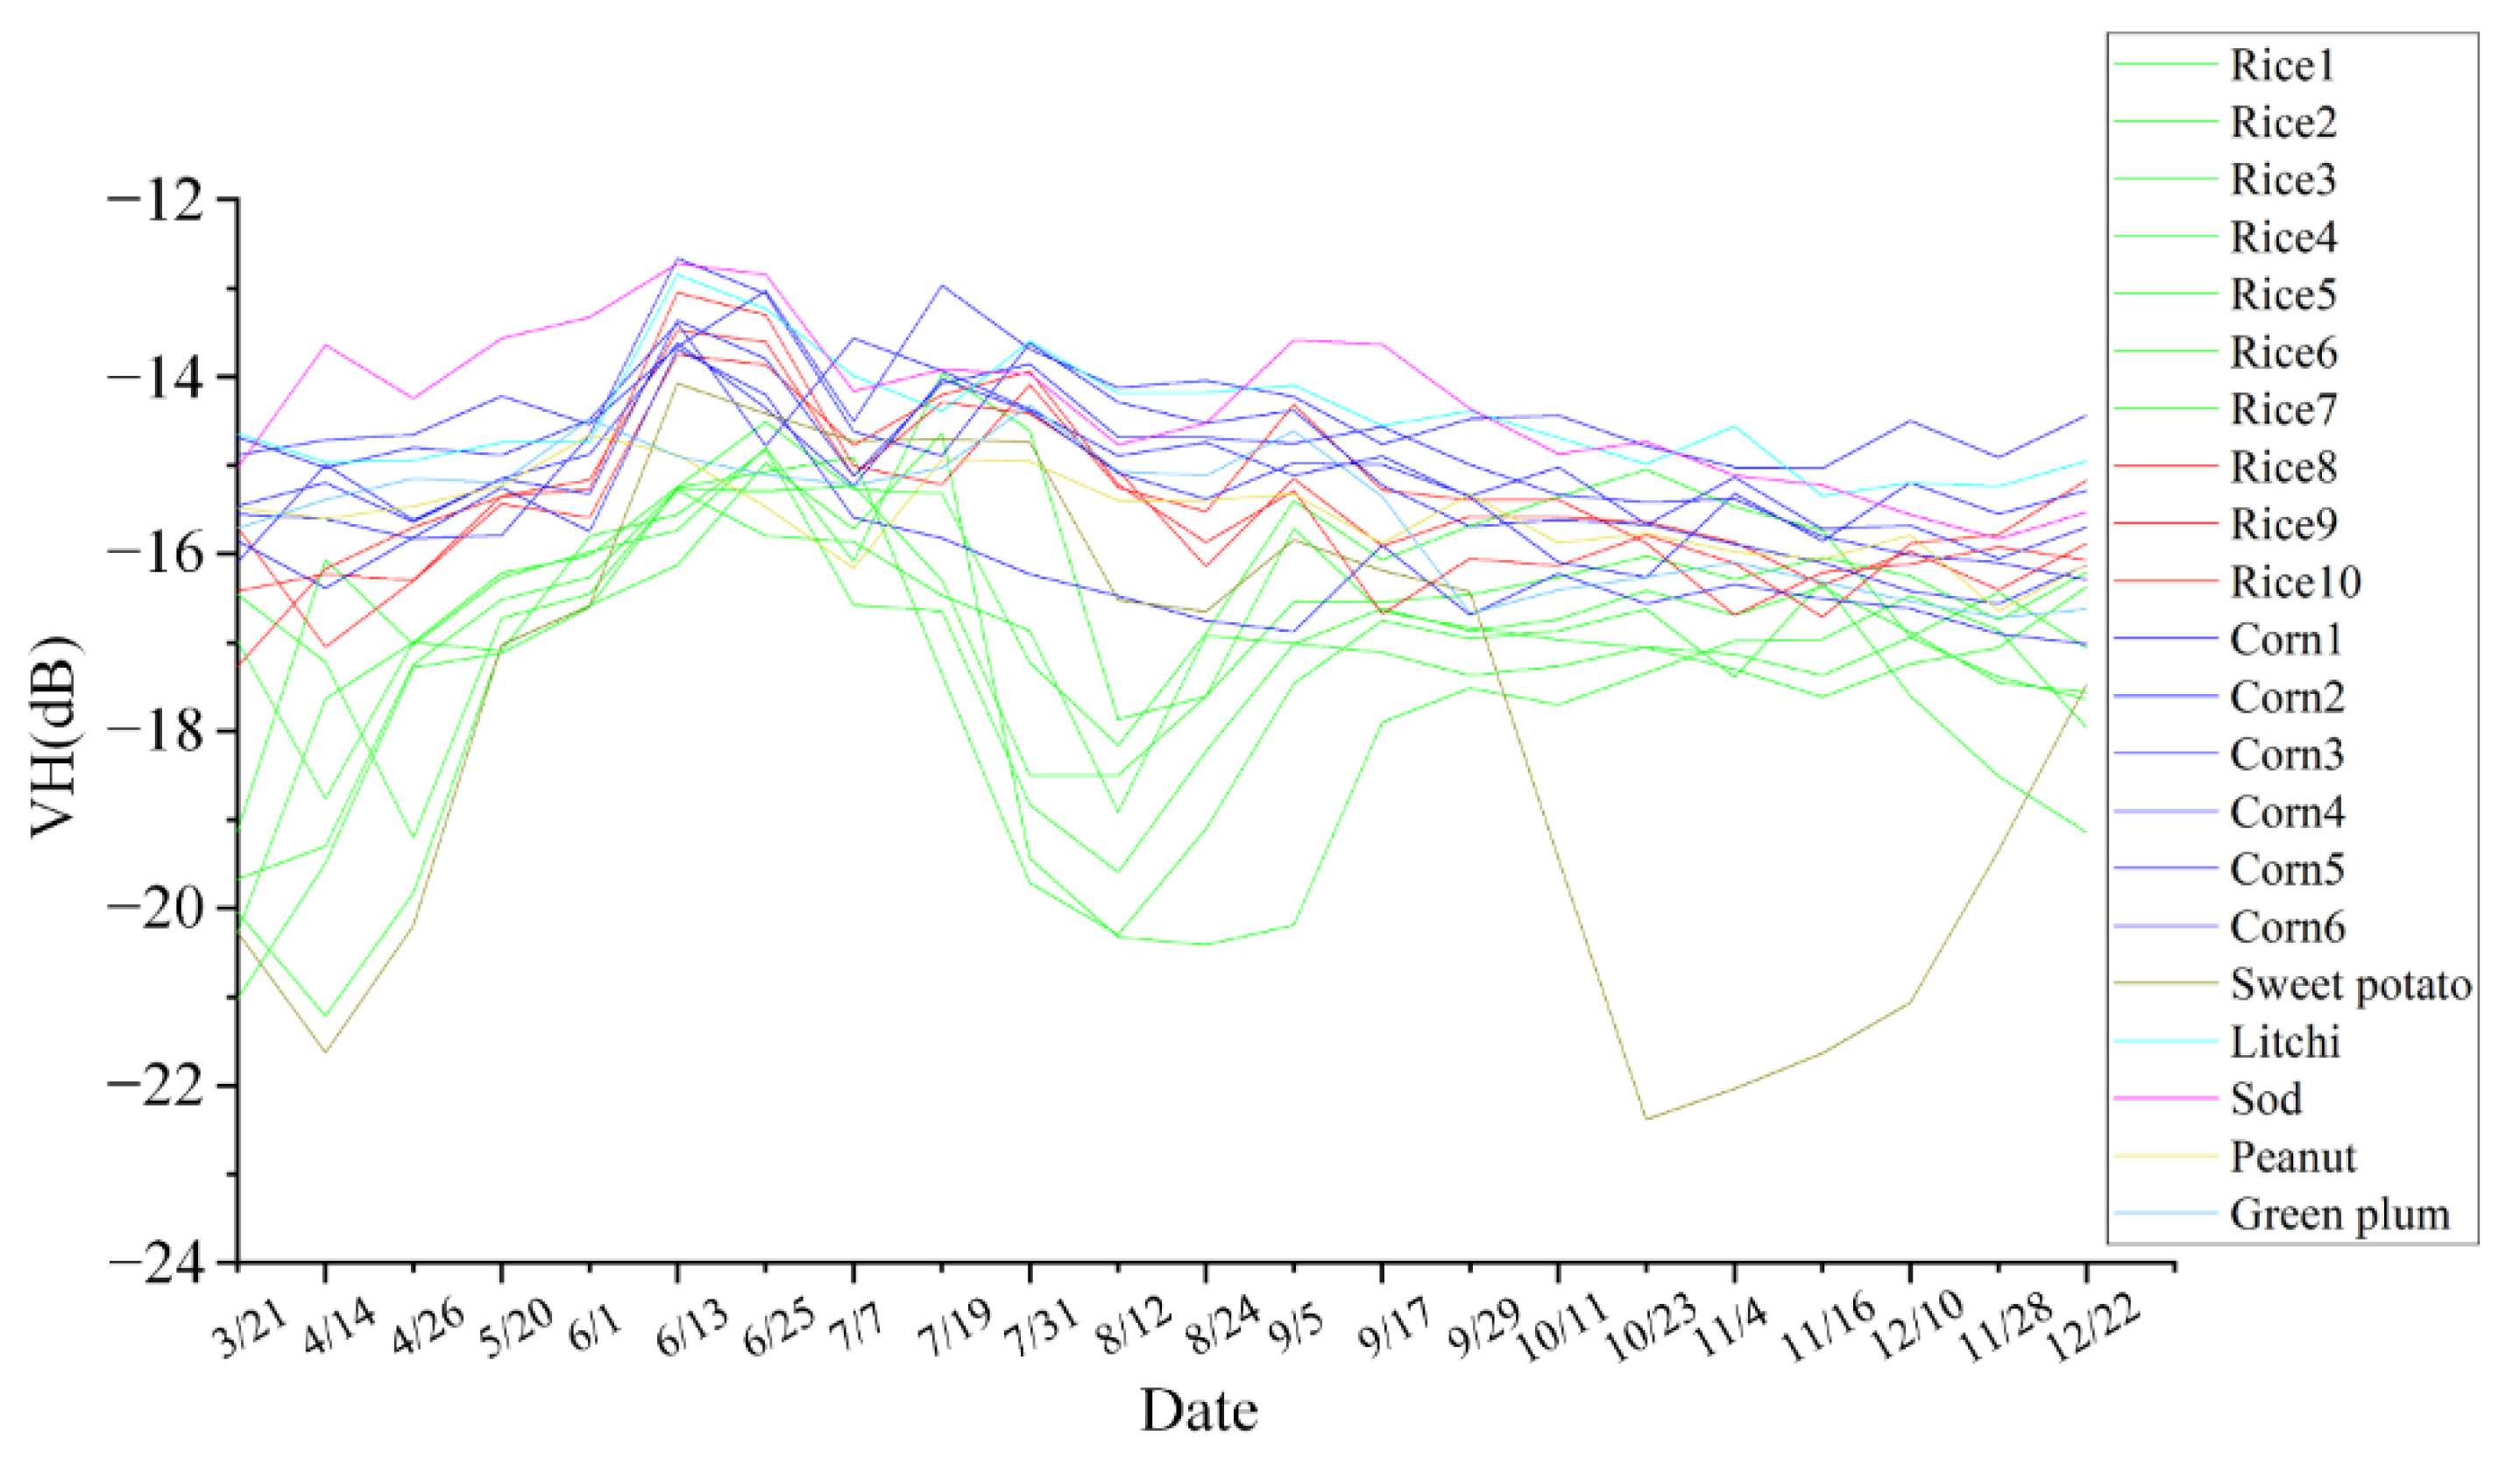
2.3.1. Analysis and Characterization of Scattering Characteristics of Rice

Currently, VH polarization information is the most commonly used feature in rice mapping of SAR data [13,46,47]. The average VH backscattering curve of 21 field survey areas is shown in Figure 4.
The transplanting time of early rice in the study area is approximately April, and the harvest time is approximately the end of July to the beginning of August. The transplanting time of late rice is from the end of July to the beginning of August, and the harvest time is approximately December. Figure 4 shows that there are great differences in the VH time series curves of rice in different planting areas.
Rice areas 1–7 are concentrated rice planting areas with relatively flat terrain. Their time series VH curves show that the backscattering coefficients in early April are low due to the flooding period. With the growth of rice, the backscattering coefficients increase up to their maximum values from the end of June to the beginning of July. After entering the mature stage, the backscattering coefficients begin to decrease. After harvest is completed in early August, the late rice begins to grow. Their curve exhibits the “bell shape” described in [48,49], which is referred to as the “standard rice time series curve” (SRice) in this paper. This type of rice has a marked flooding period signal and can be easily distinguished from other non-rice crops.
Rice areas 8 to 10 are small rice areas scattered in hilly areas. Their VH backscattering coefficients in the flooding period are similar to those of non-rice crops and overlap with the time series curve of corn. In this study, this curve is expressed as the “non-standard rice time series curve” (NSRice). The rice in these areas is difficult to characterize using the VH backscattering coefficient; thus, it is necessary to find a new characteristic parameter.
To identify small rice areas in hilly areas, a new feature is proposed to discriminate rice with non-standard time series curves from other non-rice crops. The proposed feature is defined as:
Feature b a n d _ k ( i , j ) = VV b a n d _ k ( i , j ) VH b a n d _ k ( i , j ) VV b a n d _ k ( i , j ) + VH b a n d _ k ( i , j )
where VV and VH time series data are images with height m , width n and band number c   VV b a n d _ k ( i , j ) is denoted as the pixel in the k th band of the i th row of the j th column of the VV time series data. VH b a n d _ k ( i , j ) is denoted as the pixel in the k th band of the i th row of the j th column of the VH time series data. The proposed feature is an image with height m , width n and band number c . Feature b a n d _ k ( i , j ) is denoted as the pixel in the k th band of the i th row of the j th column of the proposed feature. i = 1 , 2 , , m , j = 1 , 2 , , n and k = 1 , 2 , , c .
Figure 5 shows the average time series curve of (VV − VH)/(VV + VH) for 21 field survey plots. Compared with the time series data of VH polarization, the red curves (rice 8–rice 10) show better separability compared with non-rice crops. Specifically, the nonstandard rice time series curves were primarily distributed above the time series curves of non-rice crops, particularly during April and from August to December, reducing the confusion between rice 8–10 and corn compared to the VH polarization. The feature values of non-rice crops were generally low, and the time series curves were located below those of rice plots with only a small proportion of overlapping.
To explore the separability of the proposed feature, the morphological similarity distances of crop time series curves in VH polarization and the combined feature (VV − VH)/(VV + VH) were calculated. The morphological similarity distance [50] is defined based on the classical Euclidean distance, considers the specific distribution differences of each dimension of the features and measures the similarity by combining size and shape factors. The p   n −dimensional data L i = ( l i 1 , l i n ) T and L j = ( l j 1 , l j n ) T , i , j = 1 , 2 , , p , and the morphological similarity distances of L i and L j are defined as:
D M S D = D E u c l i d × ( 2 A S D / S A D )
where D M S D is the morphological similarity distance between L i and L j ; D E u c l i d is the Euclidean distance between L i and L j ; SAD is the Manhattan distance between L i and L j ; and ASD is the absolute value of the sum of all dimensional difference values between L i and L j :
D M S D ( L i , L j ) = k = 1 n ( l i k l j k ) 2 × ( 2 | k = 1 n ( l i k l j k ) | k = 1 n | l i k l j k | ) .
A greater distance of morphological similarity indicates less similarity between two compared features. Figure 6 shows the morphological similarity distances of NSRice and SRice with other classes.
Figure 6a shows that the morphological similarity distances between NSRice and non-rice crops are less than that between NSRice and SRice in VH polarization. NSRice and non-rice crops shared a relatively high similarity in VH polarization, which is also consistent with Figure 4. Under the characteristics of (VV − VH)/(VV + VH), the morphological similarity distances between NSRice and non-rice crops are markedly higher, even more than that between NSRice and SRice; thus, with the characteristics of (VV − VH)/(VV + VH), NSRrice is different from other crops, making it easier to distinguish them. In Figure 6b, similar improvements are also observed for SRice; the morphological similarity distances calculated by (VV − VH)/(VV + VH) are marginally larger than the VH polarization and are higher than those between SRice and NSRice. These facts demonstrate that the proposed (VV − VH)/(VV + VH) feature is helpful for discriminating the NSRice plots from other crops. Therefore, in this study, time series of VH polarization and (VV − VH)/(VV + VH) are both considered to be the input features for the rice mapping task.

2.3.2. Dual Branch BiLSTM (DB-BiLSTM) Model

With their superior learning ability of time series, LSTM models are widely used in text recognition, time series forecasting, natural language processing, computer vision and other fields [51,52]. The LSTM cell can effectively mine the temporal dimensional features of rice by controlling the memory unit with a gating mechanism, and then accomplish the task of rice extraction with high accuracy [22,46]. The idea of BiLSTM is to input the same time series into two LSTMs in the forward and backward directions, then concatenate the two networks’ implicit layers together and finally access the output layer jointly for prediction [53].
To fully learn the timing information of multiple features such as VH and (VV − VH)/(VV + VH), a DB-BiLSTM model was designed. The DB-BiLSTM model took pixel-level time series data as the input and yielded a predict category as the output. The DB-BiLSTM model consisted of two branches of the BiLSTM layer, two fully connected layers and a softmax activation function, as shown in Figure 7.
The input of branch 1 is the time series of VH polarization, and that of branch 2 is the time series of (VV − VH)/(VV + VH). The size of the input time series is 22 × 1 due to the 22 SAR observations. Each branch was composed of a two-layer BiLSTM with a hidden layer dimension of 32, which combined the temporal variation characteristics from the forward and backward directions with LSTM structures. First, time series data were input into branch 1 and branch 2, respectively. Next, the outputs of the two branches were connected to combine the high-dimensional temporal information extracted from the time series of VH and (VV − VH)/(VV + VH) features. Subsequently, the dimensionality of the connected high-dimensional information was reduced using two fully connected layers, while retaining the useful information. Finally, using the softmax function, the classification results were obtained. The input and output dimensions of each layer in the DB-BiLSTM are shown in Table 3.
The designed dual branch structure can ensure an independent learning process of the VH and (VV − VH)/(VV + VH) time series data. This structure reduces the possible mutual interference caused by different magnitude orders and avoids the distortion of information caused by the normalization operation to the original time series data. As a result, the key information can be effectively learned from VH and (VV − VH)/(VV + VH) features and combined to enhance the distinguishing ability of SRice, NSRice and other non-rice crops.

2.3.3. Accuracy Assessment

In this study, accuracy indicators such as overall accuracy, precision, recall, F1 and kappa [54,55,56] were calculated based on the confusion matrix to measure the performance of the model:
O v e r a l l   A c c u r a c y = T P + T N T P + T N + F N + F P
P r e c i s i o n = T P T P + F P
R e c a l l = T P T P + F N
F 1 = 2 T P 2 T P + F P + F N
K a p p a = a c c u r a c y P e 1 P e
P e = ( T P + F P ) × ( T P + F N ) + ( F N + T N ) × ( F P + T N ) ( T P + T N + F N + F P ) 2
where TP is the number of correctly identified rice pixels; TN is the number of correctly identified non-rice pixels; FP is the number of non-rice pixels that were mistakenly denoted as rice; FN is the number of rice pixels that were omitted and labeled as non-rice; and P e is the expected accuracy.
The index of agreement (IOA) was used to measure the similarity of two rice maps:
I O A = 1 k = 1 n ( x k y k ) 2 k = 1 n ( | x k y ¯ | + | y k y ¯ | ) 2
where x k and y k represent the pixel values of the two rice maps; y ¯ denotes the mean value of y k ; and n is the number of pixels.

3. Results

To validate the effectiveness of the proposed feature and model, three experiments were performed: (1) a comparison of rice mapping results based on VH, VH + VV and VH + (VV − VH)/(VV + VH); (2) a comparison of the proposed method with the BiLSTM model and RF classification method; and (3) an evaluation of the accuracy of the rice map of Shanwei.
The DB-BiLSTM model was built with the PyTorch framework in Python 3.7 (Facebook, Menlo Park, California, United States), and the version of PyTorch used in this study was 1.2.0. All calculations were performed on a Windows 10 workstation with an NVIDIA GeForce GTX 1080 Ti GPU. The batch size was set to 64, and the learning rate was initialized at 0.001 and was adjusted according to the training time. The attenuation step of the learning rate was 10, and the multiplication factor of the updating learning rate was 0.1. The Adam optimizer was used with the optimized loss function of the cross entropy function.

3.1. Comparison of Different Feature Combinations

To fully test the effect of the proposed features on rice mapping, the commonly used VH and VH + VV features are compared with VH + (VV − VH)/(VV + VH) proposed in this paper. Three different classifiers, including the RF algorithm, BiLSTM model and DB-BiLSTM model in this paper, are used. The performances of the features are evaluated by the accuracy evaluation indicators mentioned in Section 2.2 with the test dataset.
The hidden layer dimension of each LSTM unit in the DB-BiLSTM model is set to 32. To ensure a fair comparison, the parameter setting of the BiLSTM model is the same as that of the DB-BiLSTM model, which is also composed of two-layer LSTM units and two fully connected layers.
The classification accuracy of different features is shown in Table 4. The feature combinations proposed in all classifiers achieve the highest overall accuracy, F1 and kappa compared with other features. The maximum improvements of overall accuracy of each classifier using VH + (VV − VH)/(VV + VH) are 4.45%, 0.65% and 2.83%, respectively. The maximum improvements of F1 are 3.47%, 0.5% and 2.43%, respectively. These results show that the proposed combination of VH + (VV − VH)/(VV + VH) is the most effective feature combination to distinguish rice and non-rice.

3.2. Comparison of Different Methods
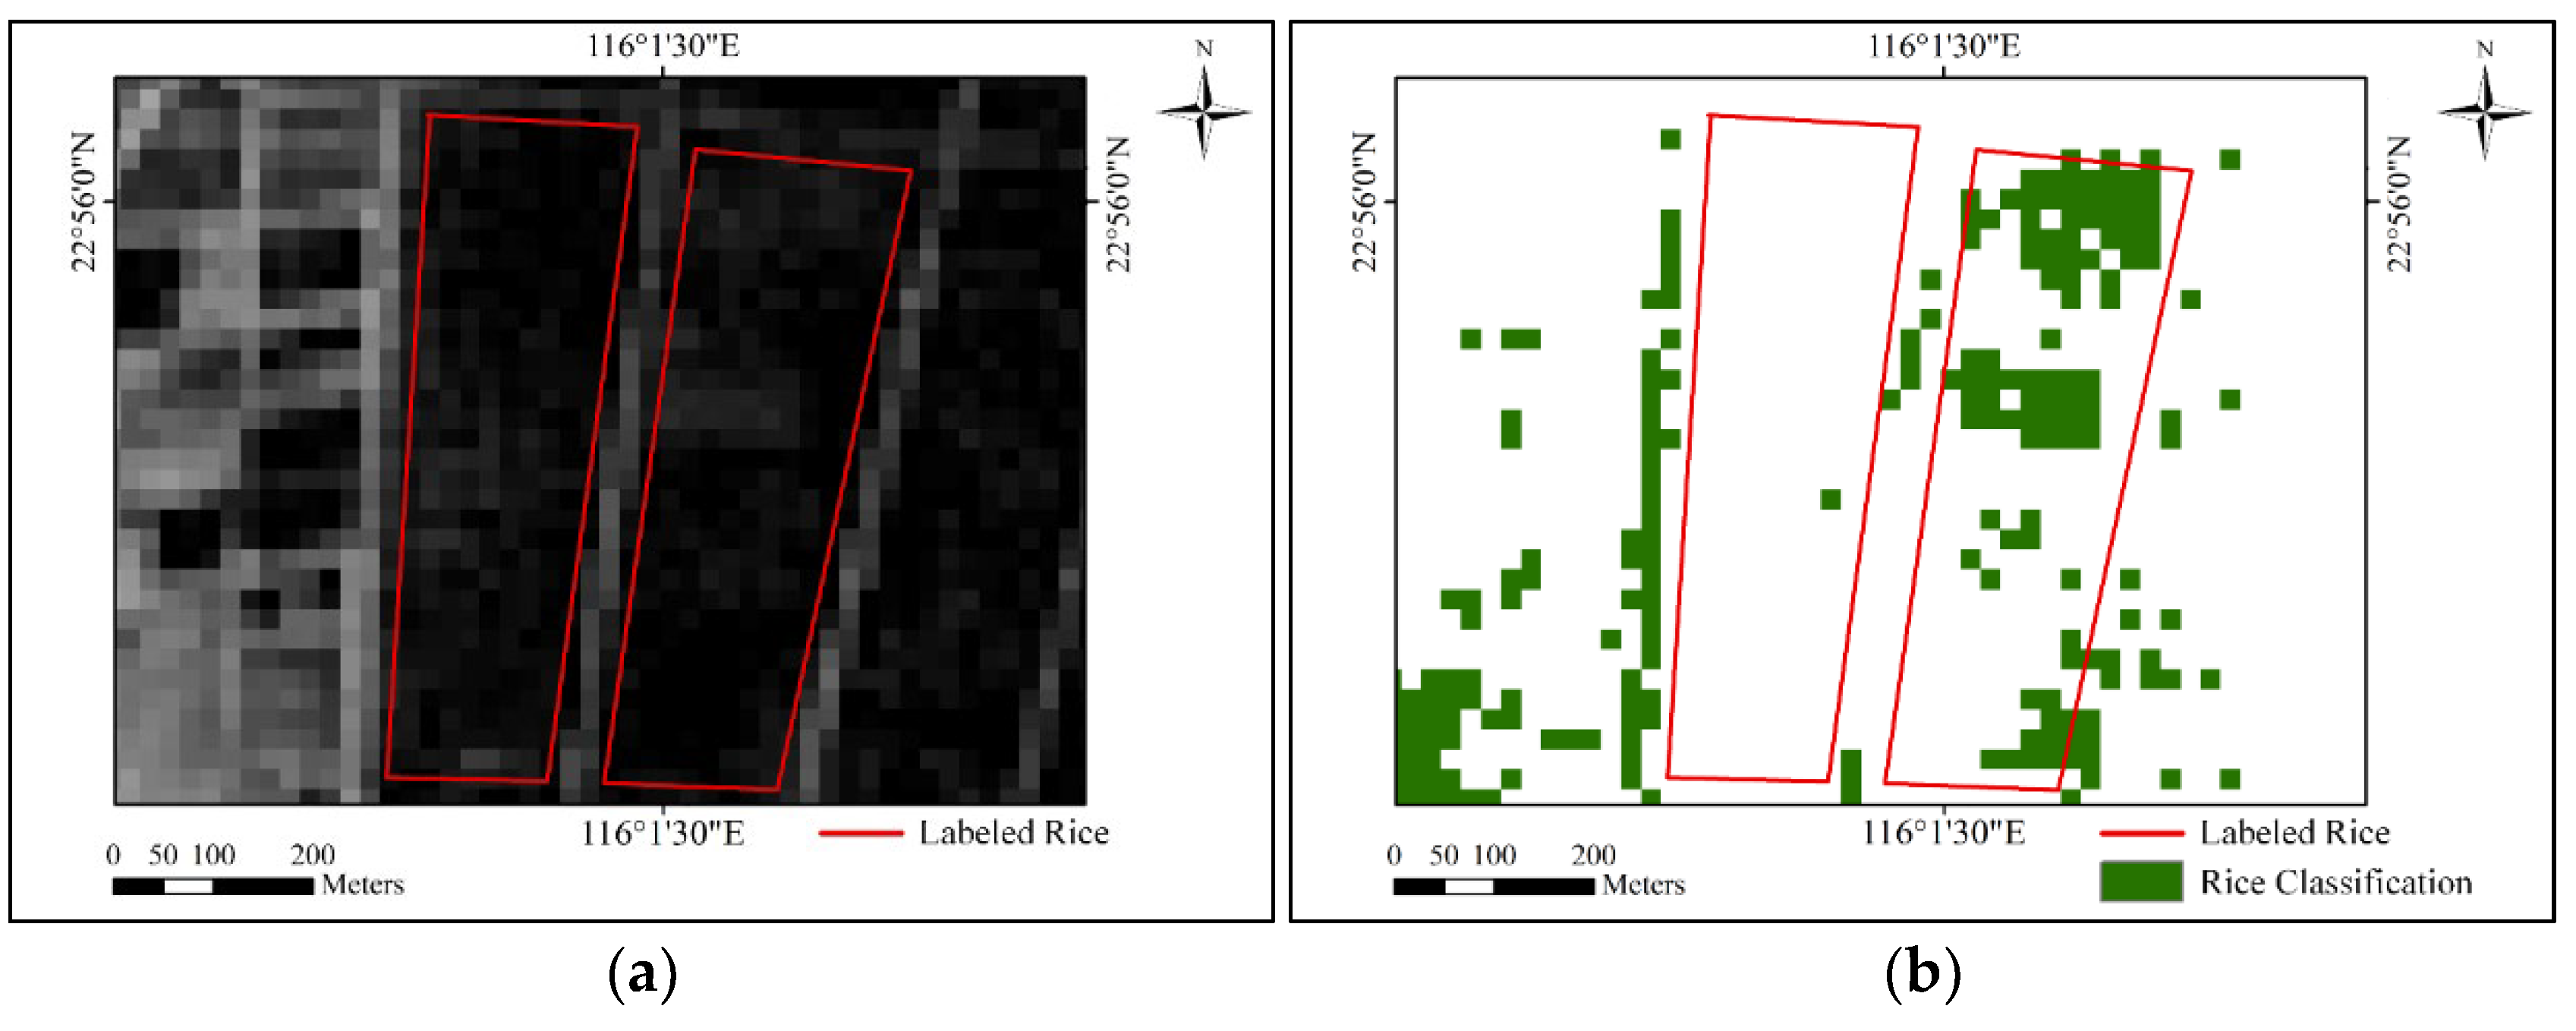
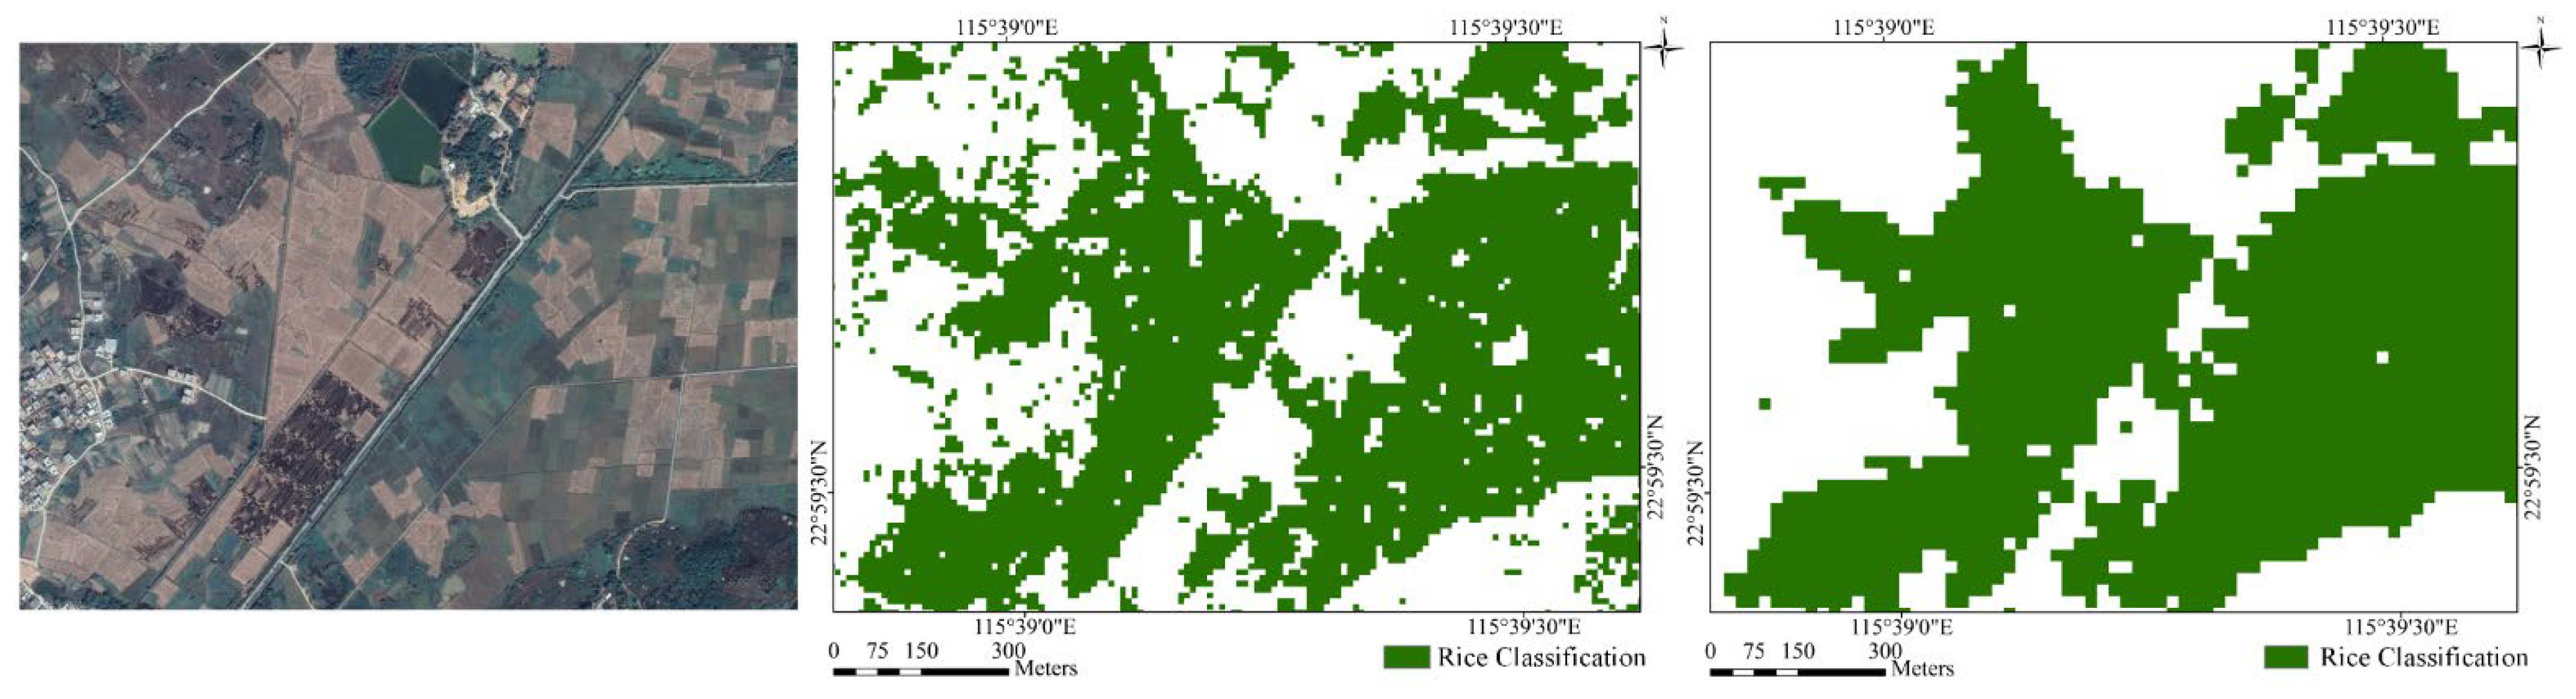
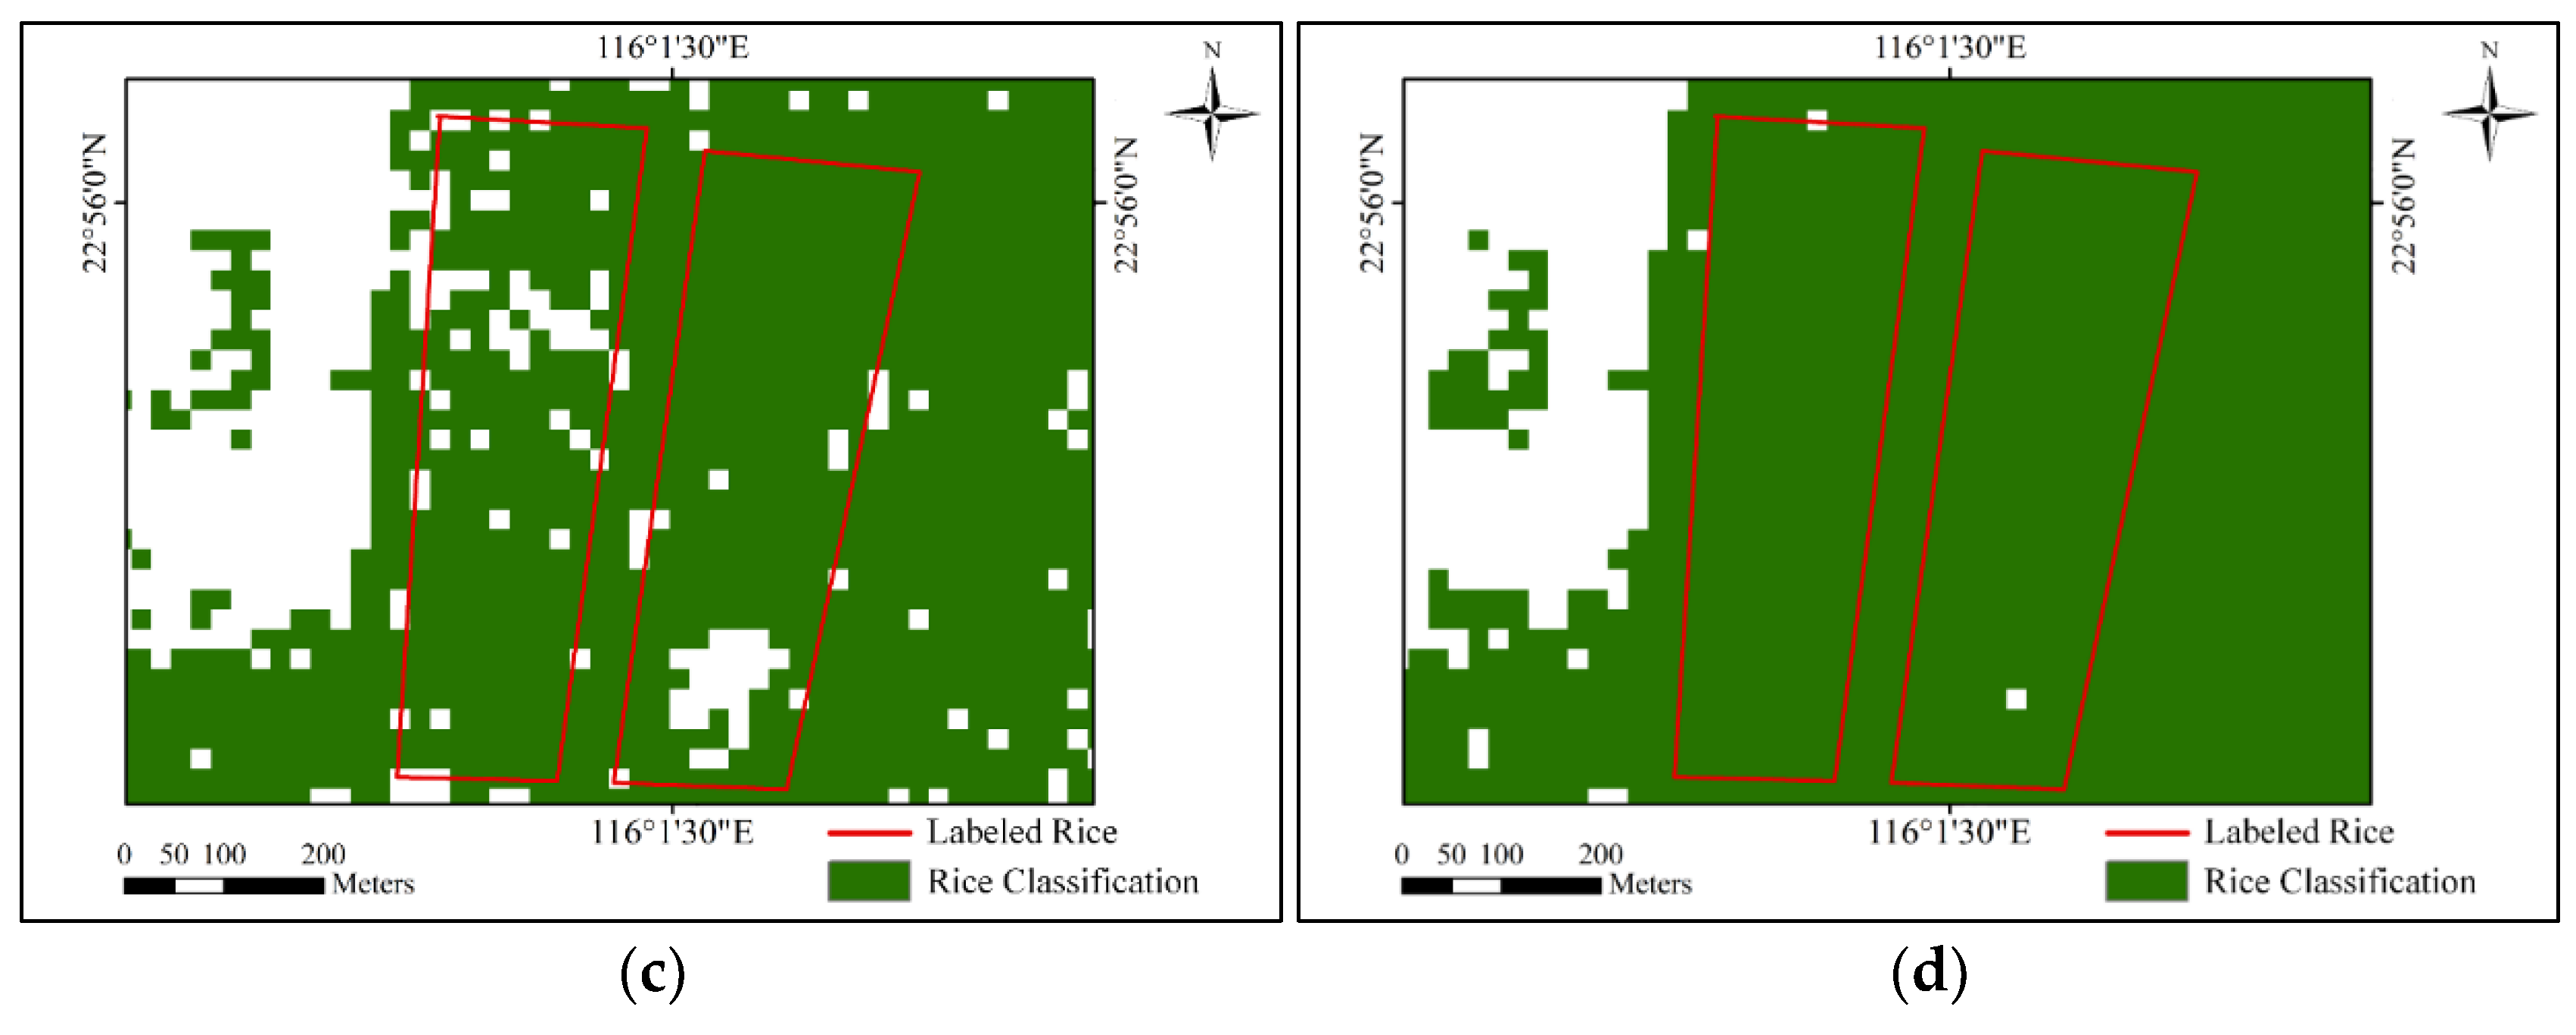
In this section, based on the proposed VH + (VV − VH)/(VV + VH), the RF, BiLSTM model and the proposed DB-BiLSTM model are compared. As shown in Table 4, DB-BiLSTM achieves the highest overall accuracy (up to 97.29%). Its overall accuracy is 6.25% and 3.32% higher than that of RF and BiLSTM, respectively. Recall, F1 and kappa of the DB-BiLSTM model are also higher than those of RF and BiLSTM and RF. These results show that the performance of the DB-BiLSTM model is markedly better than that of the RF and BiLSTM models.
Additionally, to demonstrate the ability of the proposed method to more fully extract rice fields that exhibit non-standard rice backscatter sequence patterns, the classification results of the three methods based on (VV − VH)/(VV + VH) are analyzed in more detail. The accuracies of the two types of rice and non-rice were evaluated. As shown in Figure 8, DB-BiLSTM achieved the highest accuracy for all three land cover types. Its accuracy in NSRice was 37.35% and 13.25% higher than BiLSTM and RF, respectively. These results showed that the proposed method was more suitable for the rice area extraction task of non-standard rice.
A test area was selected for detailed comparative analysis, as shown in Figure 9. Figure 9b shows the classification results of RF classification. There were many missing areas, which may be due to the limited learning ability of RF with time series information. The areas missed in the classification results of BiLSTM are shown in Figure 9c. This method produced fewer missing areas, and the plots were relatively complete. The signal of the rice flooding period in the missing area of BiLSTM and RF was relatively weak. Compared with the classification results of BiLSTM and RF, the rice plots in the classification results of DB-BiLSTM in Figure 9d were relatively complete, and fewer data were missing. These results showed that the proposed method had a better discrimination ability between rice and non-rice.

3.3. Rice Mapping

The rice map of Shanwei city in 2019 based on the proposed method is shown in Figure 10. The results in Table 4 are based on the accuracy of field measured data. The classification accuracy of the rice map is high, with precision of 99.11% and recall of 96.54%. The cropland map was obtained based on the WorldCover product, as shown in Figure 11. The comparison between the rice map and cropland map showed that rice was distributed within the spatial distribution of cropland.
Pan et al. used multitemporal Sentinel-1 data and a weighted dynamic time planning method to obtain early and late rice maps in 2019 [21]. The early and late rice maps were combined to obtain the annual rice map in 2019. The study area with field data was selected, and the rice results of this study were compared with Pan et al.’s results, as shown in Figure 12. The rice map from this study is slightly different from the results of [21], but the spatial pattern of the rice plots is similar, and the large rice plots in the proposed results are more complete. In addition, the IOA of the two rice maps was calculated. The higher the IOA is, the better the consistency of the two rice maps. The IOA is 0.8322, which indicates that the two rice maps were highly correlated. These results showed that the proposed rice map was credible.

4. Discussion

In this study, the regularity of temporal backscatter curves of tropical or subtropical rice was analyzed using multitemporal SAR data. The SAR rice index (VV − VH)/(VV + VH) was found to be more suitable for hilly areas. Combined with the common VH features, effective extraction of rice mapping is achieved, and good results are achieved in the comparison and verification of various classifiers. The proposed (VV − VH)/(VV + VH) feature can effectively distinguish rice and non-rice crops, and can accurately describe paddy fields in complex tropical or subtropical hilly areas. Therefore, the overall performance of rice mapping is markedly improved.
In many classification methods, there was no doubt that DB-BiLSTM achieved the best classification performance. As shown in Table 4, F1 of DB-BiLSTM was as high as 97.81%, and kappa was as high as 0.9424. The classification accuracy of DB-BiLSTM in SRice and non-rice was 99.19% and 98.54%, respectively, as shown in Figure 8. Concurrently, compared with BiLSTM and RF, DB-BiLSTM improved the classification accuracy of NSRice by up to 37.35%. The dual branch structure of DB-BiLSTM ensures the independent learning of different features and avoids the mutual interference of different order features of magnitude. In addition, the proposed model has strong expansibility. The branches of the proposed model can be extended to accommodate more feature inputs. The proposed model can also be used for changes in rice production. For example, the rice time series before and after are input into the model to obtain the change monitoring results of rice.
As shown by the comparisons with other features and other frequently used models and a rice map obtained from another study, the proposed method achieves good results. This method can improve the extraction effect of rice with small plots, scattered distribution and no marked flooding period. The rice map obtained by the proposed method has demonstrated practical value in rice extraction tasks in tropical and subtropical hilly areas. However, there remain some deficiencies in the proposed method. For example, some paths between the rice fields were misclassified as rice due to insufficient data resolution. However, these shortcomings could be easily corrected via postprocessing or by improving the accuracies of ancillary data.

5. Conclusions

To solve the problem of missing detection of rice in subtropical hilly rice areas where the signal of the flooding period is weak, this study combines the new characteristic parameters and the DB-BiLSTM model to develop an extraction method for rice areas in subtropical hilly areas and creates a rice map of the city of Shanwei in China using 22 Sentinel-1 data in 2019. Results showed that the VH + (VV − VH)/(VV + VH) feature combination could effectively distinguish standard and non-standard rice from non-rice crops. The overall accuracy of the model on the test set was 97.29%, which was better than the results of the BiLSTM and RF classifiers. In addition, the rice distribution obtained by the proposed method was consistent with that obtained by other studies. The proposed method thus exhibits a better ability to maintain the good integrity of paddy fields.
In the future, we plan to expand existing features and models of rice mapping to solve more complex rice mapping problems in tropical or subtropical areas.

Author Contributions

Conceptualization, methodology, software, C.S.; validation, formal analysis, H.Z.; investigation, C.S. and L.X.; resources, data curation, C.W. and J.G.; writing—original draft preparation, C.S. and H.Z.; writing—review and editing, H.Z., J.G. and L.L.; visualization, L.X. and J.G.; supervision, project administration, H.Z. and C.W. All authors have read and agreed to the published version of the manuscript.

Funding

This research was funded by the National Natural Science Foundation of China under Grants 41971395, 41930110 and 42001278.

Data Availability Statement

The Sentinel-1 data presented in this study are openly and freely available at https://search.asf.alaska.edu/ (accessed on 3 January 2022).

Acknowledgments

The authors would like to thank ESA and EU Copernicus Program for providing the Sentinel-1A SAR data.

Conflicts of Interest

The authors declare no conflict of interest.

References

  1. Desa, U. Transforming Our World: The 2030 Agenda for Sustainable Development. 2016. Available online: https://sdgs.un.org/publications/transforming-our-world-2030-agenda-sustainable-development-17981 (accessed on 5 June 2022).
  2. Kuenzer, C.; Knauer, K. Remote sensing of rice crop areas. Int. J. Remote Sens. 2012, 34, 2101–2139. [Google Scholar] [CrossRef]
  3. FAOSTAT. Statistical Database of the Food and Agricultural Organization of the United Nations; FAOSTAT: Rome, Italy, 2010. [Google Scholar]
  4. Wang, Z.; Yang, X.; Zhou, C. Geographic knowledge graph for remote sensing big data. J. Geo-Inf. Sci. 2021, 23, 13. [Google Scholar] [CrossRef]
  5. Orynbaikyzy, A.; Gessner, U.; Conrad, C. Crop type classification using a combination of optical and radar remote sensing data: A review. Int. J. Remote Sens. 2019, 40, 6553–6595. [Google Scholar] [CrossRef]
  6. Liu, C.-A.; Chen, Z.-X.; Shao, Y.; Chen, J.-S.; Hasi, T.; Pan, H.-Z. Research advances of SAR remote sensing for agriculture applications: A review. J. Integr. Agric. 2019, 18, 506–525. [Google Scholar] [CrossRef] [Green Version]
  7. Zhu, Z.; Woodcock, C.E. Object-based cloud and cloud shadow detection in Landsat imagery. Remote Sens. Environ. 2012, 118, 83–94. [Google Scholar] [CrossRef]
  8. Huang, X.; Wang, J.; Shang, J.; Liao, C.; Liu, J. Application of polarization signature to land cover scattering mechanism analysis and classification using multi-temporal C-band polarimetric RADARSAT-2 imagery. Remote Sens. Environ. 2017, 193, 11–28. [Google Scholar] [CrossRef]
  9. Mosleh, M.K.; Hassan, Q.K.; Chowdhury, E.H. Application of remote sensors in mapping rice area and forecasting its production: A review. Sensors 2015, 15, 769–791. [Google Scholar] [CrossRef] [Green Version]
  10. Hoang, H.K.; Bernier, M.; Duchesne, S.; Tran, Y.M. Rice Mapping Using RADARSAT-2 Dual- and Quad-Pol Data in a Complex Land-Use Watershed: Cau River Basin (Vietnam). IEEE J. Sel. Top. Appl. Earth Obs. Remote Sens. 2016, 9, 3082–3096. [Google Scholar] [CrossRef]
  11. Clauss, K.; Ottinger, M.; Leinenkugel, P.; Kuenzer, C. Estimating rice production in the Mekong Delta, Vietnam, utilizing time series of Sentinel-1 SAR data. Int. J. Appl. Earth Obs. Geoinf. 2018, 73, 574–585. [Google Scholar] [CrossRef]
  12. Clauss, K.; Ottinger, M.; Kuenzer, C. Mapping rice areas with Sentinel-1 time series and superpixel segmentation. Int. J. Remote Sens. 2017, 39, 1399–1420. [Google Scholar] [CrossRef] [Green Version]
  13. Singha, M.; Dong, J.; Zhang, G.; Xiao, X. High resolution paddy rice maps in cloud-prone Bangladesh and Northeast India using Sentinel-1 data. Sci. Data 2019, 6, 26. [Google Scholar] [CrossRef] [PubMed]
  14. Koppe, W.; Gnyp, M.L.; Hütt, C.; Yao, Y.; Miao, Y.; Chen, X.; Bareth, G. Rice monitoring with multi-temporal and dual-polarimetric TerraSAR-X data. Int. J. Appl. Earth Obs. Geoinf. 2013, 21, 568–576. [Google Scholar] [CrossRef]
  15. Hoang-Phi, P.; Lam-Dao, N.; Pham-Van, C.; Chau-Nguyen-Xuan, Q.; Nguyen-Van-Anh, V.; Gummadi, S.; Le-Van, T. Sentinel-1 SAR Time Series-Based Assessment of the Impact of Severe Salinity Intrusion Events on Spatiotemporal Changes in Distribution of Rice Planting Areas in Coastal Provinces of the Mekong Delta, Vietnam. Remote Sens. 2020, 12, 3196. [Google Scholar] [CrossRef]
  16. Wu, F.; Wang, C.; Zhang, H.; Zhang, B.; Tang, Y. Rice Crop Monitoring in South China With RADARSAT-2 Quad-Polarization SAR Data. IEEE Geosci. Remote Sens. Lett. 2011, 8, 196–200. [Google Scholar] [CrossRef]
  17. Li, H.; Fu, D.; Huang, C.; Su, F.; Liu, Q.; Liu, G.; Wu, S. An Approach to High-Resolution Rice Paddy Mapping Using Time-Series Sentinel-1 SAR Data in the Mun River Basin, Thailand. Remote Sens. 2020, 12, 3959. [Google Scholar] [CrossRef]
  18. Boschetti, M.; Busetto, L.; Manfron, G.; Laborte, A.; Asilo, S.; Pazhanivelan, S.; Nelson, A. PhenoRice: A method for automatic extraction of spatio-temporal information on rice crops using satellite data time series. Remote Sens. Environ. 2017, 194, 347–365. [Google Scholar] [CrossRef] [Green Version]
  19. Bazzi, H.; Baghdadi, N.; El Hajj, M.; Zribi, M.; Minh, D.H.T.; Ndikumana, E.; Courault, D.; Belhouchette, H. Mapping Paddy Rice Using Sentinel-1 SAR Time Series in Camargue, France. Remote Sens. 2019, 11, 887. [Google Scholar] [CrossRef] [Green Version]
  20. Chang, L.; Chen, Y.-T.; Chan, Y.-L.; Wu, M.-C. A Novel Feature for Detection of Rice Field Distribution Using Time Series SAR Data. In Proceedings of the IGARSS 2020–2020 IEEE International Geoscience and Remote Sensing Symposium, Waikoloa, HI, USA, 26 September–2 October 2020; pp. 4866–4869. [Google Scholar]
  21. Pan, B.; Zheng, Y.; Shen, R.; Ye, T.; Zhao, W.; Dong, J.; Ma, H.; Yuan, W. High Resolution Distribution Dataset of Double-Season Paddy Rice in China. Remote Sens. 2021, 13, 4609. [Google Scholar] [CrossRef]
  22. Ndikumana, E.; Ho Tong Minh, D.; Baghdadi, N.; Courault, D.; Hossard, L. Deep Recurrent Neural Network for Agricultural Classification using multitemporal SAR Sentinel-1 for Camargue, France. Remote Sens. 2018, 10, 1217. [Google Scholar] [CrossRef] [Green Version]
  23. Mansaray, L.R.; Kabba, V.T.S.; Zhang, L.; Bebeley, H.A. Optimal multi-temporal Sentinel-1A SAR imagery for paddy rice field discrimination; a recommendation for operational mapping initiatives. Remote Sens. Appl. Soc. Environ. 2021, 22, 100533. [Google Scholar] [CrossRef]
  24. Yang, L.; Huang, R.; Huang, J.; Lin, T.; Wang, L.; Mijiti, R.; Wei, P.; Tang, C.; Shao, J.; Li, Q.; et al. Semantic Segmentation Based on Temporal Features: Learning of Temporal-Spatial Information from Time-Series SAR Images for Paddy Rice Mapping. IEEE Trans. Geosci. Remote Sens. 2021, 60, 1–16. [Google Scholar] [CrossRef]
  25. Shao, Y.; Fan, X.; Liu, H.; Xiao, J.; Ross, S.; Brisco, B.; Brown, R.; Staples, G. Rice monitoring and production estimation using multitemporal RADARSAT. Remote Sens. Environ. 2001, 76, 310–325. [Google Scholar] [CrossRef]
  26. Zuperku, E.J.; Prkic, I.; Stucke, A.G.; Miller, J.R.; Hopp, F.A.; Stuth, E.A. Automatic classification of canine PRG neuronal discharge patterns using K-means clustering. Respir. Physiol. Neurobiol. 2015, 207, 28–39. [Google Scholar] [CrossRef] [PubMed] [Green Version]
  27. Chai, K. Detecting Rice Cropping Patterns with Sentinel-1 Multitemporal Imagery. Master’s Thesis, University of Twente, Enschede, The Netherlands, 2018. [Google Scholar]
  28. He, Z.; Li, S.; Wang, Y.; Dai, L.; Lin, S. Monitoring Rice Phenology Based on Backscattering Characteristics of Multi-Temporal RADARSAT-2 Datasets. Remote Sens. 2018, 10, 340. [Google Scholar] [CrossRef] [Green Version]
  29. Park, S.; Im, J.; Park, S.; Yoo, C.; Han, H.; Rhee, J. Classification and Mapping of Paddy Rice by Combining Landsat and SAR Time Series Data. Remote Sens. 2018, 10, 447. [Google Scholar] [CrossRef] [Green Version]
  30. You, N.; Dong, J.; Huang, J.; Du, G.; Zhang, G.; He, Y.; Yang, T.; Di, Y.; Xiao, X. The 10-m crop type maps in Northeast China during 2017–2019. Sci. Data 2021, 8, 41. [Google Scholar] [CrossRef]
  31. He, Y.; Dong, J.; Liao, X.; Sun, L.; Wang, Z.; You, N.; Li, Z.; Fu, P. Examining rice distribution and cropping intensity in a mixed single- and double-cropping region in South China using all available Sentinel 1/2 images. Int. J. Appl. Earth Obs. Geoinf. 2021, 101, 102351. [Google Scholar] [CrossRef]
  32. Son, N.-T.; Chen, C.-F.; Chen, C.-R.; Minh, V.-Q. Assessment of Sentinel-1A data for rice crop classification using random forests and support vector machines. Geocarto Int. 2018, 33, 587–601. [Google Scholar] [CrossRef]
  33. Wei, S.; Zhang, H.; Wang, C.; Wang, Y.; Xu, L. Multi-Temporal SAR Data Large-Scale Crop Mapping Based on U-Net Model. Remote Sens. 2019, 11, 68. [Google Scholar] [CrossRef] [Green Version]
  34. Fernandez-Beltran, R.; Baidar, T.; Kang, J.; Pla, F. Rice-yield prediction with multi-temporal sentinel-2 data and 3D CNN: A case study in Nepal. Remote Sens. 2021, 13, 1391. [Google Scholar] [CrossRef]
  35. Kussul, N.; Lavreniuk, M.; Skakun, S.; Shelestov, A. Deep learning classification of land cover and crop types using remote sensing data. IEEE Geosci. Remote Sens. Lett. 2017, 14, 778–782. [Google Scholar] [CrossRef]
  36. Xu, L.; Zhang, H.; Wang, C.; Wei, S.; Zhang, B.; Wu, F.; Tang, Y. Paddy Rice Mapping in Thailand Using Time-Series Sentinel-1 Data and Deep Learning Model. Remote Sens. 2021, 13, 3994. [Google Scholar] [CrossRef]
  37. Thorp, K.R.; Drajat, D. Deep machine learning with Sentinel satellite data to map paddy rice production stages across West Java, Indonesia. Remote Sens. Environ. 2021, 265, 112679. [Google Scholar] [CrossRef]
  38. Sun, C.; Zhang, H.; Xu, L.; Wang, C.; Li, L. Rice Mapping Using a BiLSTM-Attention Model from Multitemporal Sentinel-1 Data. Agriculture 2021, 11, 977. [Google Scholar] [CrossRef]
  39. Liu, Y.; Zhao, W.; Chen, S.; Ye, T. Mapping Crop Rotation by Using Deeply Synergistic Optical and SAR Time Series. Remote Sens. 2021, 13, 4160. [Google Scholar] [CrossRef]
  40. Lin, Z.; Zhong, R.; Xiong, X.; Guo, C.; Xu, J.; Zhu, Y.; Xu, J.; Ying, Y.; Ting, K.C.; Huang, J.; et al. Large-Scale Rice Mapping Using Multi-Task Spatiotemporal Deep Learning and Sentinel-1 SAR Time Series. Remote Sens. 2022, 14, 699. [Google Scholar] [CrossRef]
  41. Shi, X.; Chen, Z.; Wang, H.; Yeung, D.-Y.; Wong, W.-K.; Woo, W.-C. Convolutional LSTM Network: A Machine Learning Approach for Precipitation Nowcasting. In Proceedings of the Neural Information Processing Systems, Montreal, QC, Canada, 7–12 December 2015; pp. 802–810. [Google Scholar]
  42. Wang, X.; Huang, J.; Feng, Q.; Yin, D. Winter wheat yield prediction at county level and uncertainty analysis in main wheat-producing regions of China with deep learning approaches. Remote Sens. 2020, 12, 1744. [Google Scholar] [CrossRef]
  43. Chang, Y.-L.; Tan, T.-H.; Chen, T.-H.; Chuah, J.H.; Chang, L.; Wu, M.-C.; Tatini, N.B.; Ma, S.-C.; Alkhaleefah, M. Spatial-Temporal Neural Network for Rice Field Classification from SAR Images. Remote Sens. 2022, 14, 1929. [Google Scholar] [CrossRef]
  44. Torres, R.; Snoeij, P.; Geudtner, D.; Bibby, D.; Davidson, M.; Attema, E.; Potin, P.; Rommen, B.; Floury, N.; Brown, M. GMES Sentinel-1 mission. Remote Sens. Environ. 2012, 120, 9–24. [Google Scholar] [CrossRef]
  45. Zanaga, D.; Van De Kerchove, R.; De Keersmaecker, W.; Souverijns, N.; Brockmann, C.; Quast, R.; Wevers, J.; Grosu, A.; Paccini, A.; Vergnaud, S. ESA WorldCover 10 m 2020 v100. 2021. Available online: https://developers.google.cn/earth-engine/datasets/catalog/ESA_WorldCover_v100 (accessed on 27 December 2021).
  46. Crisóstomo de Castro Filho, H.; Abílio de Carvalho Júnior, O.; Ferreira de Carvalho, O.L.; Pozzobon de Bem, P.; dos Santos de Moura, R.; Olino de Albuquerque, A.; Rosa Silva, C.; Guimarães Ferreira, P.H.; Fontes Guimarães, R.; Trancoso Gomes, R.A. Rice Crop Detection Using LSTM, Bi-LSTM, and Machine Learning Models from Sentinel-1 Time Series. Remote Sens. 2020, 12, 2655. [Google Scholar] [CrossRef]
  47. Tian, H.; Wu, M.; Wang, L.; Niu, Z. Mapping Early, Middle and Late Rice Extent Using Sentinel-1A and Landsat-8 Data in the Poyang Lake Plain, China. Sensors 2018, 18, 185. [Google Scholar] [CrossRef] [PubMed] [Green Version]
  48. Nguyen, D.B.; Gruber, A.; Wagner, W. Mapping rice extent and cropping scheme in the Mekong Delta using Sentinel-1A data. Remote Sens. Lett. 2016, 7, 1209–1218. [Google Scholar] [CrossRef]
  49. Phan, H.; Le Toan, T.; Bouvet, A. Understanding Dense Time Series of Sentinel-1 Backscatter from Rice Fields: Case Study in a Province of the Mekong Delta, Vietnam. Remote Sens. 2021, 13, 921. [Google Scholar] [CrossRef]
  50. Li, Z.; Yuan, J.; Zhang, W. Fuzzy C-Mean Algorithm with Morphology Similarity Distance. In Proceedings of the 2009 Sixth International Conference on Fuzzy Systems and Knowledge Discovery, Tianjin, China, 14–16 August 2009; pp. 90–94. [Google Scholar]
  51. Van Houdt, G.; Mosquera, C.; Nápoles, G. A review on the long short-term memory model. Artif. Intell. Rev. 2020, 53, 5929–5955. [Google Scholar] [CrossRef]
  52. Olah, C. Understanding LSTM Networks. 2015. Available online: https://colah.github.io/posts/2015-08-Understanding-LSTMs/ (accessed on 3 December 2021).
  53. Hameed, Z.; Garcia-Zapirain, B.; Ruiz, I.O. A Computationally Efficient BiLSTM Based Approach for the Binary Sentiment Classification. In Proceedings of the 2019 IEEE International Symposium on Signal Processing and Information Technology (ISSPIT), Ajman, United Arab Emirates, 10–12 December 2019; pp. 1–4. [Google Scholar]
  54. Vapnik, V.N. An overview of statistical learning theory. IEEE Trans. Neural Netw. 1999, 10, 988–999. [Google Scholar] [CrossRef] [Green Version]
  55. Congalton, R.G. A review of assessing the accuracy of classifications of remotely sensed data. Remote Sens. Environ. 1991, 37, 35–46. [Google Scholar] [CrossRef]
  56. McHugh, M.L. Interrater reliability: The kappa statistic. Biochem. Med. 2012, 22, 276–282. [Google Scholar] [CrossRef]
Figure 1. (a) Geographical location of the study area. (b) SAR time series data covering the study area.
Remotesensing 14 03213 g001
Figure 2. Field survey plots. (The three images in the first column show rice; the three images from top to bottom in the second column show corn, peanut and sweet potato).
Remotesensing 14 03213 g002
Figure 3. Flow chart of the proposed method.
Remotesensing 14 03213 g003
Figure 4. Crop time series of VH polarization for 21 field survey areas. (A total of seven crops, respectively, rice, corn, sweet potato, litchi, sod, peanut, green plum).
Remotesensing 14 03213 g004
Figure 5. Crop time series of VV VH VV + VH for 21 field survey areas. (A total of seven crops, respectively, rice, corn, sweet potato, litchi, sod, peanut, green plum).
Remotesensing 14 03213 g005
Figure 6. Morphological similarity distances between rice and other crops: (a) distances between NSRice and SRice, corn and other crops; (b) distances between SRice and NSRice, corn and other crops.
Remotesensing 14 03213 g006
Figure 7. Structure diagram of DB-BiLSTM model.
Remotesensing 14 03213 g007
Figure 8. Accuracy of SRice, NSRice, non-rice based on different methods. (Bold in the figure indicates the accuracy obtained by the best model in different classes).
Remotesensing 14 03213 g008
Figure 9. Comparison of classification results of different methods. (a) Label; (b) RF; (c) BiLSTM; (d) DB-BiLSTM.
Remotesensing 14 03213 g009aRemotesensing 14 03213 g009b
Figure 10. Rice map of Shanwei cityin 2019.
Remotesensing 14 03213 g010
Figure 11. Cropland map of Shanwei city based on WorldCover.
Remotesensing 14 03213 g011
Figure 12. Comparison of rice maps. From left to right are the optical image, Pan et al.’s rice map and the proposed rice map, respectively.
Remotesensing 14 03213 g012
Table 1. List of available SAR data.
Orbit–Scene: 113-71
No.DateNo.DateNo.DateNo.Date
121 March 2019725 June 2019135 September 20191916 November 2019
214 April 201987 July 20191417 September 20192028 November 2019
326 April 2019919 July 20191529 September 20192110 December 2019
420 May 20191031 July 20191611 October 20192222 December 2019
51 June 20191112 August 20191723 October 2019
613 June 20191224 August 2019184 November 2019
Table 2. Information of the sample set.
Field Research Plots
CropNumber of PlotsNumber of Pixels
Rice101156
Corn6182
Others5504
Number of samples
ClassPixels for training (80%)Pixels for testing (20%)Total (100%)
Rice403010085038
Non-rice8640216010,800
Table 3. The input and output dimensions of each layer in the DB-BiLSTM. BatchSize = 64.
LayersInputOutput
Branch1/2BatchSize × 22 × 1BatchSize × 64
ConcatenateBatchSize × 64, BatchSize × 64BatchSize × 128
Fully Connected Layer1BatchSize × 128BatchSize × 32
Fully Connected Layer2BatchSize × 32BatchSize × 2
SoftmaxBatchSize × 2BatchSize × 1
Table 4. Accuracy assessment of different features.
Features O v e r a l l   A c c u r a c y   ( % ) P r e c i s i o n   ( % ) R e c a l l   ( % ) F 1   ( % ) K a p p a
RF
VH87.3091.3588.7490.030.7255
VH + VV86.5987.9890.4089.170.7157
VH + VV VH VV + VH 91.0489.7995.6792.640.8123
BiLSTM
VH93.4397.5892.3894.910.8567
VH + VV93.3298.1491.0994.480.8606
VH + VV VH VV + VH 93.9799.4390.9294.980.8748
DB-BiLSTM
VH + VV94.4698.8092.3095.440.8841
VH + VV VH VV + VH 97.2999.1196.5497.810.9424
Publisher’s Note: MDPI stays neutral with regard to jurisdictional claims in published maps and institutional affiliations.

