Impacts of Land-Use Change on the Spatio-Temporal Patterns of Terrestrial Ecosystem Carbon Storage in the Gansu Province, Northwest China
Abstract
:1. Introduction
2. Materials and Methods
2.1. Study Area
2.2. Data Sources
2.2.1. Land-Use Data
2.2.2. Satellite-Derived Carbon Maps
2.2.3. Environmental Variables
2.3. LUCC Modelling
2.4. InVEST Model
3. Results
3.1. LUCC during 1980–2020
3.2. Effects of LUCC on Carbon Storage during 1980–2020
3.3. Carbon Storage Changes under Different LUCC Scenarios
4. Discussion
4.1. Terrestrial Ecosystem Carbon Storage in the Gansu Province
4.2. Effect of LUCC on CS during 1980–2020
4.3. Carbon Storage Changes under Different LUCC Scenarios
4.4. Implications for Carbon Management
4.5. Limitations and Uncertainties
5. Conclusions
- (1)
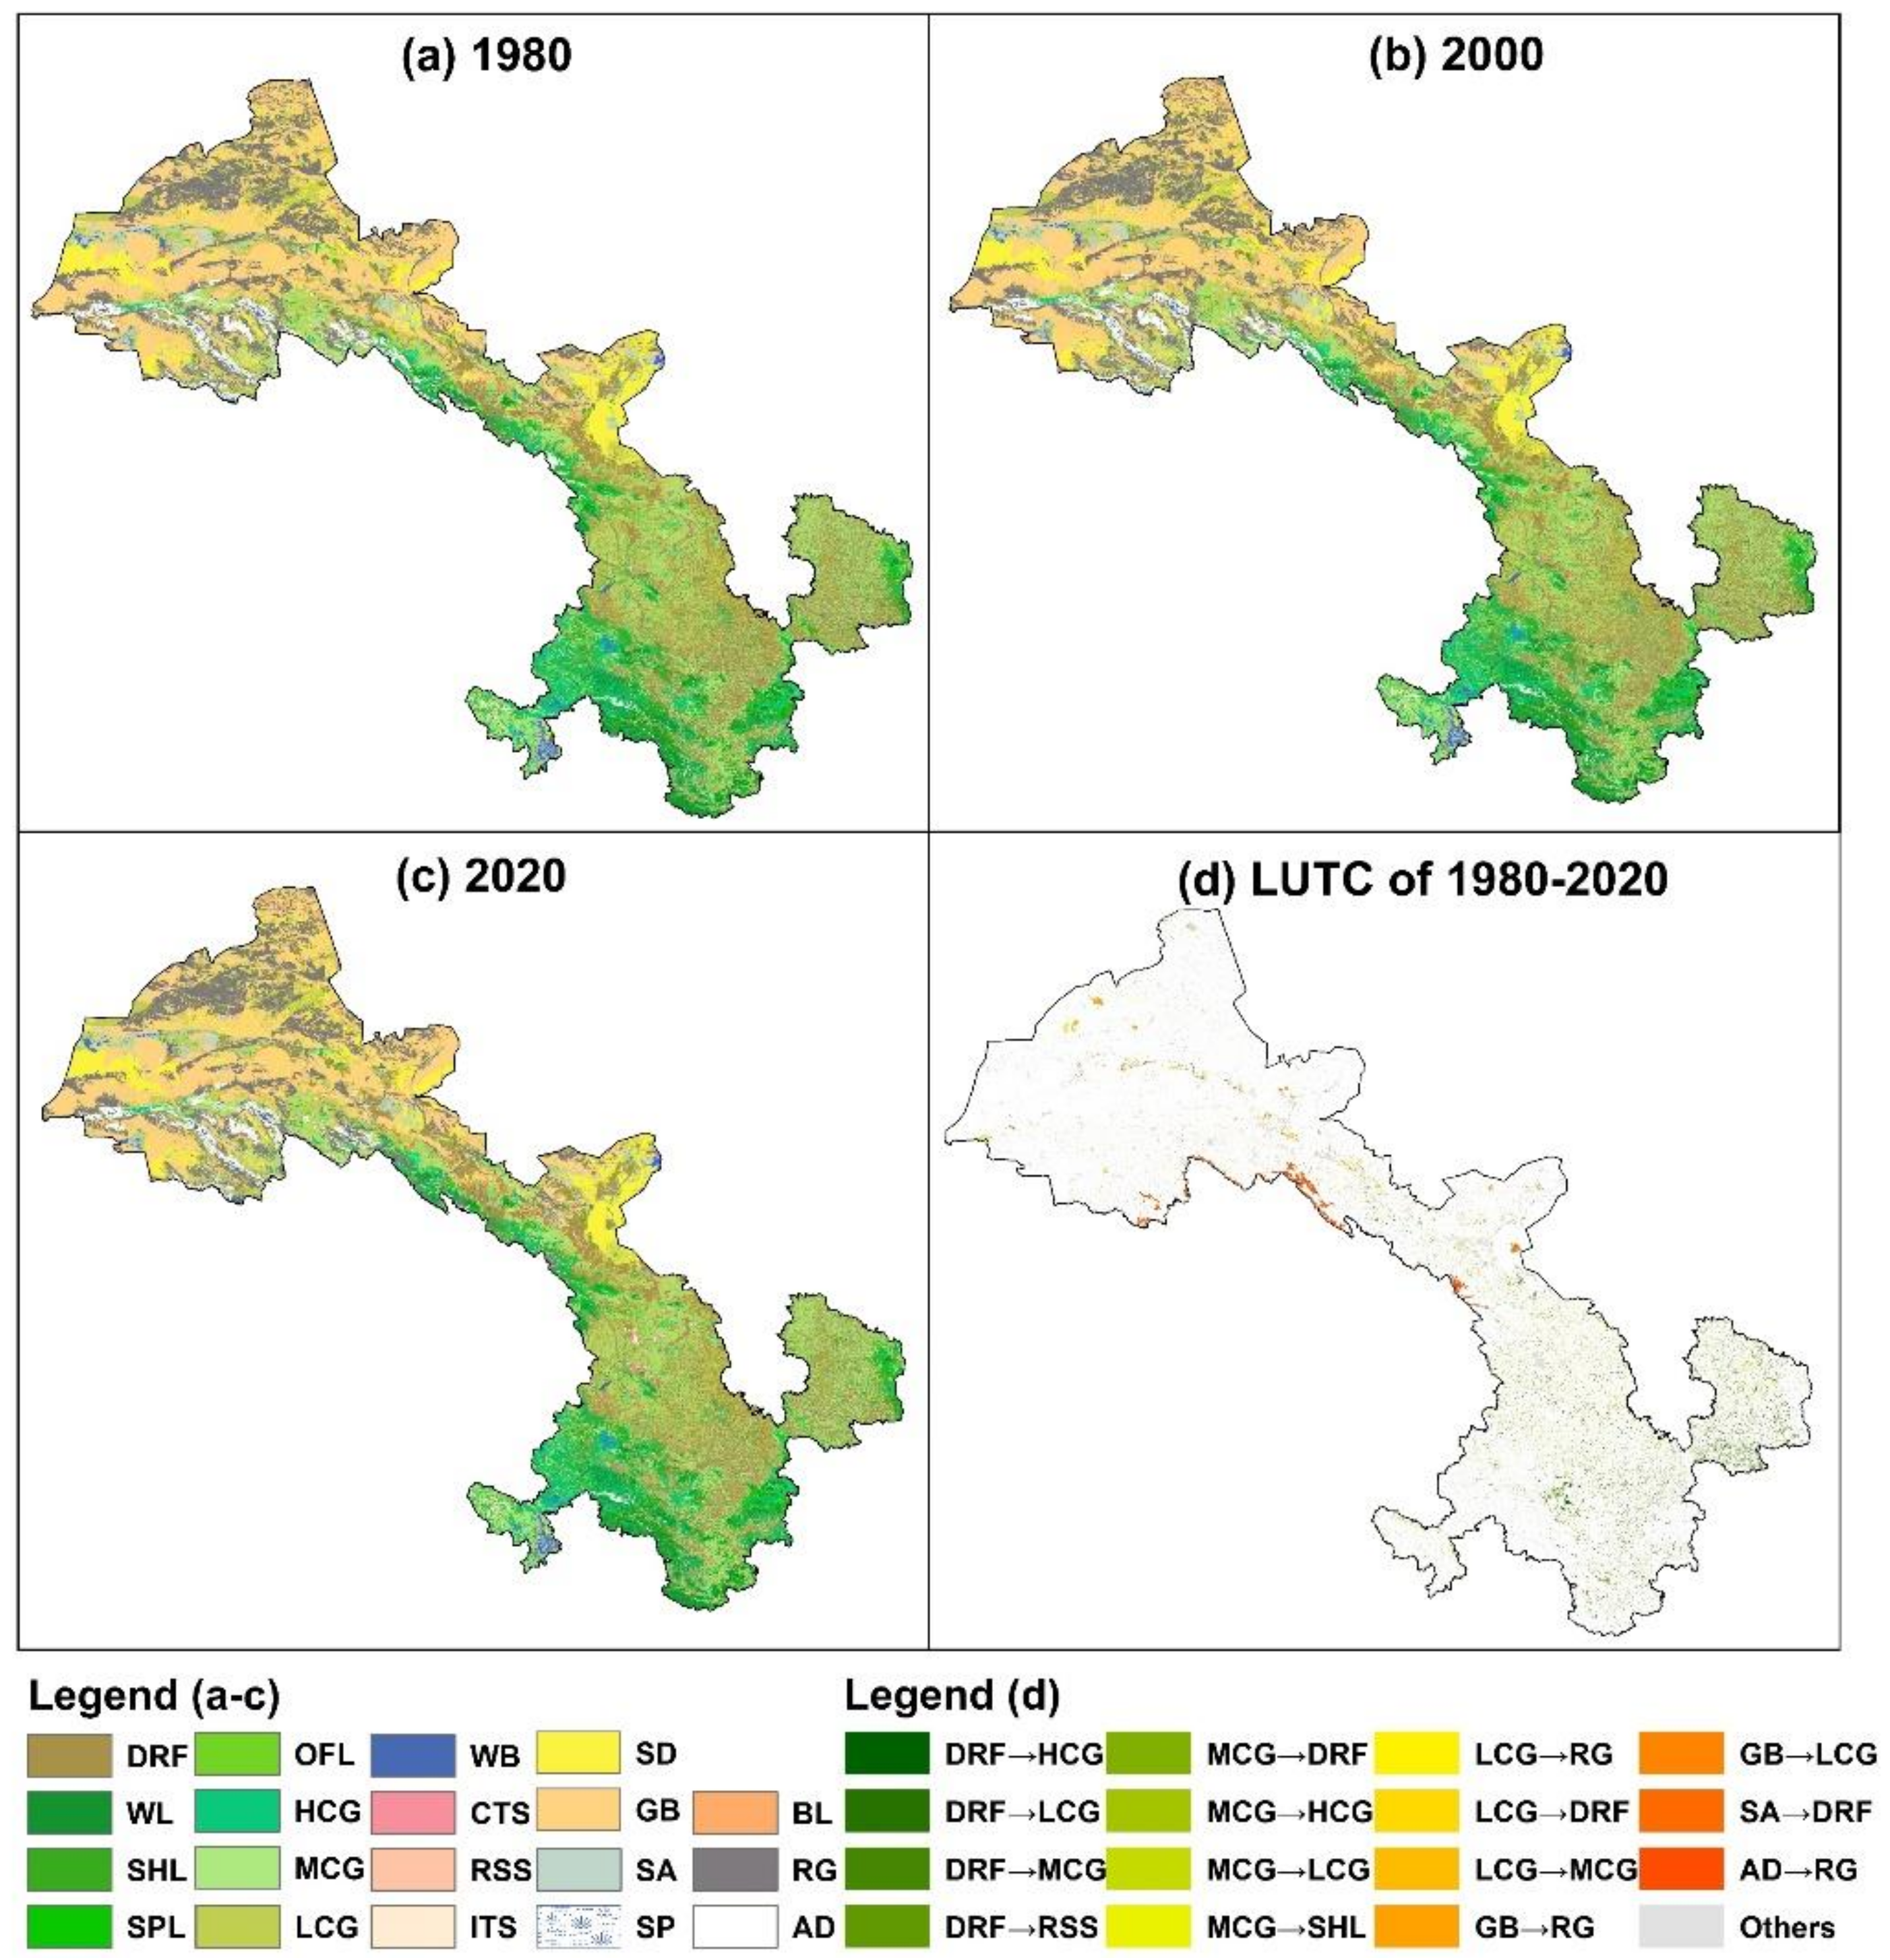
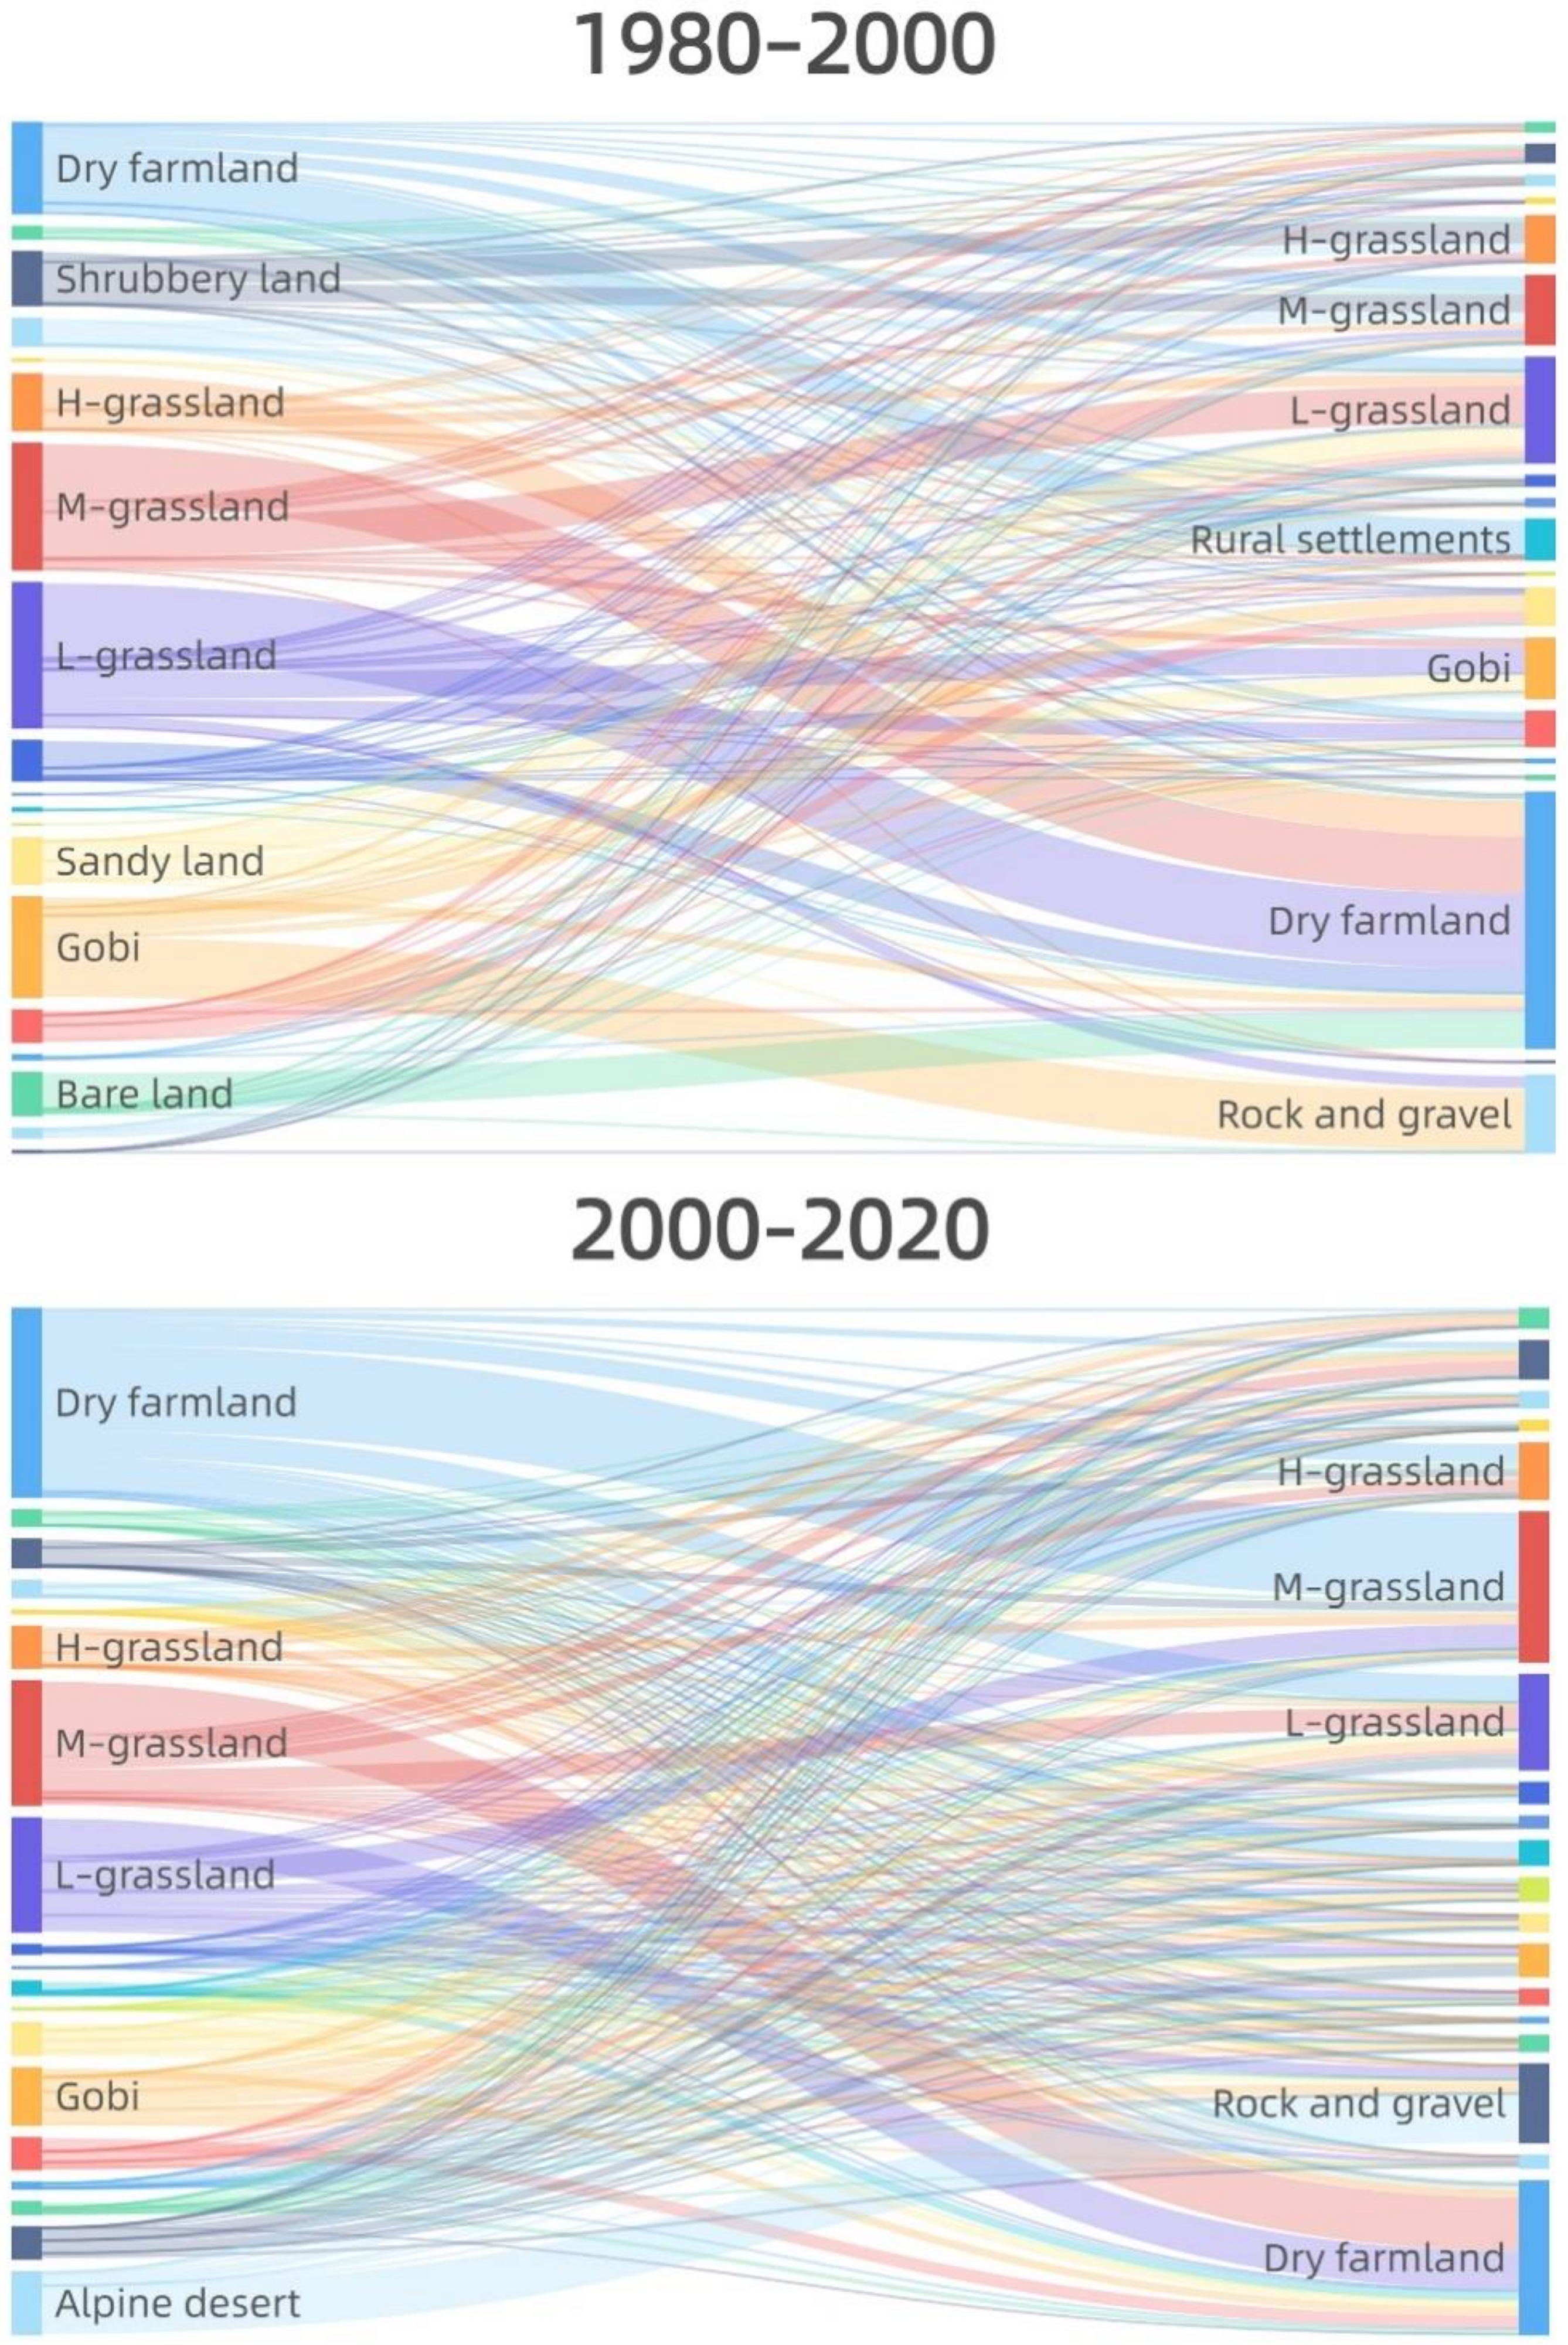
- Throughout 1980–2020, the land-use type of Gansu was dominated by Gobi, dry farmland, middle coverage grassland, low coverage grassland, and rock and gravel. Additionally, the area changes of forests, grasslands, water, and constructions were rising, while dry farmland and unused land showed a trend of decreasing. Besides, LUTC in 2000–2020 has been more dramatic. The largest area of conversion types in the southeastern Gansu was middle coverage grassland, low coverage grassland, and dry farmland, while the northwestern part was dominated by the interconversion of rock and gravel, Gobi, and low coverage grassland.
- (2)
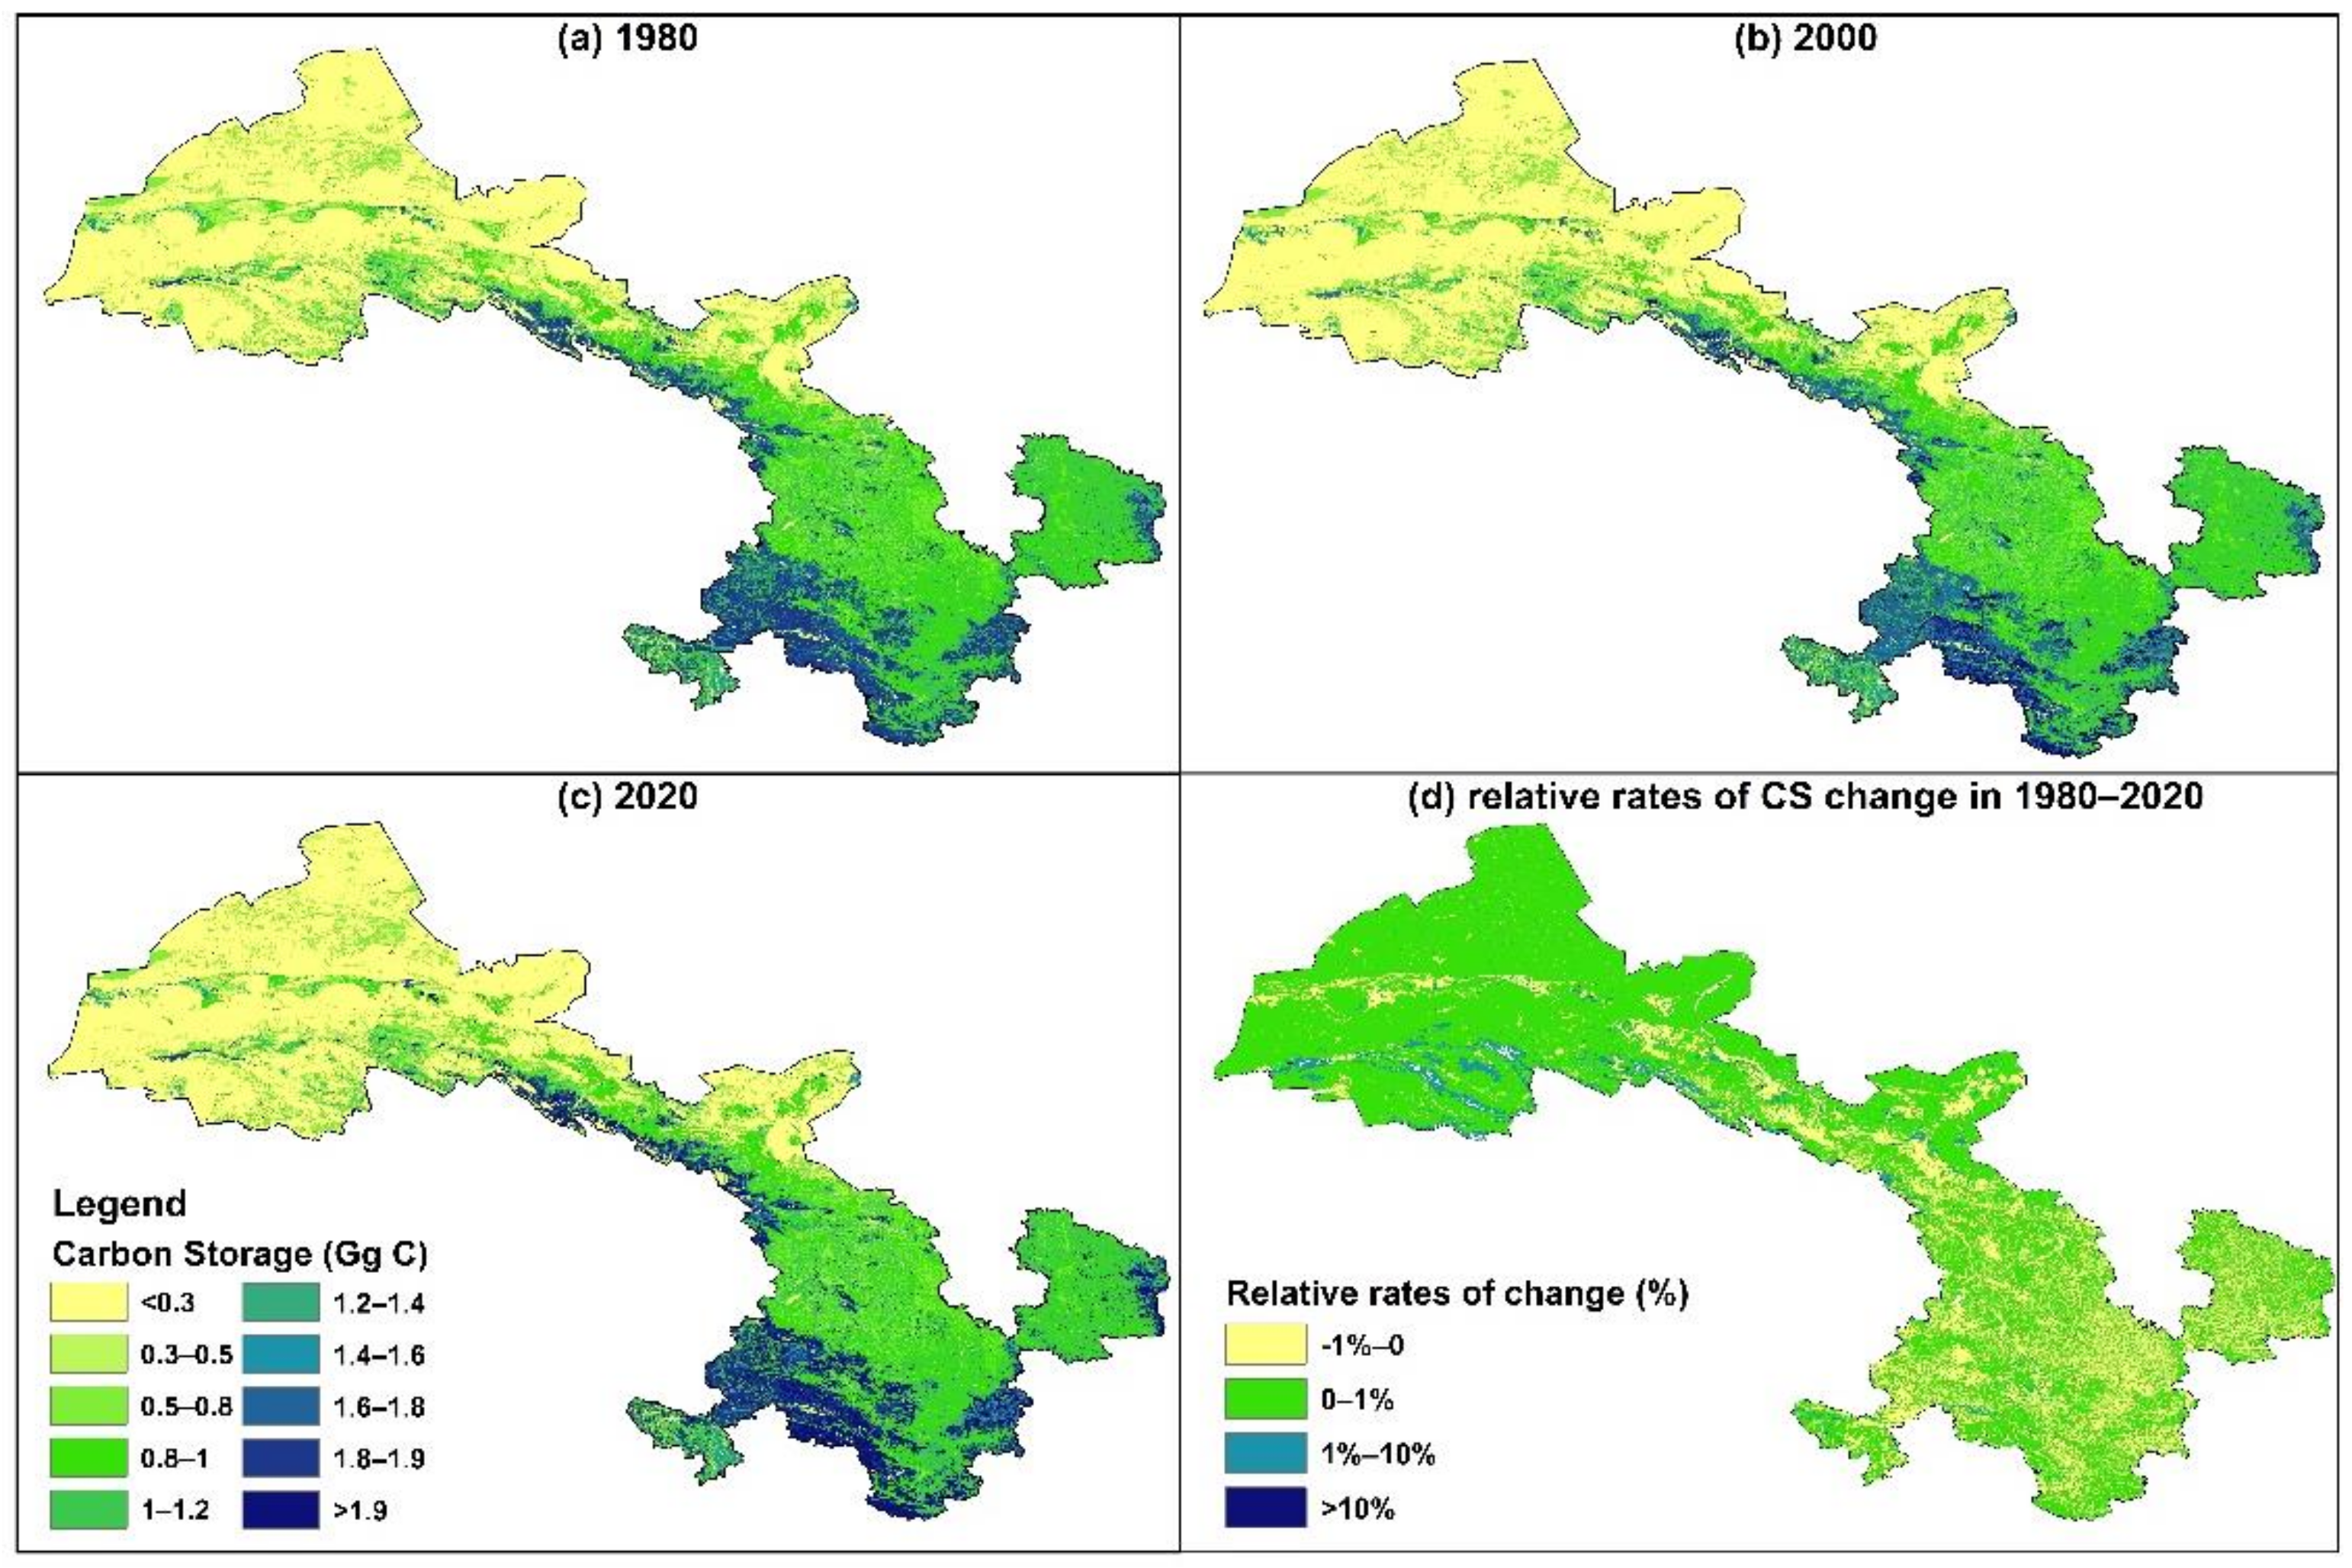
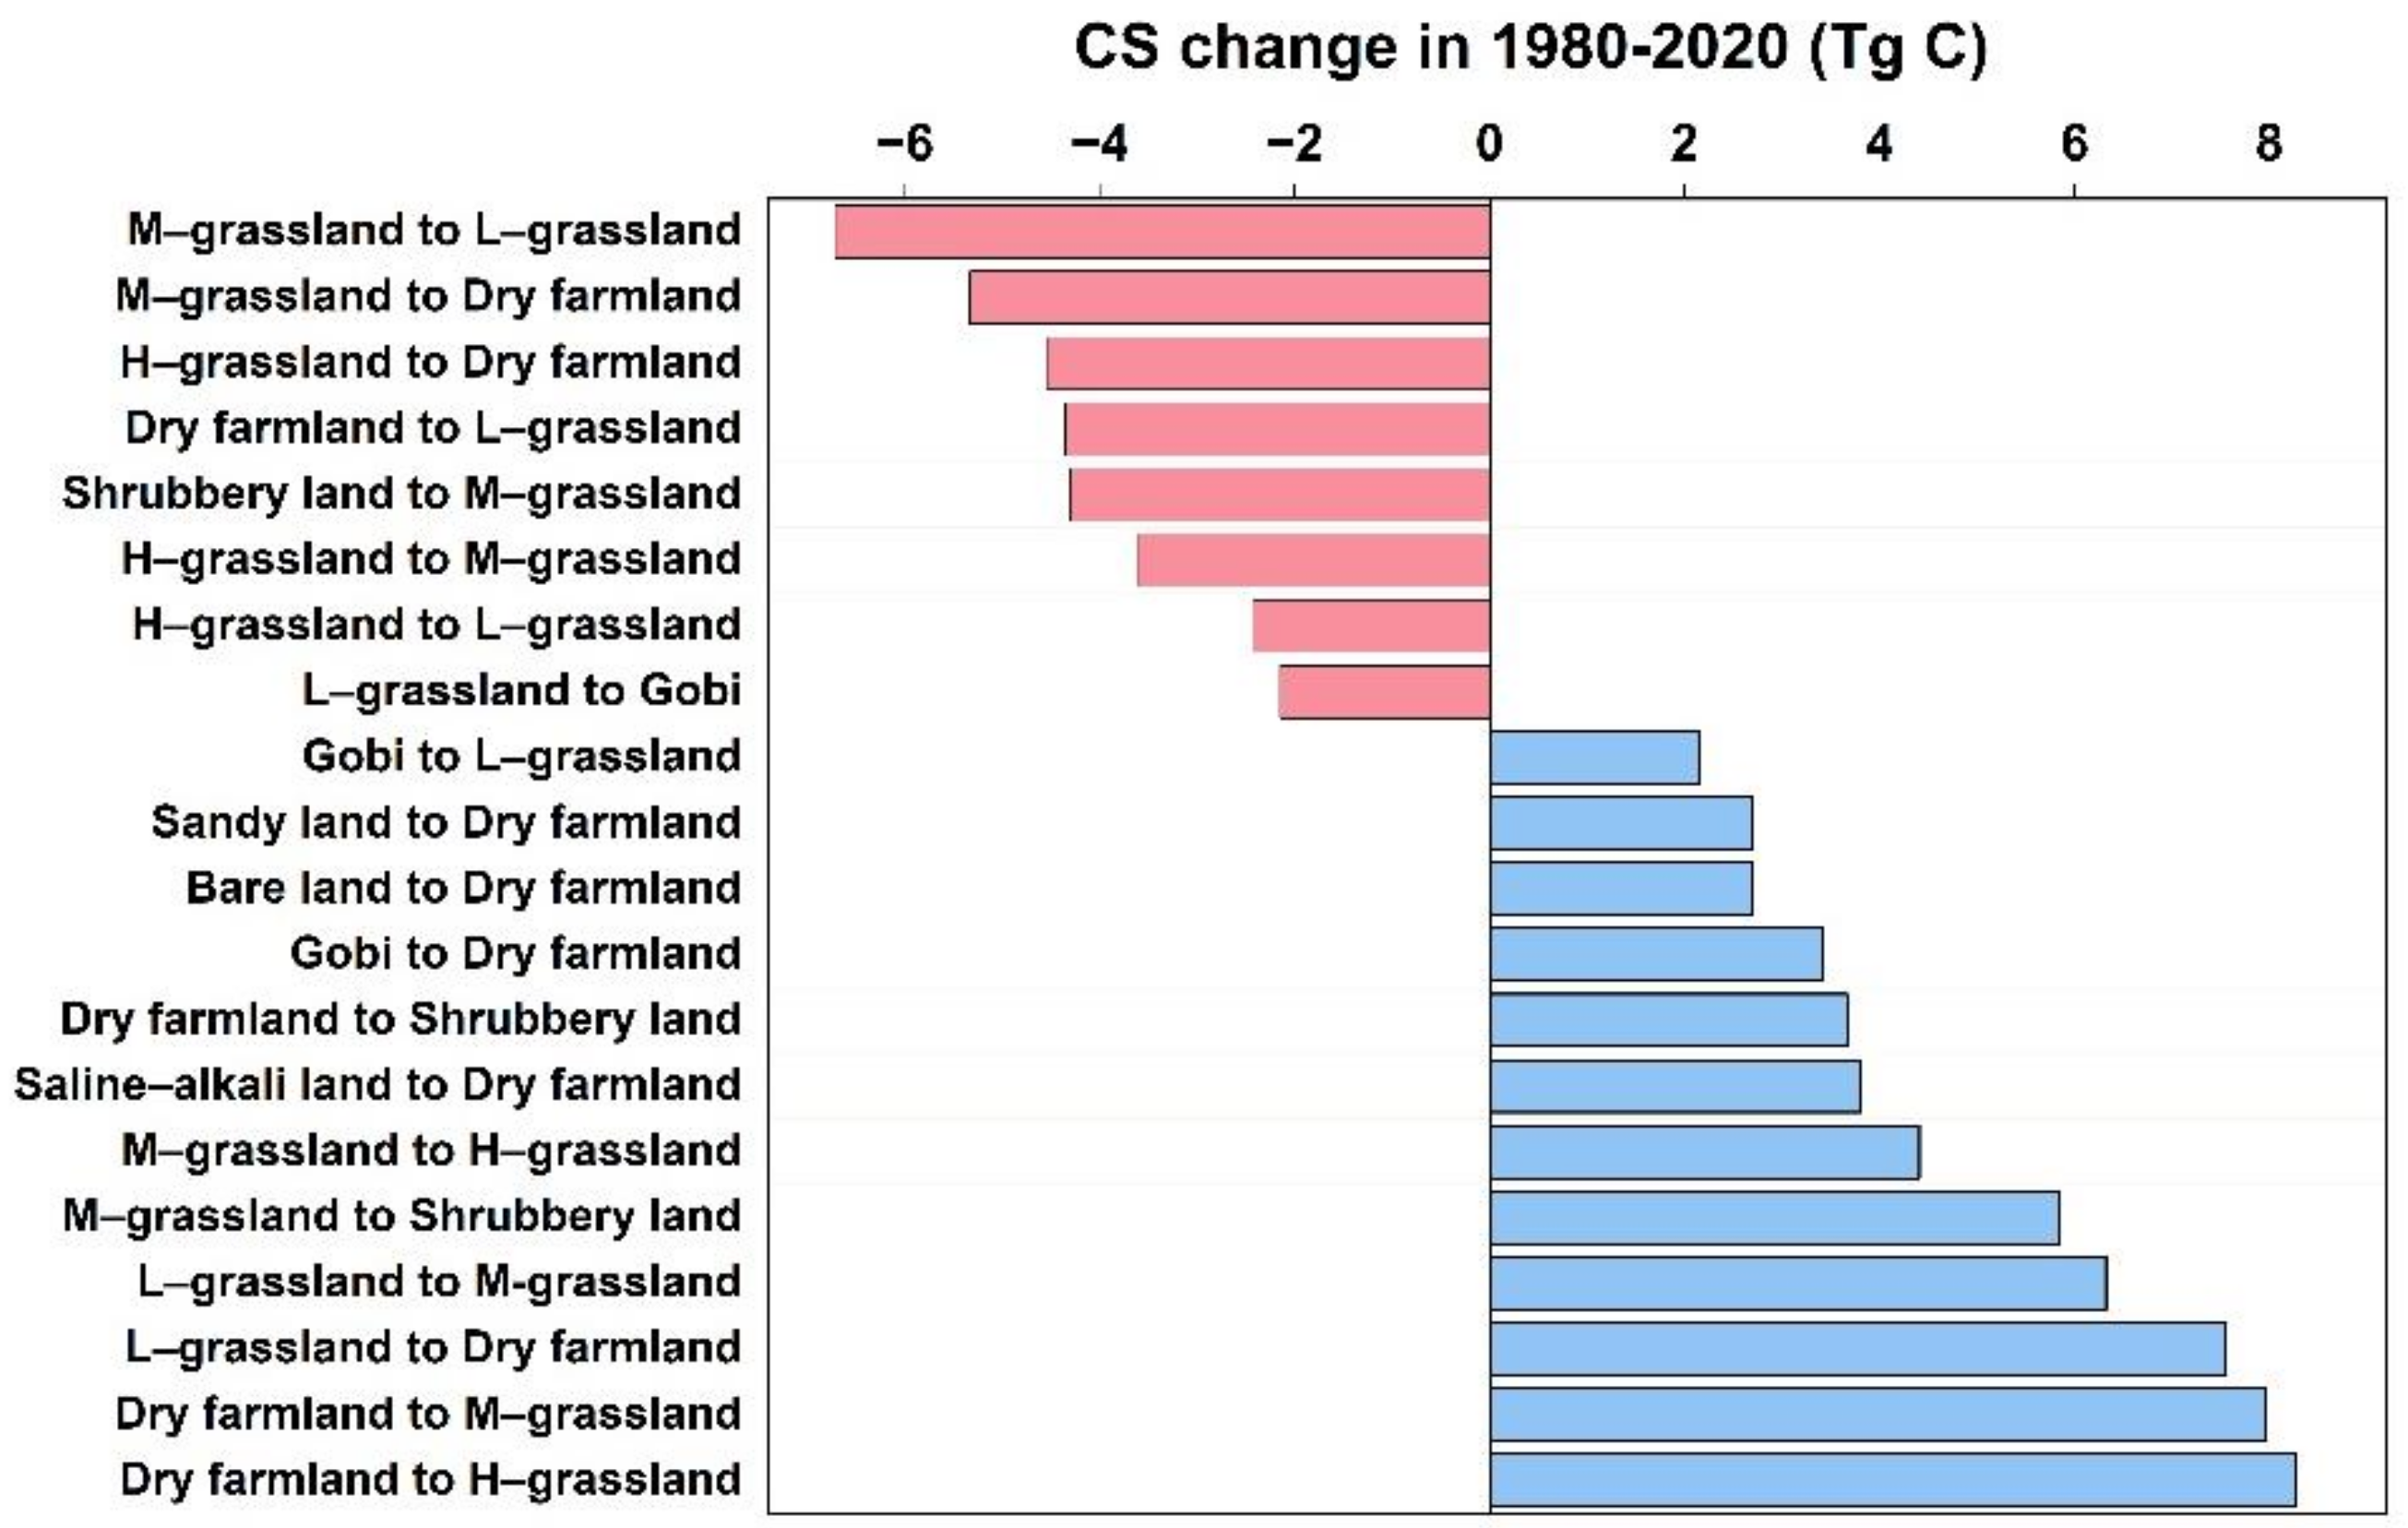
- The carbon storage of terrestrial ecosystem in the Gansu province increased by 208.9 ± 99.85 Tg C with a growth rate of 6.16% from 1980 to 2020. Among this, the LUTC effect contributed 26.89 ± 5.81 Tg C, and other environmental controls together contributed to another 182.01 ± 94.04 Tg C. As for the LUTC effect, the restoration of dry farmland and low carbon density grassland to high carbon density grassland and forest (36.47 Tg C) and degradation of high carbon density grassland and forest to low carbon density grassland (−17.06 Tg C) were the main components of carbon storage changes. The CS in Central Gansu decreased significantly, while that in western Gansu increased, and the alpine desert showed the most significant changes in carbon storage.
- (3)
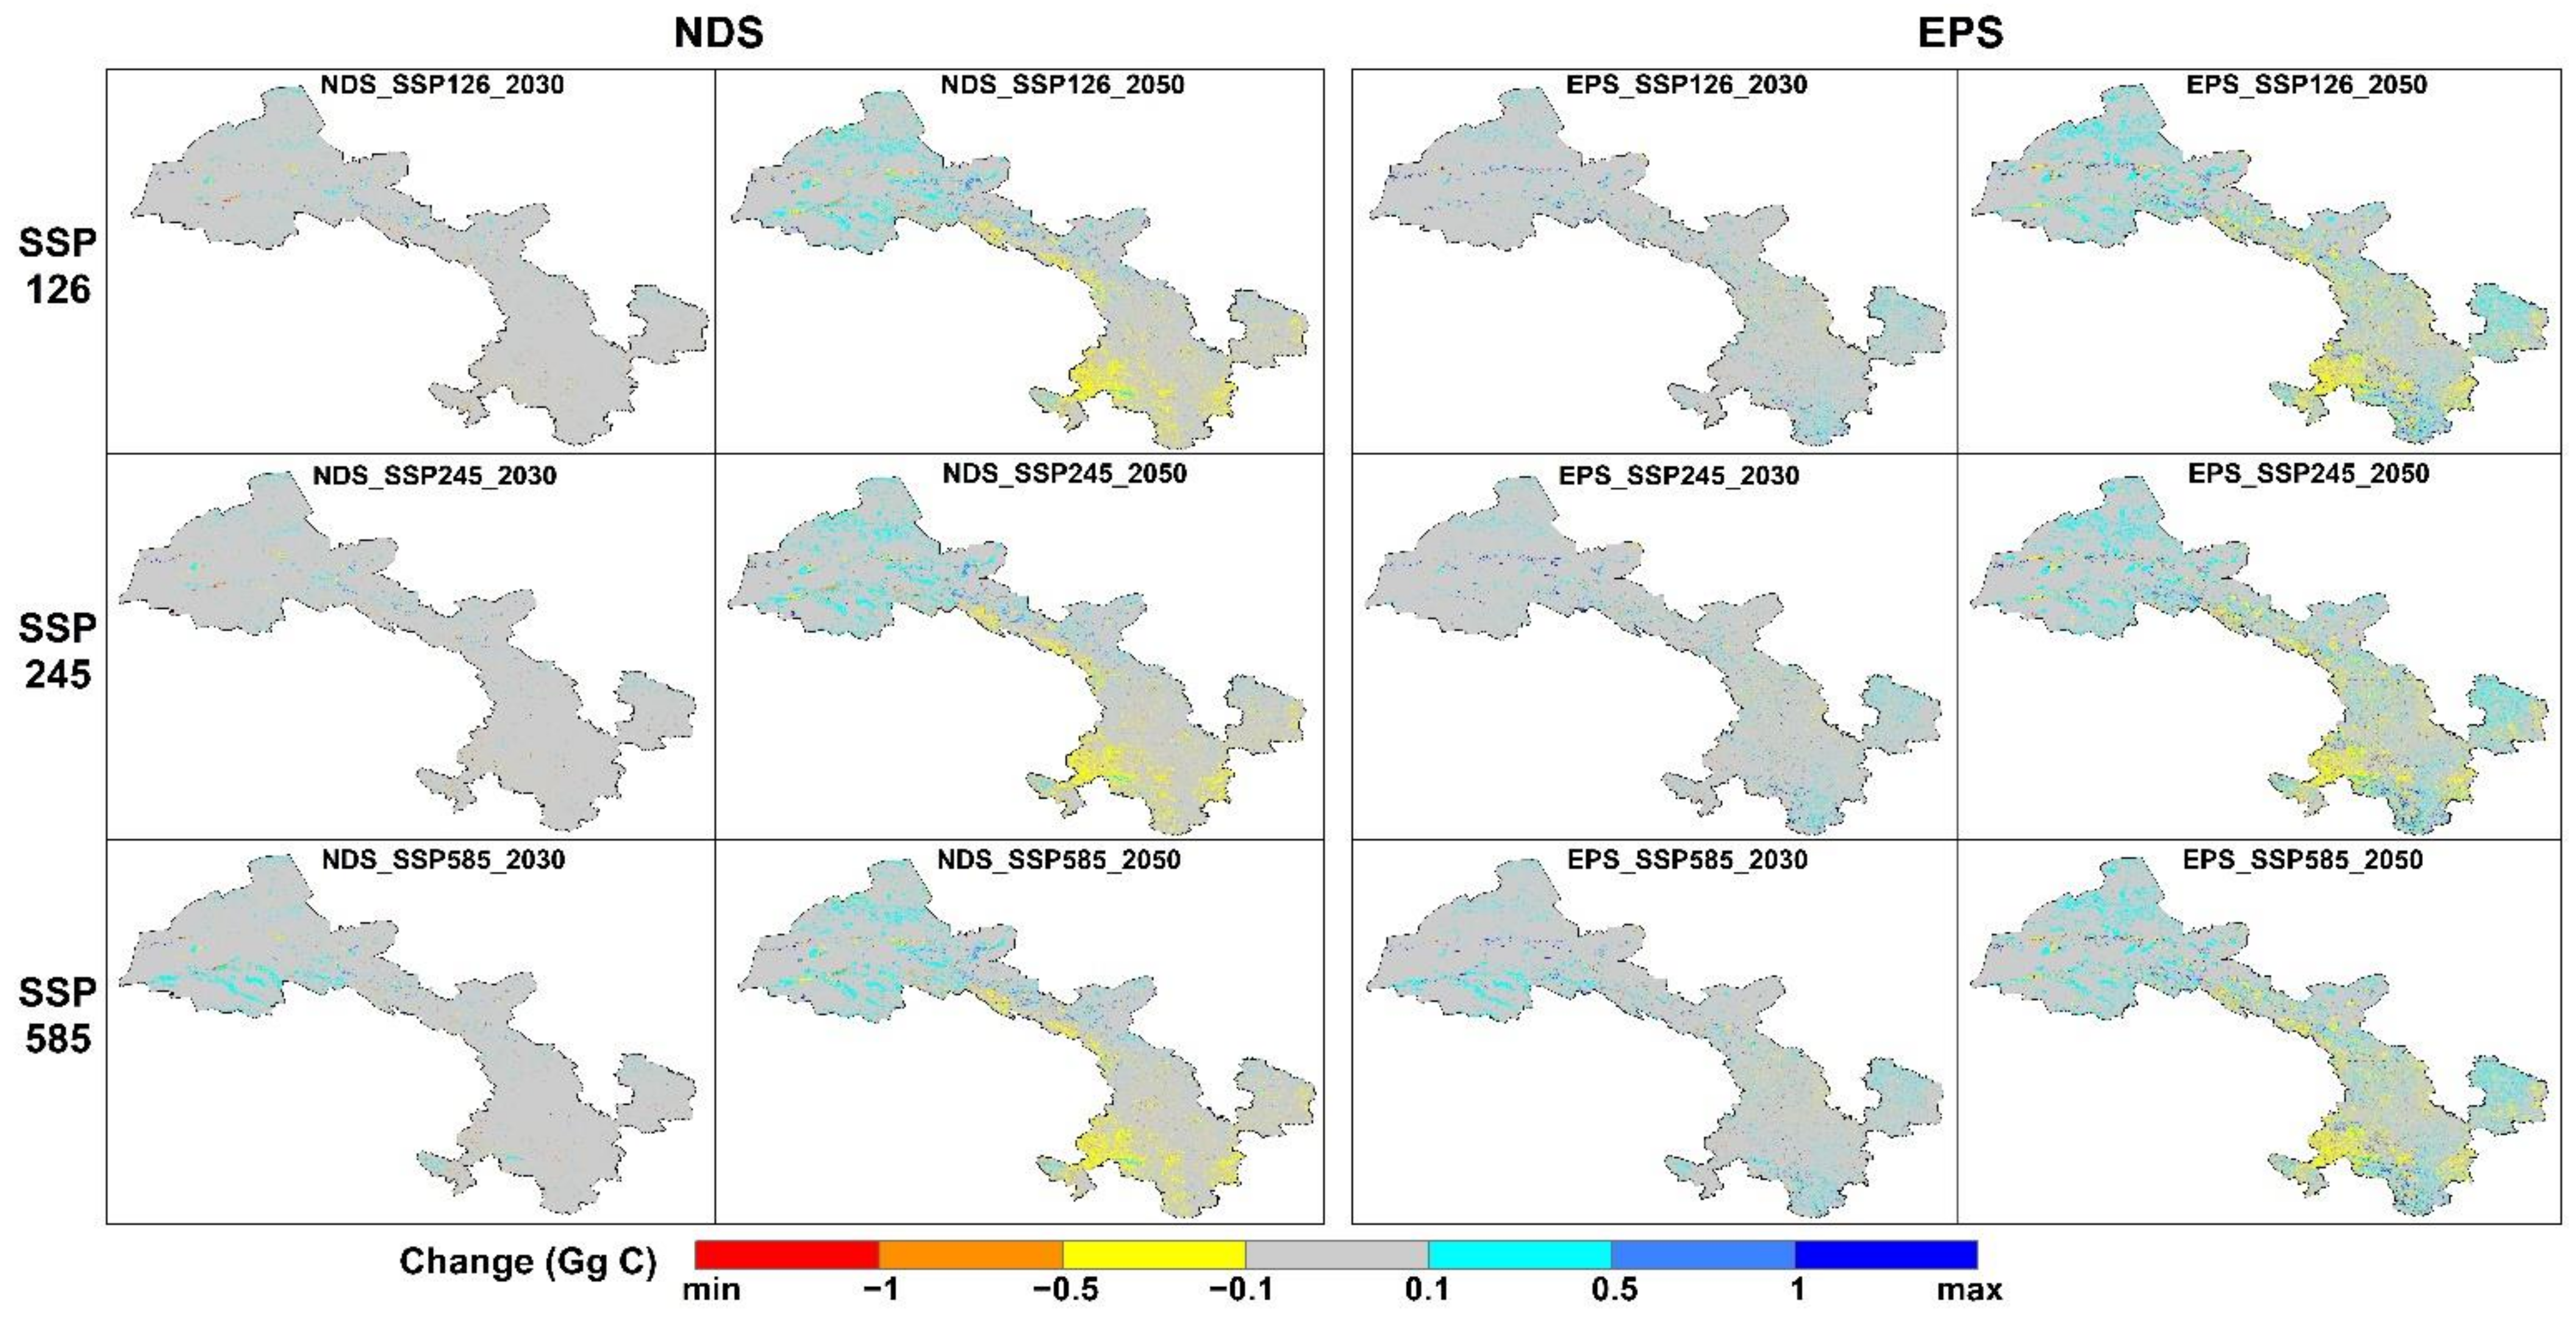
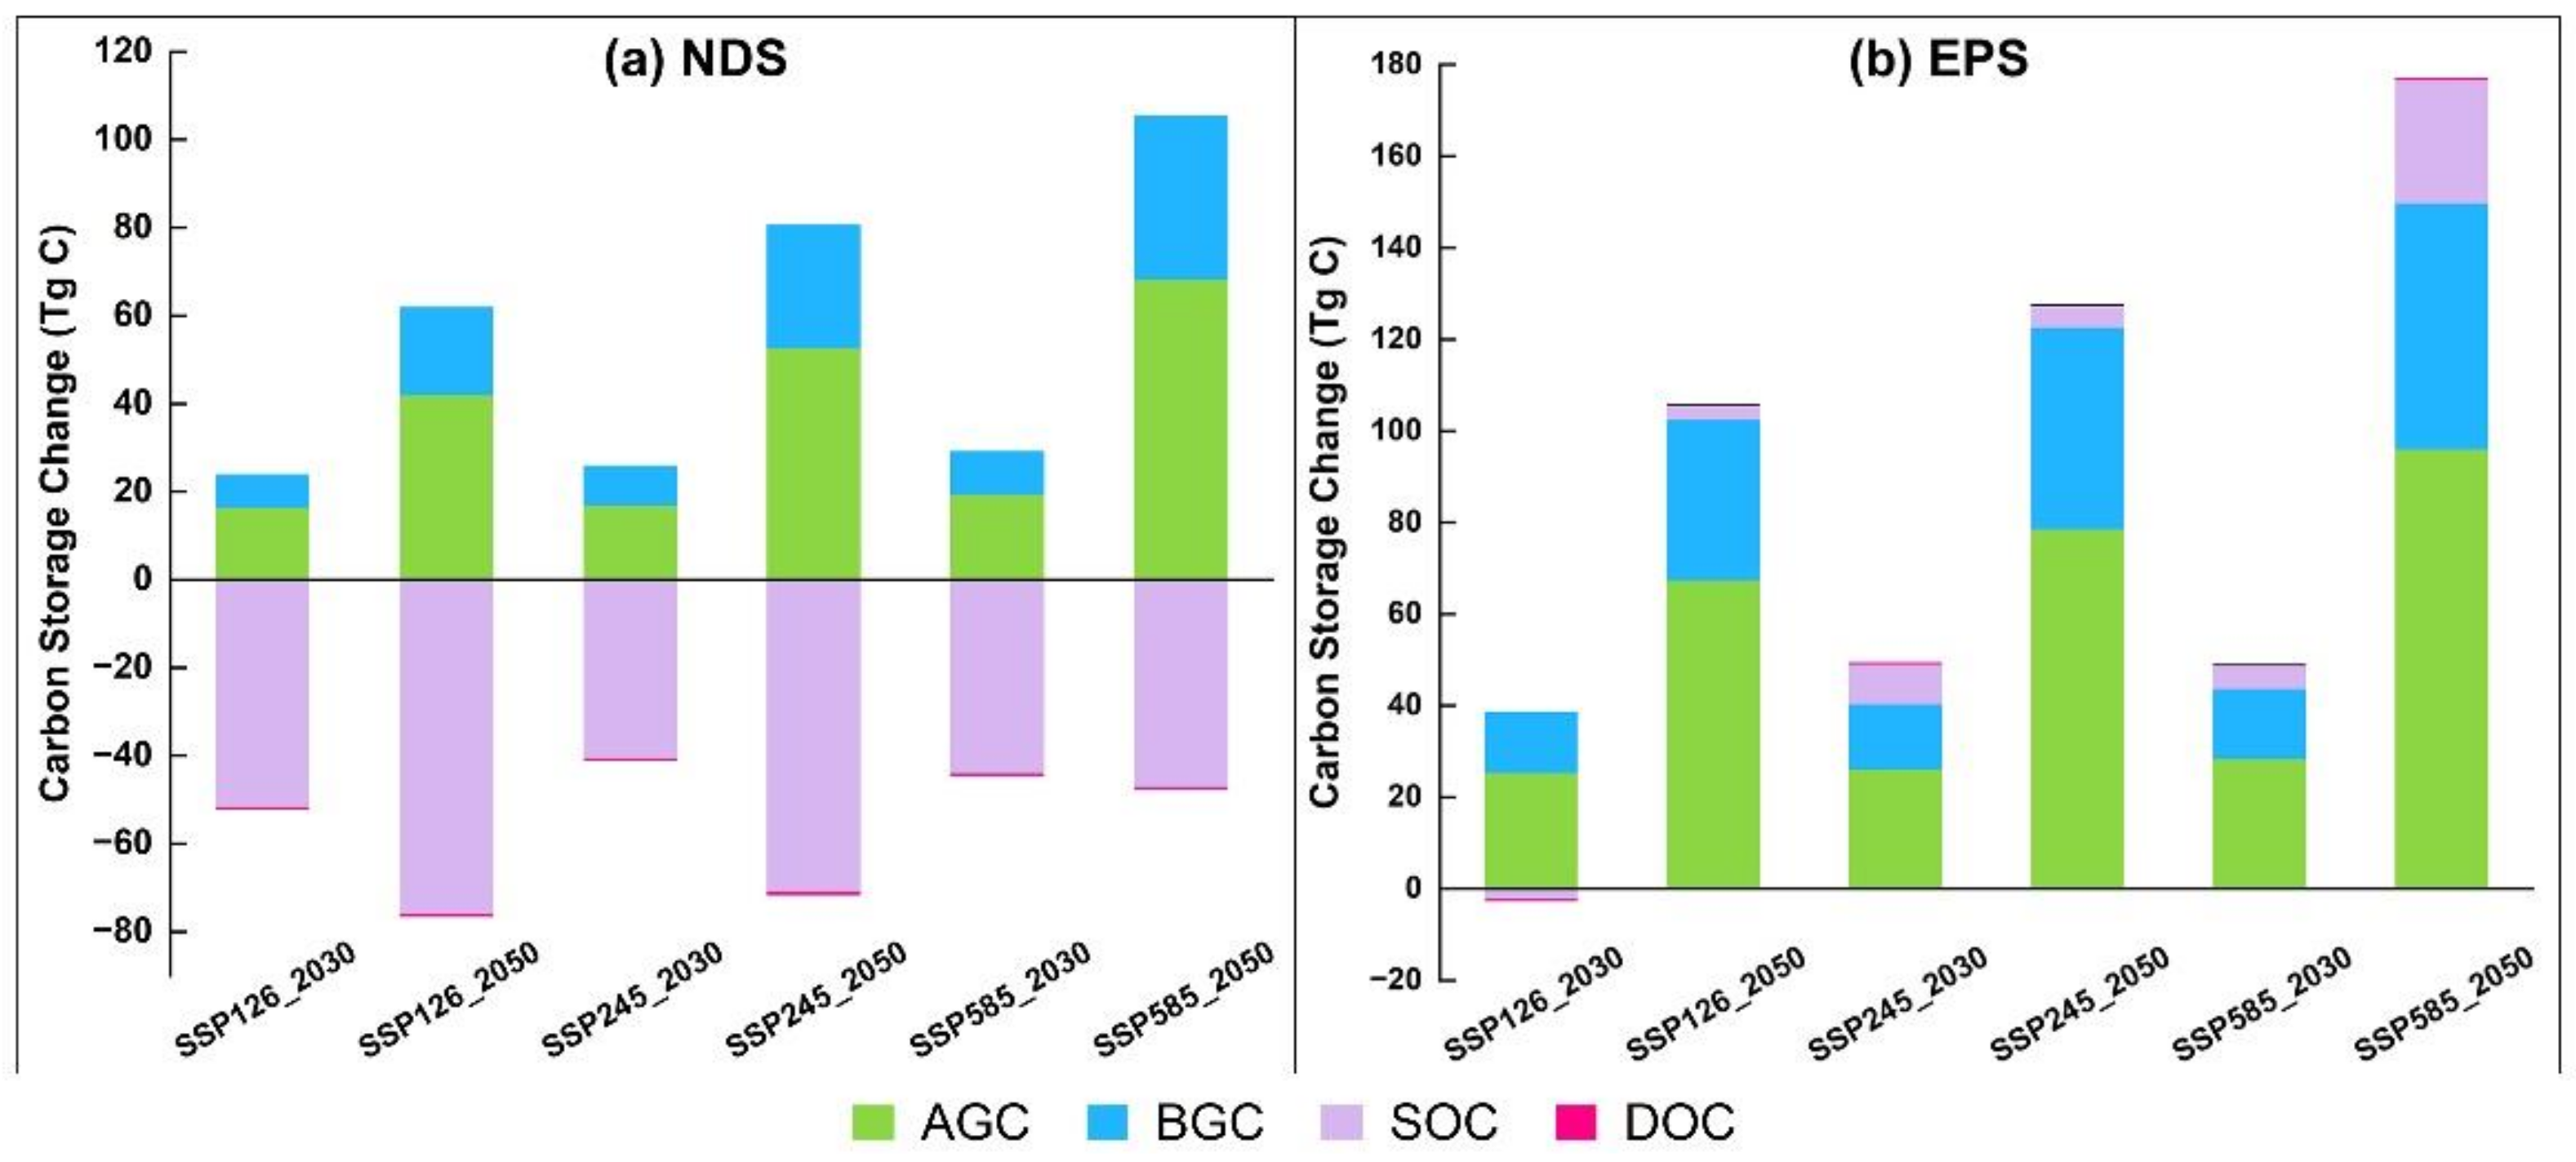
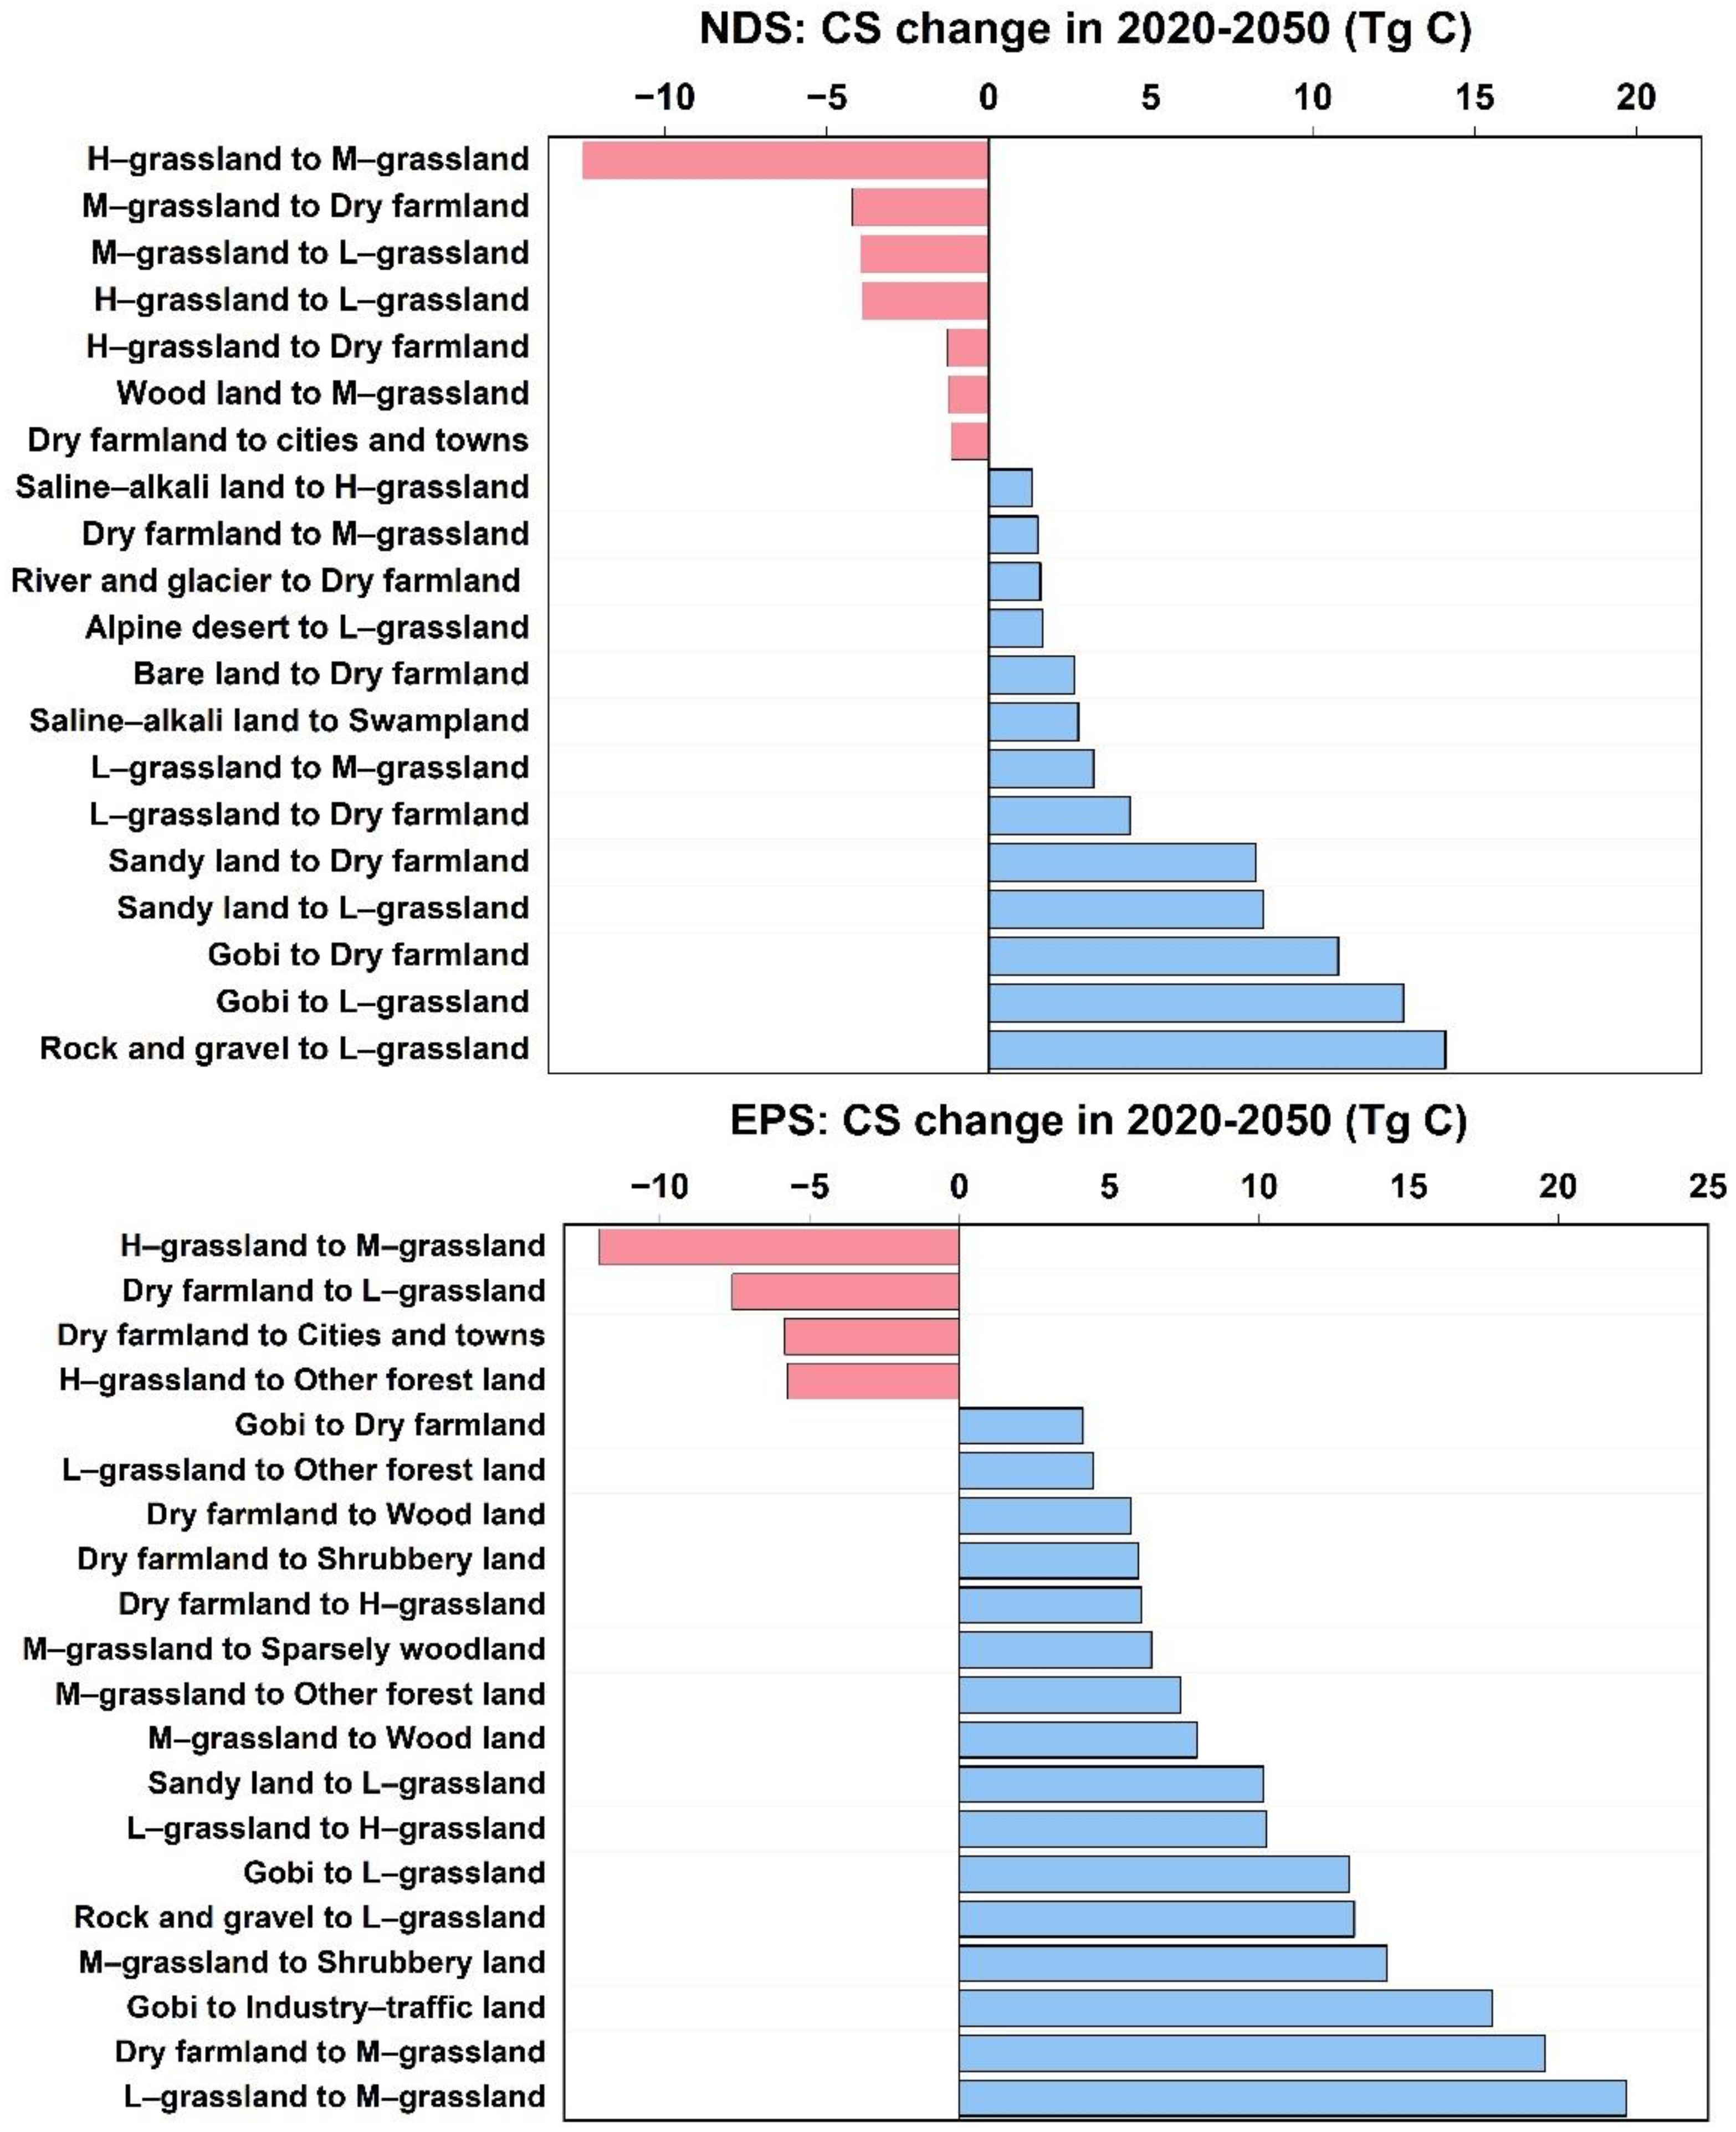
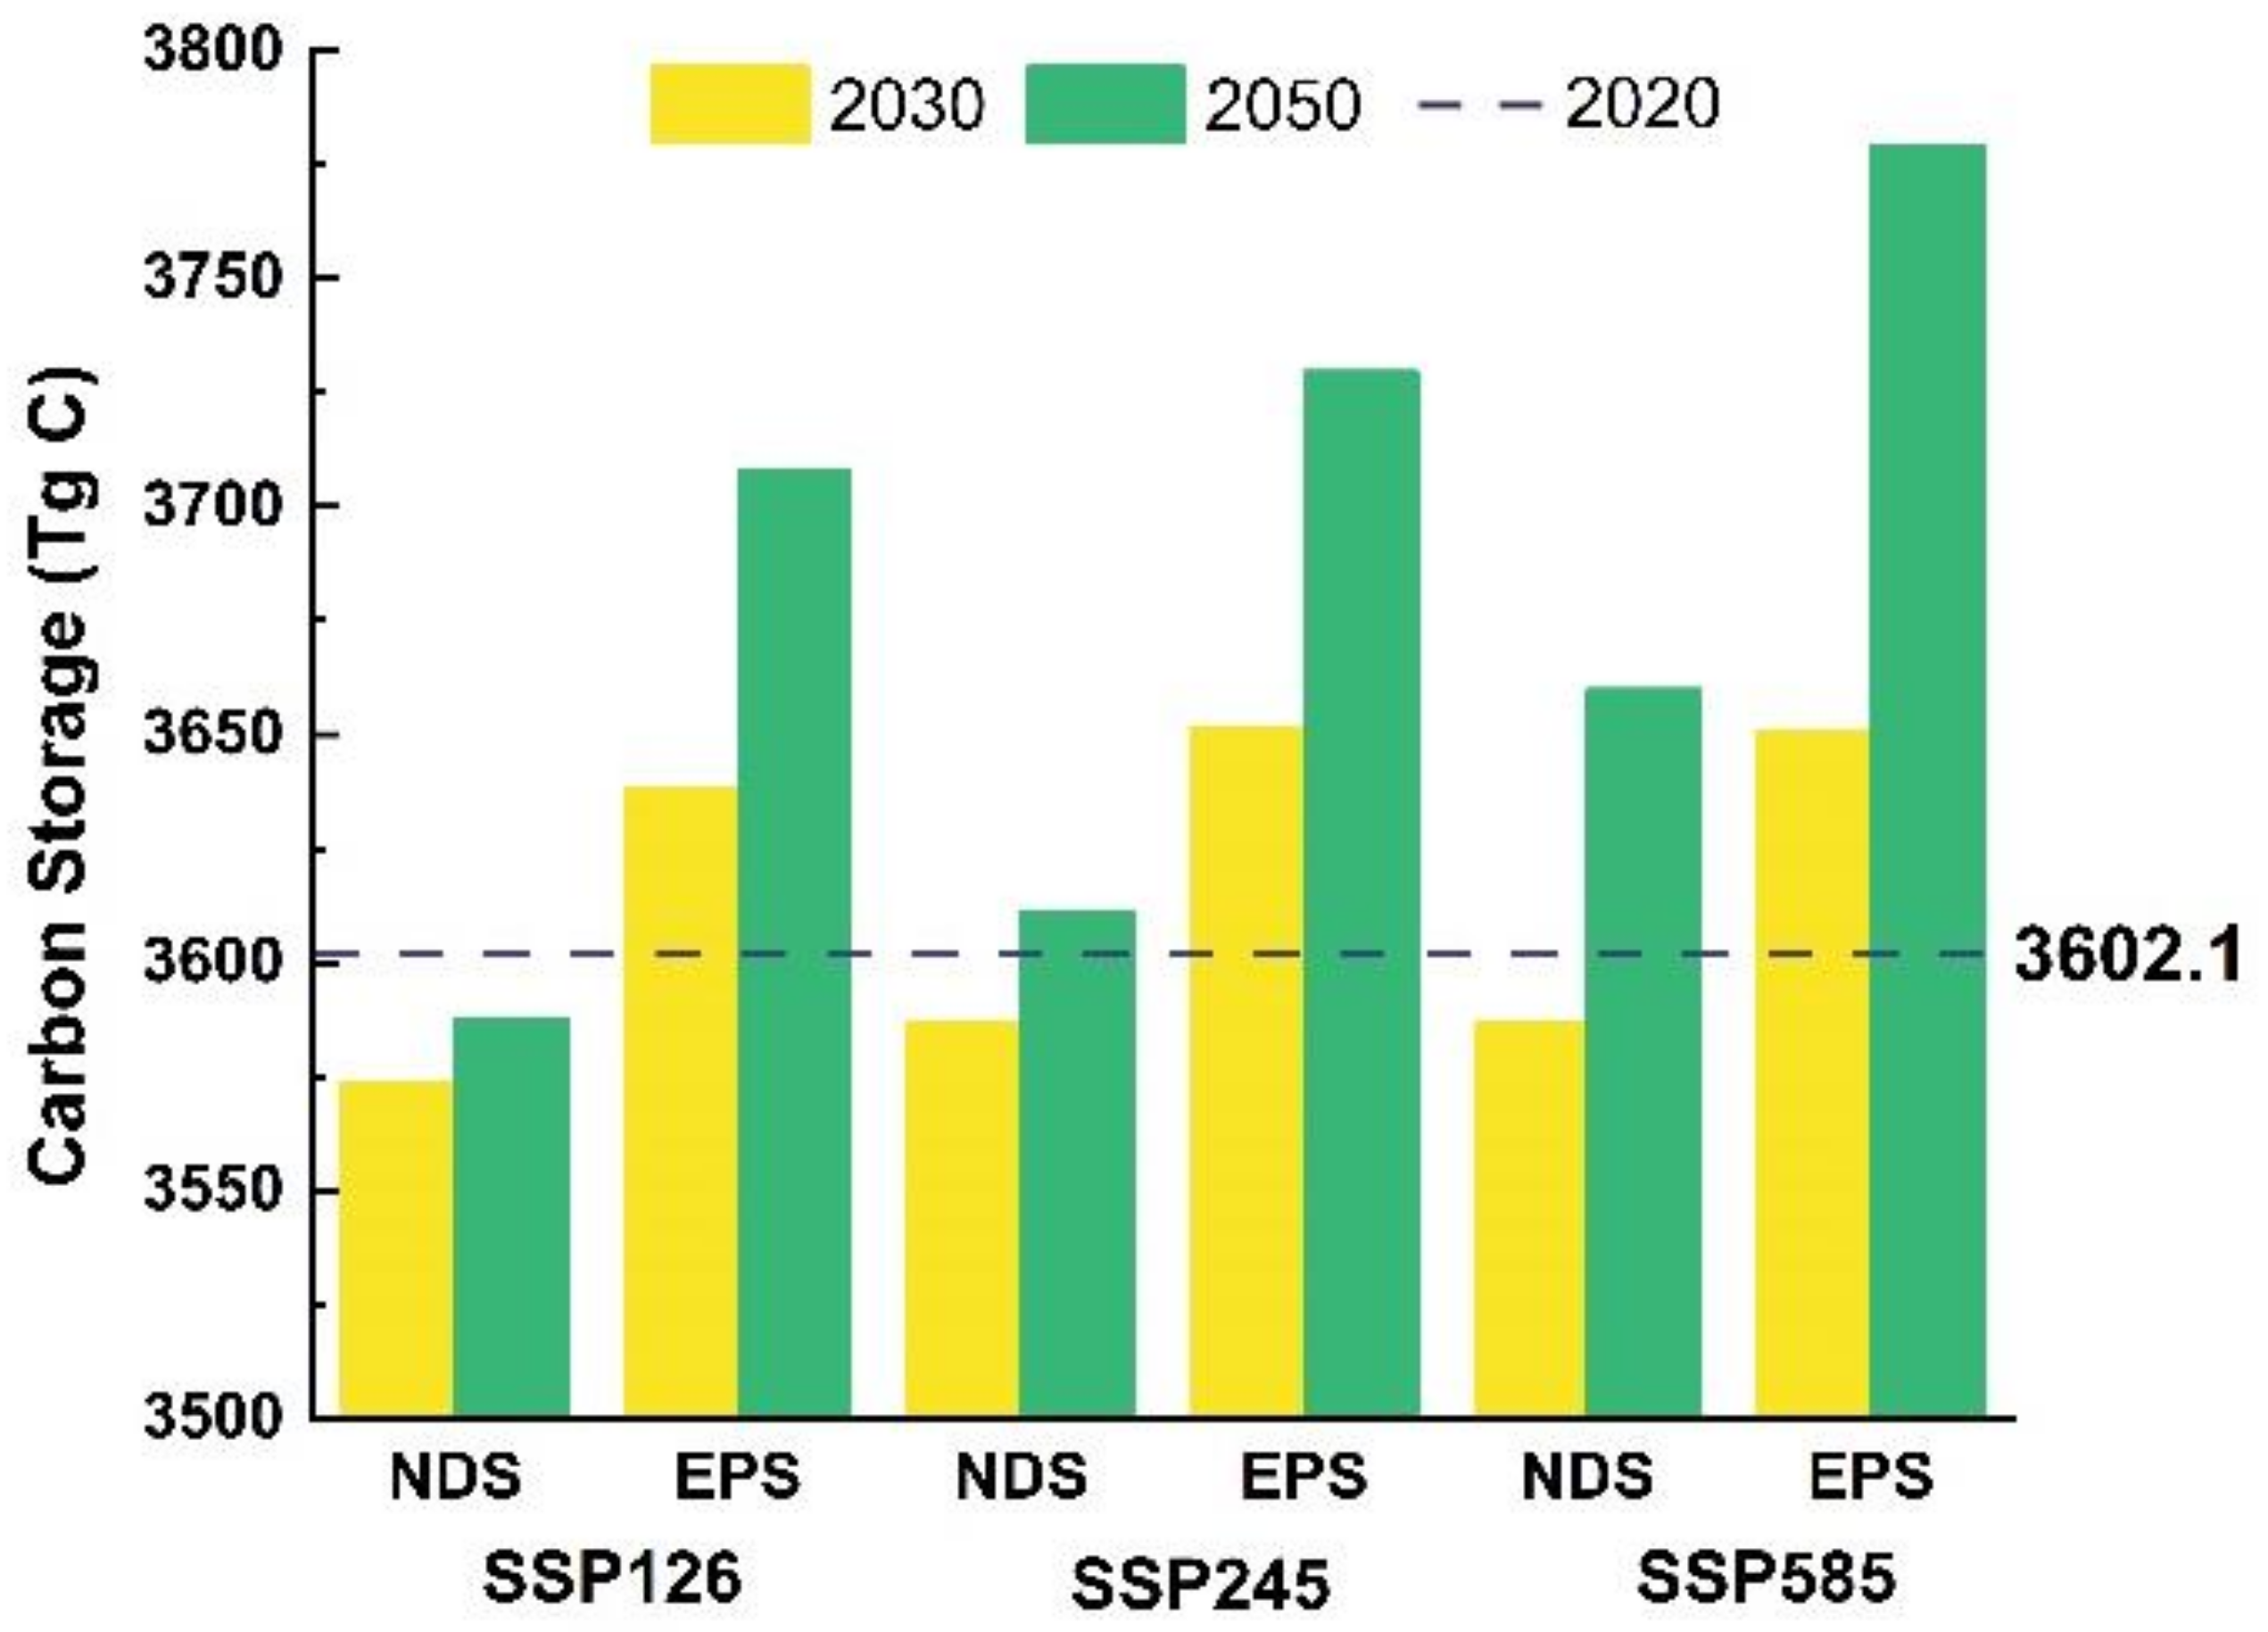
- Under the NDS, carbon storage was expected to exhibit a decrease trend during 2020–2030, while the changes in carbon storage from 2020 to 2050 were −14.69 ± 12.28 Tg C (−0.4%), 9.01 ± 29.12 Tg C (0.25%), and 57.83 ± 53.42 Tg C (1.6%) under the SSP126, SSP245, and SSP585 scenarios, respectively. Under the EPS, the carbon storage corresponding to the future climate scenarios all showed an increasing trend. The LUTC effects were predicted to increase ecosystem carbon storage by 56.46 ± 9.82 Tg C (1.67%) and 165.84 ± 40.06 Tg C (4.9%) under the NDS and EPS from 2020 to 2050, and the management of unused land was the main reason for the growth of carbon storage. Therefore, future carbon sequestration capacity of terrestrial ecosystem may mainly depend on ecological restoration efforts.
Supplementary Materials
Author Contributions
Funding
Acknowledgments
Conflicts of Interest
References
- IPCC. Climate Change 2014: Synthesis Report; Contribution of Working Groups I, II and III to the Fifth Assessment Report of the Intergovernmental Panel on Climate Change; World Meteorological Organization: Geneva, Switzerland, 2014; 151p. [Google Scholar]
- Chacko, S.; Ravichandran, C.; Vairavel, S.M.; Mathew, J. Employing Measurers of Spatial Distribution of Carbon Storage in Periyar Tiger Reserve, Southern Western Ghats, India. J. Geovis. Spat. Anal. 2019, 3, 1. [Google Scholar] [CrossRef]
- Pang, J.X.; Li, H.J.; Lu, C.P.; Lu, C.Y.; Chen, X.P. Regional Differences and Dynamic Evolution of Carbon Emission Intensity of Agriculture Production in China. Int. J. Environ. Res. Public Health 2020, 17, 7541. [Google Scholar] [CrossRef] [PubMed]
- United Nations (UN). “Today Is an Historic Day”, Says Ban, as 175 Countries Sign Paris Climate Accord. UN News 2016. Available online: https://news.un.org/en/story/2016/04/527442-today-historic-day-says-ban-175-countries-sign-paris-climate-accord (accessed on 18 October 2021).
- Jiang, K.J.; Tamura, K.; Hanaoka, T. Can we go beyond INDCs: Analysis of a future mitigation possibility in China, Japan, EU and the U.S. Adv. Clim. Change Res. 2017, 8, 117–122. [Google Scholar] [CrossRef]
- Wang, H.K.; Lu, X.; Deng, Y.; Sun, Y.G.; Nielsen, C.P.; Liu, Y.F.; Zhu, G.; Bu, M.L.; Bi, J.; McElroy, M.B. China’s CO2 peak before 2030 implied from characteristics and growth of cities. Nat. Sustain. 2019, 2, 748–754. [Google Scholar] [CrossRef]
- IPCC. IPCC Special Report on Global Warming of 1.5 °C Geneva; World Meteorological Organization: Geneva, Switzerland, 2018; Available online: https://www.ipcc.ch/sr15/ (accessed on 18 October 2021).
- Zou, C.N.; Xiong, B.; Xue, H.Q.; Zheng, D.W.; Ge, Z.X.; Wang, Y.; Jiang, L.Y.; Pan, S.Q.; Wu, S.T. The role of new energy in carbon neutral. Petrol. Explor. Dev. 2021, 48, 480–491. [Google Scholar] [CrossRef]
- Xia, C.Y. Multi-Scale Studies on Urban Carbon Metabolism from the Perspective of Land Use and Scenario Analysis of Emission Reduction; Zhejiang University: Hangzhou, China, 2019. [Google Scholar] [CrossRef]
- Wang, Z.Y.; Li, X.; Mao, Y.T.; Li, L.; Wang, X.R.; Lin, Q. Dynamic simulation of land use change and assessment of carbon storage based on climate change scenarios at the city level: A case study of Bortala, China. Ecol. Indic. 2022, 134, 108499. [Google Scholar] [CrossRef]
- Xiong, C.H.; Wang, G.L.; Xu, L.T. Spatial differentiation identification of influencing factors of agricultural carbon productivity at city level in Taihu lake basin, China. Sci. Total. Environ. 2021, 800, 149610. [Google Scholar] [CrossRef]
- Chen, B.Y.; Xu, C.; Wu, Y.Y.; Li, Z.W.; Song, M.L.; Shen, Z.Y. Spatiotemporal carbon emissions across the spectrum of Chinese cities: Insights from socioeconomic characteristics and ecological capacity. J. Environ. Manag. 2022, 306, 114510. [Google Scholar] [CrossRef]
- Gonçalves, D.R.P.; Mishra, U.; Wills, S.; Gautam, S. Regional environmental controllers influence continental scale soil carbon stocks and future carbon dynamics. Sci. Rep. 2021, 11, 6474. [Google Scholar] [CrossRef]
- Janes-Bassett, V.; Bassett, R.; Rowe, E.C.; Tipping, E.; Yumashev, D.; Davies, J. Changes in carbon storage since the pre-industrial era: A national scale analysis. Anthropocene 2021, 34, 100289. [Google Scholar] [CrossRef]
- Zhou, R.B.; Lin, M.Z.; Gong, J.Z.; Wu, Z. Spatiotemporal heterogeneity and influencing mechanism of ecosystem services in the Pearl River Delta from the perspective of LUCC. J. Geogr. Sci. 2019, 29, 831–845. [Google Scholar] [CrossRef] [Green Version]
- Adelisardou, F.; Jafari, H.; Malekmohammadi, B.; Minkina, T.; Zhao, W.W.; Karbassi, A. Impacts of land use and land cover change on the interactions among multiple soil-dependent ecosystem services (case study: Jiroft plain, Iran). Environ. Geochem. Health 2021, 43, 11. [Google Scholar] [CrossRef]
- Li, X.D.; Ling, F.; Giles, F.; Du, Y. A superresolution land-cover change detection method using remotely sensed images with different spatial resolutions. IEEE Trans. Geosci. Remote Sens. 2016, 54, 3822–3841. [Google Scholar] [CrossRef]
- Tong, J.H.; Hu, J.H.; Lu, Z.; Sun, H.R.; Yang, X.F. The impact of land use and cover change on soil organic carbon and total nitrogen storage in the Heihe River Basin: A meta-analysis. J. Geogr. Sci. 2019, 29, 1578–1594. [Google Scholar] [CrossRef] [Green Version]
- Wang, Q.Z.; Guan, Q.Y.; Lin, J.K.; Luo, H.P.; Tan, Z.; Ma, Y.R. Simulating land use/ land cover change in an arid region with the coupling models. Ecol. Indic. 2021, 122, 107231. [Google Scholar] [CrossRef]
- Zhu, G.F.; Qiu, D.D.; Zhang, Z.X.; Sang, L.Y.; Liu, Y.W.; Wang, L.; Zhao, K.L.; Ma, H.Y.; Xu, Y.X.; Wan, Q.Z. Land-use changes lead to a decrease in carbon storage in arid region, China. Ecol. Indic. 2021, 127, 107770. [Google Scholar] [CrossRef]
- Leh, M.D.K.; Matlock, M.D.; Cummings, E.C.; Nalley, L.L. Quantifying and mapping multiple ecosystem services change in West Africa. Agric. Ecosyst. Environ. 2013, 165, 6–18. [Google Scholar] [CrossRef]
- Dargains, A.; Cabral, P. A GIS-based methodology for sustainable farming planning: Assessment of land use/cover changes and carbon dynamics at farm level. Land Use Policy 2021, 111, 105788. [Google Scholar] [CrossRef]
- Araya, Y.H.; Cabral, P. Analysis and Modeling of Urban Land Cover Change in Setúbal and Sesimbra, Portugal. Remote Sens. 2010, 2, 1549. [Google Scholar] [CrossRef] [Green Version]
- Azizi, A.; Malakmohamadi, B.; Jafari, H.R. Land use and land cover spatiotemporal dynamic pattern and predicting changes using integrated CA-Markov model. Glob. J. Enviro. Sci. Manag. 2016, 2, 223–234. [Google Scholar] [CrossRef]
- Chen, G.Z.; Li, X.; Liu, X.P.; Chen, Y.M.; Liang, X.; Leng, J.Y.; Xu, X.C.; Liao, W.L.; Qiu, Y.A.; Wu, Q.L.; et al. Global projections of future urban land expansion under shared socioeconomic pathways. Nat. Commun. 2020, 11, 537. [Google Scholar] [CrossRef] [PubMed] [Green Version]
- Jiang, X.W.; Bai, J.J. Predicting and assessing changes in NPP based on multi-scenario land use and cover simulations on the Loess Plateau. J. Geogr. Sci. 2021, 31, 977–996. [Google Scholar] [CrossRef]
- Raji, S.A.; Odunuga, S.; Fasona, M. Spatially Explicit Scenario Analysis of Habitat Quality in a Tropical Semi-arid Zone: Case Study of the Sokoto–Rima Basin. J. Geovis. Spat. Anal. 2022, 6, 11. [Google Scholar] [CrossRef]
- Liang, X.; Guan, Q.F.; Clarke, K.C.; Liu, S.S.; Wang, B.Y.; Yao, Y. Understanding the drivers of sustainable land expansion using a patch-generating land use simulation (PLUS) model: A case study in Wuhan, China. Comput. Environ. Urban. 2021, 85, 101569. [Google Scholar] [CrossRef]
- Li, C.; Wu, Y.M.; Gao, B.P.; Zheng, K.J.; Wu, Y.; Li, C. Multi-scenario simulation of ecosystem service value for optimization of land use in the Sichuan-Yunnan ecological barrier, China. Ecol. Indic. 2021, 132, 108328. [Google Scholar] [CrossRef]
- Xu, J.R.; Renaud, F.G.; Barrett, B. Modelling land system evolution and dynamics of terrestrial carbon stocks in the Luanhe River Basin, China: A scenario analysis of trade-offs and synergies between sustainable development goals. Sustain. Sci. 2021. [Google Scholar] [CrossRef] [PubMed]
- Trisurat, Y.; Eawpanich, P.; Kalliola, R. Integrating land use and climate change scenarios and models into assessment of forested watershed services in Southern Thailand. Environ. Res. 2016, 147, 611–620. [Google Scholar] [CrossRef]
- Jiang, W.G.; Deng, Y.; Tang, Z.H.; Lei, X.; Chen, Z. Modelling the potential impacts of urban ecosystem changes on carbon storage under different scenarios by linking the CLUE-S and the InVEST models. Ecol. Model. 2017, 345, 30–40. [Google Scholar] [CrossRef]
- Matlhodi, B.; Kenabatho, P.K.; Parida, B.P.; Maphanyane, J.G. Analysis of the Future Land Use Land Cover Changes in the Gaborone Dam Catchment Using CA-Markov Model: Implications on Water Resources. Remote Sens. 2021, 13, 2427. [Google Scholar] [CrossRef]
- Mokarram, M.; Pourghasemi, H.R.; Hu, M.; Zhang, H.C. Determining and forecasting drought susceptibility in southwestern Iran using multi-criteria decision-making (MCDM) coupled with CA-Markov model. Sci. Total. Environ. 2021, 781, 146703. [Google Scholar] [CrossRef]
- Zhao, M.M.; He, Z.B.; Du, J.; Chen, L.F.; Lin, P.F.; Fang, S. Assessing the effects of ecological engineering on carbon storage by linking the CA-Markov and InVEST models. Ecol. Indic. 2019, 98, 19–38. [Google Scholar] [CrossRef]
- Liu, Y.; Zhang, J.; Zhou, D.M.; Ma, J.; Dang, R.; Ma, J.J.; Zhu, X.Y. Temporal and spatial variation of carbon storage in the Shule River Basin based on InVEST model. Acta Ecol. Sinica 2021, 41, 4052–4065. [Google Scholar] [CrossRef]
- Rimal, B.; Keshtkar, H.; Sharma, R.; Stork, N.; Rijal, S.; Kunwar, R. Simulating urban expansion in a rapidly changing landscape in eastern Tarai, Nepal. Environ. Monit. Assess. 2019, 191, 255. [Google Scholar] [CrossRef]
- Qian, W.Y.; Guan, W.H.; Huang, X.J. Assessing the Potential Impact of Land Use on Carbon Storage Driven by Economic Growth: A Case Study in Yangtze River Delta Urban Agglomeration. Int. J. Environ. Res. Public Health 2021, 18, 11924. [Google Scholar] [CrossRef]
- Cai, W.B.; Peng, W.T. Exploring Spatiotemporal Variation of Carbon Storage Driven by Land Use Policy in the Yangtze River Delta Region. Land 2021, 10, 1120. [Google Scholar] [CrossRef]
- Li, Y.G.; Liu, W.; Feng, Q.; Zhu, M.; Yang, L.S.; Zhang, J.T. Effects of land use and land cover change on soil organic carbon storage in the Hexi regions, Northwest China. J. Environ. Manag. 2022, 312, 114911. [Google Scholar] [CrossRef]
- Liu, F.; Wu, H.Y.; Zhao, Y.G.; Li, D.C.; Yang, J.L.; Song, X.D.; Shi, Z.; Zhu, A.X.; Zhang, G.L. Mapping high resolution National Soil Information Grids of China. Sci. Bull. 2021, 67, 328–340. [Google Scholar] [CrossRef]
- Liu, L.J.; Liang, Y.J.; Hashimoto, S. Integrated assessment of land-use/coverage changes and their impacts on ecosystem services in Gansu province, northwest China: Implications for sustainable development goals. Sustain. Sci. 2020, 15, 297–314. [Google Scholar] [CrossRef]
- Wen, X.; Wu, X.; Meng, G. Spatiotemporal variability of temperature and precipitation in Gansu province (Northwest China) during 1951–2015. Atmos. Res. 2017, 197, 132–149. [Google Scholar] [CrossRef]
- Lu, H.; Dong, J.R.; He, S.J.; Xie, Y.W. Vegetation change trend and persistence analysis of the mountainoasis-desert system in Hexi region from 2000 to 2017. J. Lanzhou Univ. Nat. Sci. 2021, 57, 99–108. [Google Scholar] [CrossRef]
- Lai, L.; Huang, X.J.; Yang, H.; Chuai, X.W.; Zhang, M.; Zhong, T.Y.; Chen, Z.G.; Chen, Y.; Wang, X.; Thompson, J.R. Carbon emissions from land-use change and management in China between 1990 and 2010. Sci. Adv. 2016, 2, e1601063. [Google Scholar] [CrossRef] [Green Version]
- Liang, Y.J.; Liu, L.J.; Huang, J.J. Integrating the SD-CLUE-S and InVEST models into assessment of oasis carbon storage in northwestern China. PLoS ONE 2017, 12, e0172494. [Google Scholar] [CrossRef]
- Li, K.M.; Cao, J.J.; Adamowski, J.F.; Biswas, A.; Zhou, J.J.; Liu, Y.J.; Zhang, Y.K.; Liu, C.F.; Dong, X.G.; Qin, Y.L. Assessing the effects of ecological engineering on spatiotemporal dynamics of carbon storage from 2000 to 2016 in the Loess Plateau area using the InVEST model: A case study in Huining County, China. Environ. Dev. 2021, 39, 100641. [Google Scholar] [CrossRef]
- Spawn, S.A.; Gibbs, H.K. Global Aboveground and Belowground Biomass Carbon Density Maps for the Year 2010; ORNL DAAC: Oak Ridge, TN, USA, 2020. [Google Scholar] [CrossRef]
- Fang, X.; Zhang, C.; Zhang, Y.N.; Kang, J.F. A Dataset of Organic Carbon Storage and Carbon Dynamic in rid and Semiarid China from 1980 to 2014 [DS/OL]. Science Data Bank. 2018. Available online: https://www.scidb.cn/en/detail?dataSetId=633694461100032002 (accessed on 18 October 2021). [CrossRef]
- Spawn, S.A.; Sullivan, C.C.; Lark, T.J.; Gibbs, H.K. Harmonized global maps of above and belowground biomass carbon density in the year 2010. Sci. Data 2020, 7, 112. [Google Scholar] [CrossRef]
- Peng, S.Z.; Ding, Y.X.; Liu, W.Z.; Li, Z. 1 km monthly temperature and precipitation dataset for China from 1901 to 2017. Earth Syst. Sci. Data 2019, 11, 1931–1946. [Google Scholar] [CrossRef] [Green Version]
- Peng, S.Z.; Ding, Y.X.; Wen, Z.M.; Chen, Y.M.; Cao, Y.; Ren, J.Y. Spatiotemporal change and trend analysis of potential evapotranspiration over the Loess Plateau of China during 2011–2100. Agric. For. Meteorol. 2017, 233, 183–194. [Google Scholar] [CrossRef] [Green Version]
- Ding, Y.X.; Peng, S.Z. Spatiotemporal Trends and Attribution of Drought across China from 1901–2100. Sustainability 2020, 12, 477. [Google Scholar] [CrossRef] [Green Version]
- Ding, Y.X.; Peng, S.Z. Spatiotemporal change and attribution of potential evapotranspiration over China from 1901 to 2100. Theor. Appl. Climatol. 2021, 145, 79–94. [Google Scholar] [CrossRef]
- Peng, S. 1-km Monthly Precipitation Dataset for China (1901–2020); National Tibetan Plateau Data Center, Northwest A&F University: Xianyang, China, 2020. [Google Scholar] [CrossRef]
- Peng, S. 1 km Multi-Scenario and Multi-Model Monthly Precipitation Data for China in 2021–2100; National Tibetan Plateau Data Center, Northwest A&F University: Xianyang, China, 2022. [Google Scholar] [CrossRef]
- Chen, S.P.; Wang, W.T.; Xu, W.T.; Wang, Y.; Wan, H.W.; Chen, D.M.; Tang, Z.Y.; Tang, X.L.; Zhou, G.Y.; Xie, Z.Q.; et al. Plant diversity enhances productivity and soil carbon storage. Proc. Natl. Acad. Sci. USA 2018, 115, 4027–4032. [Google Scholar] [CrossRef] [Green Version]
- Fang, J.Y.; Yu, G.R.; Liu, L.L.; Chapin, F.S. Climate change, human impacts, and carbon sequestration in China. Proc. Natl. Acad. Sci. USA 2018, 115, 4015–4020. [Google Scholar] [CrossRef] [PubMed] [Green Version]
- Yang, X.L.; Li, W.T.; Ren, L.L.; Gao, T.; Ma, H.J. Simulation of the response of blue and green water to land use change in the Weihe River Basin. Trans. Chin. Soc. Agric. Eng. 2021, 37, 268–276. [Google Scholar] [CrossRef]
- Setturu, B.; Ramachandra, T.V. Modeling Landscape Dynamics of Policy Interventions in Karnataka State, India. J. Geovis. Spat. Anal. 2021, 5, 22. [Google Scholar] [CrossRef]
- Piyathilake, I.D.U.H.; Udayakumara, E.P.N.; Ranaweera, L.V.; Gunatilake, S.K. Modeling predictive assessment of carbon storage using InVEST model in Uva province, Sri Lanka. Model. Earth Syst. Environ. 2021, 8, 2213–2223. [Google Scholar] [CrossRef]
- Zhu, W.B.; Zhang, J.J.; Cui, Y.P.; Zhu, L.Q. Ecosystem carbon storage under different scenarios of land use change in Qihe catchment, China. J. Geogr. Sci. 2020, 30, 1507–1522. [Google Scholar] [CrossRef]
- Liu, Z.P.; Shao, M.A.; Wang, Y.Q. Effect of environmental factors on regional soil organic carbon stocks across the Loess Plateau region, China. Agric. Ecosyst. Environ. 2011, 142, 184–194. [Google Scholar] [CrossRef]
- Ashraf, S.; Ali, M.; Shrestha, S.; Hafeez, M.A.; Moiz, A.; Sheikh, Z.A. Impacts of climate and land-use change on groundwater recharge in the semi-arid lower Ravi River basin, Pakistan. Groundw. Sustain. Dev. 2022, 17, 100743. [Google Scholar] [CrossRef]
- Tang, X.L.; Zhao, X.; Bai, Y.F.; Zhou, G.Y. Carbon pools in China’s terrestrial ecosystems: New estimates based on an intensive field survey. Proc. Natl. Acad. Sci. USA 2018, 115, 4021–4026. [Google Scholar] [CrossRef] [Green Version]
- Li, H.W.; Wu, Y.P.; Chen, J.; Zhao, F.B.; Wang, F.; Sun, Y.Z.; Zhang, G.C.; Qiu, L.J. Responses of soil organic carbon to climate change in the Qilian Mountains and its future projection. J. Hydrol. 2021, 596, 126110. [Google Scholar] [CrossRef]
- Guan, J.H.; Du, S.; Cheng, J.M.; Wu, C.R.; LI, G.Q.; Deng, L.; Zhang, J.G.; He, Q.Y.; Shi, W.Y. Current stocks and rate of sequestration of forest carbon in Gansu province, China. Chin. J. Plant Ecol. 2016, 40, 304–317. [Google Scholar] [CrossRef] [Green Version]
- Cheng, K.; Pan, G.X. “Four Per Mille Initiative: Soils for Food Security and Climate” Challenges and strategies for China’s Action. Clim. Change Res. 2016, 12, 457–464. [Google Scholar] [CrossRef]
- Liu, W.J.; Su, Y.Z.; Yang, R.; Wang, X.F.; Yang, X. Land use effects on soil organic carbon, nitrogen and salinity in saline-alkaline wetland. Sci. Cold Arid. Reg. 2010, 2, 263–270. [Google Scholar]
- Li, Q.G.; Wang, L.C.; Gul, H.N.; Li, D. Simulation and optimization of land use pattern to embed ecological suitability in an oasis region: A case study of Ganzhou district, Gansu province, China. J. Environ. Manag. 2021, 287, 112321. [Google Scholar] [CrossRef]
- Fewster, R.E.; Morris, P.J.; Ivanovic, R.F.; Swindles, G.T.; Peregon, A.M.; Smith, C.J. Imminent loss of climate space for permafrost peatlands in Europe and Western Siberia. Nat. Clim. Chang. 2022, 12, 373–379. [Google Scholar] [CrossRef]
- Koch, A.; Kaplan, J.O. Tropical forest restoration under future climate change. Nat. Clim. Chang. 2022, 12, 279–283. [Google Scholar] [CrossRef]
- Shi, H.; Tian, H.; Pan, N.; Reyer, C.P.O.; Ciais, P.; Chang, J.; Forrest, M.; Frieler, K.; Fu, B.; Gädeke, A.; et al. Saturation of global terrestrial carbon sink under a high warming scenario. Glob. Biogeochem. Cycles 2021, 35, e2020GB006800. [Google Scholar] [CrossRef]
| Type | Variables | Original Resolution | Source |
|---|---|---|---|
| LUCC | Land-use map in 1980, 2000 and 2020 | 1:100,000 | https://www.resdc.cn, accessed on 6 October 2021 |
| Carbon | Above-ground biomass carbon | 300 m | Spawn et al. [50] https://daac.ornl.gov/cgi-bin/dsviewer.pl?ds_id=1763, accessed on 18 October 2021 |
| Below-ground biomass carbon | 300 m | ||
| SOC content at 0–5, 5–15, 15–30, 30–60, and 60–100 cm | 90 m | Liu et al. [41] http://soil.geodata.cn/data/datadetails.html?dataguid=36810085119113, accessed on 18 October 2021 | |
| Bulk density at 0–5, 5–15, 15–30, 30–60, and 60–100 cm | 90 m | ||
| Carbon dynamics in arid and semiarid China from 1980 to 2014 | 50 km | https://www.scidb.cn/en/detail?dataSetId=633694461100032002, accessed on 3 January 2022 | |
| Topography | Elevation | 30 m | ASTER GDEM (https://earthdata.nasa.gov/ accessed on 3 January 2022) |
| Aspect | 30 m | Calculated by SAGA GIS | |
| Slope | 30 m | Calculated by SAGA GIS | |
| Topographic wetness | 30 m | Calculated by SAGA GIS | |
| Multi-scale topographic position | 30 m | Calculated by SAGA GIS | |
| Climate | Historical and future temperature | 1000 m | Peng et al. [51,52,53,54,55,56,57,58] https://data.tpdc.ac.cn/zh-hans/data/71ab4677-b66c-4fd1-a004-b2a541c4d5bf/, accessed on 3 January 2022 https://data.tpdc.ac.cn/zh-hans/data/7f0fce77-2cba-4bdc-ab02-b2d7c69e8e4b/, accessed on 3 January 2022 |
| Historical and future precipitation | 1000 m | Peng et al. [51,52,53,54,55,56,57,58] https://data.tpdc.ac.cn/zh-hans/data/faae7605-a0f2-4d18-b28f-5cee413766a2/, accessed on 3 January 2022 https://data.tpdc.ac.cn/zh-hans/data/a9cd4a09-51a9-433b-9540-0376c6134cf6/, accessed on 3 January 2022 | |
| CO2 concentrations | Historical and future concentrations of CO2 | 0.5° | https://greenhousegases.science.unimelb.edu.au/#!/ghg?mode=downloads, accessed on 7 February 2022 |
| Human activity | River network density | 1:1 million | National Basic Geographic Database (2015) (https://mulu.tianditu.gov.cn/, accessed on 1 October 2021) |
| Road density | 1:1 million | ||
| Population | 1000 m | Chinese Academy of Sciences (2015) (http://www.resdc.cn/, accessed on 1 October 2021) | |
| Gross domestic product | 1000 m |
| Top-Level Categories | Sub-Categories | Mean Carbon Densities of Terrestrial Ecosystem (kg C m−2) | ||||||||
|---|---|---|---|---|---|---|---|---|---|---|
| 1980 | 2000 | 2020 | SSP126 | SSP245 | SSP585 | |||||
| 2030 | 2050 | 2030 | 2050 | 2030 | 2050 | |||||
| Farmland | Dry farmland | 9.72 | 9.36 | 9.51 | 9.48 | 9.52 | 9.51 | 9.45 | 9.47 | 9.36 |
| Forest | Wood land | 20.76 | 21.26 | 23.41 | 23.44 | 24.00 | 23.50 | 24.07 | 23.47 | 24.10 |
| Shrubbery land | 19.42 | 19.76 | 21.36 | 21.28 | 21.57 | 21.35 | 21.65 | 21.32 | 21.69 | |
| Sparsely forested woodland | 13.47 | 13.97 | 16.32 | 16.40 | 17.09 | 16.46 | 17.04 | 16.42 | 17.06 | |
| Other forest land | 15.22 | 14.17 | 14.71 | 13.95 | 13.19 | 13.99 | 12.91 | 13.92 | 12.71 | |
| Grassland | High coverage grassland | 20.66 | 19.39 | 20.20 | 19.57 | 18.76 | 19.61 | 18.72 | 19.60 | 18.84 |
| Middle coverage grassland | 12.36 | 11.34 | 12.44 | 12.11 | 11.75 | 12.12 | 11.62 | 12.12 | 11.77 | |
| Low coverage grassland | 6.25 | 6.04 | 6.64 | 6.60 | 6.53 | 6.63 | 6.63 | 6.64 | 6.84 | |
| Water | River and glacier | 0.00 | 0.00 | 0.00 | 0.00 | 0.00 | 0.00 | 0.00 | 0.00 | 0.00 |
| Built-up land | Cities and towns | 6.46 | 6.23 | 6.38 | 6.21 | 5.96 | 6.23 | 6.01 | 6.23 | 6.07 |
| Rural settlements | 9.96 | 9.46 | 9.37 | 8.94 | 8.38 | 8.97 | 8.34 | 8.94 | 8.27 | |
| Industry and traffic land | 5.89 | 5.50 | 5.84 | 5.56 | 5.19 | 5.58 | 5.17 | 5.56 | 5.21 | |
| Unused land | Sandy land | 1.76 | 1.89 | 2.31 | 2.35 | 2.35 | 2.38 | 2.53 | 2.40 | 2.69 |
| Gobi | 1.81 | 1.82 | 2.09 | 2.07 | 2.00 | 2.10 | 2.14 | 2.11 | 2.25 | |
| Saline-alkali land | 3.47 | 3.33 | 3.24 | 3.06 | 2.75 | 3.10 | 2.91 | 3.10 | 2.99 | |
| Swampland | 16.80 | 16.13 | 16.76 | 16.56 | 16.18 | 16.65 | 16.62 | 16.71 | 17.10 | |
| Bare land | 3.31 | 3.23 | 3.54 | 3.46 | 3.33 | 3.49 | 3.43 | 3.49 | 3.54 | |
| Rock and gravel | 2.55 | 2.64 | 3.15 | 3.22 | 3.22 | 3.26 | 3.48 | 3.28 | 3.71 | |
| Alpine desert | 0.54 | 1.26 | 3.20 | 4.23 | 5.42 | 4.24 | 5.95 | 4.36 | 6.71 | |
| Top-Level Categories | Sub-Categories | Area (km2) | |||
|---|---|---|---|---|---|
| 1980 | 2000 | 2020 | Change (1980–2020) | ||
| Farmland | Dry farmland | 64,658.52 | 65,602.26 | 63,928.35 | −730.17 |
| Forest | Wood land | 14,033.79 | 14,012.55 | 14,167.35 | 133.56 |
| Shrubbery land | 16,022.97 | 15,820.65 | 16,255.62 | 232.65 | |
| Sparsely forested woodland | 7340.76 | 7237.08 | 7206.84 | −133.92 | |
| Other forest land | 538.02 | 554.58 | 874.35 | 336.33 | |
| Grassland | High coverage grassland | 25,864.74 | 25,809.66 | 26,488.44 | 623.7 |
| Middle coverage grassland | 60,089.22 | 59,758.92 | 60,983.1 | 893.88 | |
| Low coverage grassland | 57,255.21 | 57,029.22 | 56,115.72 | −1139.49 | |
| Water | River and glacier | 3470.22 | 3297.96 | 3845.25 | 375.03 |
| Built-up land | Cities and towns | 370.62 | 407.07 | 904.77 | 534.15 |
| Rural settlements | 2732.04 | 2945.43 | 3443.4 | 711.36 | |
| Industry and traffic land | 222.21 | 228.78 | 1241.28 | 1019.07 | |
| Unused land | Sandy land | 28,889.91 | 28,842.21 | 28,120.41 | −769.5 |
| Gobi | 72,811.08 | 72,579.6 | 71,410.05 | −1401.03 | |
| Saline-alkali land | 8339.13 | 8357.94 | 7575.75 | −763.38 | |
| Swampland | 2612.16 | 2606.49 | 2519.6 | −92.56 | |
| Bare land | 3945.69 | 3721.59 | 38,92.14 | −53.55 | |
| Rock and gravel | 44,878.32 | 45,266.76 | 47,491.2 | 2612.88 | |
| Alpine desert | 11,369.07 | 11,364.75 | 8979.48 | −2389.59 | |
| Top-Level Categories | Sub-Categories | Carbon Storage (Tg C) | |||
|---|---|---|---|---|---|
| 1980 | 2000 | 2020 | Change (1980–2020) | ||
| Farmland | Dry farmland | 628.71 | 614.34 | 608.14 | −20.57 |
| Forest | Wood land | 291.35 | 297.90 | 331.69 | 40.34 |
| Shrubbery land | 311.22 | 312.67 | 347.28 | 36.06 | |
| Sparsely forested woodland | 98.85 | 101.13 | 117.60 | 18.75 | |
| Other forest land | 8.19 | 7.86 | 12.86 | 4.67 | |
| Grassland | High coverage grassland | 534.33 | 500.54 | 535.06 | 0.73 |
| Middle coverage grassland | 742.78 | 677.87 | 758.73 | 15.95 | |
| Low coverage grassland | 358.00 | 344.34 | 372.71 | 14.71 | |
| Water | River and glacier | 0.00 | 0.00 | 0.00 | 0.00 |
| Built-up land | Cities and towns | 2.39 | 2.53 | 5.78 | 3.38 |
| Rural settlements | 27.21 | 27.87 | 32.26 | 5.05 | |
| Industry and traffic land | 1.31 | 1.26 | 7.25 | 5.94 | |
| Unused land | Sandy land | 50.85 | 54.40 | 64.91 | 14.06 |
| Gobi | 131.55 | 132.18 | 149.18 | 17.63 | |
| Saline-alkali land | 28.95 | 27.84 | 24.55 | −4.40 | |
| Swampland | 43.89 | 42.03 | 42.24 | −1.65 | |
| Bare land | 13.05 | 12.00 | 13.76 | 0.71 | |
| Rock and gravel | 114.41 | 119.46 | 149.36 | 34.95 | |
| Alpine desert | 6.15 | 14.29 | 28.74 | 22.58 | |
| LUCC | 2020 (km2) | NDS | EPS | ||||||
|---|---|---|---|---|---|---|---|---|---|
| 2030 (km2) | 2020–2030 (%) | 2050 (km2) | 2020–2050 (%) | 2030 (km2) | 2020–2030 (%) | 2050 (km2) | 2020–2050 (%) | ||
| Dry farmland | 63,928.35 | 63,506.16 | −0.66 | 68,885.19 | 7.75 | 55,827.81 | −12.67 | 46,268.19 | −27.62 |
| Wood land | 14,167.35 | 13,542.75 | −4.41 | 13,468.86 | −4.93 | 14,629.68 | 3.26 | 17,233.56 | 21.64 |
| Shrubbery land | 16,255.62 | 16,135.20 | −0.74 | 15,940.62 | −1.94 | 17,232.66 | 6.01 | 18,021.96 | 10.87 |
| Sparsely forested woodland | 7206.84 | 7342.29 | 1.88 | 7744.50 | 7.46 | 9420.30 | 30.71 | 10,658.34 | 47.89 |
| Other forest land | 874.35 | 787.32 | −9.95 | 737.28 | −15.68 | 3631.59 | 315.35 | 5999.49 | 586.17 |
| High coverage grassland | 26,488.44 | 25,344.72 | −4.32 | 25,008.03 | −5.59 | 25,763.76 | −2.74 | 24,455.52 | −7.67 |
| Middle coverage grassland | 60,983.10 | 63,719.01 | 4.49 | 60,708.87 | −0.45 | 64,359.36 | 5.54 | 68,630.31 | 12.54 |
| Low coverage grassland | 56,115.72 | 58,050.99 | 3.45 | 65,219.85 | 16.22 | 58,320.36 | 3.93 | 63,200.43 | 12.63 |
| River and glacier | 3845.25 | 4280.31 | 11.31 | 4040.55 | 5.08 | 4424.67 | 15.07 | 5528.61 | 43.78 |
| Cities and towns | 904.77 | 1386.09 | 53.20 | 1729.35 | 91.14 | 1394.91 | 54.17 | 3052.26 | 237.35 |
| Rural settlements | 3443.40 | 3949.65 | 14.70 | 3910.14 | 13.55 | 3992.31 | 15.94 | 5810.13 | 68.73 |
| Industry and traffic land | 1241.28 | 3384.27 | 172.64 | 7718.31 | 521.80 | 3364.29 | 171.03 | 8127.36 | 554.76 |
| Sandy land | 28,120.41 | 27,747.27 | −1.33 | 27,511.29 | −2.17 | 27,773.37 | −1.23 | 26,857.89 | −4.49 |
| Gobi | 71,410.05 | 67,206.51 | −5.89 | 58,971.15 | −17.42 | 66,814.47 | −6.44 | 58,547.97 | −18.01 |
| Saline-alkali land | 7575.75 | 7534.44 | −0.55 | 7289.91 | −3.77 | 7323.39 | −3.33 | 6841.35 | −9.69 |
| Swampland | 2519.60 | 2426.58 | −3.69 | 2534.76 | 0.60 | 2348.19 | −6.80 | 2030.31 | −19.42 |
| Bare land | 3892.14 | 4248.63 | 9.16 | 3699.54 | −4.95 | 4166.91 | 7.06 | 4792.77 | 23.14 |
| Rock and gravel | 47,491.20 | 47,675.70 | 0.39 | 44,528.04 | −6.24 | 47,593.08 | 0.21 | 44,971.11 | −5.31 |
| Alpine desert | 8979.48 | 7152.12 | −20.35 | 5773.77 | −35.70 | 7038.90 | −21.61 | 4392.45 | −51.08 |
| LUCC | 2020 (Tg C) | NDS (Tg C) | EPS (Tg C) | ||||||||||
|---|---|---|---|---|---|---|---|---|---|---|---|---|---|
| SSP126 | SSP245 | SSP585 | SSP126 | SSP245 | SSP585 | ||||||||
| 2020– 2030 | 2020– 2050 | 2020– 2030 | 2020– 2050 | 2020– 2030 | 2020– 2050 | 2020– 2030 | 2020– 2050 | 2020– 2030 | 2020– 2050 | 2020– 2030 | 2020– 2050 | ||
| Dry farmland | 608.14 | −6.19 | 47.90 | −4.51 | 42.82 | −6.65 | 36.68 | −78.97 | −167.50 | −77.49 | −170.91 | −79.37 | −175.03 |
| Wood land | 331.69 | −14.29 | −8.38 | −13.38 | −7.53 | −13.83 | −7.12 | 11.18 | 81.99 | 12.17 | 83.08 | 11.68 | 83.60 |
| Shrubbery land | 347.28 | −4.00 | −3.44 | −2.85 | −2.25 | −3.30 | −1.52 | 19.35 | 41.45 | 20.58 | 42.80 | 20.10 | 43.62 |
| Sparsely forested woodland | 117.60 | 2.85 | 14.72 | 3.27 | 14.34 | 2.96 | 14.56 | 36.94 | 64.51 | 37.47 | 63.99 | 37.08 | 64.28 |
| Other forest land | 12.86 | −1.88 | −3.14 | −1.84 | −3.34 | −1.90 | −3.49 | 37.81 | 66.25 | 37.95 | 64.60 | 37.70 | 63.39 |
| High coverage grassland | 535.06 | −39.02 | −65.84 | −38.00 | −66.93 | −38.32 | −63.87 | −30.82 | −76.21 | −29.78 | −77.28 | −30.11 | −74.28 |
| Middle coverage grassland | 758.73 | 12.92 | −45.47 | 13.62 | −53.57 | 13.36 | −44.43 | 20.67 | 47.60 | 21.39 | 38.44 | 21.12 | 48.77 |
| Low coverage grassland | 372.71 | 10.58 | 53.22 | 12.24 | 59.81 | 12.95 | 73.15 | 12.36 | 40.03 | 14.03 | 46.42 | 14.74 | 59.35 |
| River and glacier | 0.00 | 0.00 | 0.00 | 0.00 | 0.00 | 0.00 | 0.00 | 0.00 | 0.00 | 0.00 | 0.00 | 0.00 | 0.00 |
| Cities and towns | 5.78 | 2.83 | 4.52 | 2.87 | 4.62 | 2.86 | 4.72 | 2.88 | 12.40 | 2.92 | 12.57 | 2.91 | 12.75 |
| Rural settlements | 32.26 | 3.06 | 0.52 | 3.19 | 0.37 | 3.06 | 0.06 | 3.45 | 16.45 | 3.57 | 16.22 | 3.44 | 15.77 |
| Industry and traffic land | 7.25 | 11.55 | 32.77 | 11.64 | 32.69 | 11.58 | 32.97 | 11.44 | 34.90 | 11.53 | 34.80 | 11.47 | 35.10 |
| Sandy land | 64.91 | 0.41 | −0.19 | 1.24 | 4.61 | 1.70 | 9.13 | 0.47 | −1.72 | 1.30 | 2.96 | 1.76 | 7.37 |
| Gobi | 149.18 | −9.97 | −31.47 | −8.17 | −23.19 | −7.58 | −16.57 | −10.78 | −32.31 | −8.99 | −24.09 | −8.41 | −17.52 |
| Saline-alkali land | 24.55 | −1.52 | −4.47 | −1.20 | −3.30 | −1.21 | −2.77 | −2.16 | −5.71 | −1.85 | −4.61 | −1.87 | −4.11 |
| Swampland | 42.24 | −2.05 | −1.23 | −1.83 | −0.10 | −1.68 | 1.10 | −3.34 | −9.39 | −3.13 | −8.48 | −2.99 | −7.53 |
| Bare land | 13.76 | 0.94 | −1.45 | 1.06 | −1.08 | 1.07 | −0.67 | 0.66 | 2.19 | 0.77 | 2.67 | 0.78 | 3.20 |
| Rock and gravel | 149.36 | 4.08 | −5.82 | 5.98 | 5.45 | 7.18 | 15.91 | 3.82 | −4.39 | 5.71 | 6.99 | 6.91 | 17.55 |
| Alpine desert | 28.74 | 1.52 | 2.56 | 1.61 | 5.59 | 2.47 | 10.00 | 1.04 | −4.92 | 1.13 | −2.62 | 1.98 | 0.73 |
| Carbon Storage (Tg C) | 3602.1 | −28.17 | −14.69 | −15.06 | 9.02 | −15.29 | 57.83 | 35.98 | 105.61 | 49.27 | 127.56 | 48.92 | 177.01 |
Publisher’s Note: MDPI stays neutral with regard to jurisdictional claims in published maps and institutional affiliations. |
© 2022 by the authors. Licensee MDPI, Basel, Switzerland. This article is an open access article distributed under the terms and conditions of the Creative Commons Attribution (CC BY) license (https://creativecommons.org/licenses/by/4.0/).
Share and Cite
Wang, L.; Zhu, R.; Yin, Z.; Chen, Z.; Fang, C.; Lu, R.; Zhou, J.; Feng, Y. Impacts of Land-Use Change on the Spatio-Temporal Patterns of Terrestrial Ecosystem Carbon Storage in the Gansu Province, Northwest China. Remote Sens. 2022, 14, 3164. https://doi.org/10.3390/rs14133164
Wang L, Zhu R, Yin Z, Chen Z, Fang C, Lu R, Zhou J, Feng Y. Impacts of Land-Use Change on the Spatio-Temporal Patterns of Terrestrial Ecosystem Carbon Storage in the Gansu Province, Northwest China. Remote Sensing. 2022; 14(13):3164. https://doi.org/10.3390/rs14133164
Chicago/Turabian StyleWang, Lingge, Rui Zhu, Zhenliang Yin, Zexia Chen, Chunshuang Fang, Rui Lu, Jiqiang Zhou, and Yonglin Feng. 2022. "Impacts of Land-Use Change on the Spatio-Temporal Patterns of Terrestrial Ecosystem Carbon Storage in the Gansu Province, Northwest China" Remote Sensing 14, no. 13: 3164. https://doi.org/10.3390/rs14133164
APA StyleWang, L., Zhu, R., Yin, Z., Chen, Z., Fang, C., Lu, R., Zhou, J., & Feng, Y. (2022). Impacts of Land-Use Change on the Spatio-Temporal Patterns of Terrestrial Ecosystem Carbon Storage in the Gansu Province, Northwest China. Remote Sensing, 14(13), 3164. https://doi.org/10.3390/rs14133164


