Article

Insights into Variations and Potential Long-Range Transport of Atmospheric Aerosols from the Aral Sea Basin in Central Asia

1
State Key Laboratory of Desert and Oasis Ecology, Xinjiang Institute of Ecology and Geography, Chinese Academy of Sciences, Urumqi 830011, China
2
CAS Research Center for Ecology and Environment of Central Asia, Urumqi 830011, China
3
University of Chinese Academy of Sciences, Beijing 100049, China
4
Faculty of Geography and Environmental Sciences, Al-Farabi Kazakh National University, Almaty 050040, Kazakhstan
5
Kazakh Research Institute of Soil Science and Agrochemistry Named after U.U.Uspanov, Almaty 050060, Kazakhstan
*
Author to whom correspondence should be addressed.
Remote Sens. 2022, 14(13), 3201; https://doi.org/10.3390/rs14133201
Submission received: 16 May 2022 / Revised: 30 June 2022 / Accepted: 1 July 2022 / Published: 3 July 2022
(This article belongs to the Section Atmospheric Remote Sensing)

Abstract

:
The dramatic shrinkage of the Aral Sea in the past decades has inevitably led to an environmental calamity. Existing knowledge on the variations and potential transport of atmospheric aerosols from the Aral Sea Basin (ASB) is limited. To bridge this knowledge gap, this study tried to identify the variations and long-range transport of atmospheric aerosols from the ASB in recent years. The Hybrid Single Particle Lagrangian Integrated Trajectory (HYSPLIT) model and Cloud–Aerosol Lidar and Infrared Pathfinder Satellite Observations (CALIPSO) data were used to gain new insight into the types, variation and long-range transport of atmospheric aerosols from the ASB. The results showed five types of tropospheric aerosols and one type of stratospheric aerosol were observed over the ASB. Polluted dust and dust were the dominant subtypes through the year. Sulfate/other was the only stratospheric aerosol detected. The occurrence frequency of aerosols over the ASB showed obvious seasonal variation. Maximum occurrence frequency of dust appeared in spring (MAM) and that of polluted dust peaked in summer (JJA). The monthly occurrence frequency of dust and polluted dust exhibited unimodal distribution. Polluted dust and dust were distributed over wide ranges from 1 km to 5 km vertically. The multi-year average thickness of polluted dust and dust layers was around 1.3 km. Their potential long-range transport in different directions mainly impacts Uzbekistan, Turkmenistan, Kazakhstan and eastern Iran, and may reach as far as the Caucasus region, part of China, Mongolia and Russia. Combining aerosol lidar, atmospheric climate models and geochemical methods is strongly suggested to gain clarity on the variations and long-range transport of atmospheric aerosols from the Aral Sea Basin.

1. Introduction

Dust is a type of aerosol and is widely considered as a possible global player in the Earth’s system, having a massive impact on the absorption and scattering of radiation in the atmosphere, and the energy balance of the Earth’s system [1,2,3,4]. It also impacts atmospheric chemistry, weather systems, and biogeochemical cycles on a local or regional scale. Approximately 2000 Mt of dust is discharged into the atmosphere each year, of which 1500 Mt is deposited on land and 500 Mt into the ocean [1].
In semi-arid and arid regions across the world, saline lakes have been disappearing at an alarming rate in recent decades as a result of environmental change and unsustainable exploitation of water sources [5,6,7], leading to the emergence of a new type of dust source in these regions, especially in the arid regions. Many lake basins, such as Ebinur Lake in the northwest of the Junggar Basin [8,9], the Aral Sea in arid central Asia [10,11,12], Urmia Lake and Hamoun Lake in Iran [13,14], Chad Lake in north Africa [15,16], Eyre Lake in south Australia [17], Owens Lake in America [18], and Mar Chiquita Lake in Argentina [19,20], are facing severe and rapid desertification processes and severe dust and sand storms [21]. The newly exposed dry lakebeds have become a substantial source of fine dust and salt-dust [22], long-range transport of which will harm animals and plants and also pose a great threat to the eco-environment in downwind areas regionally [23].
In arid central Asia, huge challenges exist for sustainable and reasonable use of water resources in the fragile terminal lake basins ecosystem. At present, the Aral Sea disaster, which could be the biggest ecological disaster of the 21st century, has attracted the world’s attention. The Aral Sea, as a terminal lake, is characterized by surface inflow but no surface outflow [24]. Therefore, the main factors that influence the surface area of the Aral Sea are inflow and evaporation. Due to both natural and anthropogenic influences, the Aral Sea has repeatedly filled and dried over the last 10 millennia. The most recent desiccation began in the early 1960s when the area was at around 6.75 × 10⁴ km2. It was largely due to increased irrigation water from the Amu Darya and the Syr Darya, which have recharged the Aral Sea in the past thousands of years [25]. Since the year 2000, relevant governments and international organizations have tried a variety of initiatives to protect, mitigate, and restore the disappearing Aral Sea, but they have been ineffective in preventing the Aral Sea from dramatic further shrinkage [26,27]. As a result, the eastern section of the south Aral Sea disappeared in 2014 (Figure 1). In 2021, the surface area of the Aral Sea was only 0.56 × 10⁴ km2, leaving 6.2 × 10⁴ km2 of dry lakebed within the Aral Sea Basin.
The north Aral Sea is presently the only water body within the Aral Sea whose water level remains consistent. Within no more than about 50 years, a huge new desert, the Aralkum Desert, has come into being in the dry lakebed of the Aral Sea. This is an artificial desert created by human activities [28]. The dry lakebed within the Aral Sea Basin experiences dust and sand storms with the highest frequency in the world [29]. The annual dust emission from the dry lakebed of the Aral Sea is up to about 1.5 × 10⁷–1.7 × 10⁷ t [30,31,32], and the dust can be transported across several hundreds of kilometers [33]. Atmospheric aerosols with aerodynamic diameters less than 20 μm or 10 μm from the Aral Sea can be transported eastward to the Tianshan-Pamir region, influencing Georgia’s coastal areas and central-east Siberia, as well as Russia’s arctic regions and Iran [29,31]. Changes in the Aral Sea’s underlying surface, as well as the emission and transport of dust and salt particles, have received sufficient attention and inquiry. Changes in area, water volume, and land surface have been studied in detail [10,34,35]. Models and remote sensing data were individually or jointly used to quantify the dust emission from the Aral Sea dry lakebed [29]. Aeolian transport and deposition of sand and dust within or outside the Aral Sea Basin have also been elaborated by Issanova et al. [36], Opp et al. [37], and Groll et al. [38]. The emission, transportation, and deposition of sand and dust are harming a significant number of settlements and agricultural ecosystems within the region, as well as people’s livelihoods and health [39,40,41]. Unfortunately, knowledge of the variation, types and typical long-range transport characteristics of atmospheric aerosols arising from the dry lakebed within the Aral Sea is scarce. To bridge the knowledge gaps, the present study aimed to provide insights into the variations and potential transport of atmospheric aerosol from the Aral Sea Basin (ASB) in Central Asia. The Cloud–Aerosol Lidar and Infrared Pathfinder Satellite Observations (CALIPSO) [42] aerosol data and the Hybrid Single Particle Lagrangian Integrated Trajectory (HYSPLIT) model [43] are used to provide insights into the types and long-range transport of atmospheric aerosols from the dry lakebed of the Aral Sea.

2. Methodology

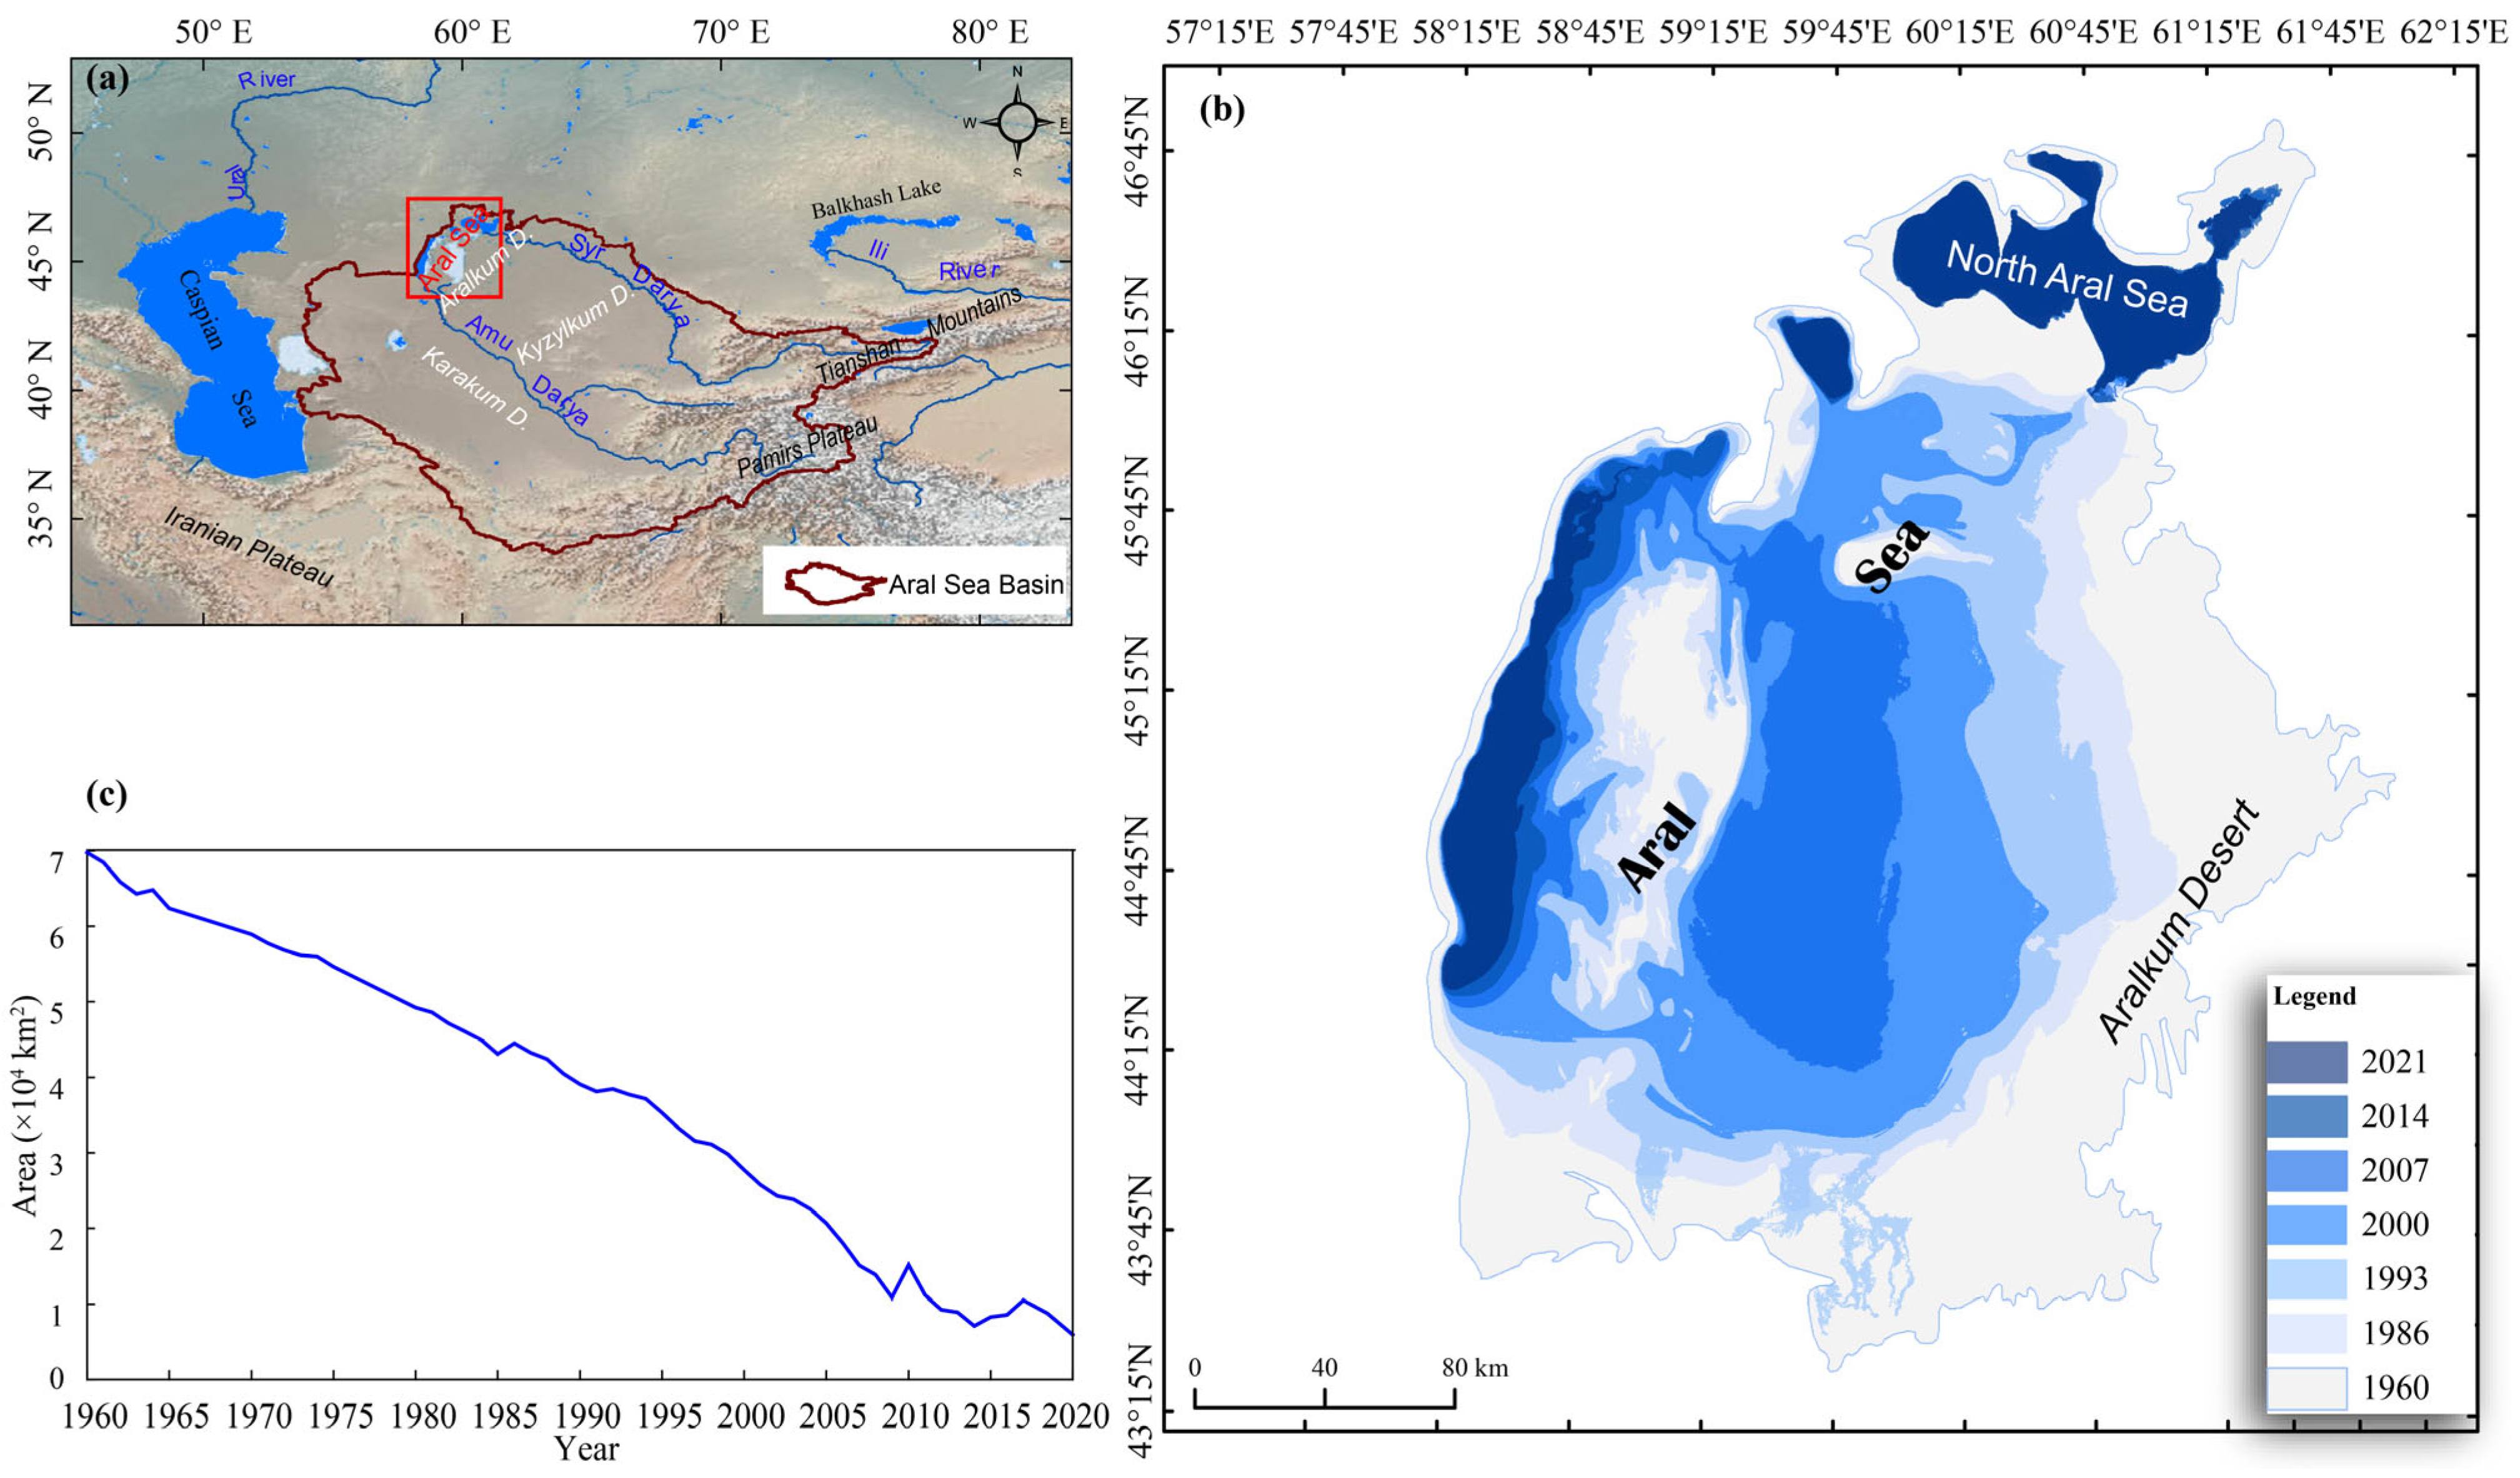
2.1. Regional Environments

The Aral Sea, which was formerly a massive Syr Darya and Amu Darya terminal lake in arid central Asia and the Eurasian continent’s center, has a moderate continental environment with limited precipitation [44]. The Turan Plain, the high Tian Shan Mountains, and the Pamir Plateau encircle the Aral Sea watershed, which straddles Kazakhstan, Kyrgyzstan, Tajikistan, Uzbekistan, and Turkmenistan (Figure 1). The remaining parts are made up of arid and semi-arid steppes, as well as diverse types of alluvial and mountain valleys. In the past decades, with development and progress in central Asia and the resulting struggle between the need to have access to water resources and the need to protect the environment, the Aral Sea turned into a hotspot. Water salinity rises when water levels fall, impacting biodiversity. The rich and diversified ecosystems of the vast Amu Darya Delta in Uzbekistan and the Syr Darya Delta in Kazakhstan have both experienced significant damage [28]. The eco-environment around the Aral Sea has degraded rapidly, and a massive salt desert has become a source of salt dust and dust. In the Aral Sea basin, dust and sand storms induced by strong winds can last 40–110 days per year [45]. The Aral Sea’s surrounding population tends to suffer from serious health concerns [46,47]. Under favorable meteorological conditions, airflow can transport dust and salt dust over thousands of kilometers in just a few days, which is bound to have an impact on regional or global ecology and the environment.
The Aral Sea Basin has a temperate continental climate with four main seasons: spring includes March, April, and May (MAM); summer is defined as June, July, and August (JJA); autumn is from September to November (SON); and winter spans December, January, and February (DJF). This study will analyze the characteristics of variation in atmospheric aerosols from the Aral Sea Basin in arid central Asia from yearly, seasonal, and monthly perspectives.

2.2. Data and Analytical Methods

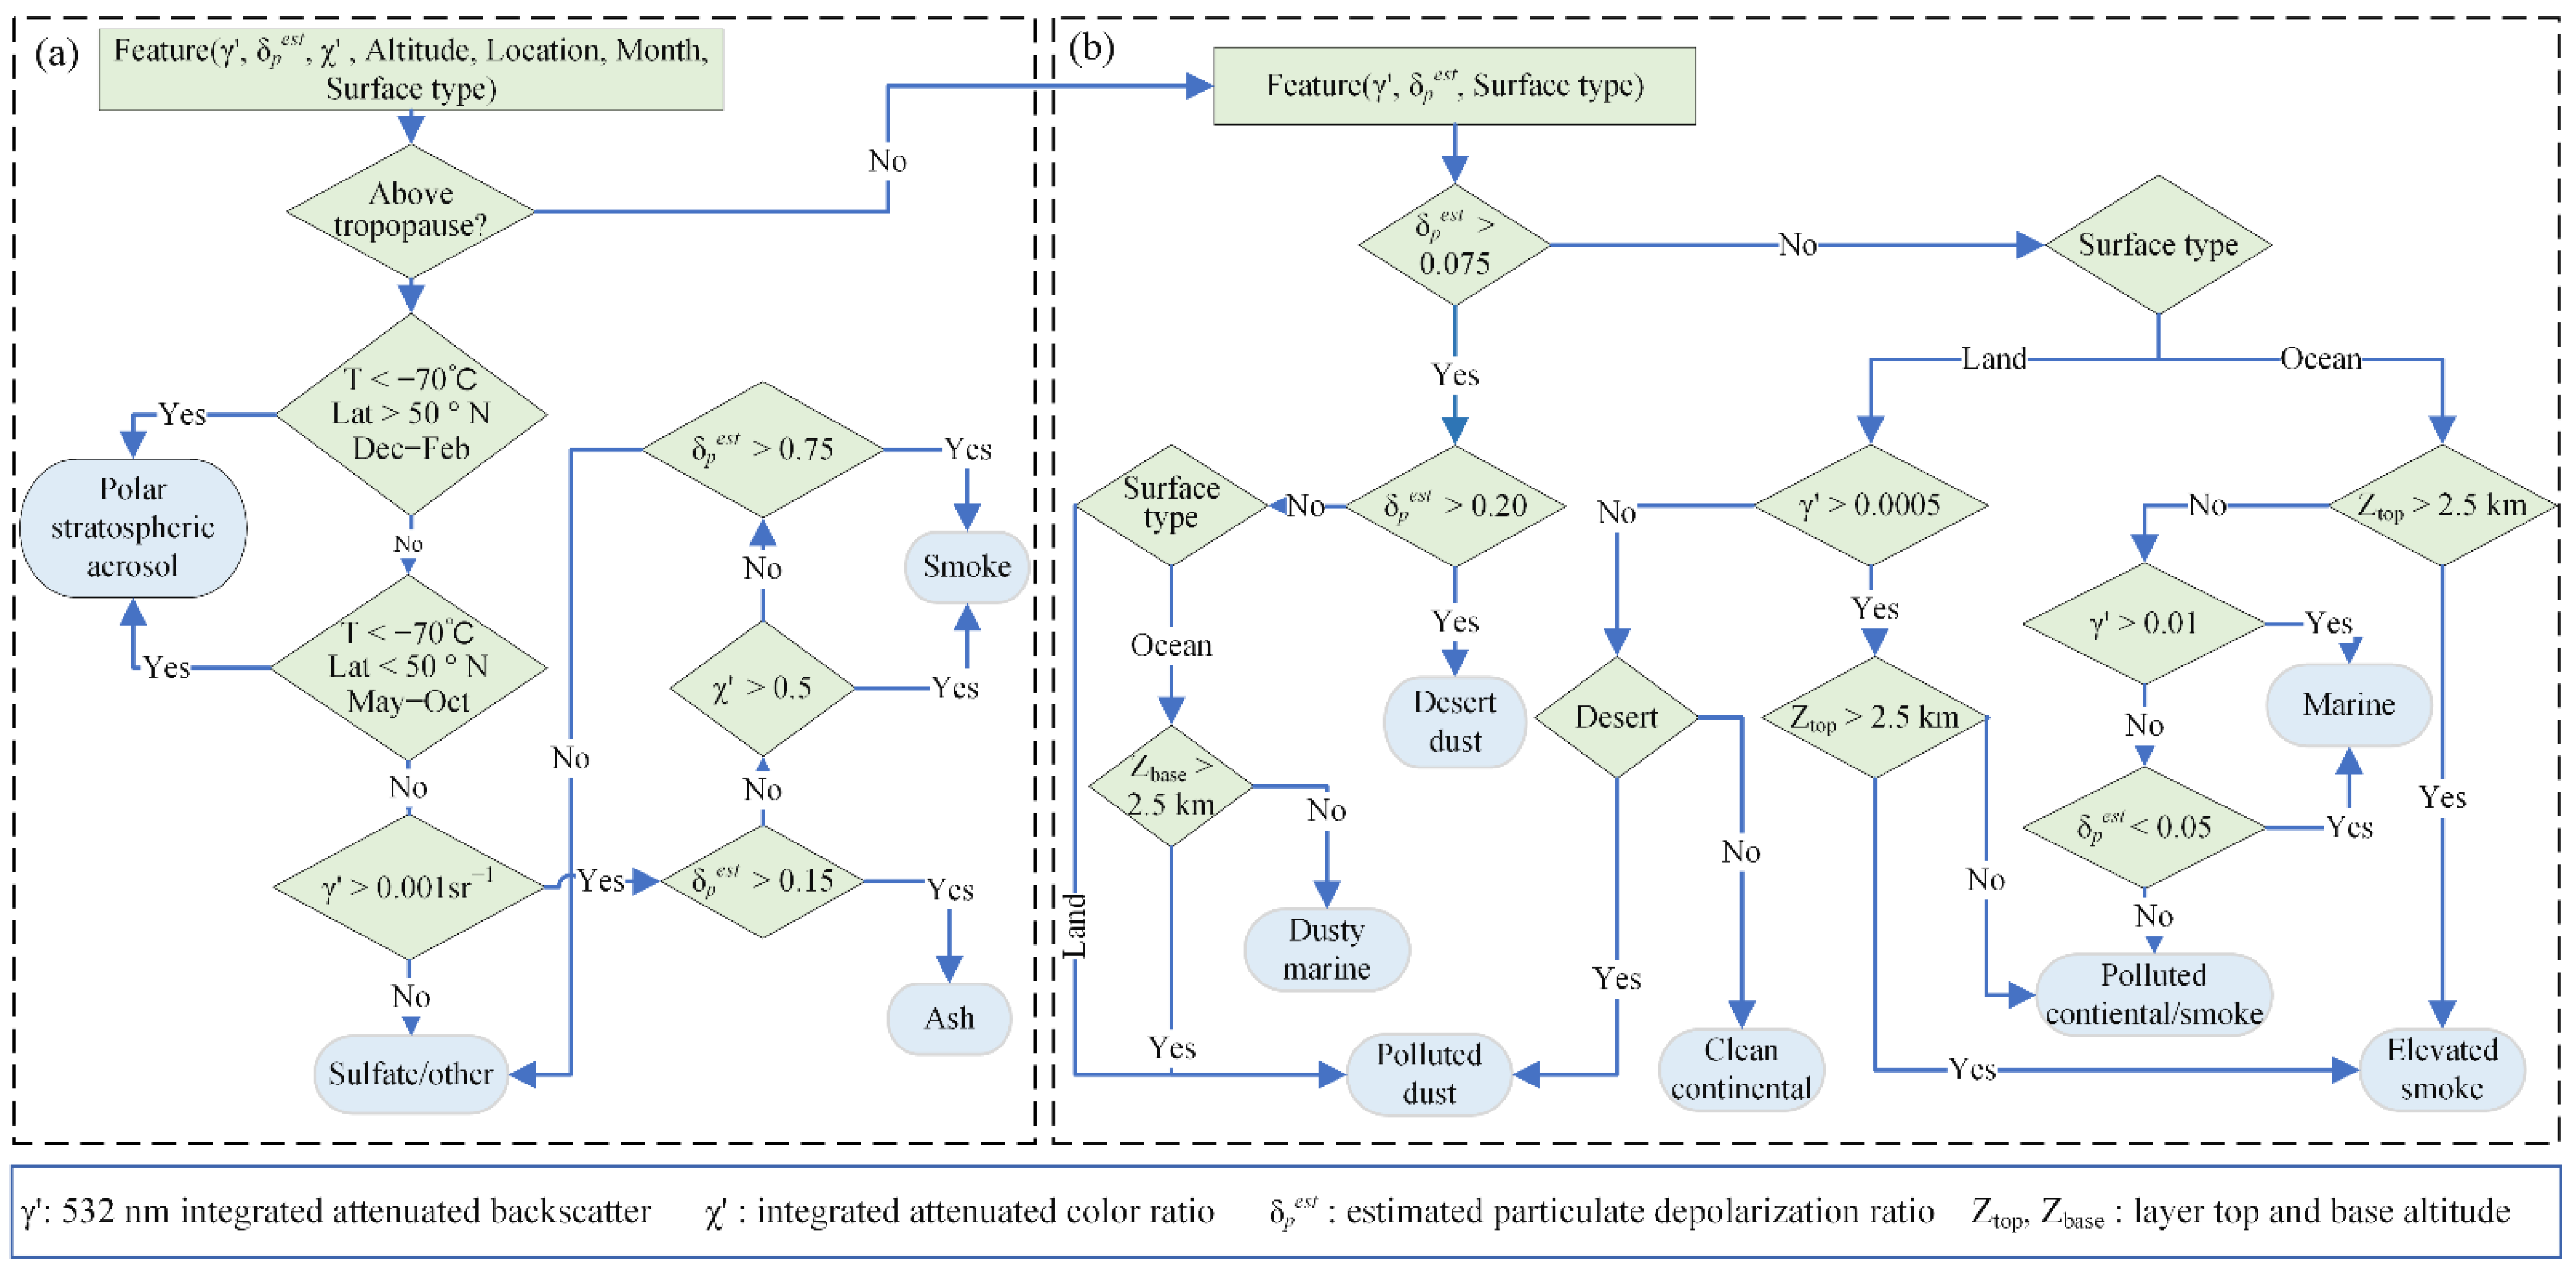
2.2.1. Cloud–Aerosol Lidar and Infrared Pathfinder Satellite Observations (CALIPSO) Satellite Data

CALIPSO is a cooperative NASA (USA) and CNES (France) environmental satellite that was launched at Vandenberg Space Launch Complex 2 on 28 April 2006. The Cloud-Aerosol Lidar and Infrared Pathfinder Satellite Observations (CALIPSO) mission was launched to investigate the effects of clouds and aerosols on the Earth’s radiation budget and climate. It travels in formation with five other satellites (Aqua, Aura, CloudSat, PARASOL, and Glory) in the multinational “A–Train” constellation with a 705-km sun-synchronous near polar orbit [42]. The Cloud–Aerosol LIdar with Orthogonal Polarization (CALIOP), the Imaging Infrared Radiometer (IIR), and the Wide Field Camera (WFC) make up the CALIPSO satellite. CALIOP is now the only space-based sensor that monitors and reports the vertical distributions of aerosol spatial and optical properties over the world, thus providing significant research benefits in aerosol studies [48,49].
In this study, all available CALIPSO level 2 version 4 aerosol layer products at nighttime over the Aral Sea Basin (43.39–46.87°N and 58.18–61.94°E, shown in Figure 1) from 2007 to 2021 were used for the analysis. The V4 level 2 aerosol subtyping algorithm has implemented an entirely new method for detecting stratospheric aerosol subtypes, as well as a significant modification to the algorithm for recognizing tropospheric aerosol types. The algorithm can identify the difference between tropospheric and stratospheric particles. The CALIOP V4 aerosol classification algorithm uses top and base altitudes of aerosol layers, integrated attenuated backscatter at 532 nm (γ′), volume depolarization ratio (δv), and total aerosol optical depth (AOD) at 532 nm wavelength. All the above parameters were acquired through the web-based CALIPSO search and subset tool developed by the Atmospheric Science Data Center (ASDC) at NASA Langley Research Center. The corrected layer-integrated volume depolarization ratio was used to calculate the estimated particulate depolarization ratios (δpest), which is defined as
δ p e s t = δ v [ ( R m a s 1 ) ( 1 + δ m ) + 1 ] δ m ( R m a s 1 ) ( 1 + δ m ) + δ m δ v
where δpest is the estimated particulate depolarization ratio, δm is the molecular depolarization ratio and Rmas is the mean attenuated scattering (mas) ratio (the ratio of the total attenuated backscatter to the molecular backscatter) [50].
The atmospheric aerosol classification scheme is shown in Figure 2. Different CALIPSO aerosol subtypes were determined using the algorithm described in the flowchart (Figure 2). For the tropospheric aerosols, taking into account γ′, δpest, top and base altitude, and surface type, there were seven aerosol subtypes: dust (δpest > 0.20), dusty marine (0.075 < δpest < 0.20, base altitude ≤ 2.50 km), polluted continental/smoke (δpest≤ 0.075, γ′ > 0.0005, base altitude < 2.50 km), clean continental (δpest ≤ 0.075, γ′ < 0.0005), polluted dust (0.075 < δpest ≤ 0.2, base altitude > 2.50 km), elevated smoke (δpest ≤ 0.075, γ′ > 0.0005, base altitude > 2.50 km), and marine (δpest ≤ 0.075, γ′ > 0.0005, base altitude > 2.50km). For stratospheric aerosols, taking into account γ′, δpest, top and base altitude, location, month and surface type, four subtypes were introduced: polar stratospheric aerosol (PSA), volcanic ash, sulfate/other, and smoke [48].
The cloud–aerosol discrimination (CAD) score is a numerical confidence level for the CALIOP cloud–aerosol discrimination algorithm’s layer classification. The high-confidence classification is the classification with a |CAD score| between 70 to 100, classification of medium confidence is a |CAD score| greater than 50 but less than 70, and classification of low confidence is a |CAD score| between 20 and 50. In this study, aerosol subtypes with high confidence (|CAD score| ≥ 70) were selected to provide insights into variations of atmospheric aerosol from the Aral Sea Basin in Central Asia.

2.2.2. Hybrid Single Particle Lagrangian Integrated Trajectory (HYSPLIT) Model

The HYSPLIT model has evolved over 30 years and is a complete system for computing simple air parcel trajectories, as well as complex transport, dispersion, chemical transformation, and deposition simulations. HYSPLIT has also been used in a variety of simulations describing the atmospheric transport, dispersion, and deposition of pollutants and hazardous materials [43,51,52]. Publicly available global meteorological data from the National Center for Environmental Prediction (NCEP) Global Data Assimilation System (GDAS) (https://www.ready.noaa.gov/gdas1.php, accessed on 21 January 2022) were applied to run the HYSPLIT model. In this study, the HYSPLIT 5.1 model was firstly used to calculate the hourly forward air parcel trajectory for the subsequent 3 days (72 h) from the day when a dust storm began and centered at the Aral Sea (45.0°N, 60.0°E) at 10 m above ground level (AGL). Then, air parcel trajectory frequency analysis contained in the HYSPLIT model [53] with the residence time radio-button settled to Yes was used to determine and depict the potential long-range transport of atmospheric aerosols and the locations most frequently influenced by the typical dust storms from the dry lakebed of the Aral Sea. The frequency analysis is reported in detail in technical instructions on the NOAA website (https://www.ready.noaa.gov/documents/Tutorial_2021/html/traj_freq.html, accessed on 15 March 2022).

3. Results

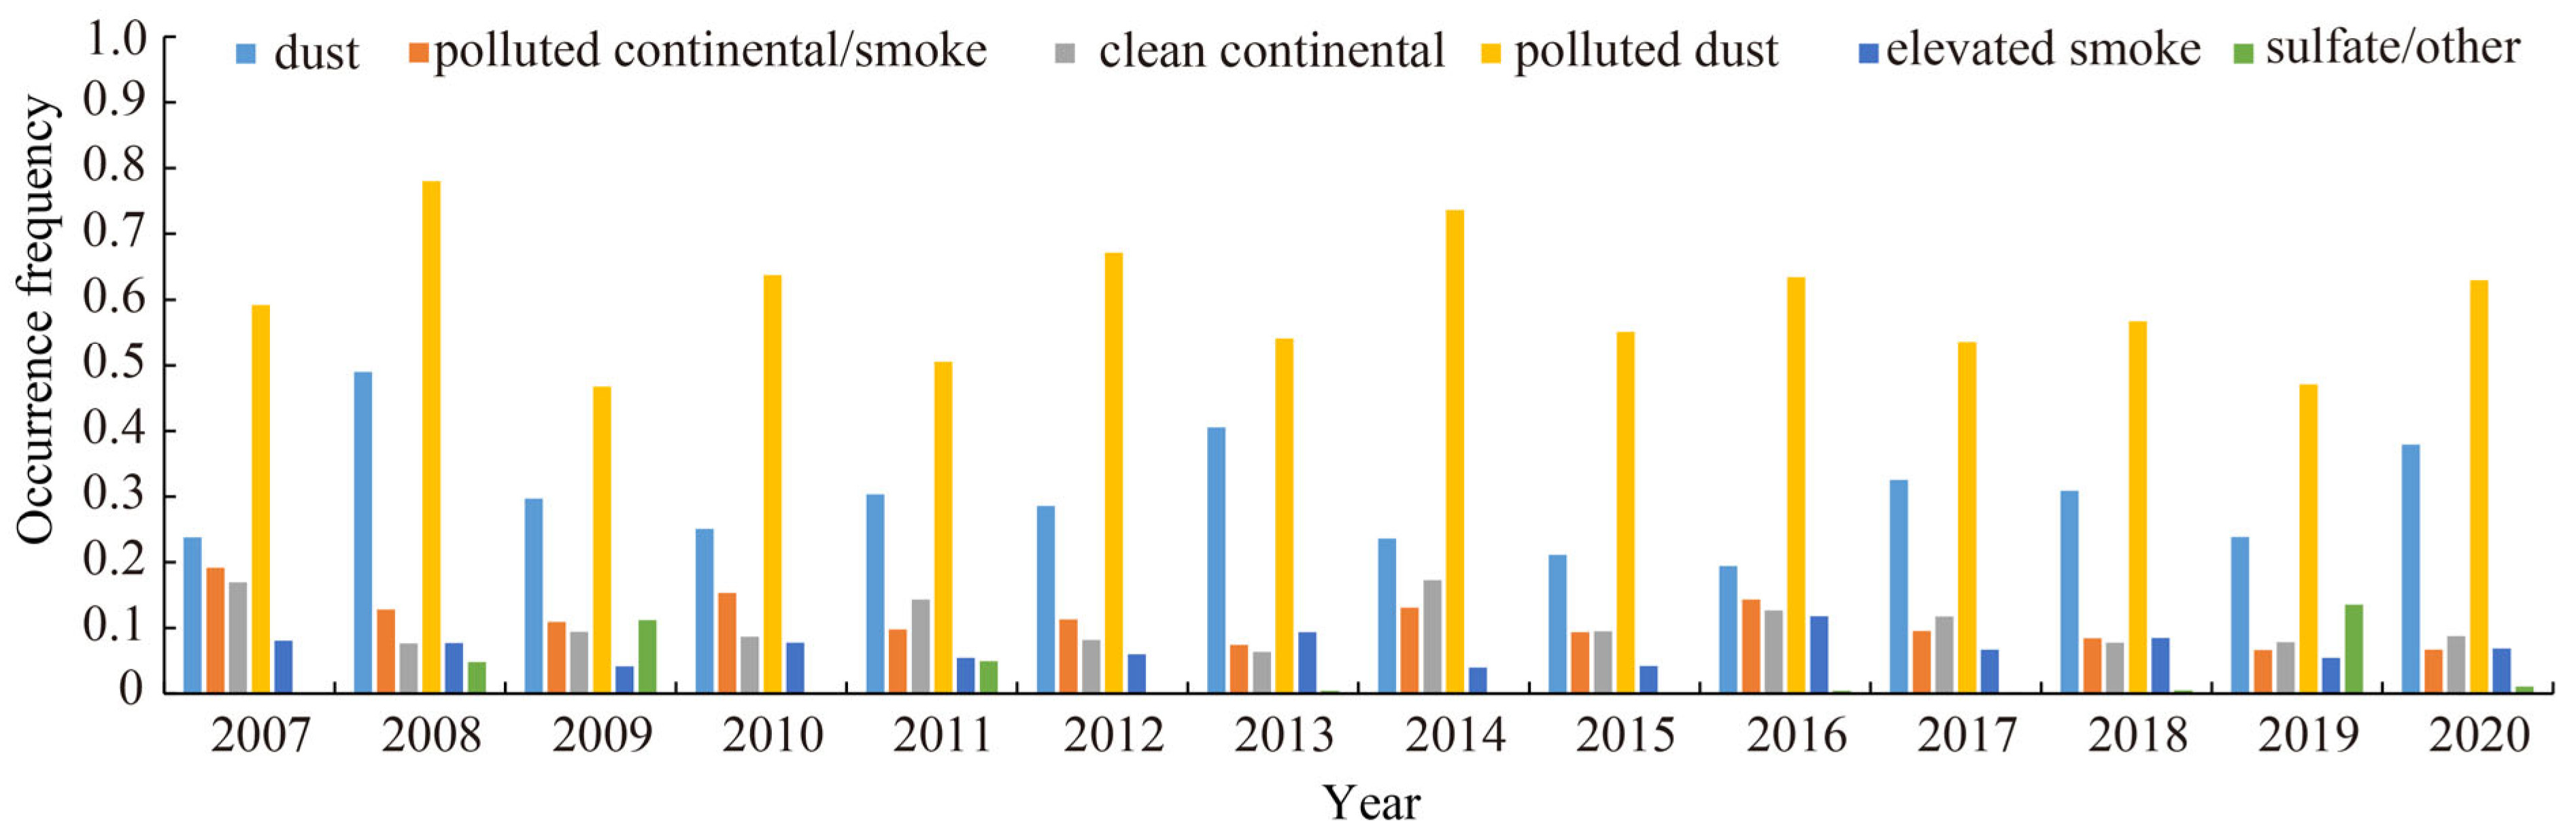
3.1. Aerosol Subtypes in the Atmosphere over the Aral Sea Basin

To characterize the relationship between aerosol types and aerosol optical depth (AOD at 532 nm), we calculated percent frequency of each aerosol subtype by dividing the number of aerosol subtype samples by the total number of CALIPSO aerosol subtype measurements within each season. Table 1 presents the percent frequency of different aerosol types with the change of aerosol optical depth (AOD at 532 nm) from the ASB for years 2007 to 2021. Over the Aral Sea Basin, five types of tropospheric aerosol and one type of stratospheric aerosol were observed. Polluted dust was the most common type of aerosol discovered through the year, accounting for 43%, 59%, 51%, and 41% of all measured aerosols over MAM, JJA, SON, and DJF, respectively. Dust, as the second-most-prevalent aerosol, was at 41%, 19%, 15%, and 20% over MAM, JJA, SON, and DJF, respectively (Table 1). Comparatively, the percentage of polluted continental/smoke, elevated smoke, and clean continental was quite tiny. The percent frequency of occurrence of polluted continental/smoke was 8%, 4%, 10%, and 19% from MAM to DJF. A similar feature was also found with clean continental (5%, 6%, 13%, and 16% in MAM, JJA, SON, and DJF, respectively). However, the percentage of elevated smoke showed a unique characteristic with a peak in JJA (9%). Sulfate/other was the only stratospheric aerosol subtype detected in JJA and SON, with a value of 3% and 5%, respectively.
All the aerosol subtypes detected over the ASB occurred most often at a low AOD (<0.25). Polluted dust was observed most frequently. In the MAM, JJA, SON, and DJF seasons, it accounted for 41%, 56%, 50%, and 40% of total seasonal observations, followed by dust, with a percentage of 37%, 16%, 14%, and 18%, respectively. Furthermore, dust and polluted dust layers were detected at different AOD levels in MAM. In JJA, dust, polluted dust, and elevated smoke layers were detected at different AOD levels. In general, dust aerosols were more commonly observed at an AOD > 1 than any other aerosol layer, indicating that dust aerosols over the ASB account for high AOD values and considerable AOD changes. At an AOD higher than 0.5, no aerosols were observed in SON. In DJF, dust and elevated smoke were more likely to be observed at an AOD value > 1 than other aerosols. The higher AOD values indicated that the dust in elevation layers over the ASB was most likely dust, polluted dust, and elevated smoke from inside or outside the basin.

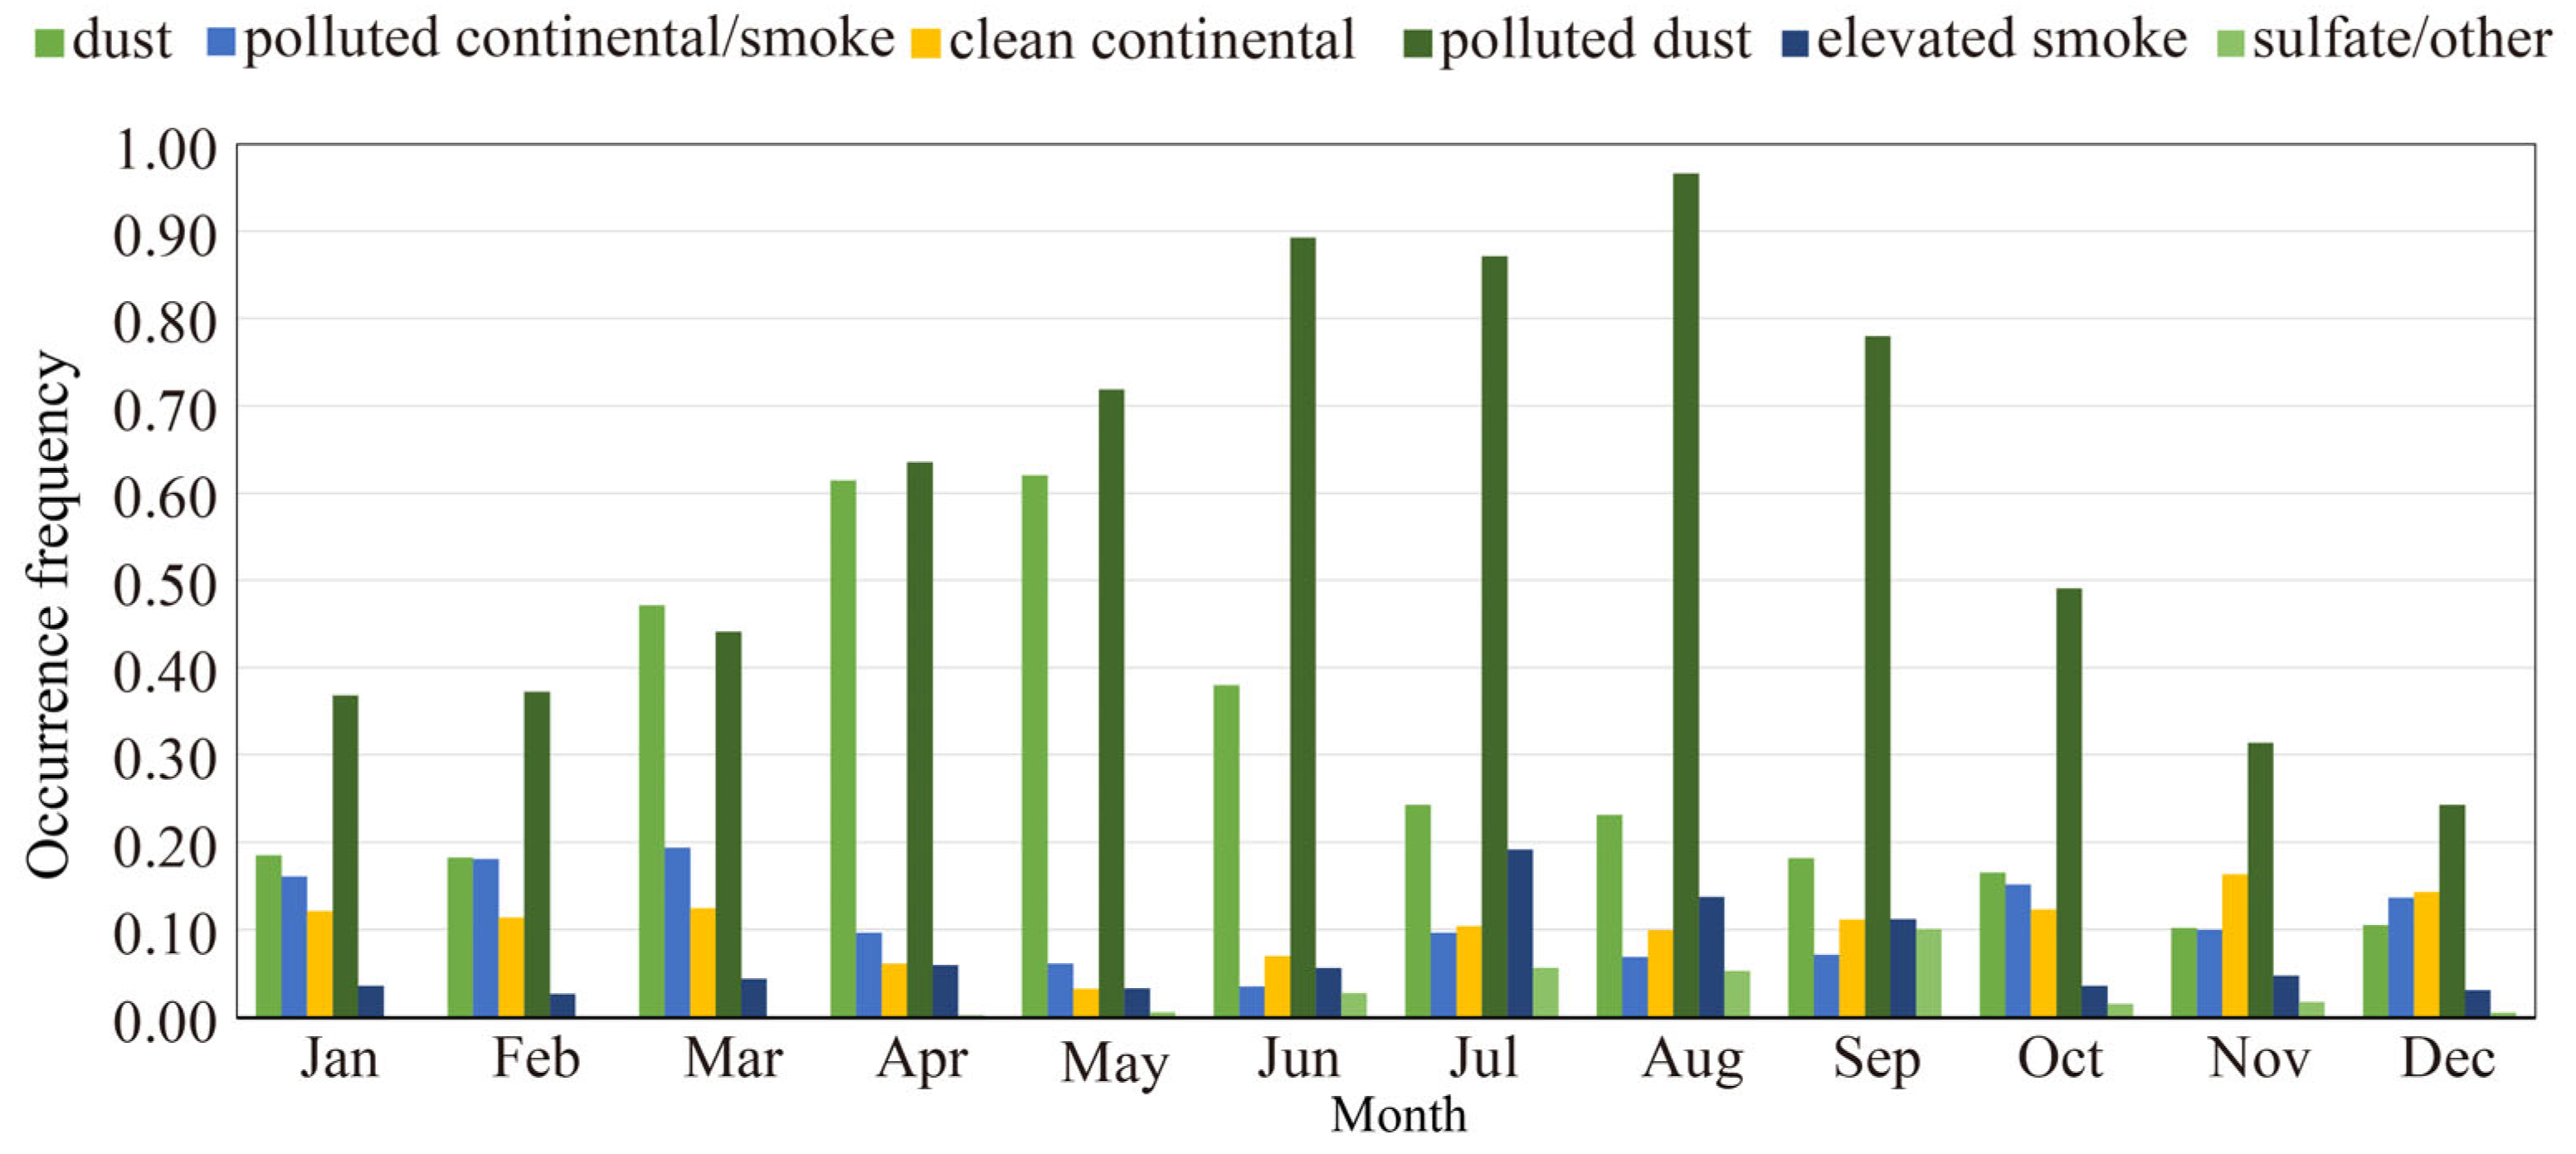
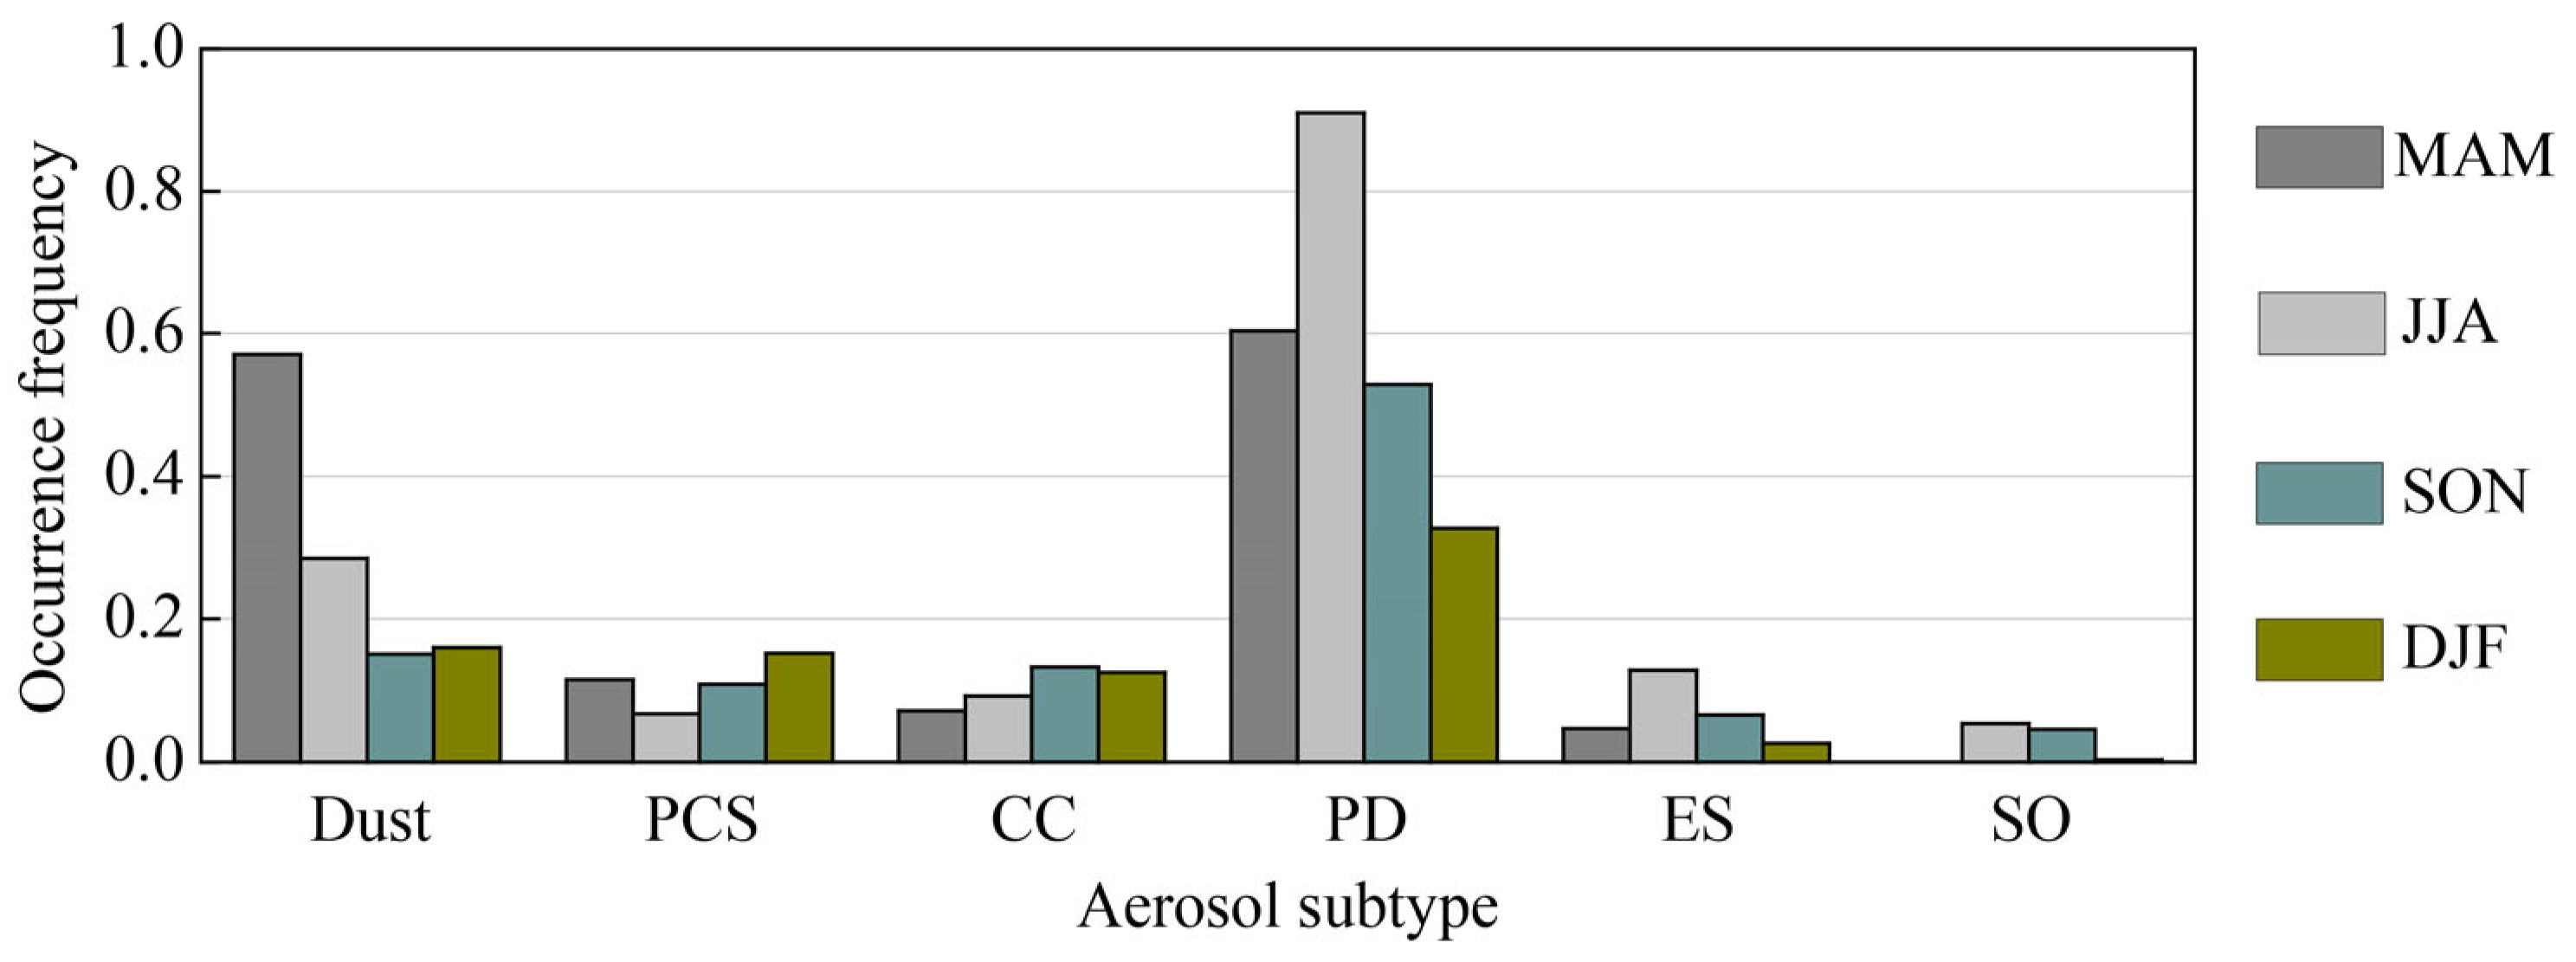
3.2. Features of Atmospheric Aerosol Subtypes over the Aral Sea Basin

To investigate the feature of different aerosol subtypes over the Aral Sea Basin, we compared the inter-annual, seasonal, and monthly variation in the occurrence frequencies of aerosol subtypes over the Aral Sea Basin. In this study, the occurrence frequency of different aerosol subtypes was defined as the ratio between the number of profiles of an aerosol subtype detected and the total CALIPSO profile number within the study area. We calculated the inter-annual occurrence frequency of different aerosol subtypes by dividing the number of an aerosol subtype detected by the total CALIPSO profile number within one year. The same method was used to calculate seasonal and monthly occurrence frequencies of aerosol subtypes.
We first compared the inter-annual variability of occurrence frequency of aerosol subtypes observed by CALIPSO. The purpose here was to examine the features of the yearly average occurrence frequency for each aerosol subtype with the change of the area of the Aral Sea. The most pronounced feature of the occurrence frequency of aerosol subtypes from 2007 to 2020 is depicted in Figure 3. Polluted dust, dust, and polluted continental/smoke were the three most dominant atmospheric aerosols in the past decades; however, polluted dust was the most abundant type and its occurrence frequency varied between 0.46 and 0.78, showing an average value of 0.59. The occurrence frequency of dust varied from 0.24 to 0.49 and that of the polluted continental/smoke and clean continental did not show much difference, with a value of around 0.10 for the same time period. Elevated smoke showed a slight increasing trend, with an occurrence frequency below 0.10 over the ASB from 2007 to 2020, and this increase mostly resulted from the fossil fuel/biofuel emission in this region. The notable feature was the captured sulfate/other stratospheric aerosol with a value ranging from 0.01 to 0.14 in some years (2008, 2009, 2011, and 2019).
On the whole, the occurrence frequency of aerosols over the ASB showed obvious seasonal variation. The seasonal variation of aerosol subtypes occurrence frequency observed showed almost the same feature, with a significant difference in the occurrence frequency (Figure 4). The occurrence frequency of dust was up to 0.57 in MAM and then decreased to 0.28 in JJA, 0.15 in SON, and 0.16 in DJF. The occurrence frequency of polluted dust also showed an obvious difference, peaking in JJA with a value of 0.91, followed by MAM (0.60), SON (0.63), and DJF 0.33 (DJF). The occurrence frequencies of polluted continental/smoke, clean continental, and elevated smoke were not as high as those of dust and polluted dust. Sulfate/other was only observed in JJA and SON, with a low occurrence frequency (0.04).
To better reveal the temporal variation of aerosol subtypes over the ASB, the monthly variation of the occurrence frequency of the aerosol subtypes are depicted in Figure 5, revealing a marked seasonal feature. The occurrence frequencies of dust and polluted dust exhibited unimodal distribution. The former peaked in spring (May), with a value of 0.62, and the latter peaked in summer (August), with an occurrence frequency value of 0.97 (Figure 5). On the contrary, polluted dust was the dominant aerosol all year round, with a much higher occurrence frequency than dust, especially starting from June. The occurrence frequencies of polluted continental/smoke and clean continental were around 0.10. Sulfate/other was observed only in July, August, October, and November, which is consistent with the seasonal variation characteristic.

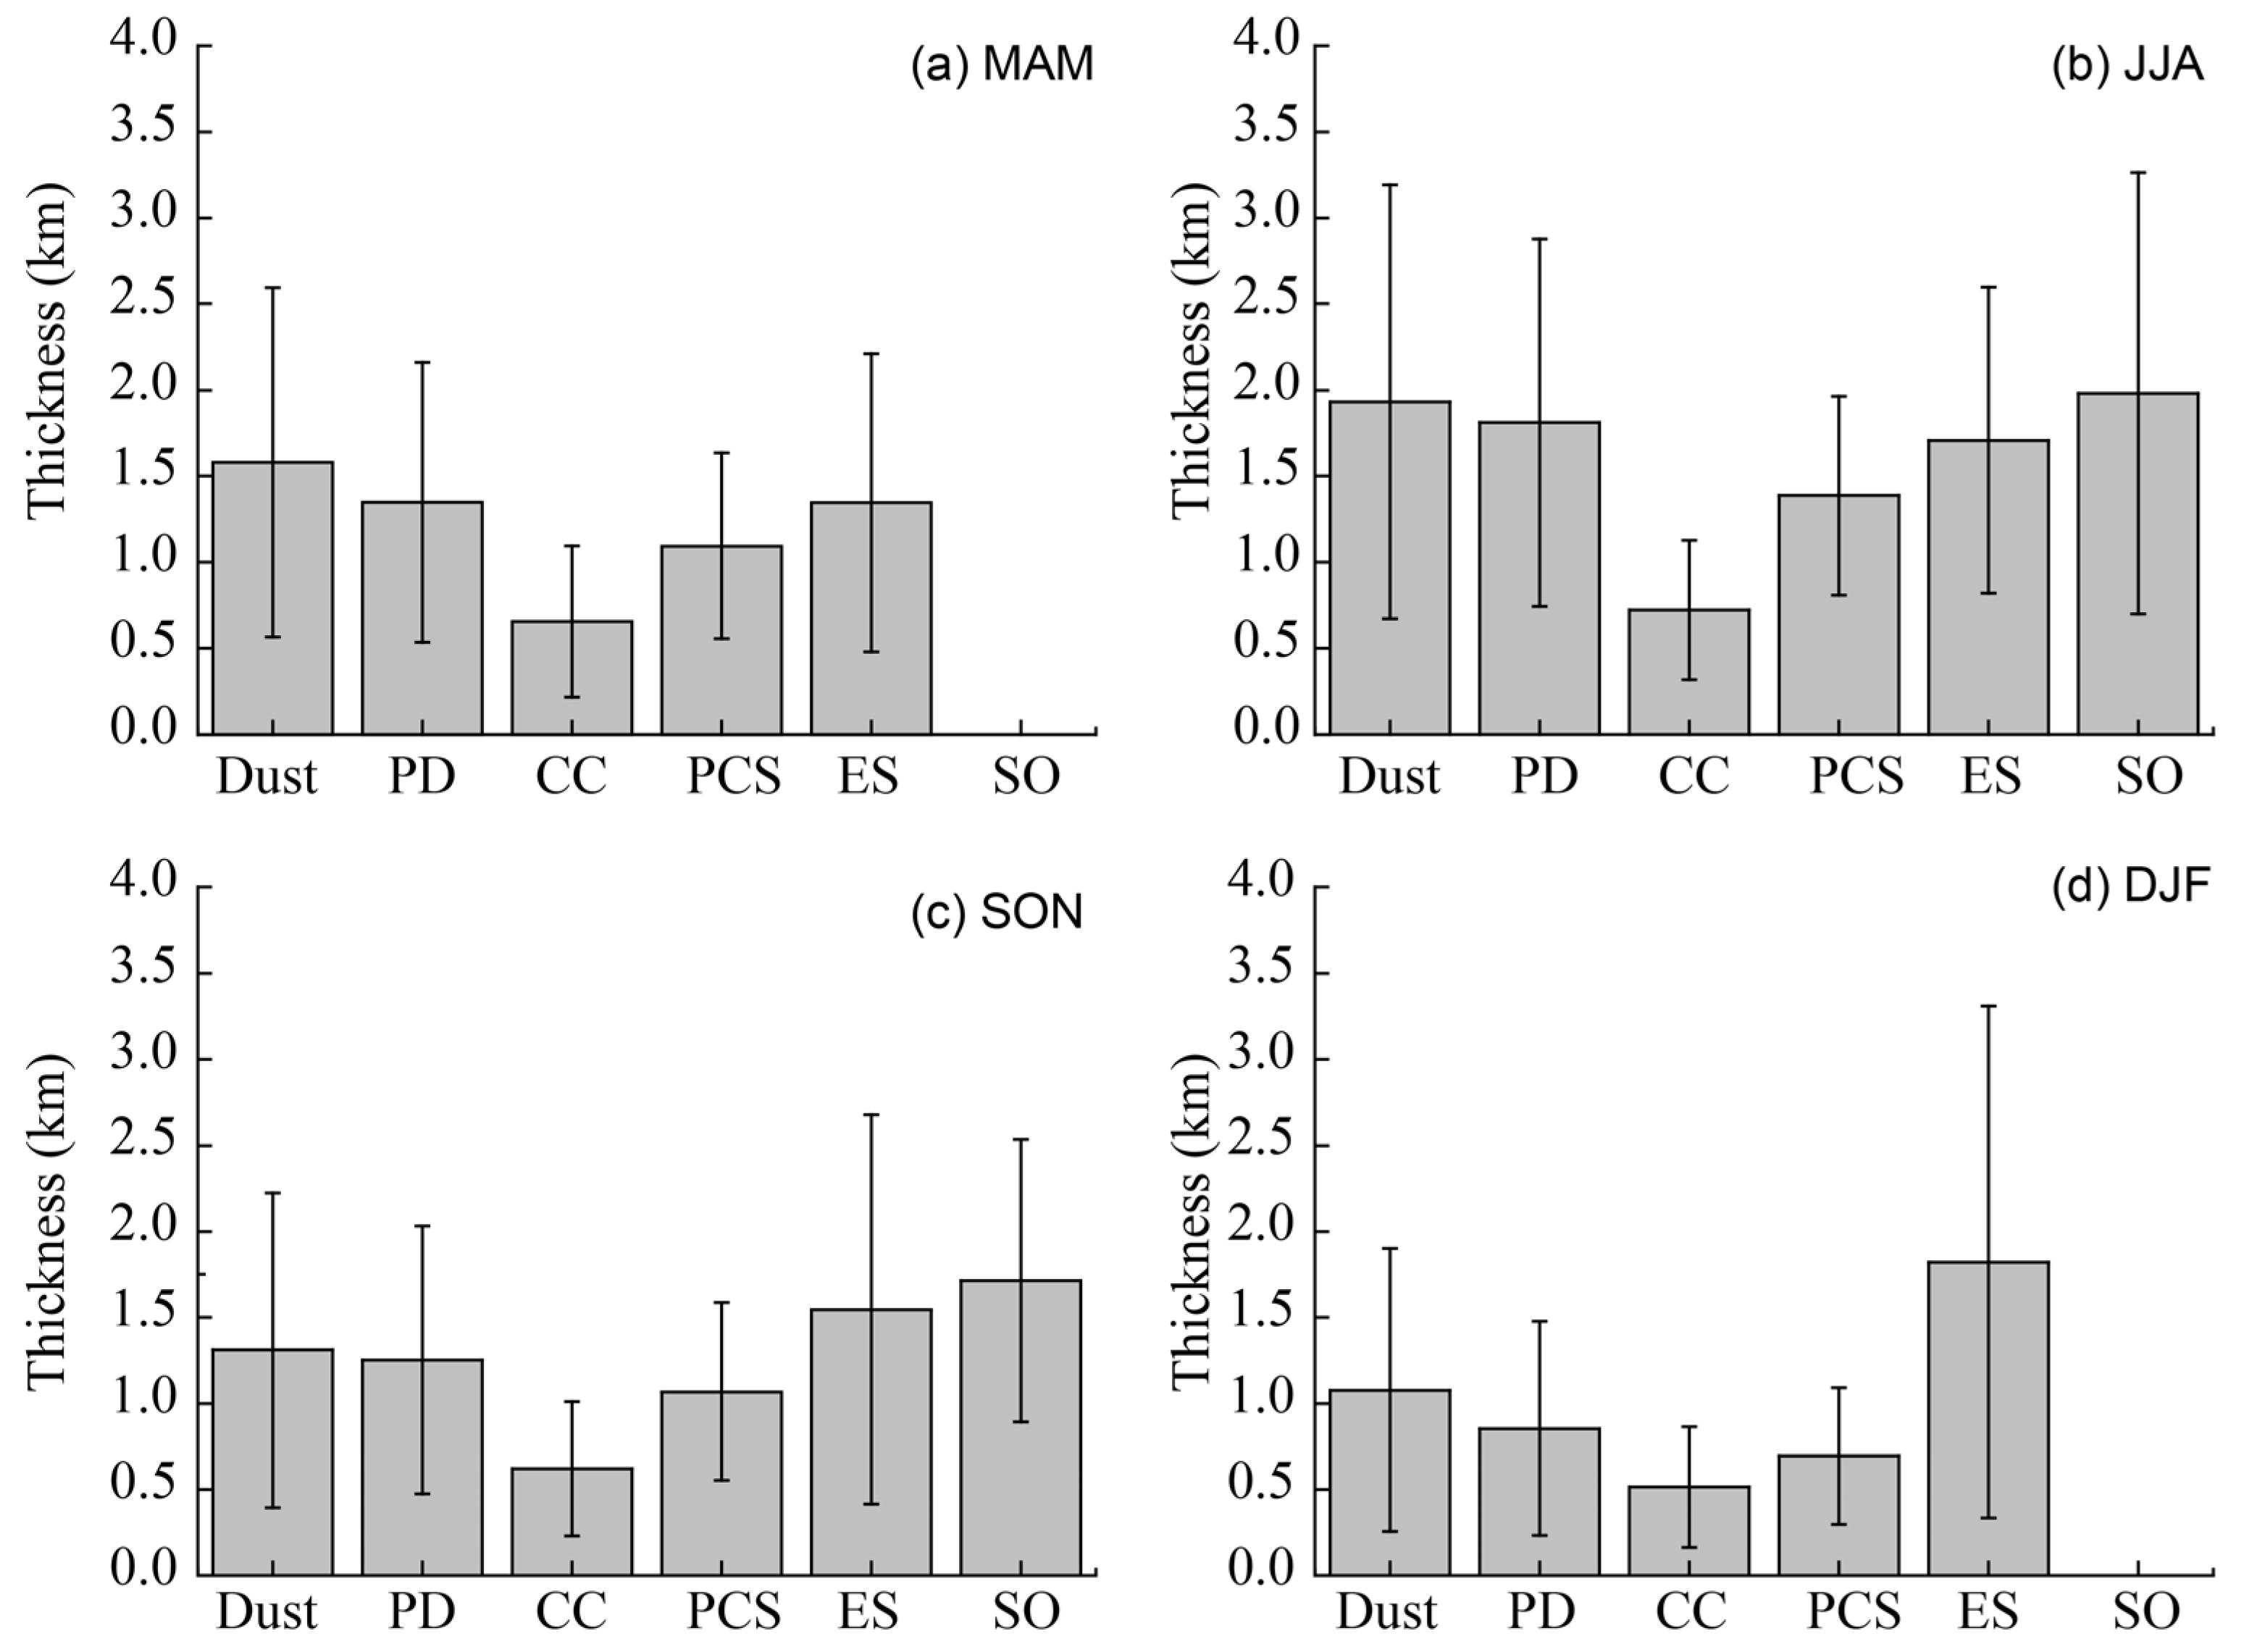
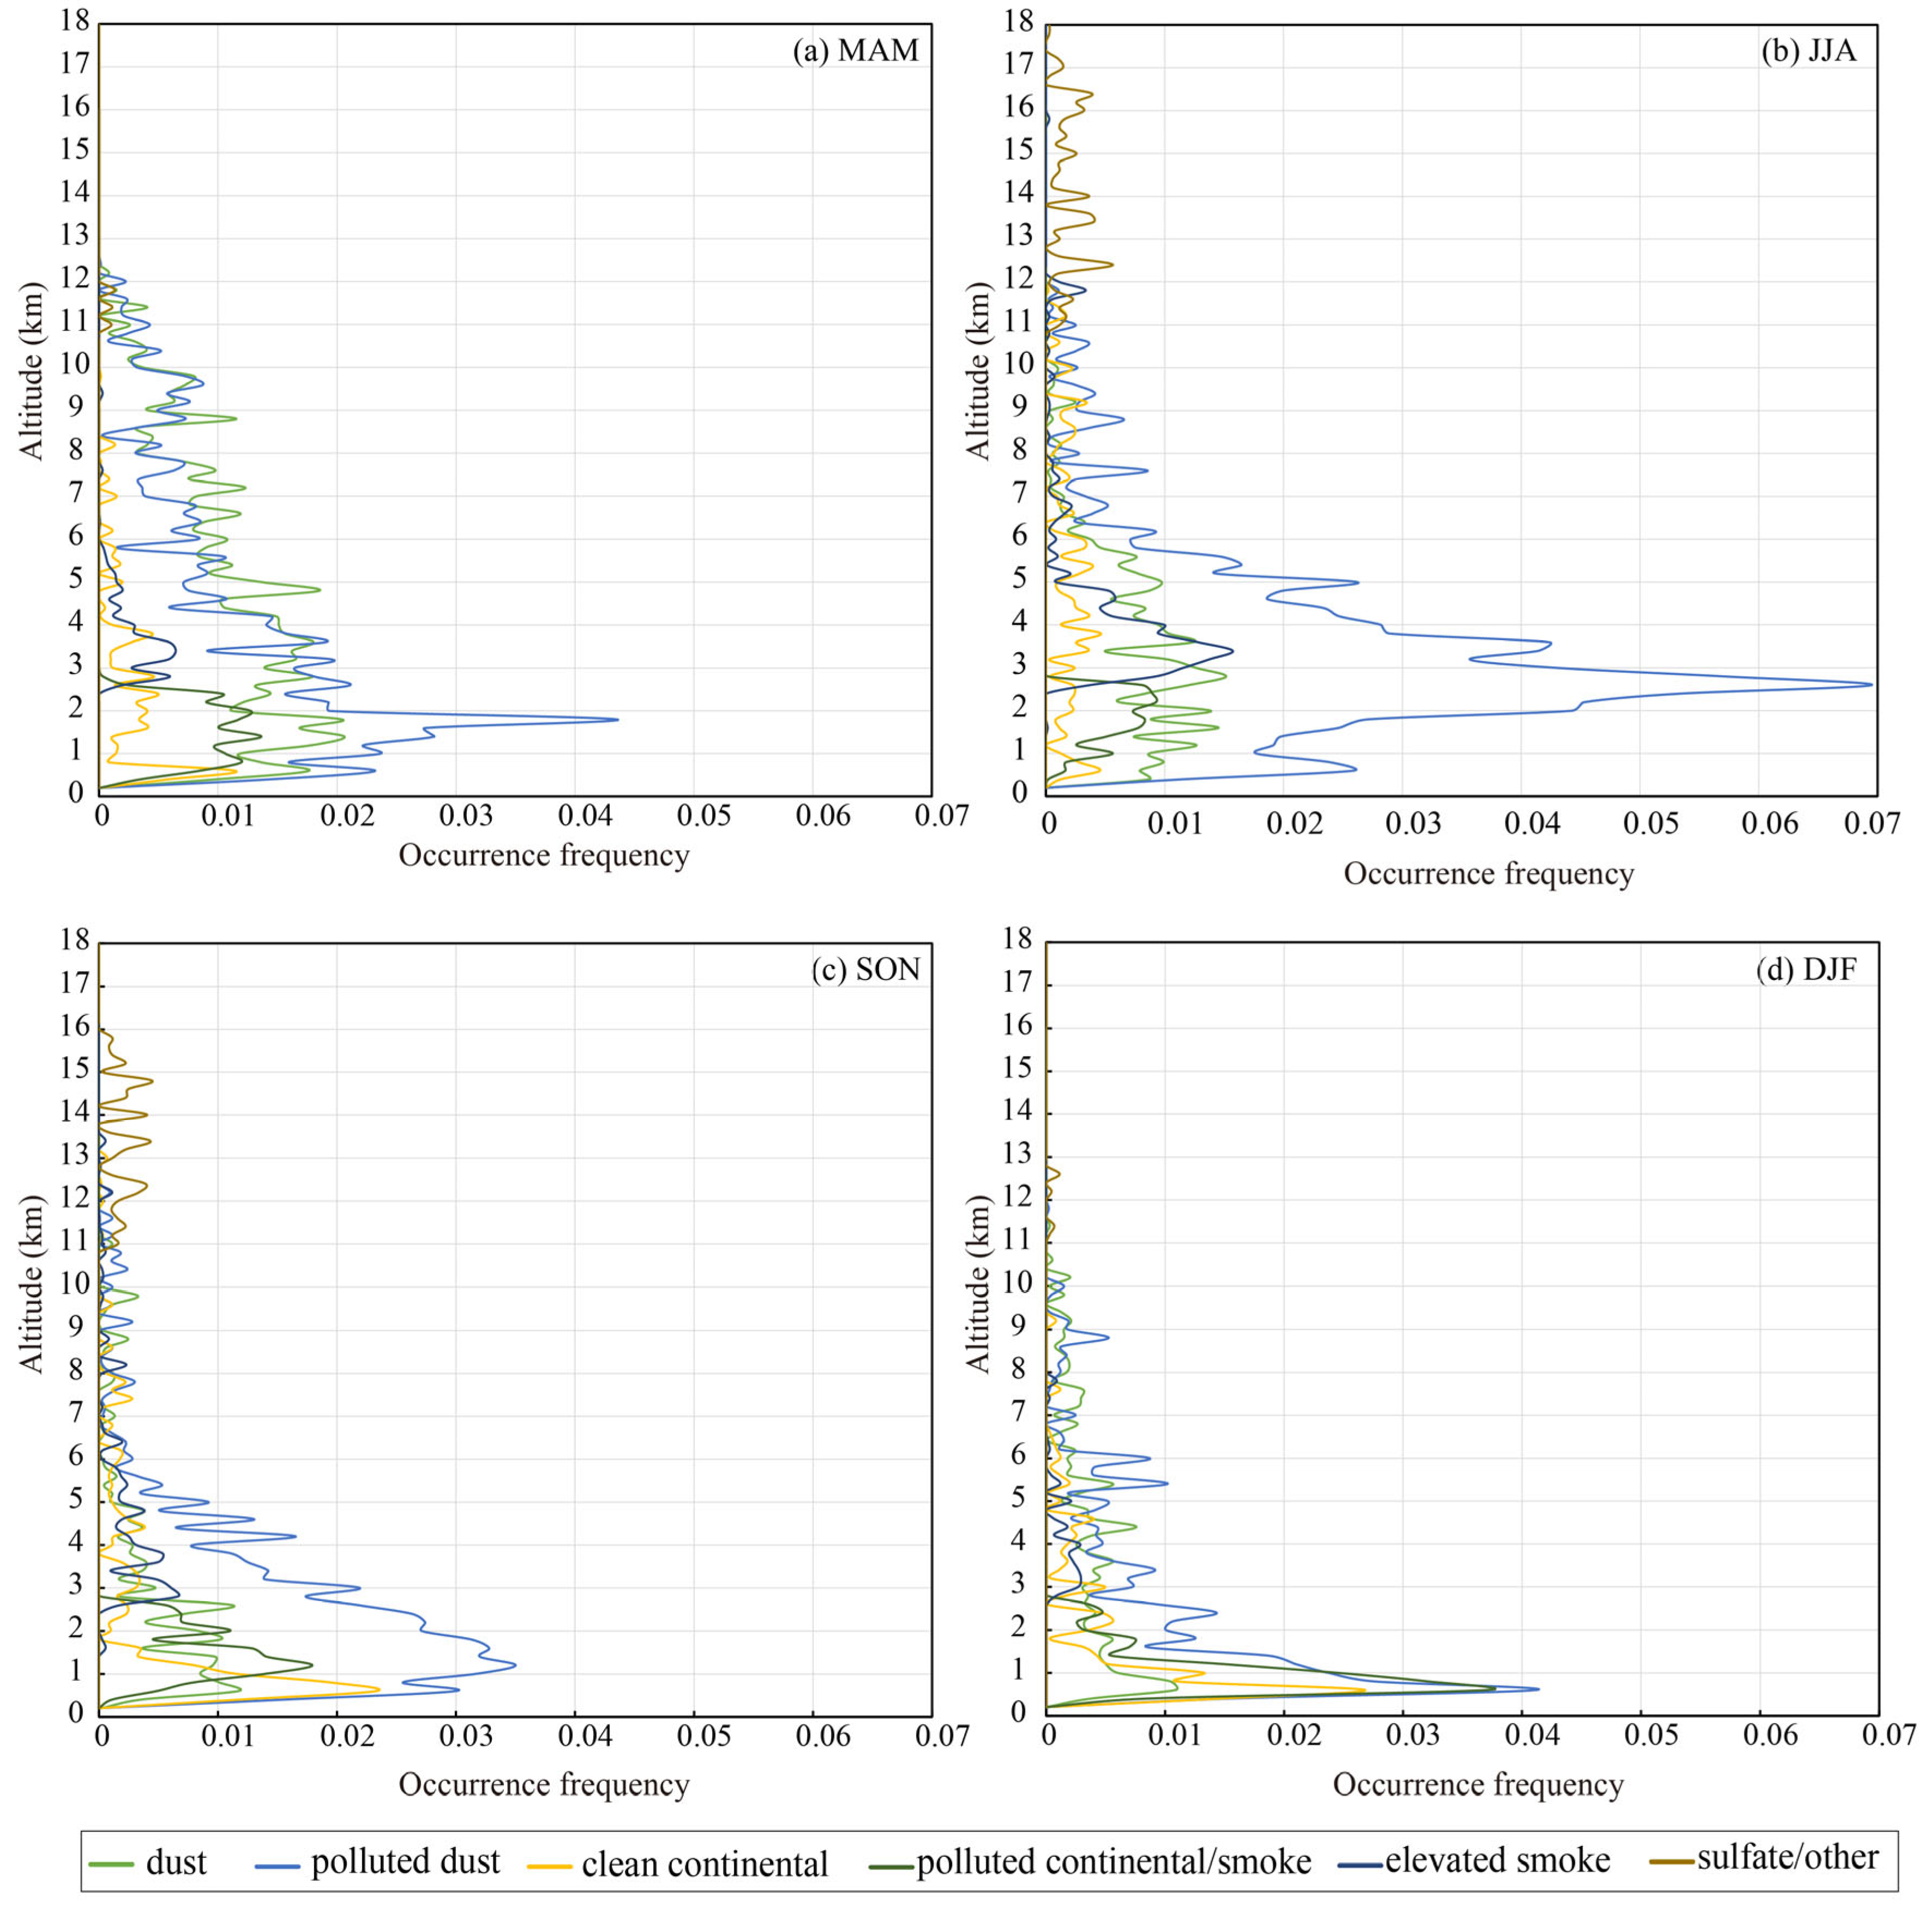
3.3. Altitudes of the Atmospheric Aerosol Layers over the Aral Sea Basin

This study also investigated the occurrence frequency altitudes of aerosol layers over the Aral Sea Basin, which is defined as the ratio of the number of an aerosol subtype detected at each given altitude level to the total CALIPSO overpass number in the vertical profiles. Figure 6 depicts the vertical distributions of occurrence frequencies for aerosol subtypes observed in different seasons over the ASB. The results showed that polluted dust and dust were the two dominant aerosol types in MAM and were distributed over wide ranges, showing the same variation feature, namely a peak at around 1.9 km and a gentle decline with height; both top layers were at approximately 12 km. Polluted continental/smoke was the second dominant aerosol and mainly distributed below 4.0 km. Other aerosols were mainly observed below 2 km, with occurrence frequencies of less than 0.01. In JJA, polluted dust was clearly the dominant aerosol from 0 km to 12 km and more frequently observed between 1 km and 5 km, peaking at approximately 2.6 km, with an occurrence frequency of 0.07, and then decreasing sharply with height. The occurrence frequency of dust and polluted continental/smoke was approximately 0.01 between 0 km and 5 km, then close to zero above 6 km. Polluted continental/smoke was mainly distributed at heights below 5.0 km. The obvious difference from MAM was that sulfate/other was observed, mainly distributed between 10 km and 18 km. Polluted dust, showing the same feature as JJA, was the dominant aerosol from 0 km to 6 km in SON, peaking at 1.0 km with a value of 0.35; both height and occurrence frequency were lower than that observed in MAM and JJA. Polluted continental/smoke, clean continental, and dust showed the same features, with little difference in the occurrence frequency from ground to 3.0 km. Sulfate/other was only observed between 12.0 km and 16 km in SON. In DJF, all aerosol subtypes were mainly concentrated within less than 3 km and their peak height decreased to less than 1.0 km. Polluted dust and polluted continental/smoke became the predominant aerosols by a small margin. No dominant aerosol was observed above 3.0 km. In terms of the heights of the dust top layers, the top layers of polluted dust were at approximately 12 km, 12 km, 12 km, and 10 km for MAM, JJA, SON, and DJF, respectively.
In the present study, the thickness of the aerosol layer was defined as the thickest continuous layer in each profile of CALIPSO dominated by one aerosol subtype [54]. Figure 7 presents the mean thickness of the aerosol layer over the Aral Sea basin from 2007 to 2021. The multi-year average thickness of the dust layer was 1.23 km, the seasonal average layer thickness was 1.93 km (JJA), 1.60 km (MAM), 1.30 km (SON), and 1.08 km (DJF). The thickness of the polluted dust layer showed the same feature as that of dust, reaching the maximum in JJA (1.81 km) and the minimum in DJF (0.85 km), with a mean value of 1.32 km. The clean continental layer in MAM, JJA, SON, and DJF was the thinnest compared to the other aerosol types over the ASB, at 0.65 km, 0.72 km, 0.62 km, and 0.11 km, respectively. The thickness of polluted continental/smoke in JJA (1.39 km) differed significantly from that of DJF (0.69 km). There was no difference in MAM and SON (around 1.06 km). Furthermore, even if the frequency of occurrence was lower than that of dust and polluted dust, the thickness of the elevated smoke layer remained a concern in the ASB: DJF (1.82 km), JJA (1.70 km), SON (1.54 km), and MAM (1.54 km). Although sulfate/other was only detected in JJA and SON, its thickness, which could be up to 1.98 km and 1.71 km in JJA and SON, respectively, could not be ignored. The seasonal fluctuations in the thickness of dust, polluted dust, and continental/smoke layer were all less than 20%, indicating a persistent dust aerosol layer over the ASB and nearby areas. This identified the ASB as a key source and/or channel of aerosols from the desert to the surrounding areas.

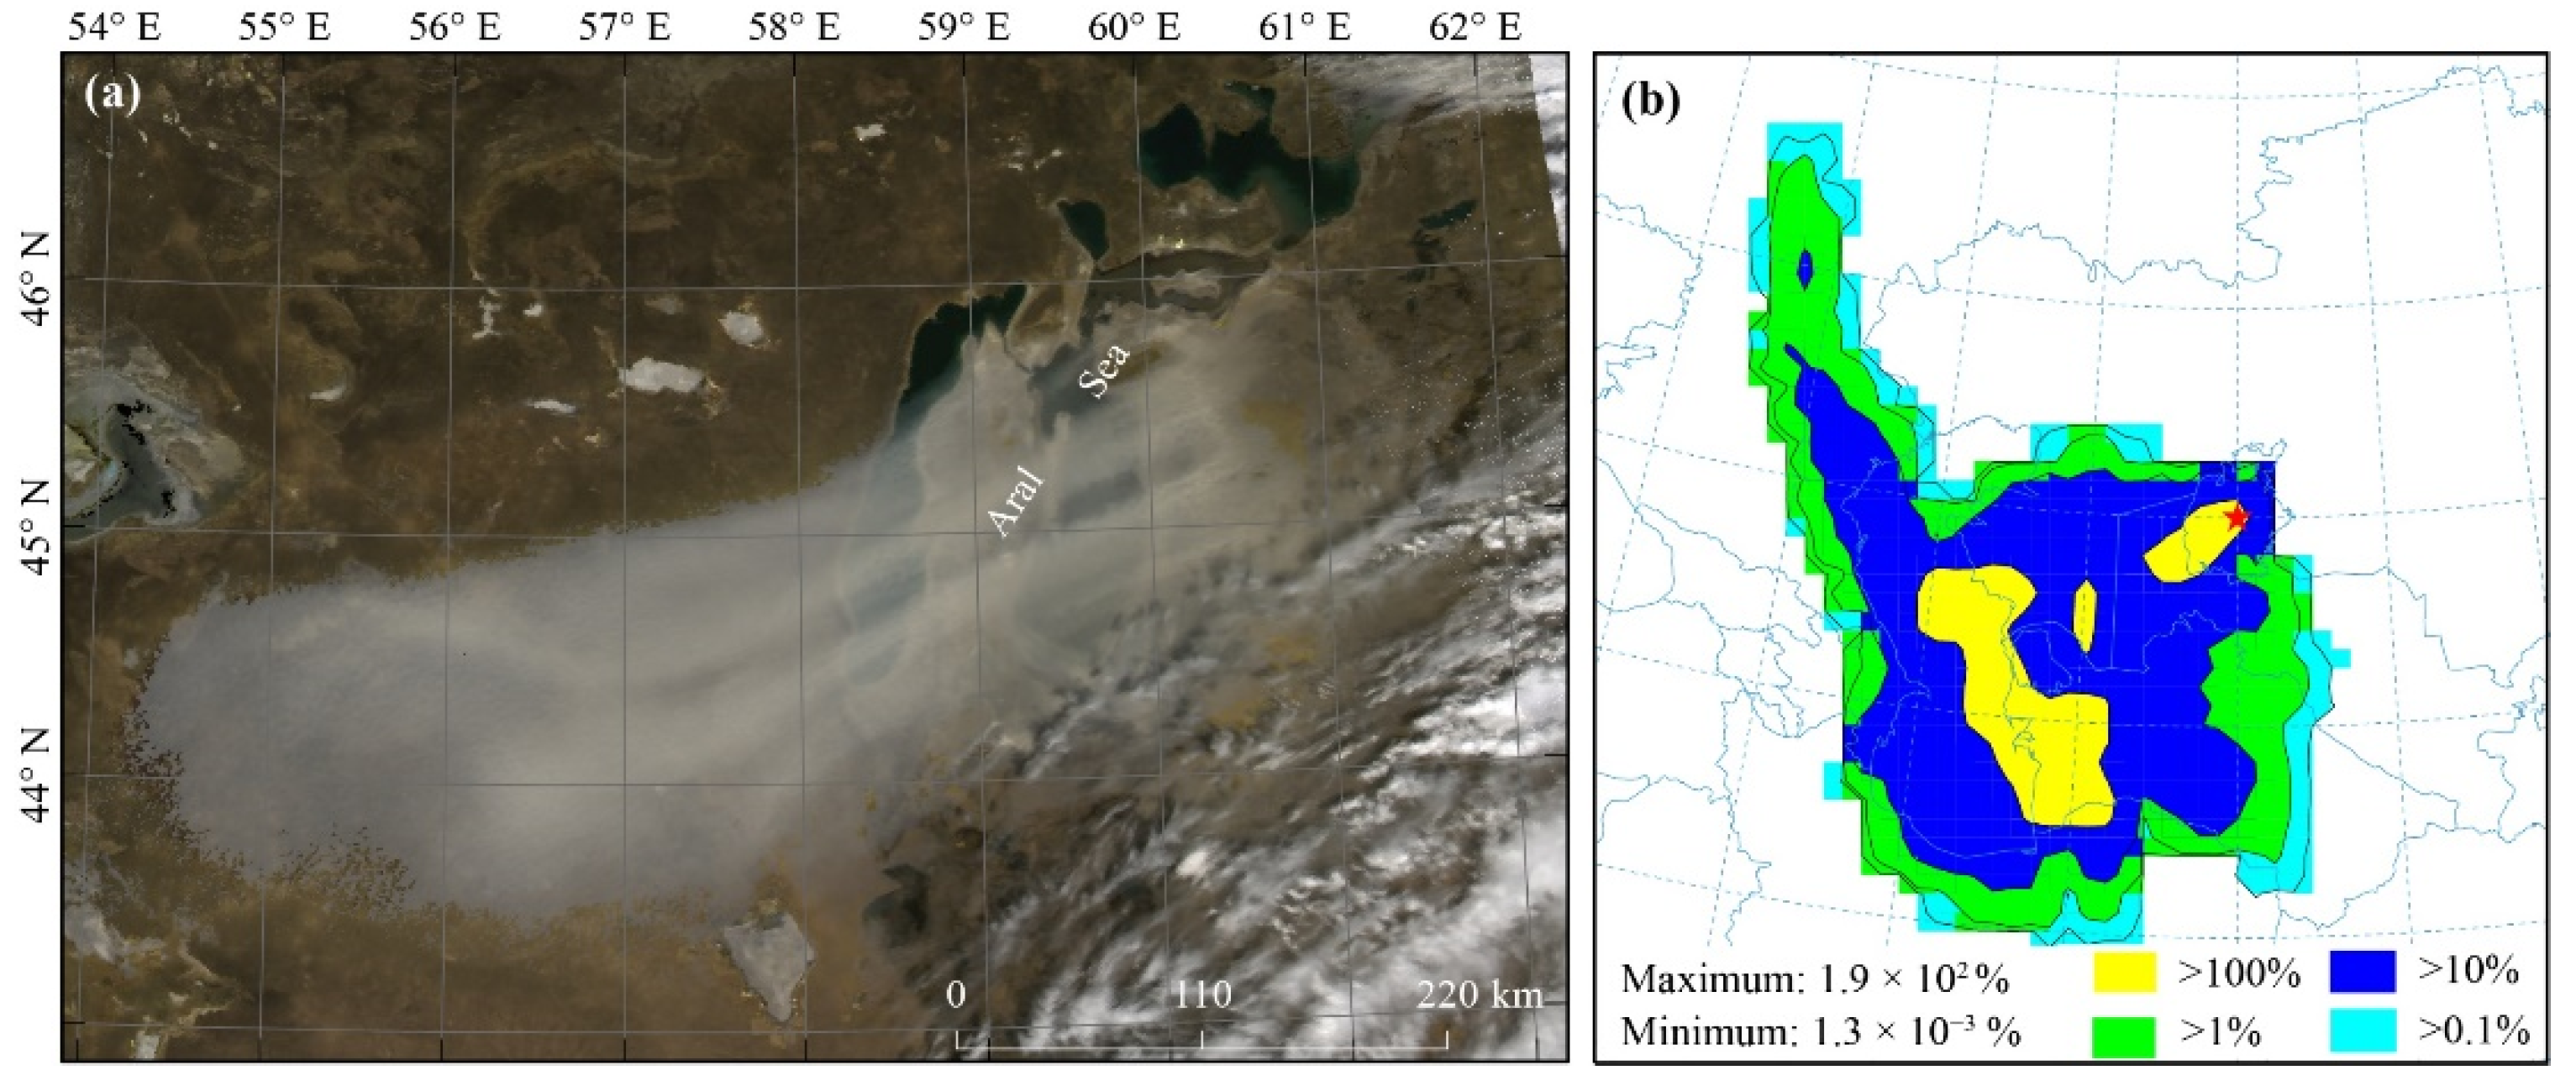
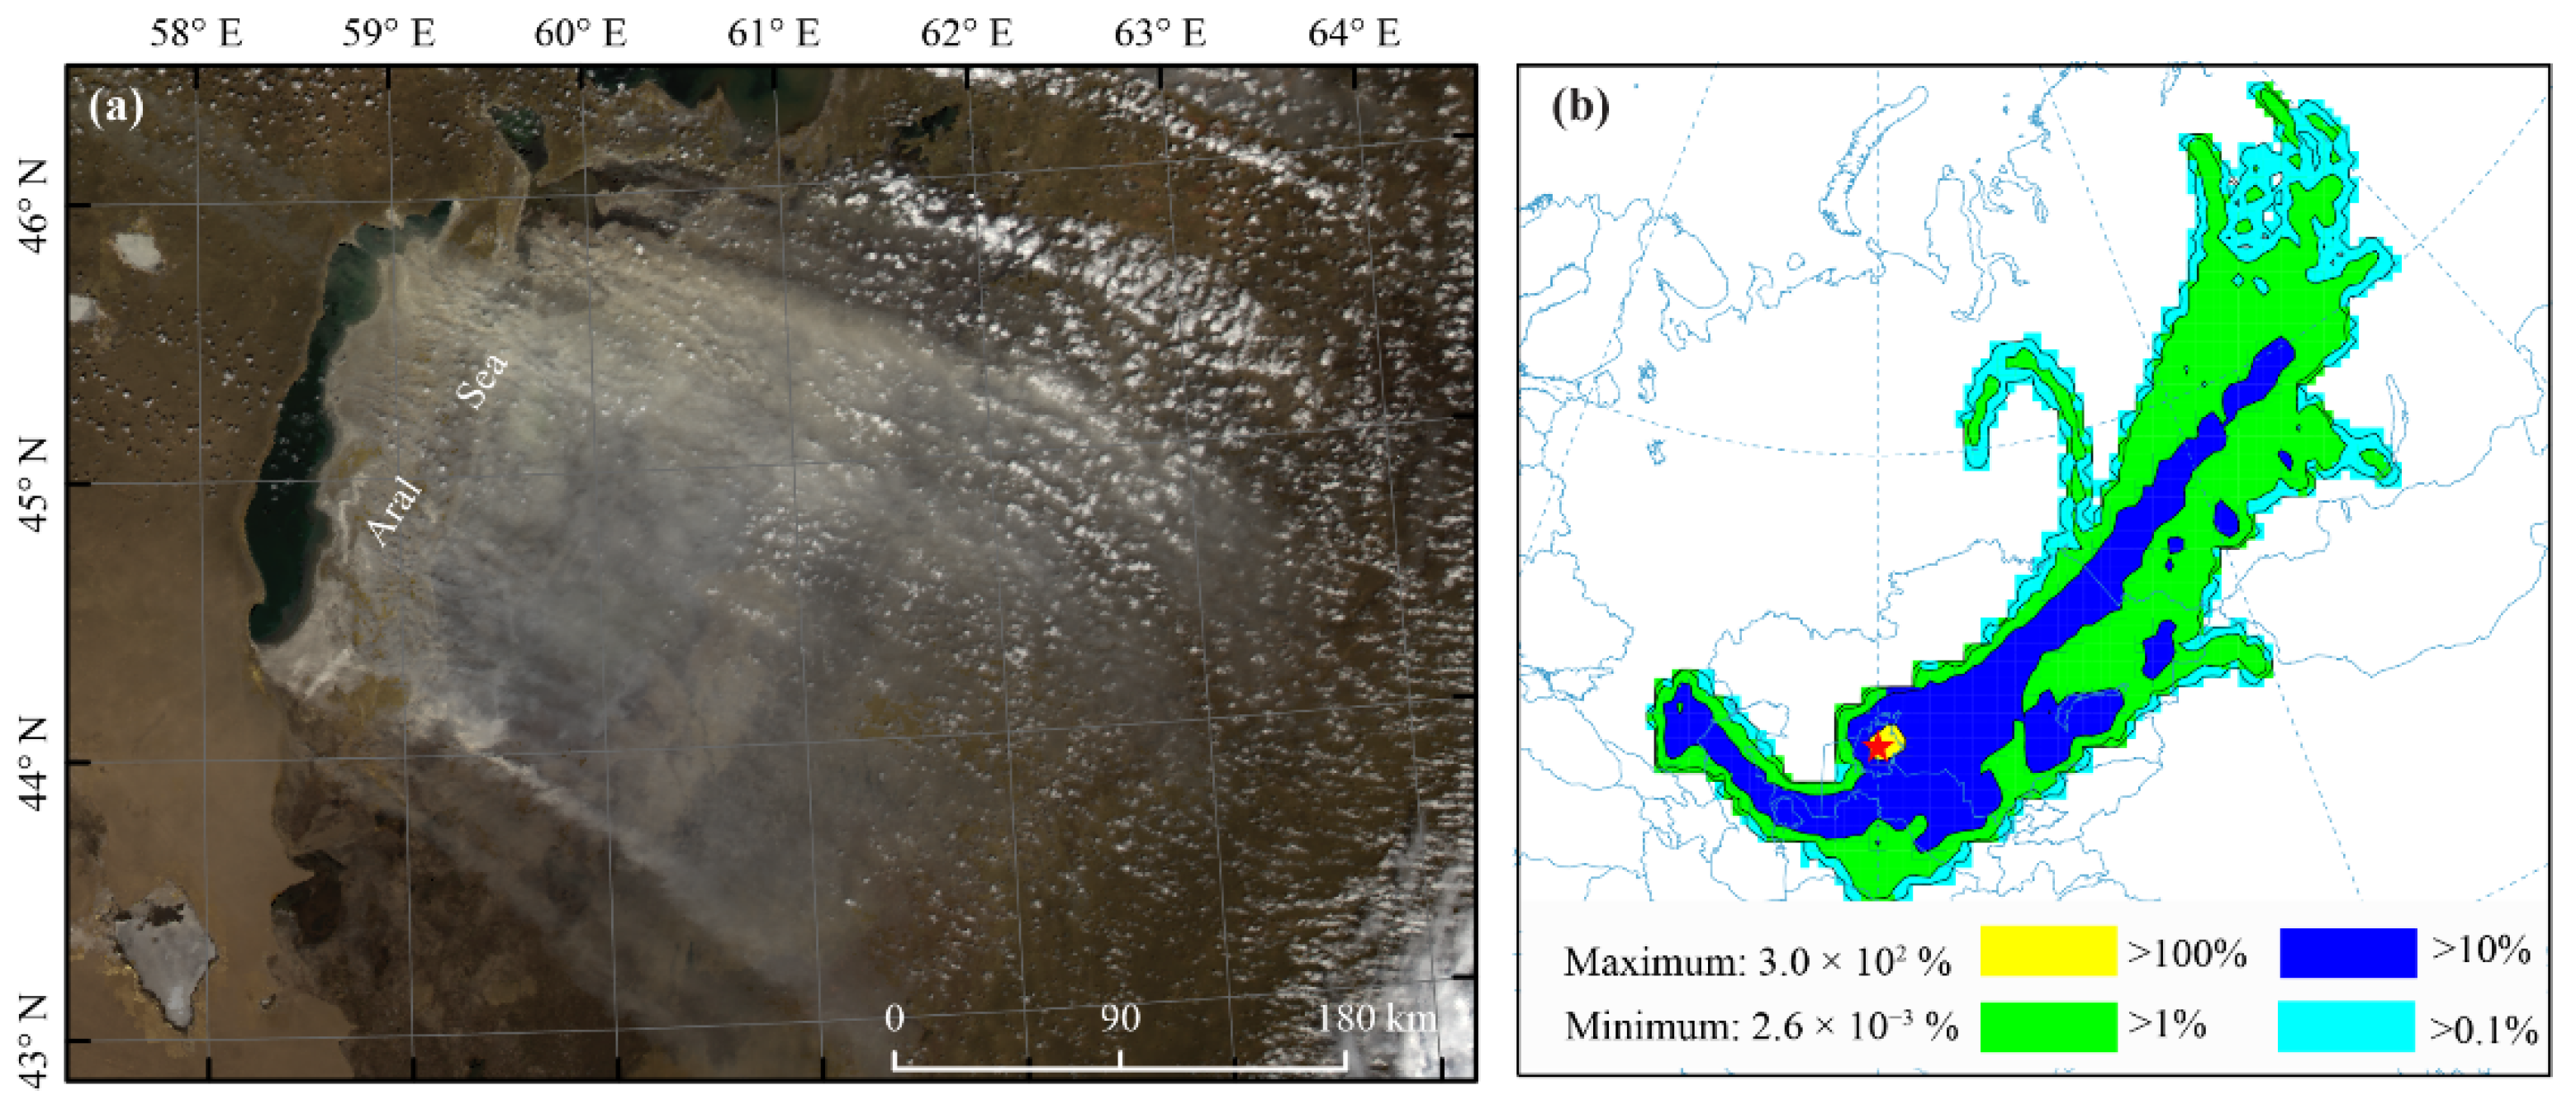
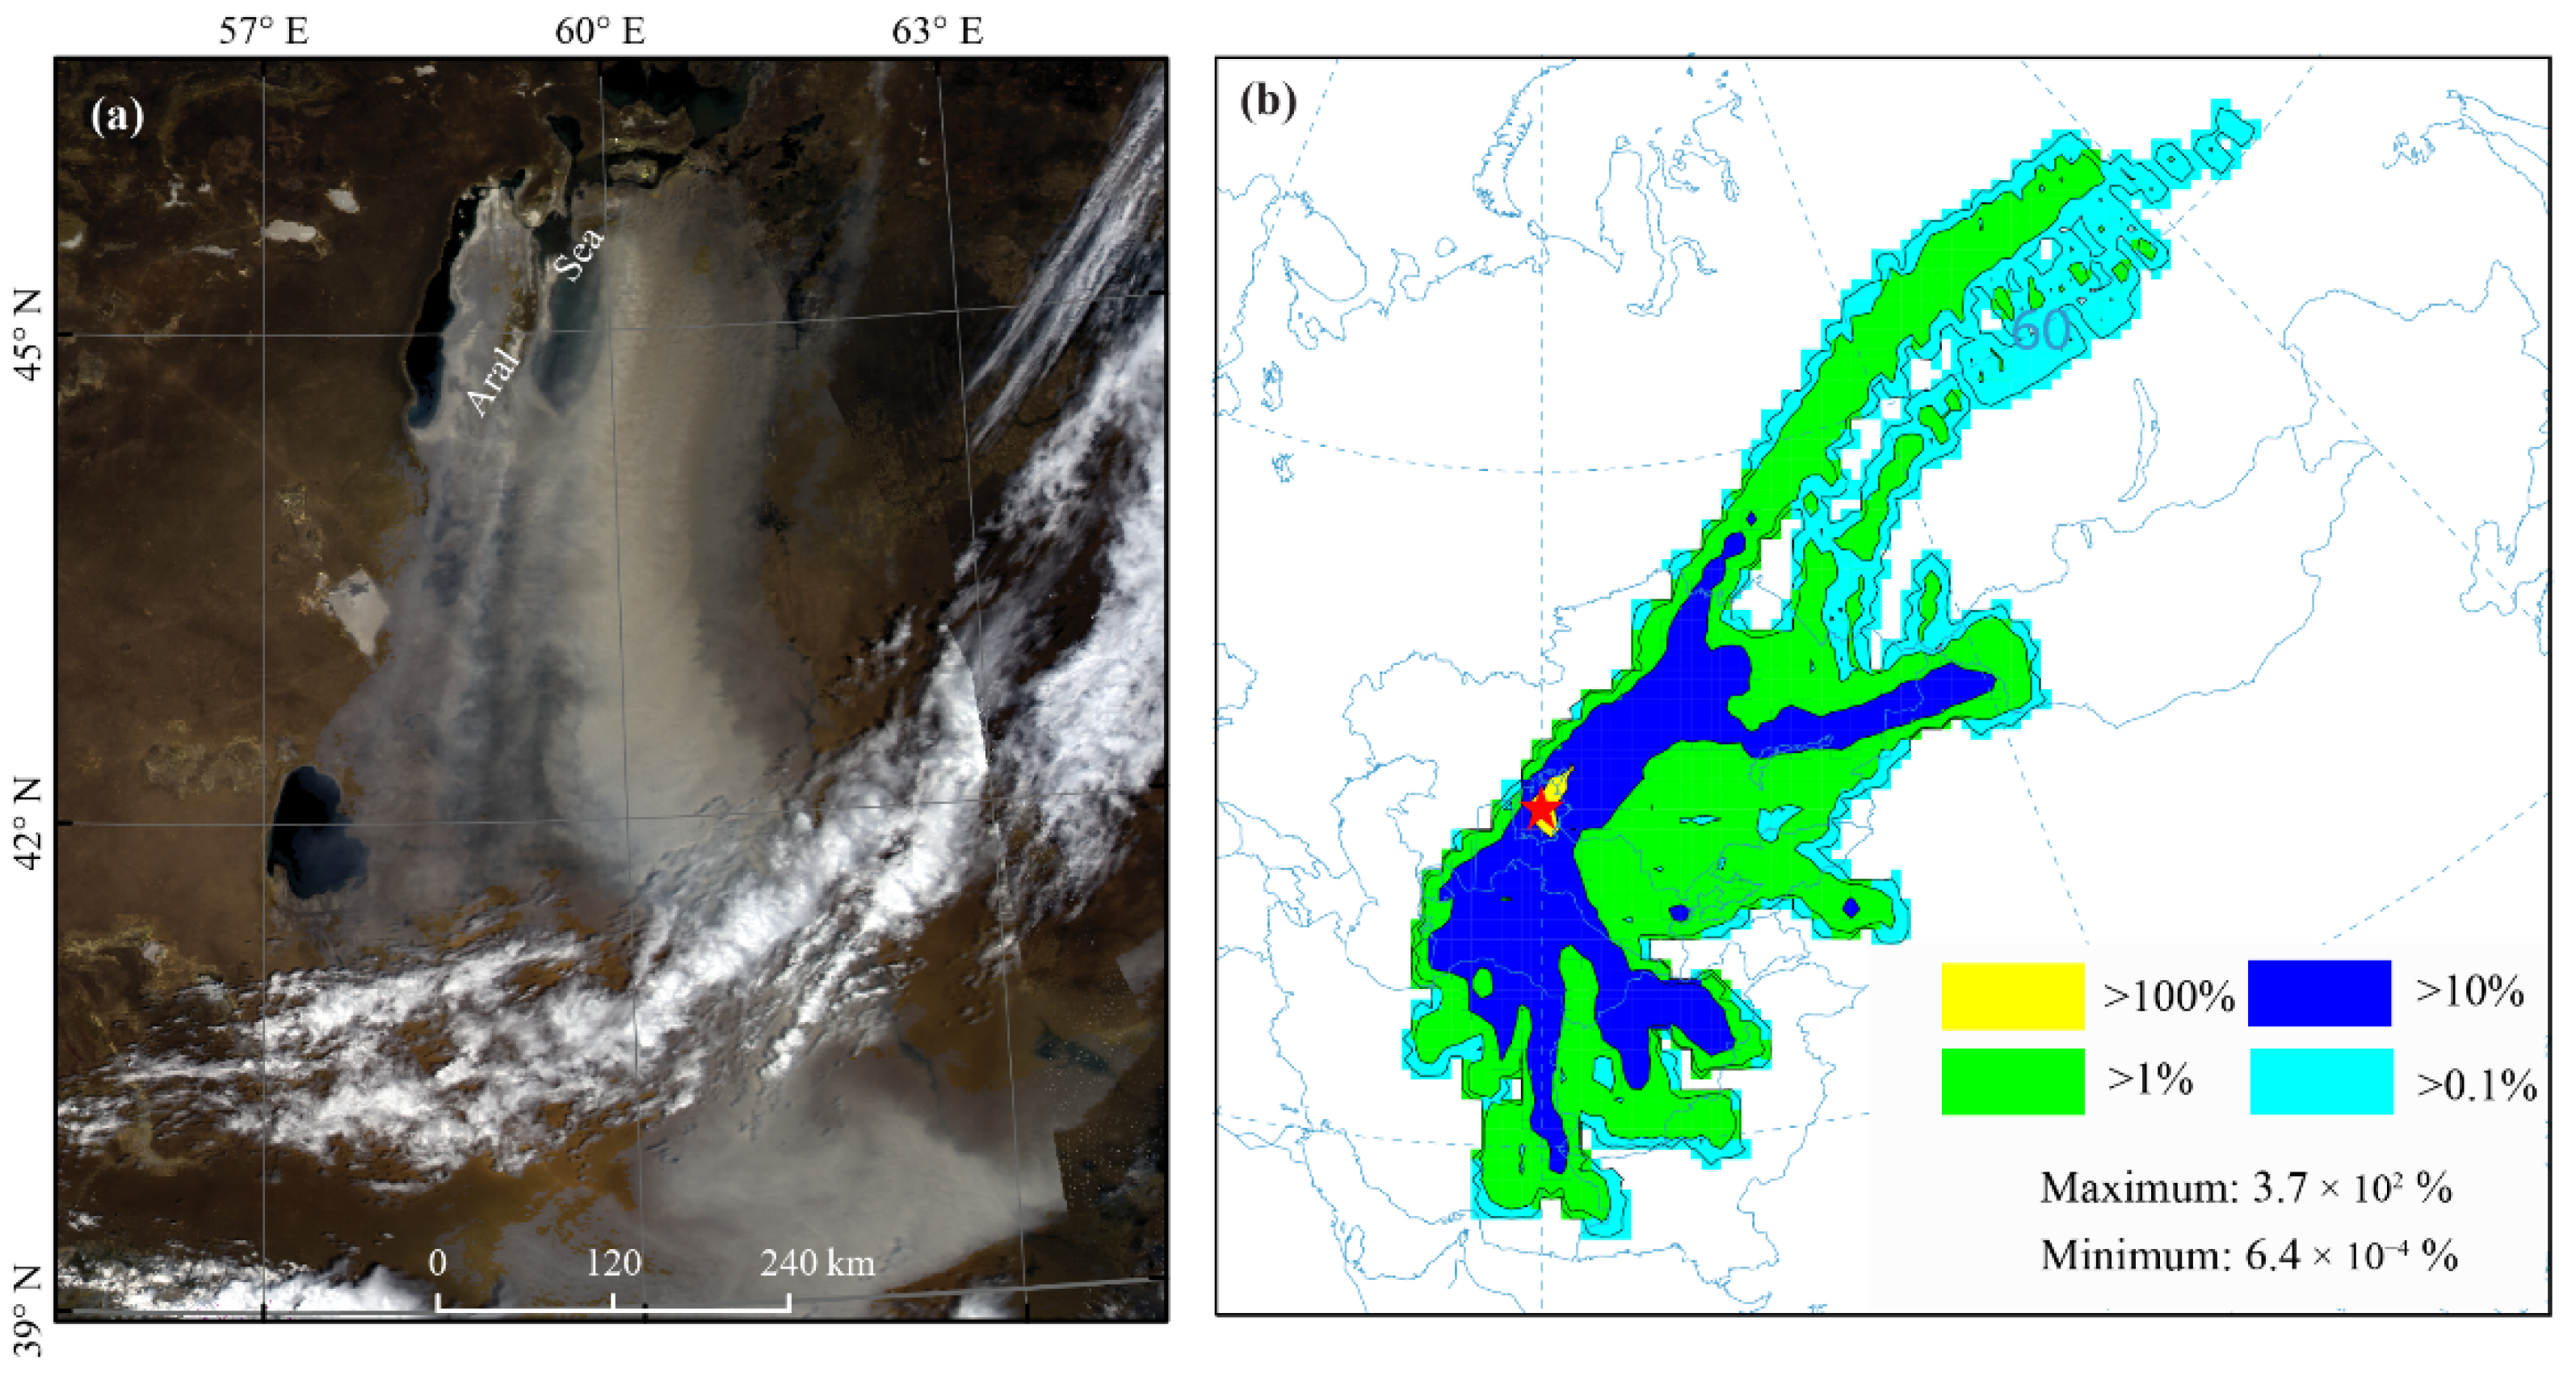
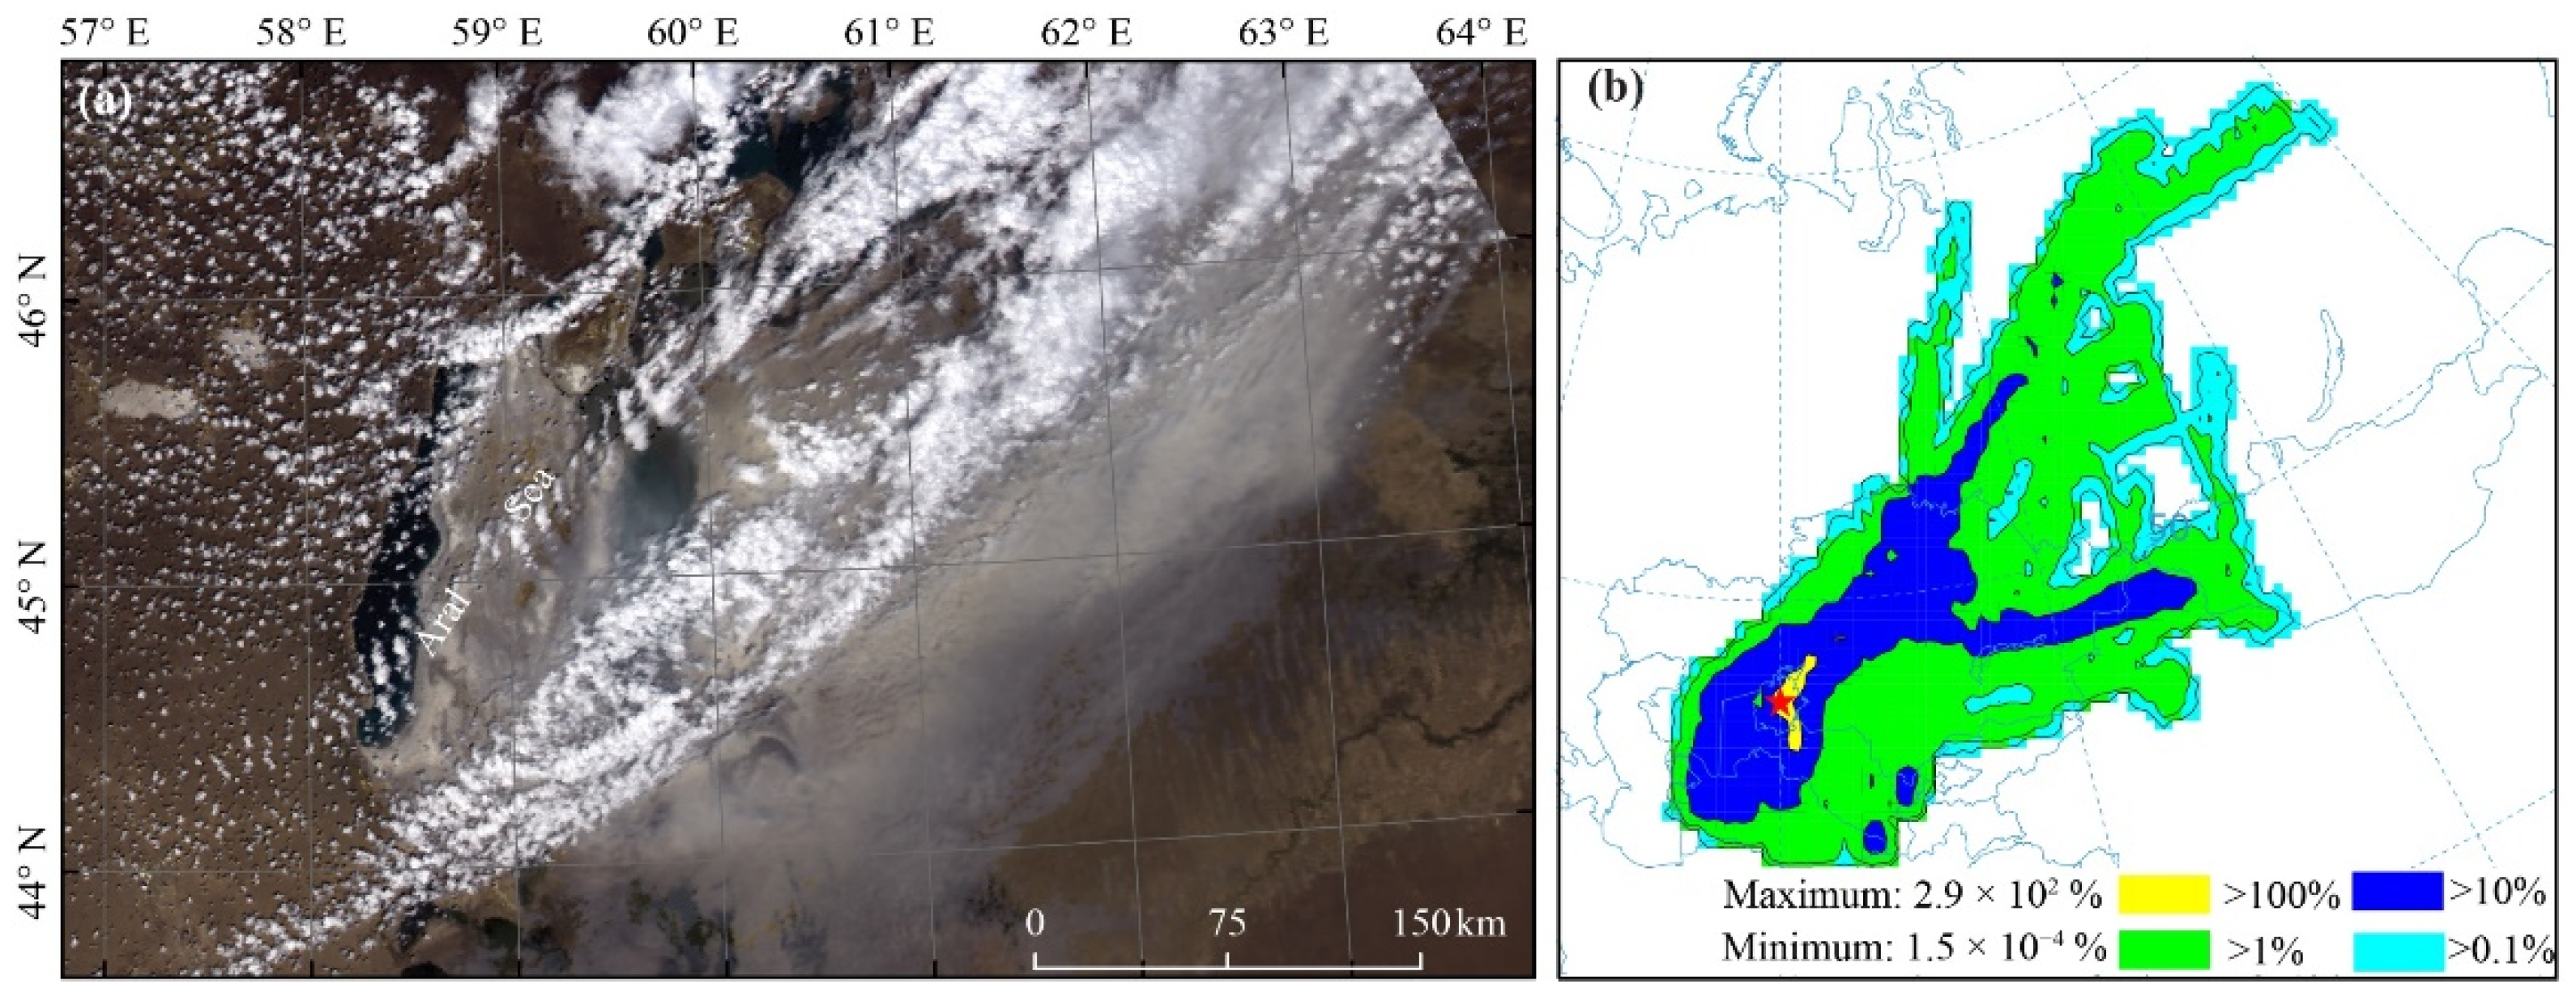
3.4. Case study of the Potential Long-Range Transport of Atmospheric Aerosols from the Aral Sea Basin

Significant long-range transport of dust aerosols is often observed in the Aral Sea Basin, especially since the Aral Sea shrank rapidly and dried up partially. In this study, we paid attention to the potential long-range transport of the atmospheric aerosols in events of dust and sand storm from the Aral Sea Basin. In this paper, we took measurements in 2008, 2014, and 2018, captured by the Moderate Resolution Imaging Spectroradiometer (MODIS), for four of these typical sand and dust storm events as case studies. The trajectory frequency analysis in the HYSPLIT model made it possible to see the spatial pattern of potential long-range transport and peaks of potential atmospheric aerosol concentrations after leaving the dry lakebed of the Aral Sea. In this study, trajectory frequency analysis first counted the number of endpoints along one trajectory that fell within each grid cell (1.0 degree), then normalized the results by the total number of trajectories. Four trajectory frequency classes (%) were presented, namely, trajectory frequency greater than 100% and less than the maximum value, trajectory frequency greater than 10% and less than 100%, trajectory frequency greater than 1% and less than 10%, and trajectory frequency greater than 0.1% and less than 1%, which indicated the locations most frequently impacted by the potential transport of atmospheric aerosols originating from the Aral Sea. The range covering greater than minimum value and less than 0.1%, was not shown in the figure because of the low frequency of trajectories.
Figure 8a shows a sand and dust storm traveling to the southwest from ASB on 29 April 2008, captured by MODIS. The potential long-range transport of the atmospheric aerosols from the Aral Sea Basin over the next 3 days is shown in Figure 8b. This southwest event had the potential to cover a large area, and the aerosols could be transported over a long distance, mainly impacting Uzbekistan, Turkmenistan, and northeastern parts of Iran, but also reaching areas as far as the Caucasus region. The potential high atmospheric aerosol concentrations, namely the yellow zone (>100%), as shown in Figure 8b, were mainly in the vicinity of the Aral Sea but also in adjacent regions. The blue zone covered a vast area, including Uzbekistan, Turkmenistan, Iran, and the Caucasus region, with potential lower atmospheric aerosol concentrations (trajectory frequency that was greater than 10% and lower than 100%). During the event, the green and light-blue parts in the figure were the regions that recorded less atmospheric aerosol concentrations (>1%).
A sand and dust storm event that began travelling southeastward and then turned northeastward occurred on 25 April 2014, and its potential long-range transport of atmospheric aerosols from the Aral Sea Basin are depicted in Figure 9. The figure clearly shows that atmospheric aerosols from the dry lakebed of the Aral Sea could be transported for thousands of kilometers within 3 days, possibly reaching as far as Siberia, in Russia. As far as source regions were concerned, Uzbekistan, Turkmenistan, and Kazakhstan were the regions that would be impacted by the atmospheric aerosols emitted from the dry lakebed of the Aral Sea. In this event, the potential high concentration (yellow zone) of atmospheric aerosols was mainly around the Aral Sea, which would have a great impact on ecosystems (including ice and snow surfaces in central Asia) and human health in the vicinity and adjacent regions of the Aral Sea. The blue and green zones (with a trajectory frequency less than 100% and greater than 1%) extended across long distances to the northeast after being lifted to a high altitude under the action of the westerly winds, covering most of Uzbekistan, Turkmenistan, and Kazakhstan, and even parts of the Tianshan Mountains. The potential long-range transport of the atmospheric aerosols from the Aral Sea Basin would significantly impact the climate within the Aral Sea through direct and indirect radiative effects, and deposited aerosol would further affect dryland ecosystems, human health, and the melting of snow and ice in mountains because of the albedo effect [22,55].
Another typical sand and dust storm event occurred on 27 May 2008. The sand and dust event first traveled southward and then turned toward the northeast. Figure 10b shows a summary of the potential long-range transport for the event. During this event, the long-range transport of atmospheric aerosols was more intense south of the Aral Sea. The potential high atmospheric aerosol concentrations (yellow and blue zones) were mainly transported to Uzbekistan, Turkmenistan, and the Iranian Plateau at a lower altitude. After being lifted to a high altitude, the aerosol then turned northeast and was transported for a long distance because of the perennial westerly jet stream, which showed a transportation pattern similar to that found in the sand and dust event that occurred on 25 April 2014. The green zone in the figure could extend to the Tianshan Mountains region in arid central Asia, possibly affecting the vegetation and leading to the melting of snow and ice in the mountain areas after the aerosol settled in this area. On the basis of potential atmospheric aerosol concentrations depicted in the figure, we estimated an increase in the atmospheric aerosol concentrations in the Tianshan Mountain region attributed to the atmospheric circulation and weather systems.
Images taken by MODIS show the sand and dust storm that occurred on 29 May 2018, and the potential long-range transport of the atmospheric aerosols from the Aral Sea Basin. The event was selected as the typical northeastward traveling dust storm event in the present study (Figure 11). The yellow zone was still concentrated near the Aral Sea, indicating its near-source and environmental effects. This particular pattern was the evidence of long-range transport of aerosols from the ASB. The blue and green zones (with a trajectory frequency less than 100% and greater than 1%) made it possible to see the plume of the potential long-range transport of the atmospheric aerosols from the ASB, covering most of the countries within the basin, such as Uzbekistan, Kazakhstan, and Turkmenistan (Figure 1), and extending east and northeast to parts of China, Mongolia, and Russia, and especially to the Tianshan Mountains. Westerly jets played an important role in the long-distance transport of aerosols in this region. Analysis showed that air masses coming from the ASB would have the potential for long-range transport of atmospheric aerosols to the northeast. Forward trajectories frequency suggested that such events contributed to the concentration of the atmospheric aerosols in the downwind area. Note that, for the event analyzed, the air mass coming from the Aral Sea contained a high load of dust and polluted dust aerosols.

4. Discussion

4.1. Dominant Atmospheric Aerosol Subtypes over the Aral Sea

Five types of aerosol subtypes in the troposphere over the dry lakebed of the Aral Sea, namely dust, elevated smoke, clean continental, polluted continental/smoke, and polluted dust, were observed. Of these, dust and polluted dust were the two most dominant tropospheric aerosols, the sum of both accounting for 84%, 78%, 66%, and 62% of all the aerosols in MAM, JJA, SON, and DJF, respectively (Table 1). Dust was mostly mineral soil from the land surface, while polluted dust was a mixture of desert dust and environmental pollutants. Since the CALIPSO satellite began to acquire data in 2007, it is impossible to obtain complete data on the variations in the characteristics of aerosols with changes in the Aral Sea area from the 1960s. So, we focused on the time period starting from 2007. The Aral Sea broke into three separate lakes in 2006 (Figure 1) and then broke into four different water bodies in 2009. The eastern section of the south Aral Sea disappeared in 2014. As the Aral Sea shrank, the salt desert landscape continued to expand within the dry lakebed and a new desert formed on the dry lakebed of the Aral Sea, namely the Aralkum Desert, which became an important dust source in arid central Asia [56,57]. Dust storms from the dry lakebed contain a special saline-alkali dust because of the special composition of the lake’s sediments, which contains high concentrations of salt, heavy metals, pesticides, and other substances (sulfates (SO42−), nitrates (NO3), and ammonium (NH4+)). The special dust storms would contribute greatly to the frequent occurrence of polluted dust and polluted continental/smoke. The AOD over the Aral Sea has increased in the last decades and the rising trend of the AOD in the Aral Sea area is clear. The contribution of polluted dust and dust aerosols to the AOD has increased with an average AOD of around 0.25 [33,58], which is not much different from the CALIPSO value over the Tarim Basin [59,60]. Sulfate/other was the only stratospheric aerosol observed over the ASB, which could possibly be transported out of this region. The current research results reflected the composition and variation characteristics of aerosols in the current Aral Sea region.

4.2. Variations and Long-Range Transport of Aerosols from the Dry Lakebed of the Aral Sea and Their Implications

With environmental degradation within the ASB, the occurrence frequency of dust and polluted dust has shown a slight increase from 2007 to 2021, especially in 2013 and 2014, when the east section of the south Aral Sea temporarily disappeared (Figure 3). In arid central Asia, dust events occur frequently in the spring and summer seasons [61]. The seasonal occurrence frequency of dust and polluted dust for the years 2007 to 2021 also showed the same feature, reaching 0.57 and 0.60 in MAM for dust and polluted dust, respectively. In JJA the figures were 0.28 and 0.91 for dust and polluted dust, respectively. The sand and dust storms in JJA in the Aral Sea Basin are especially active in this season. The monthly occurrence frequency of aerosol subtypes for the years 2007 to 2021 could corroborate this result, with a high occurrence frequency of dust and polluted dust in June, July, and August (Figure 5). In MAM, due to the freeze–thaw cycle and salt cementation in the dry lakebed of the ASB, the wind erosion of the dry lakebed is weak, while the wind erosion in the Aralkum Desert areas is strong, resulting in a higher occurrence frequency of dust; however, with decline in the groundwater level in the Aral Sea, because of irrigation and household water [56], as well as the thawing cycle in the dry lakebed, the wind erosion of the dry lakebed of the Aral Sea increased sharply, resulting in a significantly higher occurrence frequency of polluted dust than that of dust in JJA.
Vertical distributions of occurrence frequency for aerosol subtypes observed in different seasons over the ASB showed that polluted dust and dust were distributed over wide ranges, especially between 1 km and 5 km, and the mean thickness of the dust and polluted dust layer over the whole dry lakebed of the Aral Sea was approximately 1.30 km. The above features created decisive conditions for the long-range transport of atmospheric aerosols from the dry lakebed of the Aral Sea, which has been discussed in many studies [33,37,62]. This study specifically and vividly described the long-range transportation of atmospheric aerosols of typical dust events from the Aral Sea, which provides a reference and comparison for related research work. The potential long-range transport of the atmospheric aerosols from the dry lakebed of the Aral Sea over a period of 3 days could cover a large area as follows: the main impact would be felt in Uzbekistan, Turkmenistan, and Kazakhstan in the source region, the impact would extend to the Caucasus region, parts of China, Mongolia and Russia, and, especially, to the Tianshan Mountains, which is called the water tower and ecological barrier of central Asia, under the effect of the south Asian summer monsoon and the westerly jet. Increasing attention has been paid to the impact of the Aral Sea’s environmental change on local and regional climates, human health, and mountain ecosystems [47,55,63]. Evidence suggests that dust and salt-dust can be transported from the Aral Sea to the Tianshan Mountains region [64,65]. Therefore, this study suggests that more attention should be paid to the great impact of the salt and dust from the dry lakebed of the Aral Sea on the ecological environment of the Tianshan Mountains region, especially in terms of the melting of snow and ice under the effect of climate change and human activities.

4.3. Limitation

In this study, using CALISPO observation and HYSPLIT modeling results, we provided a preliminary insight into variations and potential long-range transport of atmospheric aerosols from the dry lakebed of the Aral Sea in Central Asia. Due to the lower resolution of CALISPO data and lack of observation data on the long-range transport of atmospheric aerosols, the new understanding of variations and long-range transport of atmospheric aerosols from the Aral Sea region needs to be deepened. Aerosol lidar, atmospheric climate models with high temporal and spatial resolution, and isotopic and elemental geochemical methods [66] are urgently needed.

5. Conclusions

In the present study, CALIPSO data and HYSPLIT model results were combined to assess the variations and potential long-range transport of atmospheric aerosols from the Aral Sea Basin in arid central Asia. The main results and conclusions obtained are as follows:
Five types of tropospheric aerosol subtypes and one type of stratospheric aerosol were observed over the Aral Sea. Polluted dust and dust were the most common type of aerosol discovered through the year. Sulfate/other was the only stratospheric aerosol subtype detected in JJA and SON with a percentage frequency of occurrence of 3% and 4%, respectively. All the aerosols detected were mostly observed at a low AOD (<0.25), especially polluted dust and dust.
Polluted dust was the most abundant aerosol type in the past 15 years. Its occurrence frequency varied between 0.46 and 0.78 and that of dust varied from 0.24 to 0.49. A notable feature was the capture of the aerosol subtype sulfate/other in some years, with an occurrence frequency between 0.01 and 0.14.
The occurrence frequency of aerosols over the ASB showed obvious seasonal variation. The occurrence frequency of dust was up to 0.57 in MAM, and then decreased to 0.28 in JJA, 0.15 in SON and 0.16 in DJF. That of polluted dust also showed an obvious difference. The occurrence frequency peaked, with a value of 0.91 in JJA, followed by MAM (0.60), SON (0.63), and DJF (0.33). Sulfate/other was only observed in JJA and SON, with a low occurrence frequency (0.04).
The occurrence frequency of dust and polluted dust exhibited unimodal distribution, the former peaking in spring (May) with a value of 0.62, and the latter peaking in summer (August), with an occurrence frequency value of 0.97. Sulfate/other was only observed in July, August, October, and November.
Polluted dust and dust layer altitudes were distributed over wide ranges, peaking at around 1.9 km and declining gently with height in MAM. In JJA, polluted dust was the dominant aerosol and more frequently observed at heights between 1 km and 5 km. The dust and polluted continental/smoke occurrence frequency was approximately 0.01 between 0 km and 5 km height and then close to zero above 6 km.
The seasonal dust layer thickness over the Aral Sea was in the following order: JJA, MAM, SON, and DJF. The average dust layer thickness was 1.23 km throughout the entire Aral Sea Basin. The polluted dust layers were the thickest in JJA (1.81 km) and the thinnest in DJF (0.85 km), with a mean value of 1.32 km.
Examples of typical events of dust and sand storms in the Aral Sea Basin, with the potential long-range transport of atmospheric aerosols over the next 3 days, were presented and interpretated. The long-range transport in different directions could cover a large area, mainly impacting Uzbekistan, Turkmenistan, Kazakhstan, and eastern parts of Iran, but impacting areas as far as the Caucasus region; parts of China, Mongolia and Russia; and especially the Tianshan Mountains.

Author Contributions

Conceptualization, N.W. and Y.G.; methodology, N.W.; software, N.W. and Y.G.; validation, N.W. and Y.G.; formal analysis, N.W.; investigation, N.W., Y.G., G.I. and G.S.; data curation, N.W. and Y.G.; writing—original draft preparation, N.W.; writing—review and editing, N.W., Y.G. and G.I.; visualization, N.W. and Y.G.; supervision, Y.G.; project administration, Y.G. and J.A.; funding acquisition, Y.G. and J.A. All authors have read and agreed to the published version of the manuscript.

Funding

This research was funded by the Strategic Priority Research Program of Chinese Academy of Sciences (XDA2006030102), National Natural Science Foundation of China (42161144004, 41501115), Natural Science Foundation of Xinjiang Uygur Autonomous Region (2022D01A153), Chinese Academy of Sciences President’s International Fellowship Initiative (2020PC0090), CAS “Light of West China” Program (2017-XBQNXZ-B-012), and the Foundation of State Key Laboratory of Desert and Oasis Ecology, Xinjiang Institute of Ecology and Geography Chinese Academy of Sciences.

Data Availability Statement

The data presented in this study are available on request from the corresponding author.

Acknowledgments

The authors would like to extend a special thanks to NASA and NOAA for making satellite datasets and model accessible in public. The CALIPSO data was obtained from the NASA Langley Research Centre and Atmospheric Sciences Data Centre, HYSPLIT model used in this publication was obtained from the NOAA Air Resources Laboratory (ARL), which thus making this study possible. We wish to thank the editors for handling the manuscript and three reviewers for their helpful and constructive comments and suggestions, which have significantly improved the manuscript.

Conflicts of Interest

The authors declare no conflict of interest.

References

  1. Shao, Y.; Wyrwoll, K.-H.; Chappell, A.; Huang, J.; Lin, Z.; McTainsh, G.H.; Mikami, M.; Tanaka, T.Y.; Wang, X.; Yoon, S. Dust cycle: An emerging core theme in Earth system science. Aeolian Res. 2011, 2, 181–204. [Google Scholar] [CrossRef]
  2. Schepanski, K. Transport of mineral dust and its impact on climate. Geosciences 2018, 8, 151. [Google Scholar] [CrossRef] [Green Version]
  3. Knippertz, P.; Stuut, J.-B.W. Mineral Dust: A Key Player in the Earth System; Springer: Dordrecht, The Netherlands, 2014; pp. 121–147. [Google Scholar]
  4. Chin, M.; Diehl, T.; Tan, Q.; Prospero, J.; Kahn, R.; Remer, L.; Yu, H.; Sayer, A.; Bian, H.; Geogdzhayev, I. Multi-decadal aerosol variations from 1980 to 2009: A perspective from observations and a global model. Atmos. Chem. Phys. 2014, 14, 3657–3690. [Google Scholar] [CrossRef] [Green Version]
  5. Wurtsbaugh, W.A.; Miller, C.; Sarah, E.; Null, R.J. Decline of the world’s saline lakes. Nat. Geosci. 2017, 10, 816–821. [Google Scholar] [CrossRef]
  6. Wang, W.; Lee, X.; Xiao, W.; Liu, S.; Schultz, N.; Wang, Y.; Zhang, M.; Zhao, L. Global lake evaporation accelerated by changes in surface energy allocation in a warmer climate. Nat. Geosci. 2018, 11, 410–414. [Google Scholar] [CrossRef]
  7. Pekel, J.-F.; Cottam, A.; Gorelick, N.; Belward, A.S. High-resolution mapping of global surface water and its long-term changes. Nature 2016, 540, 418–422. [Google Scholar] [CrossRef]
  8. Liu, D.; Abuduwaili, J.; Wang, L. Salt dust storm in the Ebinur Lake region: Its 50-year dynamic changes and response to climate changes and human activities. Nat. Hazards 2015, 77, 1069–1080. [Google Scholar] [CrossRef]
  9. Ge, Y.; Abuduwaili, J.; Ma, L.; Wu, N.; Liu, D. Potential transport pathways of dust emanating from the playa of Ebinur Lake, Xinjiang, in arid northwest China. Atmos. Res. 2016, 178, 196–206. [Google Scholar] [CrossRef]
  10. Yang, X.; Wang, N.; He, J.; Hua, T.; Qie, Y. Changes in area and water volume of the Aral Sea in the arid Central Asia over the period of 1960–2018 and their causes. Catena 2020, 191, 104566. [Google Scholar] [CrossRef]
  11. Ussenaliyeva, A. Save Kazakhstan′s shrinking Lake Balkhash. Science 2020, 370, 303. [Google Scholar] [CrossRef]
  12. Aladin, N.V.; Høeg, J.T.; Plotnikov, I. Small Aral Sea brings hope for Lake Balkhash. Science 2020, 370, 1283. [Google Scholar] [CrossRef]
  13. Boroughani, M.; Hashemi, H.; Hosseini, S.H.; Pourhashemi, S.; Berndtsson, R. Desiccating Lake Urmia: A new dust source of regional importance. IEEE Geosci. Remote Sens. Lett. 2019, 17, 1483–1487. [Google Scholar] [CrossRef]
  14. Boloorani, A.D.; Najafi, M.S.; Soleimani, M.; Papi, R.; Torabi, O. Influence of Hamoun Lakes’ dry conditions on dust emission and radiative forcing over Sistan plain, Iran. Atmos. Res. 2022, 272, 106152. [Google Scholar] [CrossRef]
  15. Mahamat, A.-A.A.; Al-Hurban, A.; Saied, N. Change Detection of Lake Chad Water Surface Area Using Remote Sensing and Satellite Imagery. J. Geogr. Inf. Syst. 2021, 13, 561–577. [Google Scholar] [CrossRef]
  16. Policelli, F.; Hubbard, A.; Jung, H.C.; Zaitchik, B.; Ichoku, C. Lake Chad Total Surface Water Area as Derived from Land Surface Temperature and Radar Remote Sensing Data. Remote Sens. 2018, 10, 252. [Google Scholar] [CrossRef] [Green Version]
  17. Strong, C.; Parsons, K.; McTainsh, G.; Sheehan, A. Dust transporting wind systems in the lower Lake Eyre Basin, Australia: A preliminary study. Aeolian Res. 2011, 2, 205–214. [Google Scholar] [CrossRef]
  18. Goudie, A. Dust storms and ephemeral lakes. Desert 2018, 23, 153–164. [Google Scholar] [CrossRef]
  19. Borda, L.G.; Cosentino, N.J.; Iturri, L.A.; García, M.G.; Gaiero, D.M. Is Dust Derived From Shrinking Saline Lakes a Risk to Soil Sodification in Southern South America? J. Geophys. Res. Earth Surf. 2022, 127, e2021JF006585. [Google Scholar] [CrossRef]
  20. Bucher, E.H.; Stein, A.F. Large Salt Dust Storms Follow a 30-Year Rainfall Cycle in the Mar Chiquita Lake (Córdoba, Argentina). PLoS ONE 2016, 11, e0156672. [Google Scholar] [CrossRef]
  21. Song, Y.; Zheng, H.; Chen, X.; Bao, A.; Lei, J.; Xu, W.; Luo, G.; Guan, Q. Desertification Extraction Based on a Microwave Backscattering Contribution Decomposition Model at the Dry Bottom of the Aral Sea. Remote Sens. 2021, 13, 4850. [Google Scholar] [CrossRef]
  22. Abuduwaili, J.; Liu, D.; Wu, G. Saline dust storms and their ecological impacts in arid regions. J. Arid Land 2010, 2, 144–150. [Google Scholar] [CrossRef] [Green Version]
  23. Sarangi, C.; Qian, Y.; Rittger, K.; Ruby Leung, L.; Chand, D.; Bormann, K.J.; Painter, T.H. Dust dominates high-altitude snow darkening and melt over high-mountain Asia. Nat. Clim. Chang. 2020, 10, 1045–1051. [Google Scholar] [CrossRef]
  24. Micklin, P.; Aladin, N.V.; Plotnikov, I. The Aral Sea: The Devastation and Partial Rehabilitation of a Great Lake; Springer: Berlin/Heidelberg, Germany, 2016. [Google Scholar]
  25. Cretaux, J.F.; Letolle, R.; Bergé-Nguyen, M. History of Aral Sea level variability and current scientific debates. Glob. Planet. Chang. 2013, 110, 99–113. [Google Scholar] [CrossRef]
  26. Micklin, P. The Aral Sea crisis and its future: An assessment in 2006. Eurasian Geogr. Econ. 2006, 47, 546–567. [Google Scholar] [CrossRef]
  27. Micklin, P. The past, present, and future Aral Sea. Lakes Reserv. Res. Manag. 2010, 15, 193–213. [Google Scholar] [CrossRef]
  28. Breckle, S.-W.; Wucherer, W. The Aralkum, a Man-Made Desert on the Desiccated Floor of the Aral Sea (Central Asia): General Introduction and Aims of the Book. In Aralkum—A Man-Made Desert; Springer: Berlin/Heidelberg, Germany, 2012; pp. 1–9. [Google Scholar]
  29. Karami, S.; Hamzeh, N.H.; Kaskaoutis, D.G.; Rashki, A.; Alam, K.; Ranjbar, A. Numerical simulations of dust storms originated from dried lakes in central and southwest Asia: The case of Aral Sea and Sistan Basin. Aeolian Res. 2021, 50, 100679. [Google Scholar] [CrossRef]
  30. Indoitu, R.; Orlovsky, L.; Orlovsky, N. Dust storms in Central Asia: Spatial and temporal variations. J. Arid Environ. 2012, 85, 62–70. [Google Scholar] [CrossRef]
  31. Indoitu, R.; Kozhoridze, G.; Batyrbaeva, M.; Vitkovskaya, I.; Orlovsky, N.; Blumberg, D.; Orlovsky, L. Dust emission and environmental changes in the dried bottom of the Aral Sea. Aeolian Res. 2015, 17, 101–115. [Google Scholar] [CrossRef]
  32. He, M.; Gao, X.; Zhao, Z.; Yang, H.; Huang, L.; Li, X.; Lei, J. Ecological Restoration and Countmeasures against Desertification Crisis in Aral Sea Region. Bull. Chin. Acad. Sci. 2021, 36, 130–140. [Google Scholar] [CrossRef]
  33. Ge, Y.; Abuduwaili, J.; Ma, L.; Liu, D. Temporal variability and potential diffusion characteristics of dust aerosol originating from the Aral Sea basin, central Asia. Water Air Soil Pollut. 2016, 227, 63. [Google Scholar] [CrossRef]
  34. Shen, H.; Abuduwaili, J.; Ma, L.; Samat, A. Remote sensing-based land surface change identification and prediction in the Aral Sea bed, Central Asia. Int. J. Environ. Sci. Technol. 2019, 16, 2031–2046. [Google Scholar] [CrossRef]
  35. Löw, F.; Dimov, D.; Kenjabaev, S.; Zaitov, S.; Stulina, G.; Dukhovny, V. Land cover change detection in the Aralkum with multi-source satellite datasets. GISci. Remote Sens. 2022, 59, 17–35. [Google Scholar] [CrossRef]
  36. Issanova, G.; Abuduwaili, J.; Galayeva, O.; Semenov, O.; Bazarbayeva, T. Aeolian transportation of sand and dust in the Aral Sea region. Int. J. Environ. Sci. Technol. 2015, 12, 3213–3224. [Google Scholar] [CrossRef] [Green Version]
  37. Opp, C.; Groll, M.; Aslanov, I.; Lotz, T.; Vereshagina, N. Aeolian dust deposition in the southern Aral Sea region (Uzbekistan): Ground-based monitoring results from the LUCA project. Quat. Int. 2017, 429, 86–99. [Google Scholar] [CrossRef]
  38. Groll, M.; Opp, C.; Aslanov, I. Spatial and temporal distribution of the dust deposition in Central Asia–results from a long term monitoring program. Aeolian Res. 2013, 9, 49–62. [Google Scholar] [CrossRef]
  39. Bennion, P.; Hubbard, R.; O’Hara, S.; Wiggs, G.; Wegerdt, J.; Lewis, S.; Small, I.; van der Meer, J.; Upshur, R.; Médecins san Frontières/Aral Sea Respiratory Dust and Disease project team. The impact of airborne dust on respiratory health in children living in the Aral Sea region. Int. J. Epidemiol. 2007, 36, 1103–1110. [Google Scholar] [CrossRef] [Green Version]
  40. Goudie, A.S. Desert dust and human health disorders. Environ. Int. 2014, 63, 101–113. [Google Scholar] [CrossRef]
  41. Semenov, O.E. Dust Storms and Sandstorms and Aerosol Long-Distance Transport. In Aralkum—A Man-Made Desert: The Desiccated Floor of the Aral Sea (Central Asia); Breckle, S.-W., Wucherer, W., Dimeyeva, L.A., Ogar, N.P., Eds.; Springer: Berlin/Heidelberg, Germany, 2012; pp. 73–82. [Google Scholar]
  42. Winker, D.M.; Vaughan, M.A.; Omar, A.; Hu, Y.; Powell, K.A.; Liu, Z.; Hunt, W.H.; Young, S.A. Overview of the CALIPSO mission and CALIOP data processing algorithms. J. Atmos. Ocean. Technol. 2009, 26, 2310–2323. [Google Scholar] [CrossRef]
  43. Stein, A.; Draxler, R.R.; Rolph, G.D.; Stunder, B.J.; Cohen, M.; Ngan, F. NOAA’s HYSPLIT atmospheric transport and dispersion modeling system. Bull. Am. Meteorol. Soc. 2015, 96, 2059–2077. [Google Scholar] [CrossRef]
  44. Micklin, P. The Aral sea disaster. Annu. Rev. Earth Planet. Sci. 2007, 35, 47–72. [Google Scholar] [CrossRef] [Green Version]
  45. Issanova, G.; Abuduwaili, J. Aeolian Processes as Dust Storms in the Deserts of Central Asia and Kazakhstan; Springer: Singapore, 2017. [Google Scholar]
  46. Crighton, E.J.; Barwin, L.; Small, I.; Upshur, R. What have we learned? A review of the literature on children’s health and the environment in the Aral Sea area. Int. J. Public Health 2011, 56, 125–138. [Google Scholar] [CrossRef] [PubMed] [Green Version]
  47. Zhupankhan, A.; Khaibullina, Z.; Kabiyev, Y.; Persson, K.M.; Tussupova, K. Health impact of drying aral sea: One health and socio-economical approach. Water 2021, 13, 3196. [Google Scholar] [CrossRef]
  48. Kim, M.H.; Omar, A.H.; Tackett, J.L.; Vaughan, M.A.; Winker, D.M.; Trepte, C.R.; Hu, Y.; Liu, Z.; Poole, L.R.; Pitts, M.C. The CALIPSO version 4 automated aerosol classification and lidar ratio selection algorithm. Atmos. Meas. Tech. 2018, 11, 6107–6135. [Google Scholar] [CrossRef] [PubMed] [Green Version]
  49. Jasmine, M.K.; Aloysius, M.; Jayaprakash, R.; Fathima, C.P.; Prijith, S.S.; Mohan, M. Investigation on the role of aerosols on precipitation enhancement over Kerala during August 2018. Atmos. Environ. 2022, 279, 119101. [Google Scholar] [CrossRef]
  50. Omar, A.H.; Winker, D.M.; Kittaka, C.; Vaughan, M.A.; Liu, Z.; Hu, Y.; Trepte, C.R.; Rogers, R.R.; Ferrare, R.A.; Lee, K.P. The CALIPSO Automated Aerosol Classification and Lidar Ratio Selection Algorithm. J. Atmos. Ocean. Technol. 2009, 26, 1994–2014. [Google Scholar] [CrossRef]
  51. Draxler, R.R.; Hess, G. An overview of the HYSPLIT_4 modelling system for trajectories. Aust. Meteorol. Mag. 1998, 47, 295–308. [Google Scholar]
  52. Park, E.; Kim, J.; Song, C.; Jo, H.-W.; Lee, S.; Kim, S.J.; Park, S.; Lim, C.-H.; Lee, W.-K. Applicability Analysis of Vegetation Condition and Dryness for Sand and Dust Storm (SDS) Risk Reduction in SDS Source and Receptor Region. Sustainability 2020, 12, 7256. [Google Scholar] [CrossRef]
  53. Rolph, G.; Stein, A.; Stunder, B. Real-time environmental applications and display system: READY. Environ. Modell. Softw. 2017, 95, 210–228. [Google Scholar] [CrossRef]
  54. Xu, X.; Wu, H.; Yang, X.; Xie, L. Distribution and transport characteristics of dust aerosol over Tibetan Plateau and Taklimakan Desert in China using MERRA-2 and CALIPSO data. Atmos. Environ. 2020, 237, 117670. [Google Scholar] [CrossRef]
  55. He, H.; Hamdi, R.; Luo, G.; Cai, P.; Zhang, M.; Shi, H.; Li, C.; Termonia, P.; De Maeyer, P.; Kurban, A. Numerical study on the climatic effect of the Aral Sea. Atmos. Res. 2022, 268, 105977. [Google Scholar] [CrossRef]
  56. Jin, Q.; Wei, J.; Yang, Z.-L.; Lin, P. Irrigation-Induced Environmental Changes around the Aral Sea: An Integrated View from Multiple Satellite Observations. Remote Sens. 2017, 9, 900. [Google Scholar] [CrossRef] [Green Version]
  57. Wang, W.; Samat, A.; Ge, Y.; Ma, L.; Tuheti, A.; Zou, S.; Abuduwaili, J. Quantitative Soil Wind Erosion Potential Mapping for Central Asia Using the Google Earth Engine Platform. Remote Sens. 2020, 12, 3430. [Google Scholar] [CrossRef]
  58. Wang, D.; Zhang, F.; Yang, S.; Xia, N.; Ariken, M. Exploring the spatial-temporal characteristics of the aerosol optical depth (AOD) in Central Asia based on the moderate resolution imaging spectroradiometer (MODIS). Environ. Monit. Assess. 2020, 192, 383. [Google Scholar] [CrossRef] [PubMed]
  59. Wang, T.; Chen, Y.; Gan, Z.; Han, Y.; Li, J.; Huang, J. Assessment of dominating aerosol properties and their long-term trend in the Pan-Third Pole region: A study with 10-year multi-sensor measurements. Atmos. Environ. 2020, 239, 117738. [Google Scholar] [CrossRef]
  60. Chen, Y.; Wang, T.; Han, Y.; Qiao, H.; Sun, M.; Huang, Z. Comparative Analysis of Aerosol Optical Properties in Typical Regions of Mineral Dust and Salt Dust. Plateau Meteorol. 2020, 39, 859–869. [Google Scholar] [CrossRef]
  61. Zhang, X.; Claiborn, C.; Lei, J.; Vaughan, J.; Wu, S.; Li, S.; Liu, L.; Wang, Z.; Wang, Y.; Huang, S.; et al. Aeolian dust in Central Asia: Spatial distribution and temporal variability. Atmos. Environ. 2020, 238, 117734. [Google Scholar] [CrossRef]
  62. Aili, A.; Abuduwaili, J.; Xu, H.; Zhao, X.; Liu, X. A Cluster Analysis of Forward Trajectory to Identify the Transport Pathway of Salt-Dust Particles from Dried Bottom of Aral Sea, Central Asia. Atmosphere 2021, 12, 764. [Google Scholar] [CrossRef]
  63. He, H.; Hamdi, R.; Cai, P.; Luo, G.; Ochege, F.U.; Zhang, M.; Termonia, P.; De Maeyer, P.; Li, C. Impacts of Historical Land Use/Cover Change (1980–2015) on Summer Climate in the Aral Sea Region. J. Geophys. Res. Atmos. 2021, 126, e2020JD032638. [Google Scholar] [CrossRef]
  64. Han, Y.; Wang, T.; Tan, R.; Tang, J.; Wang, C.; He, S.; Dong, Y.; Huang, Z.; Bi, J. CALIOP-Based Quantification of Central Asian Dust Transport. Remote Sens. 2022, 14, 1416. [Google Scholar] [CrossRef]
  65. Micklin, P.; Aladin, N.V.; Chida, T.; Boroffka, N.; Plotnikov, I.S.; Krivonogov, S.; White, K. The Aral Sea: A story of devastation and partial recovery of a large Lake. In Large Asian Lakes in a Changing World; Springer: Cham, Switzerland, 2020; pp. 109–141. [Google Scholar]
  66. Wang, G.; Li, J.; Ravi, S.; Van Pelt, R.S.; Costa, P.J.; Dukes, D. Tracer techniques in aeolian research: Approaches, applications, and challenges. Earth-Sci. Rev. 2017, 170, 1–16. [Google Scholar] [CrossRef]
Figure 1. Geographical location of the Aral Sea ((a), red rectangle) and change in the area of the Aral Sea from 1960 to 2021, derived from the Landsat data (b,c).
Remotesensing 14 03201 g001
Figure 2. Flowchart of the aerosol subtypes selection scheme for (a) stratospheric aerosols and (b) tropospheric aerosols (Modified from Kim et al. [48]).
Remotesensing 14 03201 g002
Figure 3. Change in the occurrence frequency of aerosol subtypes from 2007 to 2020.
Remotesensing 14 03201 g003
Figure 4. Seasonal occurrence frequency of aerosol subtypes for years 2007 to 2021. (PCS: polluted continental/smoke; CC: clean continental; PD: polluted dust; ES: elevated smoke; SO: sulfate/other).
Remotesensing 14 03201 g004
Figure 5. Monthly occurrence frequencies of aerosol subtypes for years 2007 to 2021.
Remotesensing 14 03201 g005
Figure 6. Vertical distributions of the occurrence frequency of aerosol layer over the Aral Sea Basin in different seasons (MAM, JJA, SON, and DJF) from 2007 to 2021.
Remotesensing 14 03201 g006
Figure 7. The mean thickness of the aerosol layer over the Aral Sea Basin from 2007 to 2021. (PCS, polluted continental/smoke; CC, clean continental; PD, polluted dust; ES, elevated smoke; SO, sulfate/other).
Remotesensing 14 03201 g007
Figure 8. Sand and dust storm that occurred on 29 April 2008 captured by MODIS (a) and potential long-range transport of the atmospheric aerosols from the Aral Sea Basin, derived from HYSPLIT model (b).
Remotesensing 14 03201 g008
Figure 9. Sand and dust storm that occurred on 25 April 2014 captured by MODIS (a) and potential long-range transport of the atmospheric aerosols from the Aral Sea Basin, derived from HYSPLIT model (b).
Remotesensing 14 03201 g009
Figure 10. Sand and dust storm that occurred on 27 May 2018, captured by MODIS (a) and potential long-range transport of the atmospheric aerosols from the Aral Sea Basin, derived from HYSPLIT model (b).
Remotesensing 14 03201 g010
Figure 11. Sand and dust storm that occurred on 29 May 2018, captured by MODIS (a) and potential long-range transport of the atmospheric aerosols from the Aral Sea Basin, derived from HYSPLIT model (b).
Remotesensing 14 03201 g011
Table 1. Percent frequency of different aerosol types at aerosol optical depth (AOD) in the ASB for years 2007 to 2021.
Aerosol SubtypesSeasonSpring (20,173) aSummer (21,535)Autumn (14,753)Winter (10,515)
AOD<0.250.25–0.50.5–0.750.75–1>1<0.250.25–0.50.5–0.750.75–1>1<0.250.25–0.50.5–0.750.75–1>1<0.250.25–0.50.5–0.750.75–1>1
Tropospheric aerosolDust37%2%1%01%16%2%1%0014%1%00018%1%001%
Polluted continental/smoke8%00004%00009%1%00018%1%000
Clean continental5%00006%000013%000016%0000
Polluted dust41%1%001%56%2%001%50%1%00040%1%001%
Elevated smoke3%00007%1%001%5%1%0002%0001%
Stratospheric aerosolSulfate/other000003%00005%000000000
a Number in brackets is the total number of observations within one season.
Publisher’s Note: MDPI stays neutral with regard to jurisdictional claims in published maps and institutional affiliations.

