Abstract
In the context of global warming, vegetation activity in northeastern East Asia (40–45°N, 105–130°E) (NEA) shows a significant growth trend on a multidecadal scale, but how vegetation changes on a decadal scale is unclear. In this study, we find a significant trend of vegetation greening in northeastern East Asia during 1982–1998 and a slowdown in the greening trend during 1998–2014. Trend analysis of the extreme climate indices reveals that the trends of precipitation-related extreme climate indices are similar to those of vegetation change, and further correlation analysis reveals that precipitation-related extreme climate indices have a strong positive correlation with the NDVI. The results indicate that the vegetation in northeastern East Asia is more sensitive to precipitation changes, especially extreme precipitation, compared with the temperature and related extreme indices. Furthermore, the analysis of large-scale atmospheric circulation changes suggests a role of Northwest Pacific subtropical high (NPSH) in the trend changes of precipitation-related extreme indices. The strengthening of NPSH before 1998 enhances the moisture transport to the NEA, providing abundant water vapor favorable for extreme precipitation events, while after 1998, the NPSH trend is much weakened, corresponding to a decrease in the moisture transport trend.
1. Introduction
As the main body of terrestrial ecosystems, vegetation not only plays a vital role in global material and energy cycles but also has an irreplaceable role in regulating the global carbon balance, slowing down the rise of greenhouse gas concentrations such as carbon dioxide in the atmosphere and maintaining global climate stability [1]. In the context of global warming, global vegetation cover shows different trends of change. The normalized difference vegetation index (NDVI), which is defined as the quotient of the difference between the reflectance of the near-infrared channel, can more accurately characterize surface vegetation cover and vegetation growth [2]. The NDVI has the advantages of high sensitivity, wide range of vegetation detection, elimination of some interferences (such as topography, solar altitude angle, atmosphere, etc.), and it is easy to obtain and is widely used in the study of global and regional surface vegetation dynamics [3,4,5]. Zhao, Dai et al. found that during the period 1982–2013, about 48% of the global regions showed a significant increasing trend in NDVI (normalized vegetation index), including Europe, regions in Asia except the southwest, the central region of North America, the southern region of India, and the southern part of Africa. Only about 8% of the region showed a decreasing trend in NDVI, mainly in northwestern and southwestern North America, southern South America, and central and eastern Africa [6]. Xu, Liu et al. found a significant increasing trend of NDVI over the Silk Road Economic Belt (5°14′W–133°85′E, 25°16′N–56°16′N) region during the period 1981–2016 [7]. Li et al. found a significant increasing trend of NDVI in the Ulanbu Desert region of northwest China during 1982–2018 [8].
Although vegetation is greening in most parts of the globe at the multidecadal scale, there are changes in the greening trend at the multiyear or decadal timescales. For example, Angert, Biraud et al. noted that summer NDVI showed an increasing trend in most regions during 1982–1991, and a significant decreasing trend in summer NDVI in most of North America and Eurasia during 1994–2002 [9]. Piao, Wang et al. indicated that during 1982–1997, there was a significant increase in growing season NDVI in northeastern Europe, western Russia, and southeastern Siberia; during 1997–2006, there was a significant decrease in growing season NDVI in the Caspian Sea region, northeastern and southern Siberia [10]. Therefore, vegetation activity in different regions may show different or even opposite trends on a multiyear or decadal timescale. Whereas the causes of vegetation activity changes vary from region to region, the causal mechanisms in the same region are also complex. Temperature and precipitation are important climatic driving factors that influence vegetation dynamics and growth. They affect the growth and development of vegetation mainly by influencing physiological activities such as photosynthesis and transpiration. Temperature is considered a limiting factor in northern high latitudes, while arid and semiarid regions are often stressed in terms of water use [11]. Temperature generally favors vegetation growth in humid areas, while precipitation is usually a stressor affecting vegetation activity in arid and semiarid areas. For example, Zhou, Tucker et al. found that the increase in NDVI in Eurasia and North America during 1982–1999 was due to the increase in the plant growth period caused by the increase in temperature [12]. Barber, Juday et al. found that the decrease in NDVI in parts of Alaska, boreal regions of Canada, and northeastern East Asia was caused by the severity of drought [13]. Nemani, White et al. found that during the period 1900–1993 in the United States, there was increased precipitation and concurrent reduced water demand for vegetation growth, resulting in the greening of vegetation [14].
Extreme climate events have become more frequent worldwide, and extreme climate events such as extreme temperature and precipitation significantly impact vegetation by rapidly altering regional heat and moisture environmental conditions [15]. Vegetation cover is more vulnerable to climate extremes, and the impact of extreme events is more destructive and geographically diverse than general factors (e.g., average annual temperature, annual precipitation, etc.) [16]. For example, Bokhorst, Tømmervik et al. found that the frequent occurrence of subarctic winter extreme warm events caused severe damage to local vegetation, with extreme temperatures in northeastern Scandinavia during the winter of 2007 leading to a drop in NDVI of as much as 26% [17]. Sun, Cheng et al. found that extreme precipitation plays a role in promoting the growth of vegetation on the Tibetan Plateau [18]. Wang Xiao-li found that NDVI was negatively correlated with the extreme cold index in coastal areas of China, and the impacts of the extreme warm index and extreme precipitation index on the vegetation are different from north to south, separated by the Huang and Huai Rivers [19]. It can be seen that the effects of extreme values of temperature and precipitation on vegetation in different regions show diversity. In addition, human activities [20], solar radiation [21], and monsoon activities [22] also have impacts on vegetation growth. These previous studies also indicate that the influences of various factors on vegetation activity are also related to the selected timescales. Therefore, the multiyear to decadal variations of vegetation and the driving mechanisms may differ from those at the longer timescales and still need more investigation.
Northeast East Asia is the region of 40–45°N, 105–130°E, including Mongolia, Inner Mongolia, and Northeast China. Most of the region is in the humid–arid transition zone, with a typical temperate monsoon climate that is strongly sensitive to climate change. The region’s ecological environment is sensitive and fragile due to human activities and climate change and is prone to desertification. Over the past few decades, regional temperature and precipitation conditions in the region have changed significantly, with extreme weather events occurring frequently and regional vegetation undergoing significant changes [11,23]. Park and Sohn found a significant increasing trend of NDVI in northeast China (35–45°N, 110–125°E) during 1982–2006, a weak, increasing trend of NDVI in the area from eastern Mongolia to Manzhouli, and a decreasing trend in the area southeast of Lake Baikal [24]. Zhou, Zhao et al. found a significant increase in NDVI during the growing season in southeastern Horqin, China, and a significant decrease in NDVI during the growing season in Hunshandak during 1982–2011 [25]. In the context of global warming, northeastern East Asia is experiencing accelerated warming, and extreme temperature and extreme precipitation events are frequent in the region [26]. The regional drought condition has increased significantly due to climate extremes [27]. In ecologically fragile areas, vegetation is sensitive to climate extremes at shorter timescales, and average climates often have an important impact on the ecosystem in the long-term period [28]. However, the magnitude of sensitivity of vegetation change to the average and extreme climate in northeastern East Asia is not clear. What is the relationship between vegetation change and climate change in northeastern East Asia? How does extreme climate affect vegetation in the region? Therefore, it is necessary to assess the relationship between climate and vegetation change in northeastern East Asia, which is essential to better understand how vegetation responds to climate change.
In summary, although the overall multidecadal vegetation trends in northeastern East Asia are consistent in most areas, there are still differences and changes in the vegetation activity trends on shorter timescales. Previous studies have focused on the characteristics and causes of multidecadal vegetation change. However, regional vegetation change at multi-year to decadal scales and its relationship with climate change are still unclear. This may limit our understanding of the mechanisms of vegetation change. Furthermore, the causes for multi-year to decadal changes in vegetation trends in northeastern East Asia, their relationship to climate extremes, and the relative importance of climate factors are not clear. Therefore, based on satellite-derived NDVI data, meteorological data, and a selection of six extreme climate indices related to temperature and precipitation, this study aims to investigate the spatial and temporal trend of NDVI changes in the region of 40–45°N, 105–130°E, explore its connection with extreme climate change, and explain the reasons for its changes, in order to provide a scientific basis for the understanding of regional vegetation cover status and regional ecological environment construction and development protection in the context of climate change.
2. Materials and Methods
2.1. NDVI Data
NDVI, defined as a normalized ratio of red and near-infrared reflectance, is a radiometric measure of photosynthetically active radiation absorbed by chlorophyll in the green leaves of vegetation canopies [29]. Therefore, in this study, we use the first version of the third-generation Global Inventory Modelling and Mapping Studies (GIMMS3g) NDVI dataset for long-time proxy changes in the surface greenness level of a region. It is a biweekly dataset with a spatial resolution of 1/12 × 1/12 degrees, fully covering our study period (1982–2014). More importantly, it reduces errors of aerosols injected into the atmosphere by volcanic eruptions. Furthermore, we only choose the NDVI of the growing season (April–October for 20°N–70°N, October–April for 20°S–60°S, and January–December for 20°S–20°N) from the raw data.
2.2. Climate Data
The precipitation data and near-surface temperature data are obtained from the CRU TS4.05 dataset, which is provided by the Centre for Climate Research at the University of East Anglia [30]. Because northeastern East Asia is an arid–humid transition zone, we choose four temperature-related extreme indices and four precipitation-related extreme indices to explore the effects of extreme weather events on changes in vegetation growth trends [27]. The four precipitation-related extreme indices are the maximum monthly number of consecutive dry days (when precipitation < 1.0 mm) (CDD) and maximum monthly number of consecutive wet days (when precipitation ≥ 1.0 mm) (CWD), maximum 1-day precipitation amount (Rx1day), and maximum 5-day precipitation amount (Rx5day). Four temperature-related extreme indices are annual minimum of minimum temperature (TNn) and annual maxima of daily maximum temperature (TXx), warm days (TX90p), and cold nights (TN10p) [31] (Table 1). Most of the datasets we used have the same temporal resolutions (monthly data), and the data for extreme indices are based on daily data. Different datasets were interpolated to the 1.875° (longitude) × 1.875° (latitude) grid to ensure the standardization of all databases on the same spatial resolution and facilitate comparison.

Table 1.
Definition of extreme indices.
All atmospheric reanalysis data, including column-integrated moisture divergence [32] and 500 hPa geopotential height [33], are obtained from ERA5 reanalysis data derived from the European Center for Medium-Range Weather Forecasting (ECMWF) [34]. The vertical integration of the moisture flux corresponds to the horizontal rate of moisture (e.g., water vapor) transport for a column of air extending from the Earth’s surface to the top of the atmosphere. Its divergence is the rate of moisture spreading outward from a point in units of kg m−2 s−1. The column-integrated moisture divergence indicates whether atmospheric motions decrease (for divergence) or increase (for convergence) the vertical integral of moisture over time. Large moisture convergence can be related to precipitation intensification and floods. In meteorology, geopotential height approximates the actual height of a pressure surface above the mean sea level. In this study, the Northwest Pacific subtropical high is measured by 500 hPa geopotential height. For example, a positive 500 hPa geopotential height anomaly over the Northwest Pacific is interpreted as an anomalously strong NPSH and vice versa. The product covers 1979–2019 with a temporal resolution of monthly and a horizontal resolution of 0.25° × 0.25°.
2.3. Method
In this paper, the linear trends are computed using the Theil–Sen trend estimation method, which has proven more accurate than simple linear regression and the least square method [35]. The Theil–Sen trend estimation, also called “Sen’s slope estimator”, is known as a nonparametric technique for estimating a linear trend, which is more robust than the least-squares estimator because it is much less sensitive to outliers, and the corresponding statistical significance can be tested using the Mann–Kendall test. In addition, we calculate the regional average for all the climate metrics in northeastern East Asia and use Pearson’s coefficient (r) to calculate the correlations between time series. This study makes use of correlation analysis, whose statistical significance is assessed using a two-tailed Student’s t-test. To account for the temporal autocorrelation of the time series, we computed an effective number of degrees of freedom N following Bretherton et al. (1999).
where N is the total sample size, and r1 and r2 are the lag-1 autocorrelations for each of the time series. For correlation maps, the effective degrees of freedom are estimated at each grid point.
3. Results
3.1. Spatiotemporal Characteristics of NDVI in Northeastern East Asia
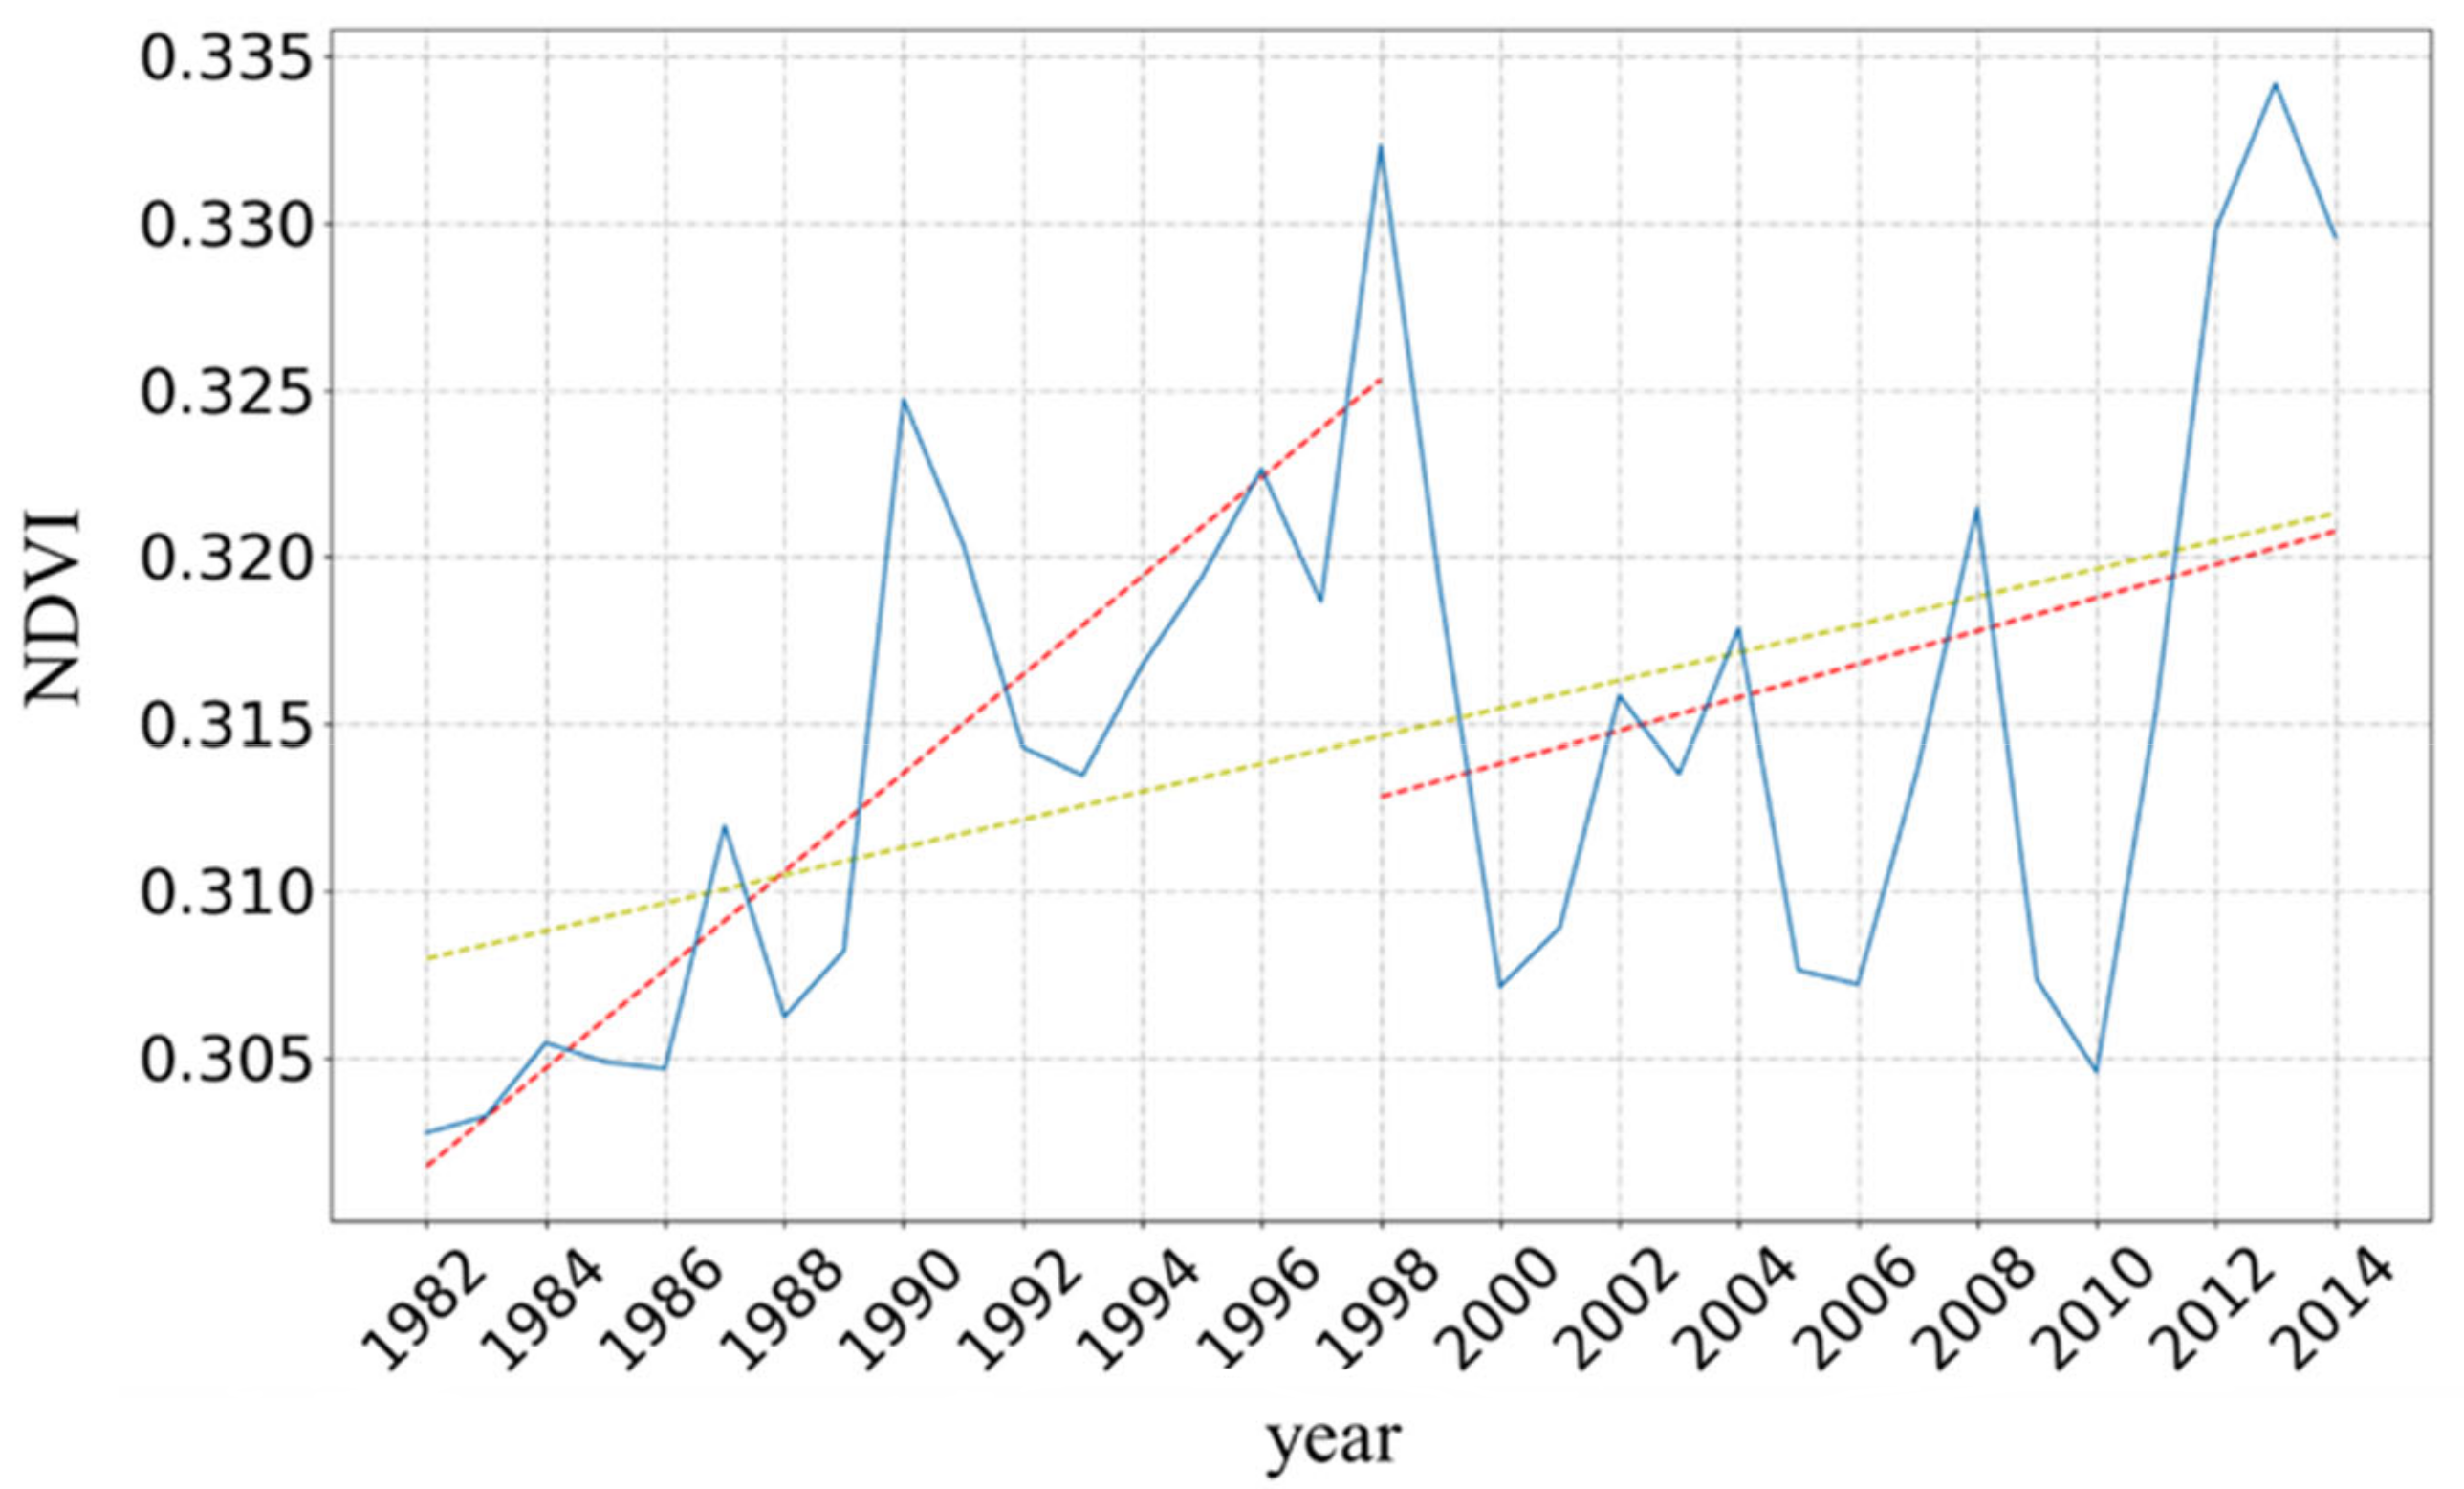
The normalized difference vegetation index (NDVI) is a valid indicator to reflect the vegetation cover and growth status. By analyzing the trends of NDVI at different time periods and comparing the differences between the trends of NDVI at different time periods, we can characterize the changes in vegetation activities in the region. Regional averages of NDVI for the growing season in northeastern East Asia during 1982–2014 are calculated and analyzed in time series (Figure 1). The growing season NDVI in northeastern East Asia shows a significant increasing trend during 1982–2014 (R2 = 0.209, p < 0.1) and peaks at 0.332 in 1998, which is also consistent with the findings of Zhao, Dai et al., who classified northeastern East Asia as a low vegetation cover area (NDVI < 0.4) [6]. Further study reveals two periods of changing vegetation growth trends in northeastern East Asia around 1998: during 1982–1998, the growing season NDVI in northeastern East Asia increases at a rate of 0.0015/a (R2 = 0.733, p < 0.1), while during 1998–2014, the growing season NDVI in northeastern East Asia slows down to 0.0004/a (R2 = 0.259, p > 0.1), and shows no clear trend. Piao, Wang et al. concluded that the growing season NDVI in Eurasia increased at a rate of 0.0018/a (p < 0.1) during 1982–1997 and decreased at a rate of 0.0013/a (p < 0.1) during 1997–2006 [10]. This indicates that there is some recovery of vegetation in northeastern East Asia after 2006, so the growing season NDVI in northeastern East Asia shows a trend of slowing down rather than decreasing growth rate during 1998–2014.
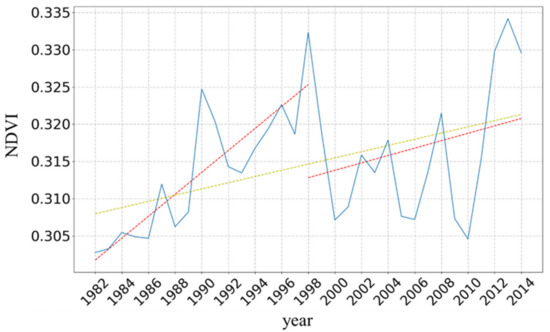
Figure 1.
Regional mean NDVI time series for the 1982–2014 growing season in northern East Asia. The growing season is defined here as April–October for 20°N–70°N. The red line in the figure represents the trend of growing season NDVI from 1982–1998 and 1998–2014, the blue line represents the regional average of NDVI from 1982–2014, and the yellow line represents the overall trend from 1982–2014.
The spatial distribution characteristics of NDVI trends in northeast East Asia during the growing season are shown in Figure 2. During 1982–1998, the NDVI in northeastern East Asia maintained an overall increasing trend, with significant growth in the central and eastern parts of the study area, while the western part remained unchanged. However, during 1998–2014, the NDVI growth trend in some parts of northeastern Asia slows down, and the NDVI in the eastern part of the study area, such as Liao Ning, Ji Lin, and Inner Mongolia, shows a decreasing trend. In summary, compared to the trend during 1982–1998, the NDVI growth in northeastern East Asia shows a slowing trend during 1998–2014.
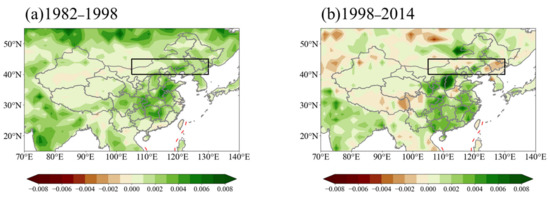
Figure 2.
Analysis of growing season NDVI trends for different periods. Note: Brown color represents a decreasing trend, and green color represents an increasing trend. The red dashed lines in the figure represent Ten-dashed lines. The numbers below the description of the colors represent the trend slope value. The black box in it is defined as the northeastern region of East Asia (40~45°N, 105~130°E).
3.2. Spatiotemporal Characteristics of Average Temperature and Average Precipitation
Temperature affects vegetation growth by influencing photosynthesis, respiration, transpiration, organic matter synthesis, and transport. Precipitation affects vegetation growth by influencing soil water content, air humidity, and transpiration. Northeastern East Asia is located at high latitudes, and according to previous studies, vegetation growth at high latitudes (>40°N) is often controlled by temperature, while northeast East Asia is in the monsoonal fringe zone with strong precipitation variability. Thus, how much influence do temperature and precipitation, respectively, have on producing such trends in vegetation in northeastern East Asia?
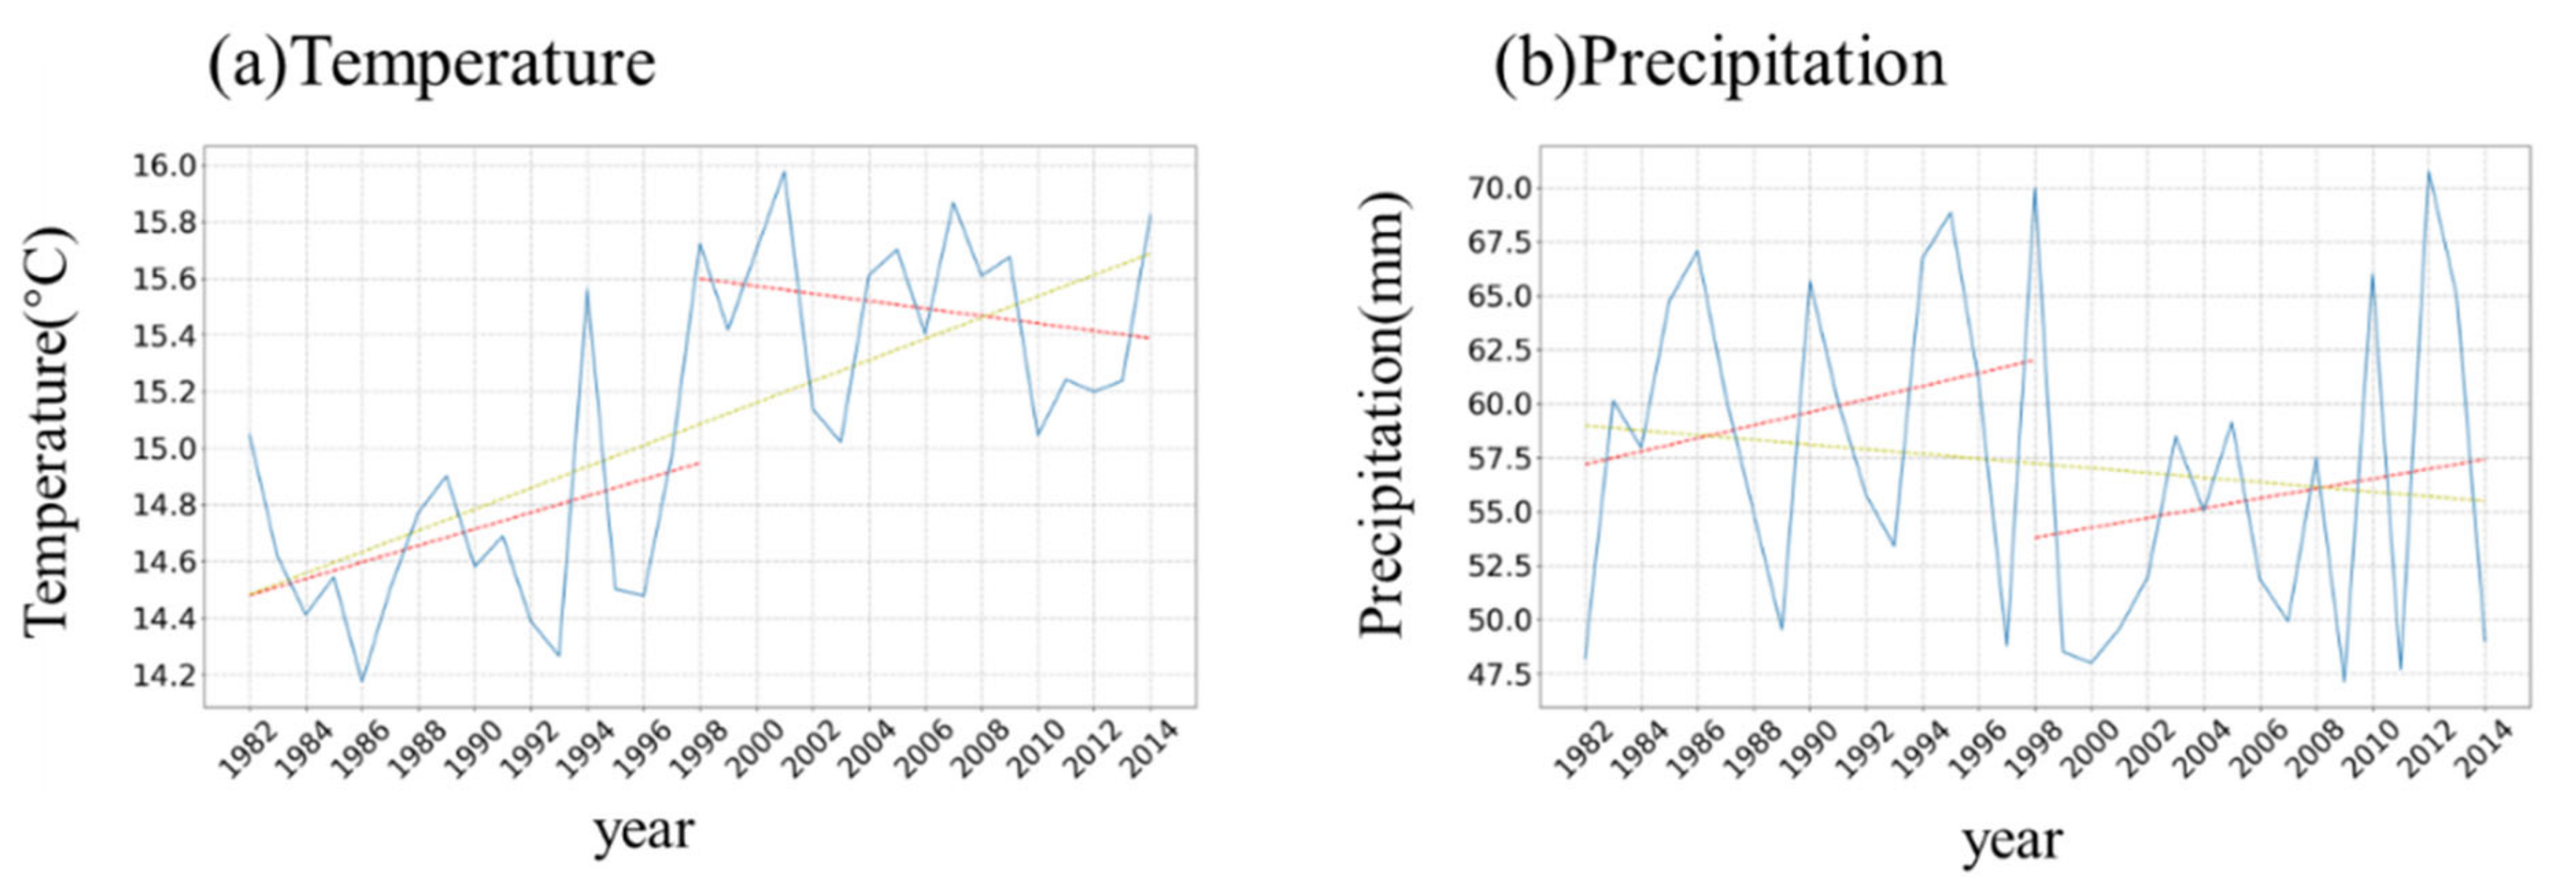
The trend analysis of average temperature and average precipitation in northeastern East Asia during 1982–2014 (Figure 3 and Figure 4) shows that precipitation and temperature have different trends. A strong cooling trend is observed in the region east of 117°E during 1998–2014, while the trend west of 117°E continues with a warming trend. During the period 1982–2014, the trend of increasing precipitation is maintained over most of the region except for a small part of 125–130° E. In time, the average temperature and average precipitation in northeastern East Asia show an increasing trend of 0.029 °C/a (R2 = 0.13, p > 0.1) and 0.302 mm/a (R2 = 0.05, p > 0.1) during 1982–1998, respectively, while the average temperature and average precipitation show different trends during 1998–2014: the average temperature shows a decreasing trend of −0.013 °C/a (R2 = 0.05, p > 0.1), and the average precipitation shows an increasing trend of 0.226 mm/a (R2 = 0.02, p > 0.1).
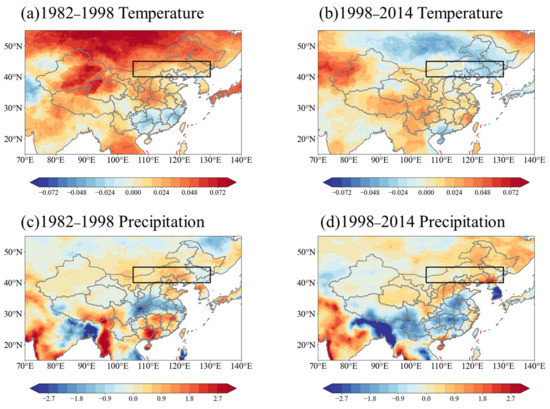
Figure 3.
Analysis of temperature (°C) and precipitation (mm) trends for different periods. Note: Warm tones represent an increasing trend, cool tones represent a decreasing trend. The red dashed lines in the figure represent Ten-dashed lines. The numbers below the description of the colors represent the trend slope value. The black box in it is defined as the northeastern region of East Asia (40~45°N, 105~130°E) and the white line in (b) represents longitude of 117° E.
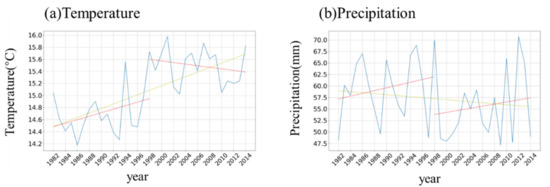
Figure 4.
Time series of regional average temperature (°C) and precipitation (mm). The red line in the figure represents the trend from 1982–1998 and 1998–2014, the blue line represents the regional average of temperature and precipitation from 1982-2014, and the yellow line represents the overall trend from 1982–2014.
In summary, the interdecadal trend of average temperature in northeastern East Asia does not coincide with the trend of NDVI, while the average precipitation maintains a better agreement with NDVI.
3.3. Spatiotemporal Characteristics of Extreme Climate Indices
The effects of temperature and precipitation on vegetation are nonlinear and the response of vegetation activity to climate change may be more dramatic under extreme conditions. Previous studies have also shown a strong correlation between vegetation changes and extreme climates, especially in semiarid and semihumid areas [36,37]. Therefore, we need to further study the relationship between climate extremes and vegetation changes.
3.3.1. Spatiotemporal Characteristics of Temperature-Related Extreme Climate Indices
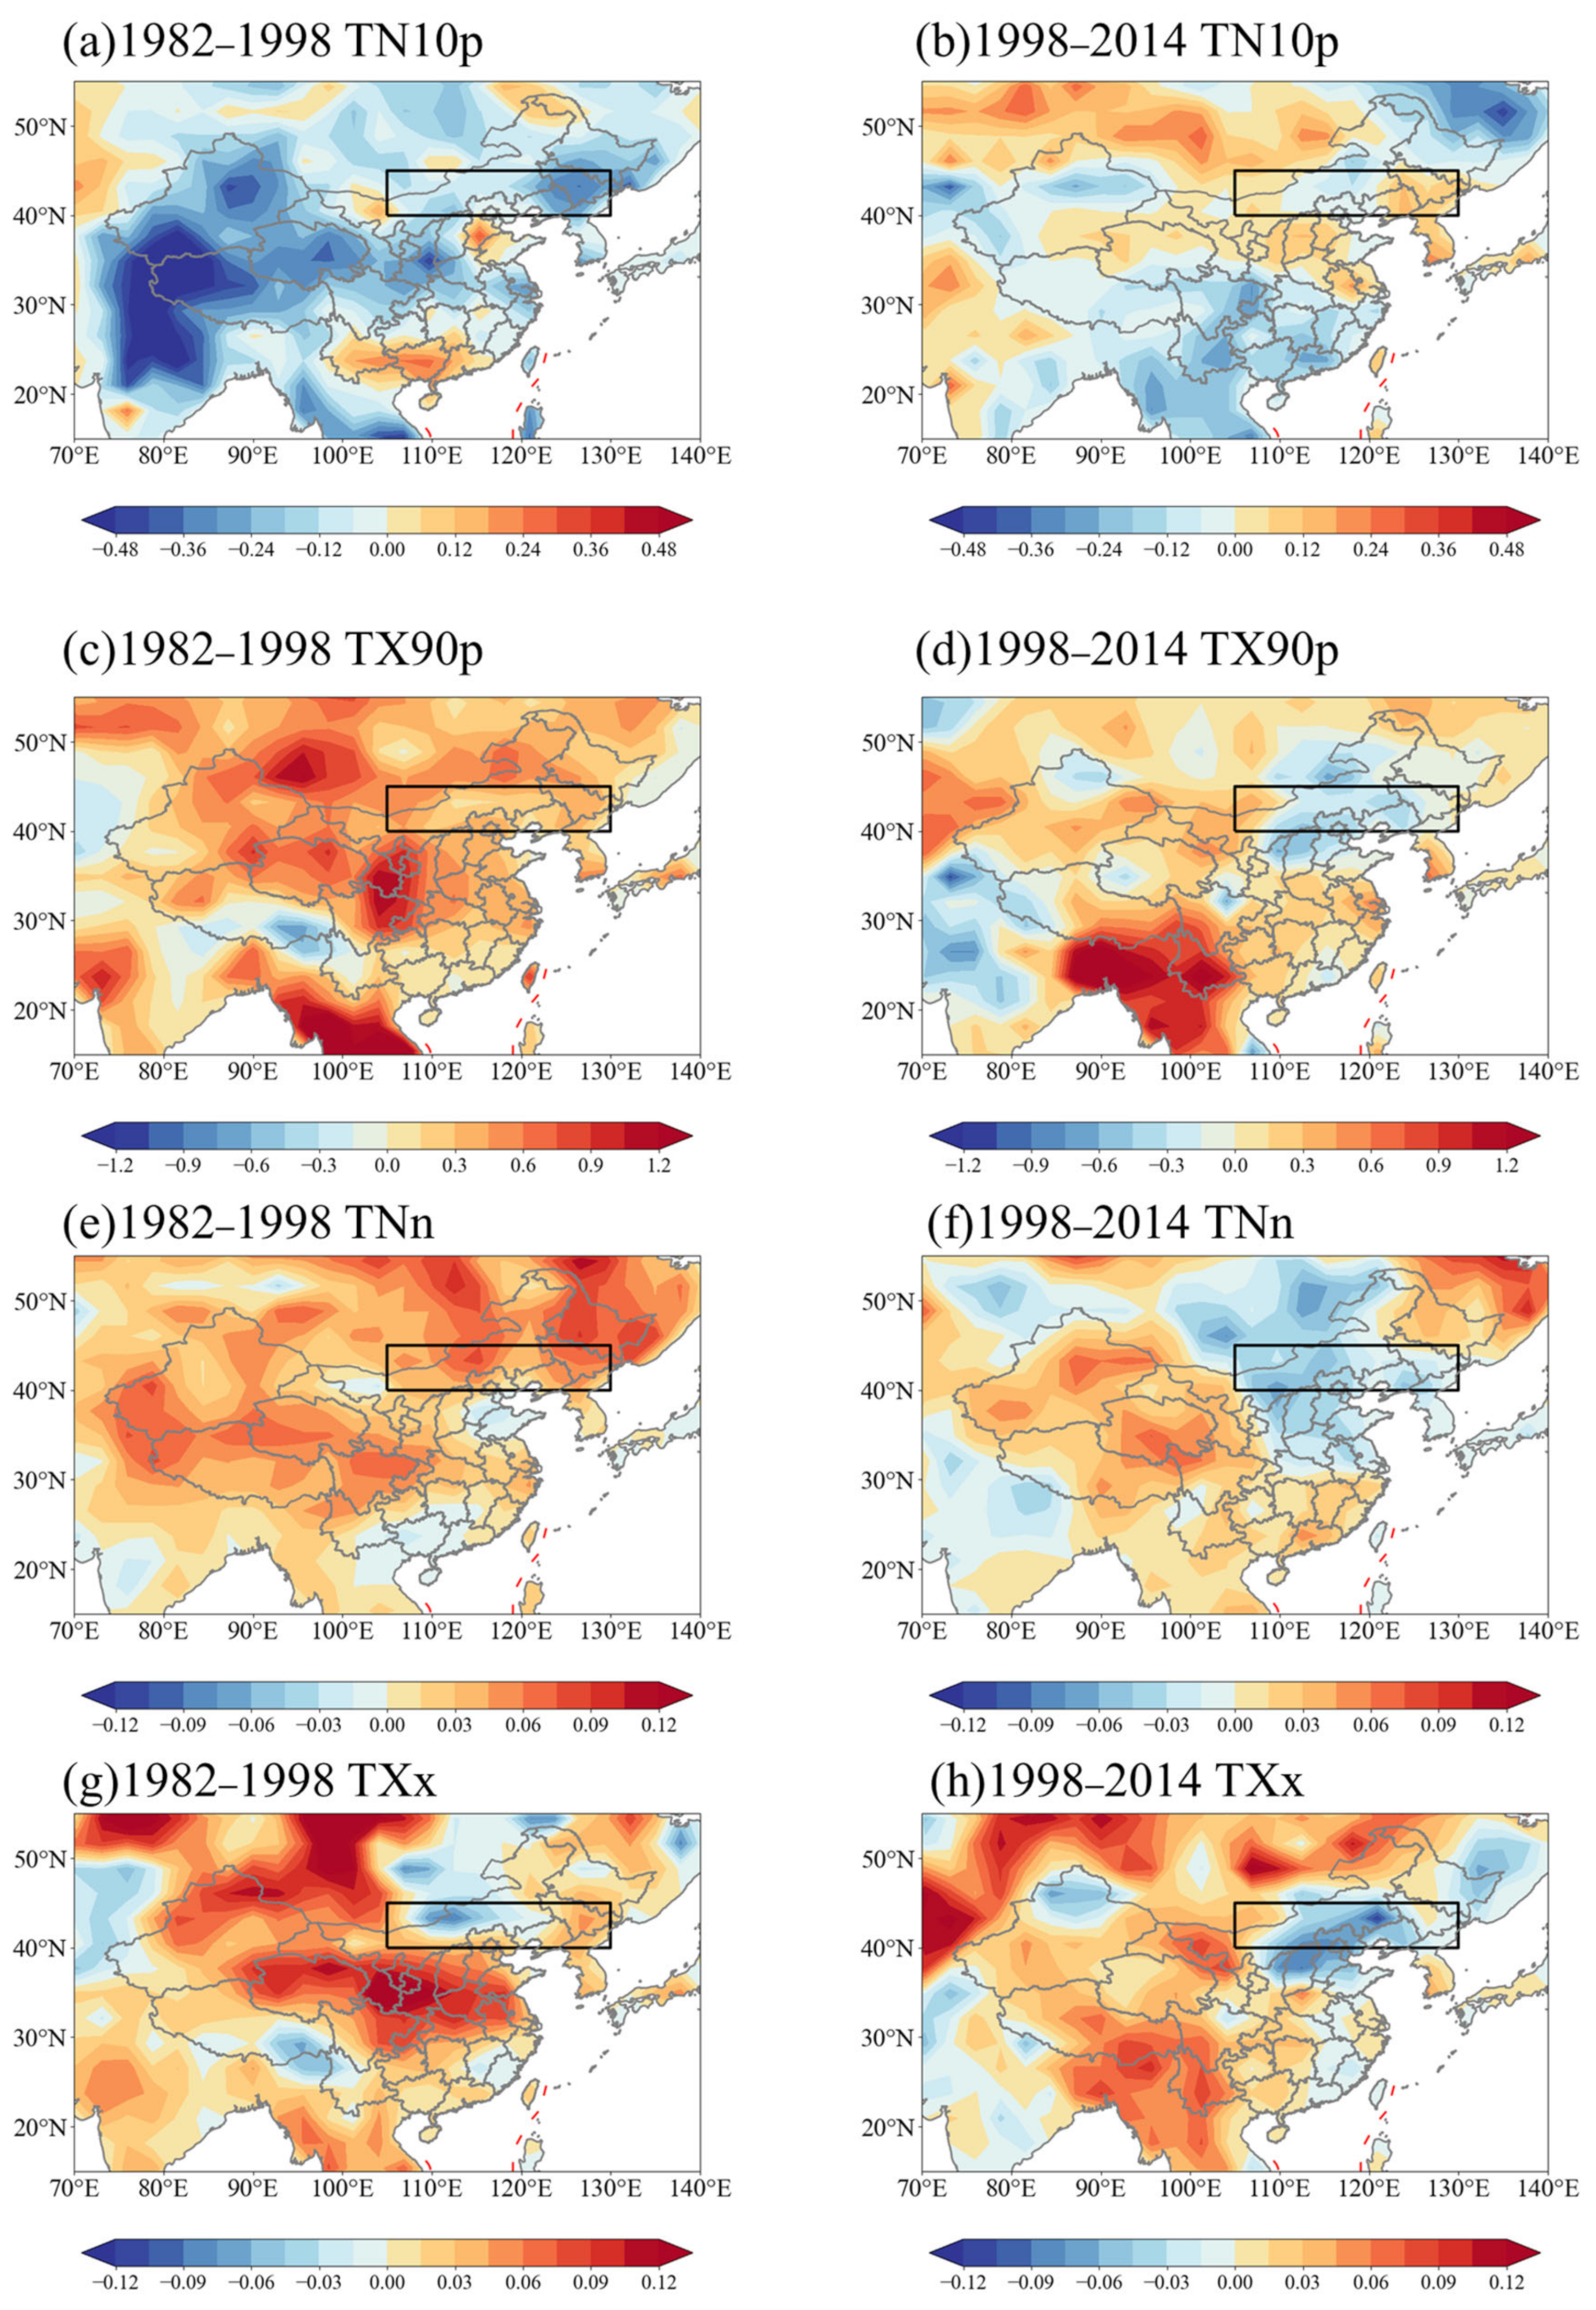
In semiarid regions, the extreme temperature may intensify water evaporation, causing further reduction in soil moisture, resulting in regional drought and reducing vegetation productivity. To obtain the linear trends of the four temperature-related extreme climate indexes in 1982–1998, 1998–2014, we compute their spatial distributions (Figure 5). The results show that the cold nights (TN10p) during 1982–1998 show a distinct decreasing trend (Figure 5a), and the warm days (TX90p) and daily minimum temperature minimum (TNn) both show a clear increasing trend (Figure 5c,e). Furthermore, the three temperature-related extreme climate indices mentioned above do not show significant regional differences during this period, while the maximum daily maximum temperature (TXx) shows an increasing trend in the western and eastern part of the study area and a decreasing trend in the central part (Figure 5g). This indicates a moderate daytime temperature variation and an increasing nighttime temperature with an overall warming trend in northeastern East Asia during 1982–2014. From 1998 to 2014, the cold nights (TN10p) show an increasing trend in the western and eastern part of the study area (Figure 5b) and a decreasing trend in the central part. The number of warm days (TX90p) (Figure 5g), daily minimum temperature minimum (TNn) (Figure 5f), and daily maximum temperature maximum (TXx) (Figure 5h) show a decreasing trend in most of the study area.
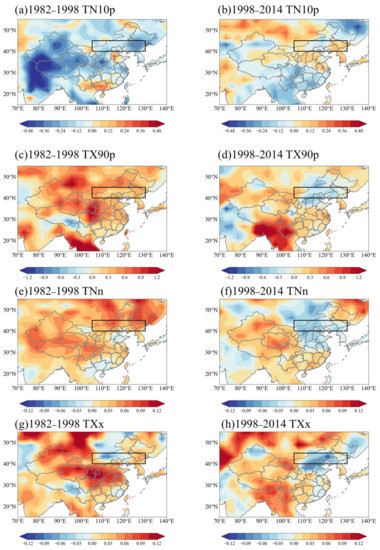
Figure 5.
Trend analysis of four extreme indexes related to temperature for different periods. (a,b) Cold nights (TN10p) (%). (c,d) Warm days (TX90p) (%). (e,f) Annual minimum of daily minimum temperature (TNn) (°C). (g,h) Annual maximum of daily maximum temperature (TXx) (°C). Note: Warm tones represent an increasing trend, cool tones represent a decreasing trend. The red dashed lines in the figure represent Ten-dashed lines. The numbers below the description of the colors represent the trend slope value. The black box in it is defined as the northeastern region of East Asia (40~45°N, 105~130°E).
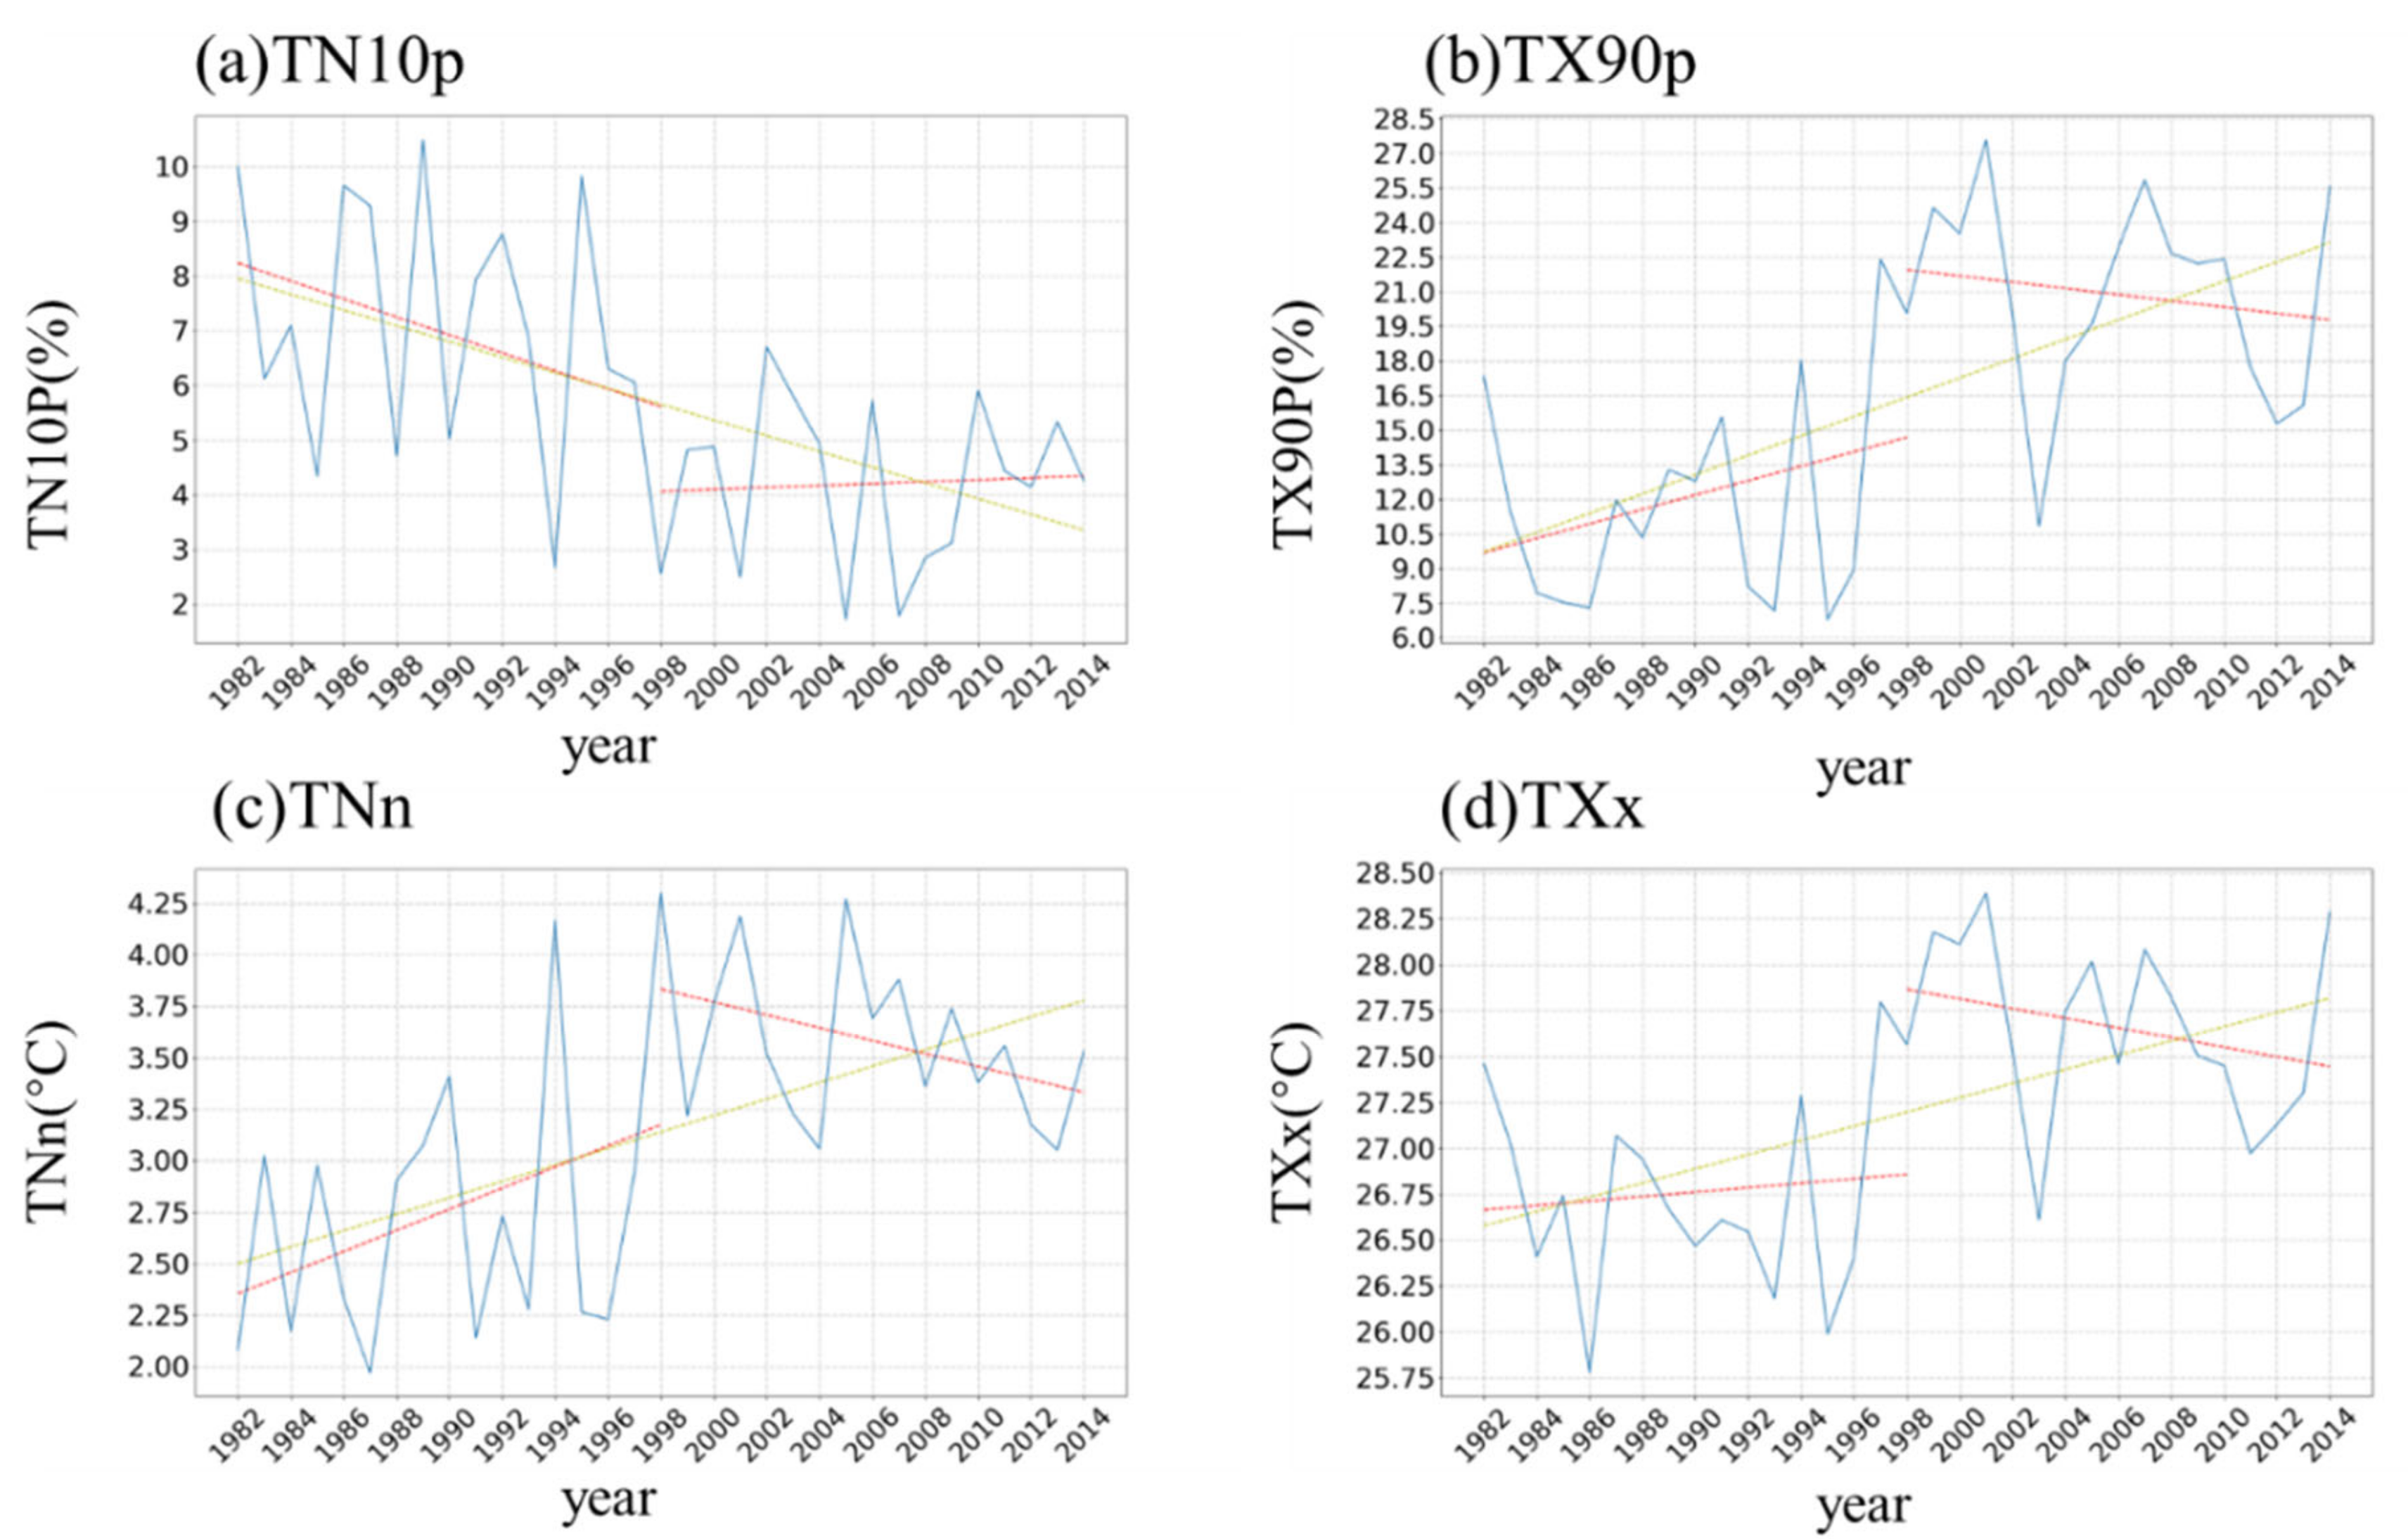
Regional averaging of extreme temperature indices and time series analysis is performed for northeastern East Asia (Figure 6). The results show that, overall, the climate of northeastern East Asia shows an overall warming trend, but the changes in the extreme climate index show opposite trends during the time periods 1982–1998 and 1998–2014. The cold nights (TN10p) show a decreasing trend with a rate of −0.164 %/a (R2 = 0.11, p > 0.1) during 1982–1998, while they show an increasing trend with a rate of 0.017%/a (R2 = 0.004, p > 0.1) during 1998–2014. The warm days (TX90p) increase at a rate of 0.313%/a (R2 = 0.1, p > 0.1) during 1982–1998 and −0.136%/a (R2 = 0.03, p > 0.1) during 1998–2014. The minimum daily minimum temperature (TNn) increases at a rate of 0.051 °C/a (R2 = 0.14, p = 0.1) during 1982–1998 and −0.031 °C/a (R2 = 0.15, p = 0.1) during 1998–2014.
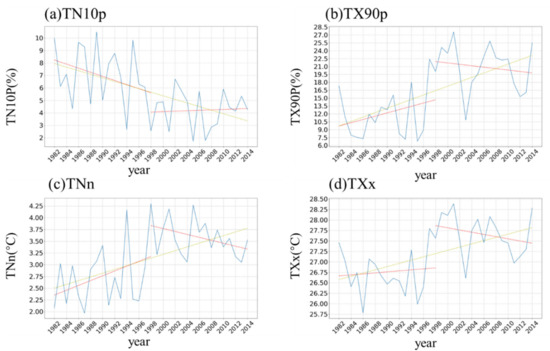
Figure 6.
Time series of regional average extreme indexes which are related to temperature: (a) cold nights (TN10P) (days), (b) warm days (TXx90p) (days), (c) annual minima of daily minimum temperature (TNn) (°C), and (d) annual maxima of daily maximum temperature (TXx) (°C). The red line in the figure represents the trend from 1982–1998 and 1998–2014, the blue line represents the regional average of extreme indexes which are related to temperature from 1982–2014, and the yellow line represents the overall trend from 1982–2014.
In conclusion, the results of the trend analysis of the temperature-related extreme climate indices show continuous warming in northern East Asia during 1982–2014, but the trends of the extreme climate indices vary over different time periods. All the temperature-related extreme climate indices show opposite trends in 1998–2014 compared to 1982–1998. The opposite trend is not consistent with the trend of NDVI slowdown, indicating that vegetation growth is insensitive in response to temperature change.
3.3.2. Spatiotemporal Characteristics of Precipitation-Related Extreme Climate Indices
In contrast, extreme precipitation may increase soil moisture to meet vegetation growth needs and increase vegetation productivity in semiarid regions. The spatial trends of the four extreme climate indices associated with precipitation are shown in Figure 7. The results indicate that northern East Asia maintains a trend of becoming wetter from 1982–2014, with an increasing trend in both rainfall and rainfall frequency. Among these precipitation-related extreme climate indices, the indices of persistent dry days (CDD) show a decreasing trend (Figure 7a), while the number of continuously wet days (CWD) (Figure 7c), annual average maximum 1-day precipitation (Rx1day) (Figure 7e), and annual average maximum continuous 5-day precipitation (Rx5day) (Figure 7g) show an increasing trend. Meanwhile, all these precipitation-related extreme climate indices do not show significant regional differences. During 1998–2014, only CWD shows a clear difference from the previous trend (Figure 7d): a decreasing trend in the range 115–130°E between 1998 and 2014, and a continuing increasing trend in the range 105–115°E. In contrast, other extreme climate indices are subtle during 1998–2014.
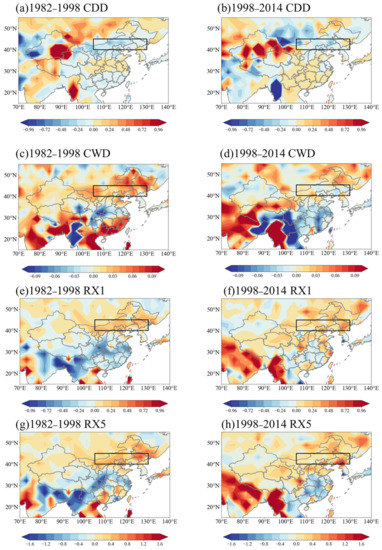
Figure 7.
Trend analysis of four extreme indexes which are related to precipitation for different periods. (a,b) Consecutive dry days (days). (c,d) Consecutive wet days (days). (e,f) Maximum 1-day precipitation amount (mm). (g,h) Maximum 5-day precipitation amount (mm). Note: Warm tones represent an increasing trend, cool tones represent a decreasing trend. The red dashed lines in the figure represent Ten-dashed lines. The numbers below the description of the colors represent the trend slope value. The black box in it is defined as the northeastern region of East Asia (40~45°N, 105~130°E) and the white line in (d) represents the longitude of 115.
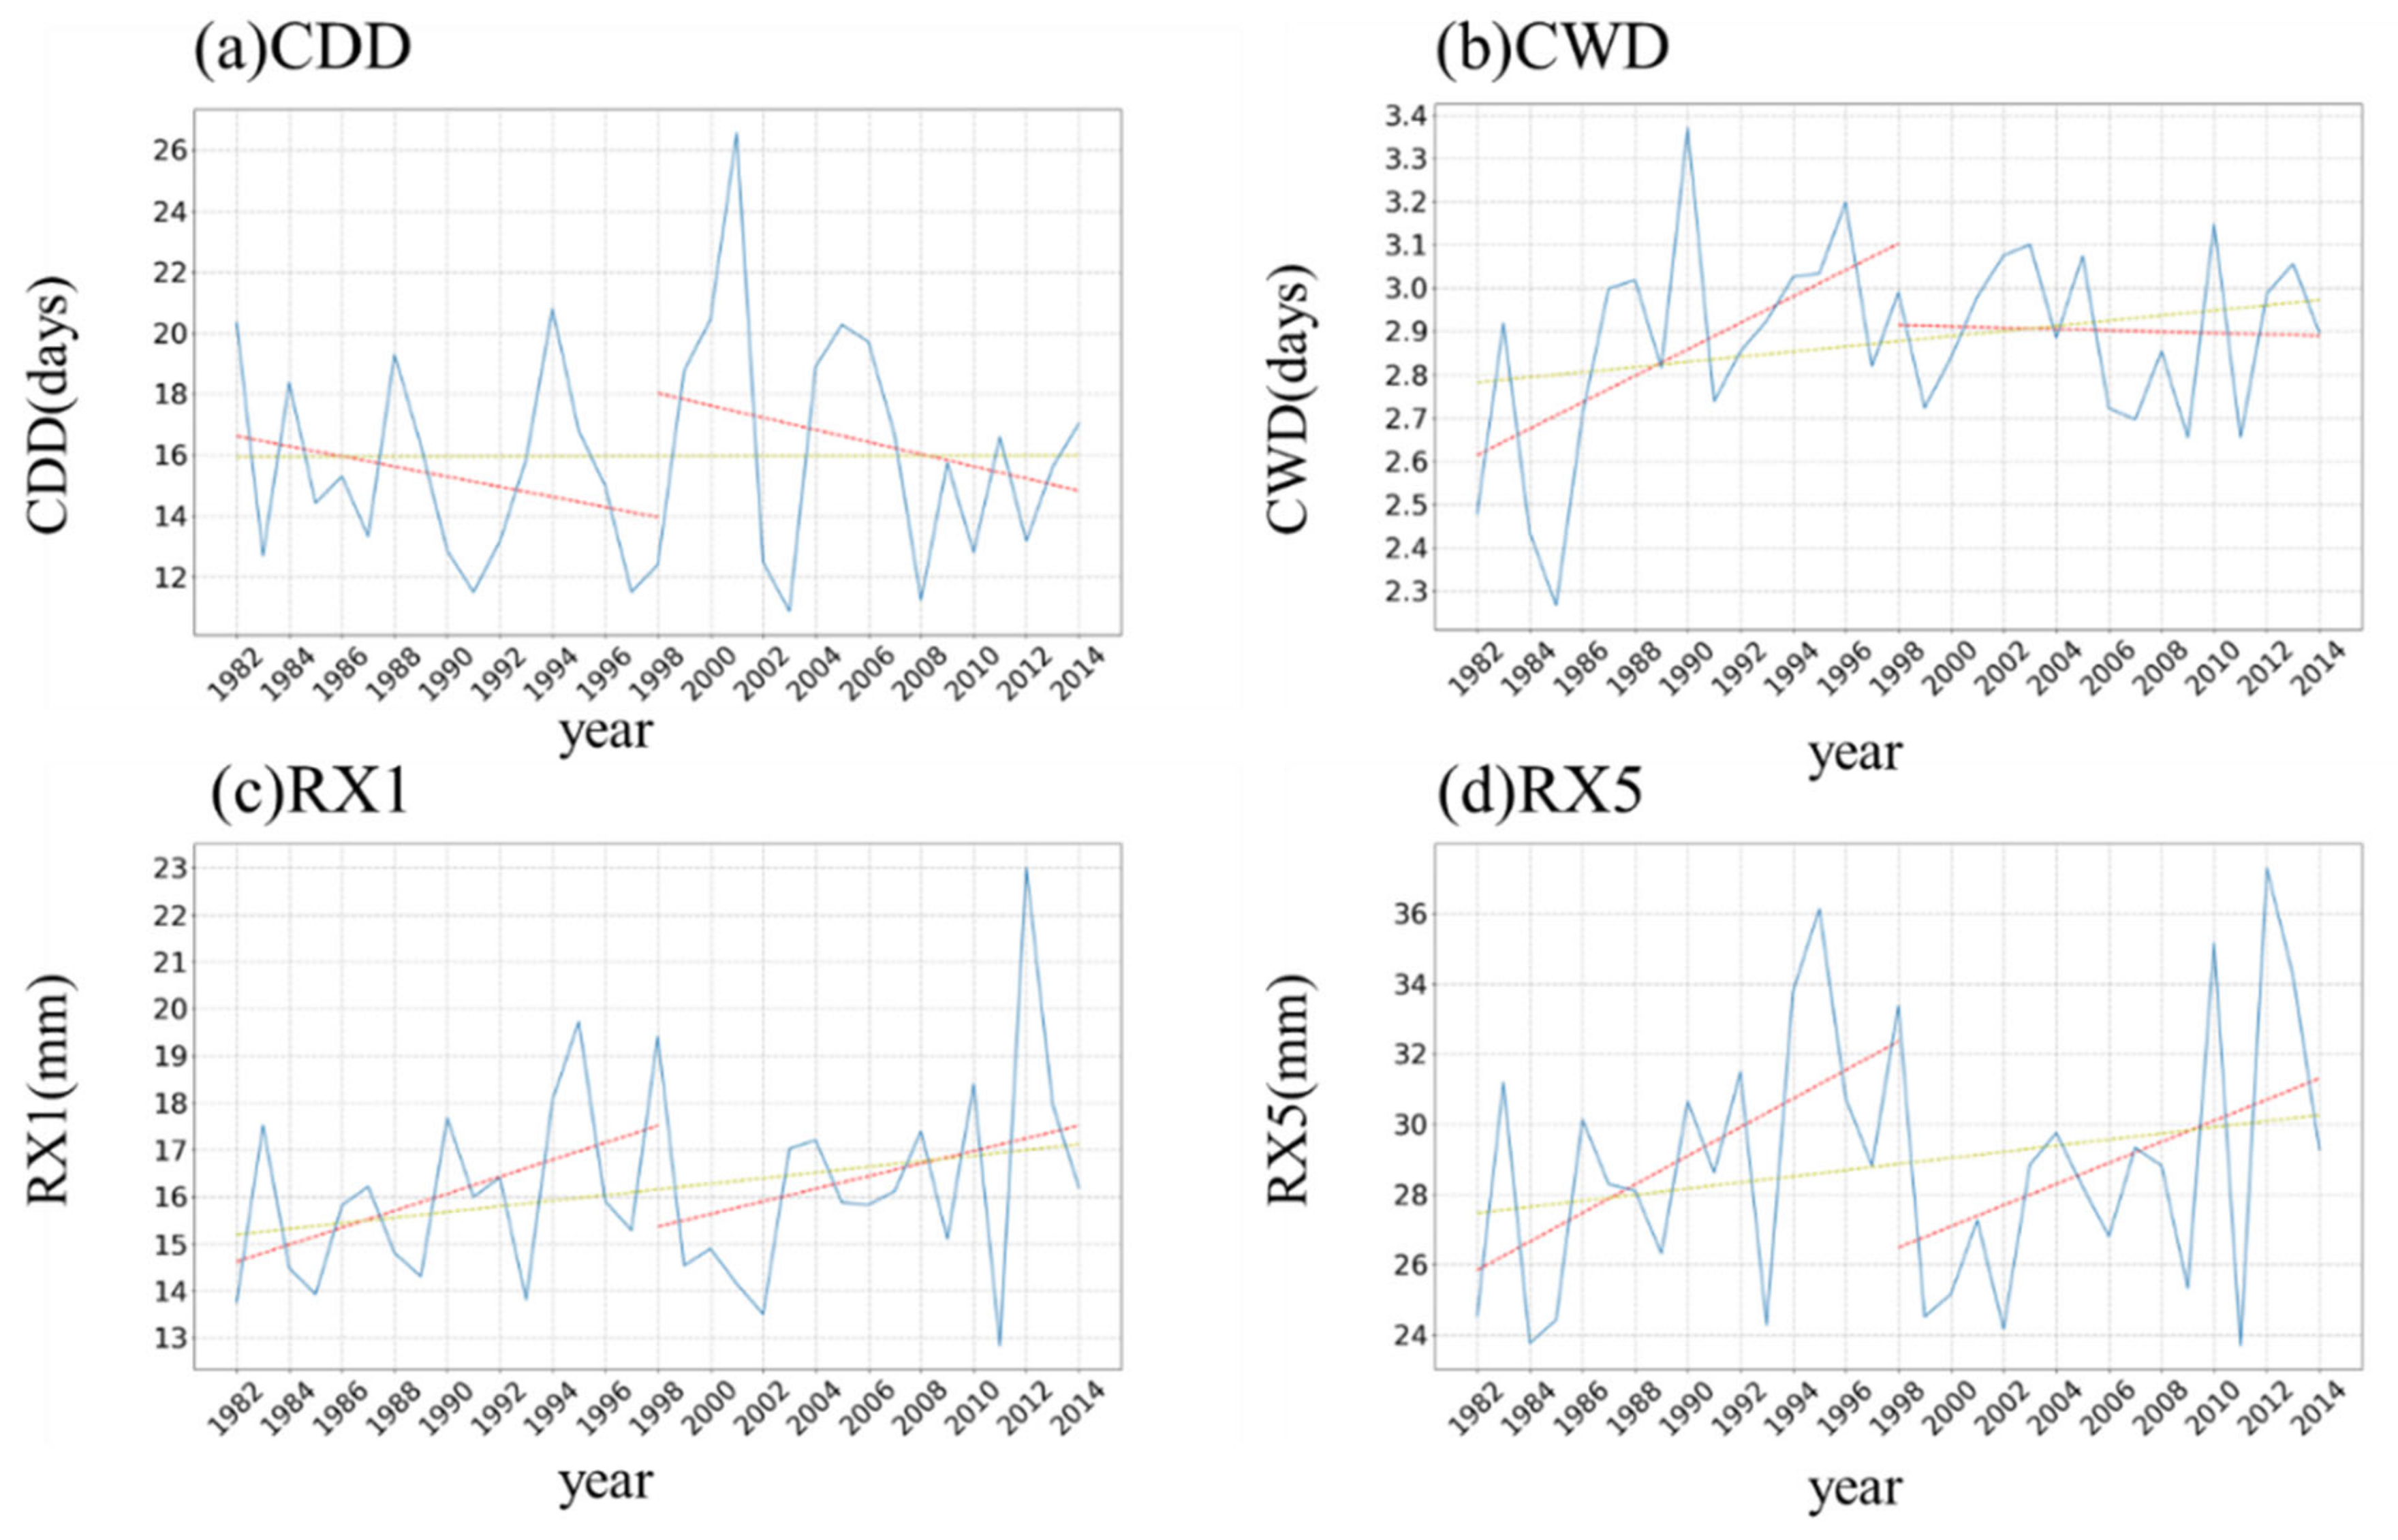
To further quantify the trend changes in extreme climate indices, the four precipitation-related extreme event indices for northeastern East Asia during 1982–2014 are further averaged regionally and analyzed in time series (Figure 8). The results show that CWD increases at a rate of 0.031 days/a (R2 = 0.31, p = 0.020) during 1982–1998 and slows down to 0.002 days/a (R2 = 0.002, p = 0.856) during 1998–2014. Rx1day and Rx5day slow down to 0.134 mm/a (R2 = 0.08, p = 0.280) and 0.301 mm/a (R2 = 0.14, p = 0.138) at a growth rate of 0.181 mm/a (R2 = 0.24, p = 0.048) and 0.407 mm/a (R2 = 0.32, p = 0.017).
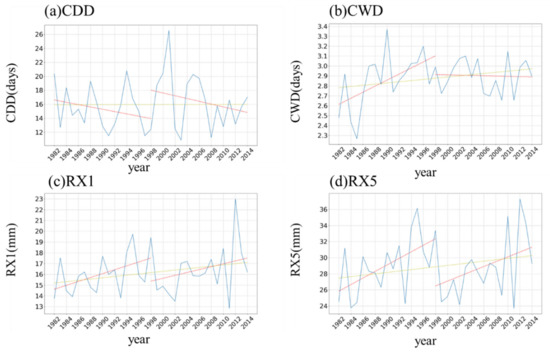
Figure 8.
Time series of regional average extreme indexes which related to precipitation: (a) consecutive dry days (days), (b) consecutive wet days (days), (c) annual maximum 1-day precipitation (mm), and (d) annual maximum 5-day precipitation (mm). The red line in the figure represents the trend from 1982–1998 and 1998–2014, the blue line represents the regional average of extreme indexes which related to precipitation from 1982–2014, and the yellow line represents the overall trend from 1982–2014.
Therefore, the trends of precipitation-related extreme climate indices are consistent with the trends of NDVI during 1982–1998 and 1998–2014, and both precipitation-related extreme climate indices and NDVI show a lagging trend during 1998–2014, compared with the opposite trend of temperature-related extreme climate indices during the two periods.
3.4. Correlation Analysis between Climatic Factors and Vegetation Index
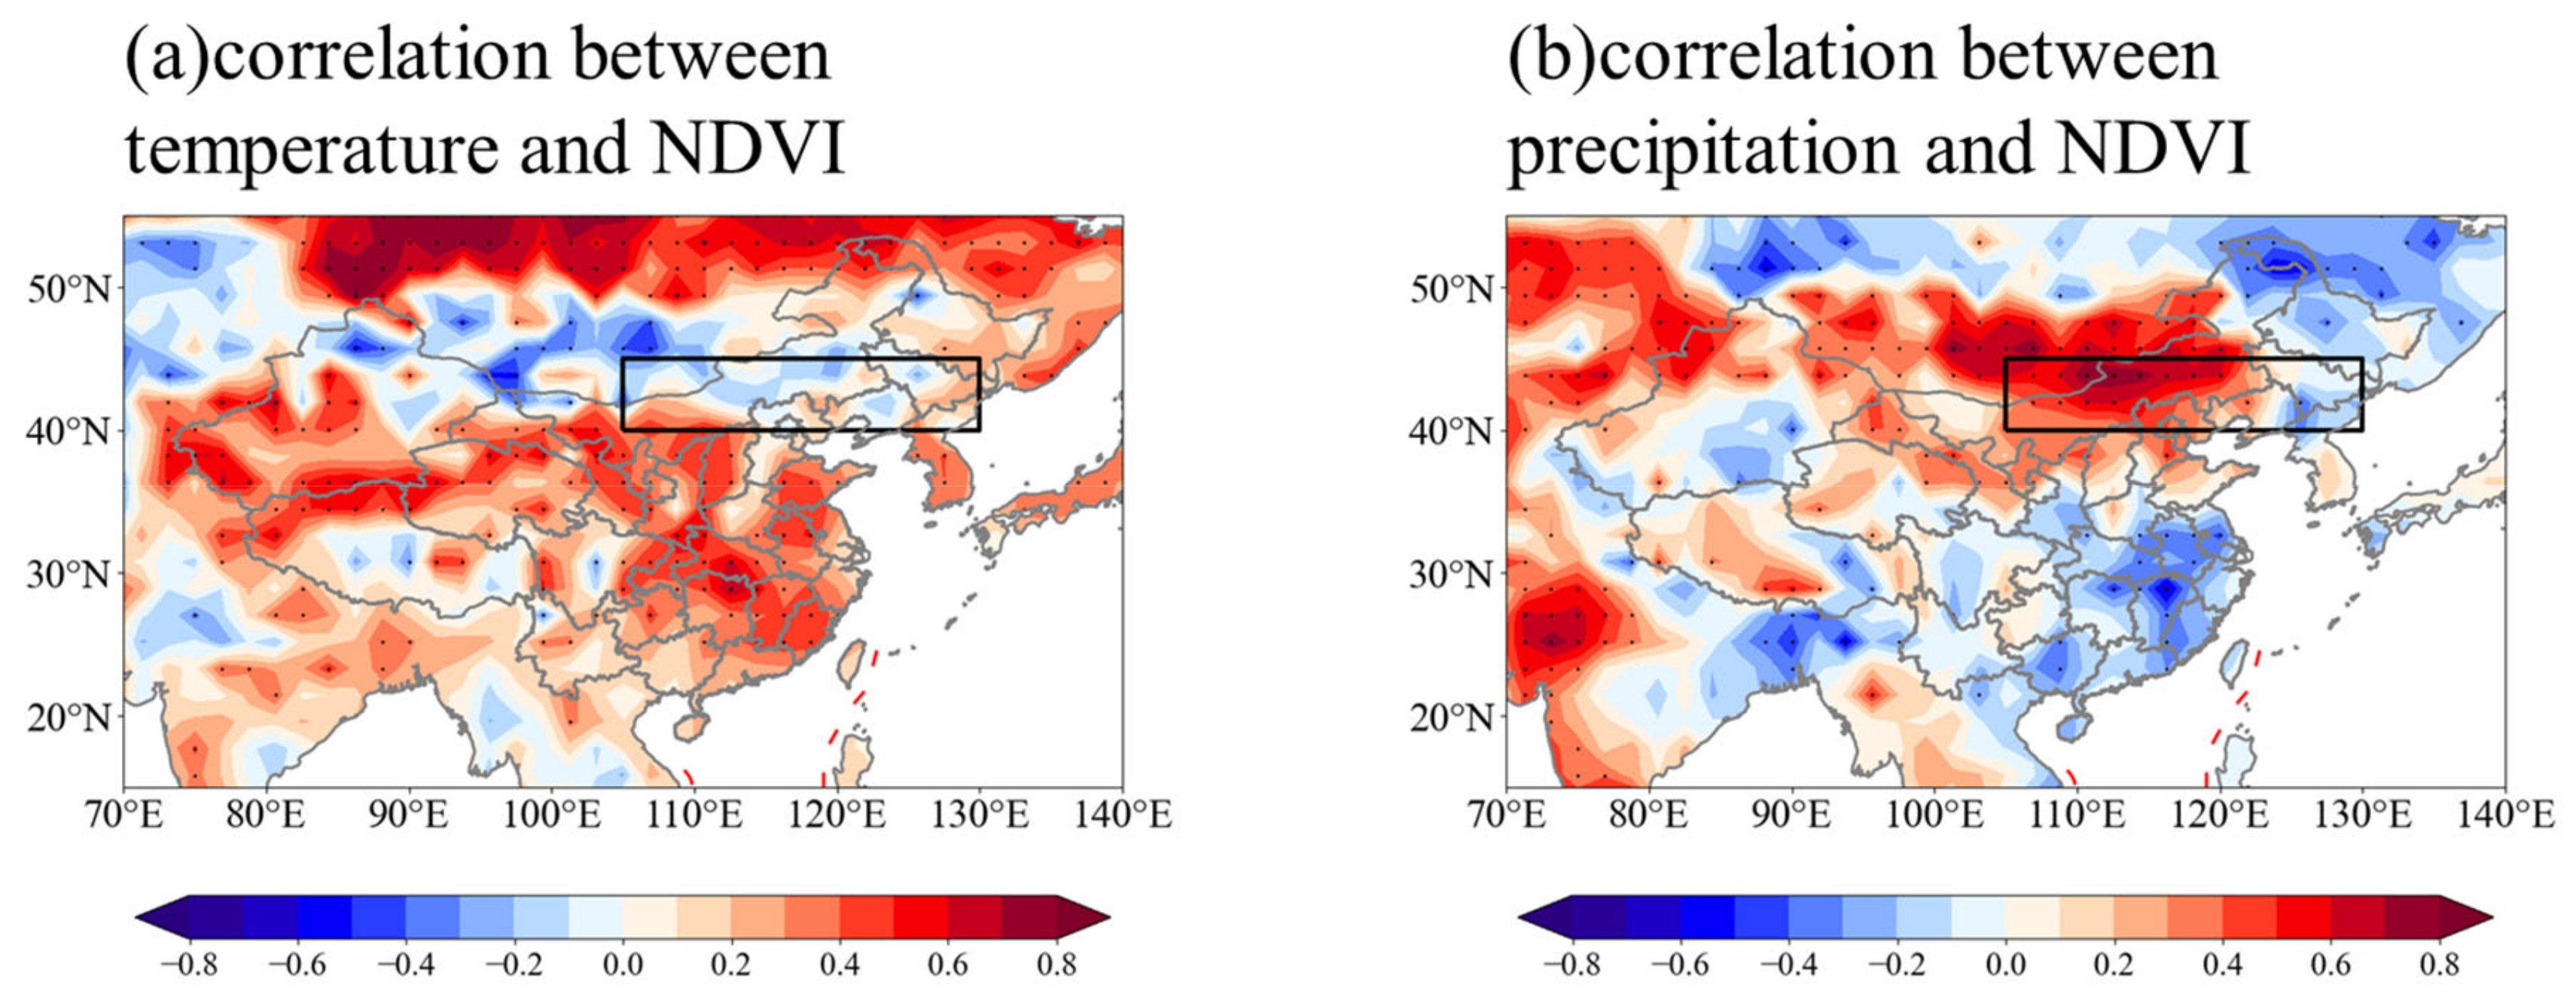
Climatic extremes in the humid–arid transition region have a greater impact on vegetation. However, the influence of average climate indicators cannot be ignored, and they often play an important role in ecosystems in the long term. Then, we further analyzed the correlation between NDVI and climate factors in northeast Asia. The spatial distribution characteristics of the correlation coefficients between NDVI and average temperature, precipitation, extreme temperature indices, and extreme precipitation indices, respectively, are shown in Figure 9, Figure 10 and Figure 11. As seen in Figure 9, NDVI in northern East Asia shows a significant positive correlation with mean precipitation, while the correlation with mean temperature is not significant. This confirms the speculation that the precipitation plays a more important role in the changing trend of multiyear NDVI over NEA.

Figure 9.
Spatial correlations (grid-to-grid correlation) between NDVI and average temperature (°C) (a) and average precipitation (mm) (b). Note: red color represents positive correlation, and blue color represents negative correlation. The red dashed lines in the figure represent Ten-dashed lines. The numbers below the description of the colors represent the spatial correlation coefficients. The black box in it is defined as the northeastern region of East Asia (40~45°N, 105~130°E). Note: dots represent correlations significance at p < 0.1, and in the dotted areas, the effective degree of freedom varies spatially between 26–30.
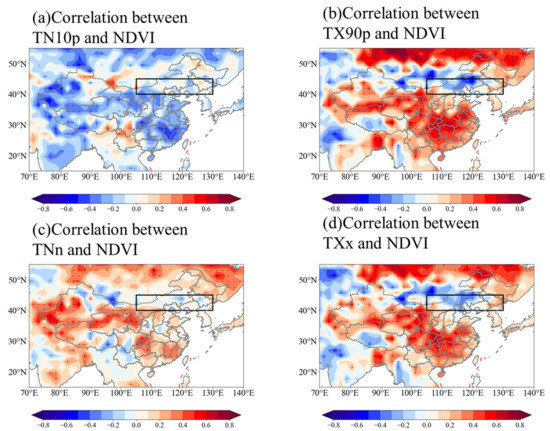
Figure 10.
Spatial correlations (grid-to-grid correlation) between NDVI and four extreme indexes related to temperature: (a) TN10p (%)–NDVI, (b) TX90p (%)–NDVI, (c) TNn (°C)–NDVI, and (d) TXx (°C)–NDVI. Note: red represents positive correlation, blue represents negative correlation. The red dashed lines in the figure represent Ten-dashed lines. The numbers below the description of the colors represent the spatial correlation coefficients. The black box in it is defined as the northeastern region of East Asia (40~45°N, 105~130°E). Note: dots represent correlations significance at p < 0.1, and in the dotted areas, the effective degree of freedom varies spatially between 26–30.
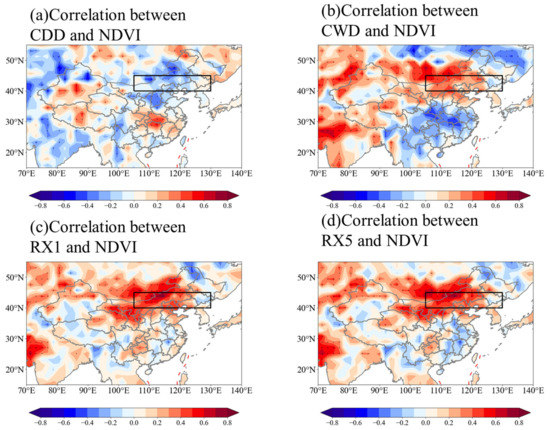
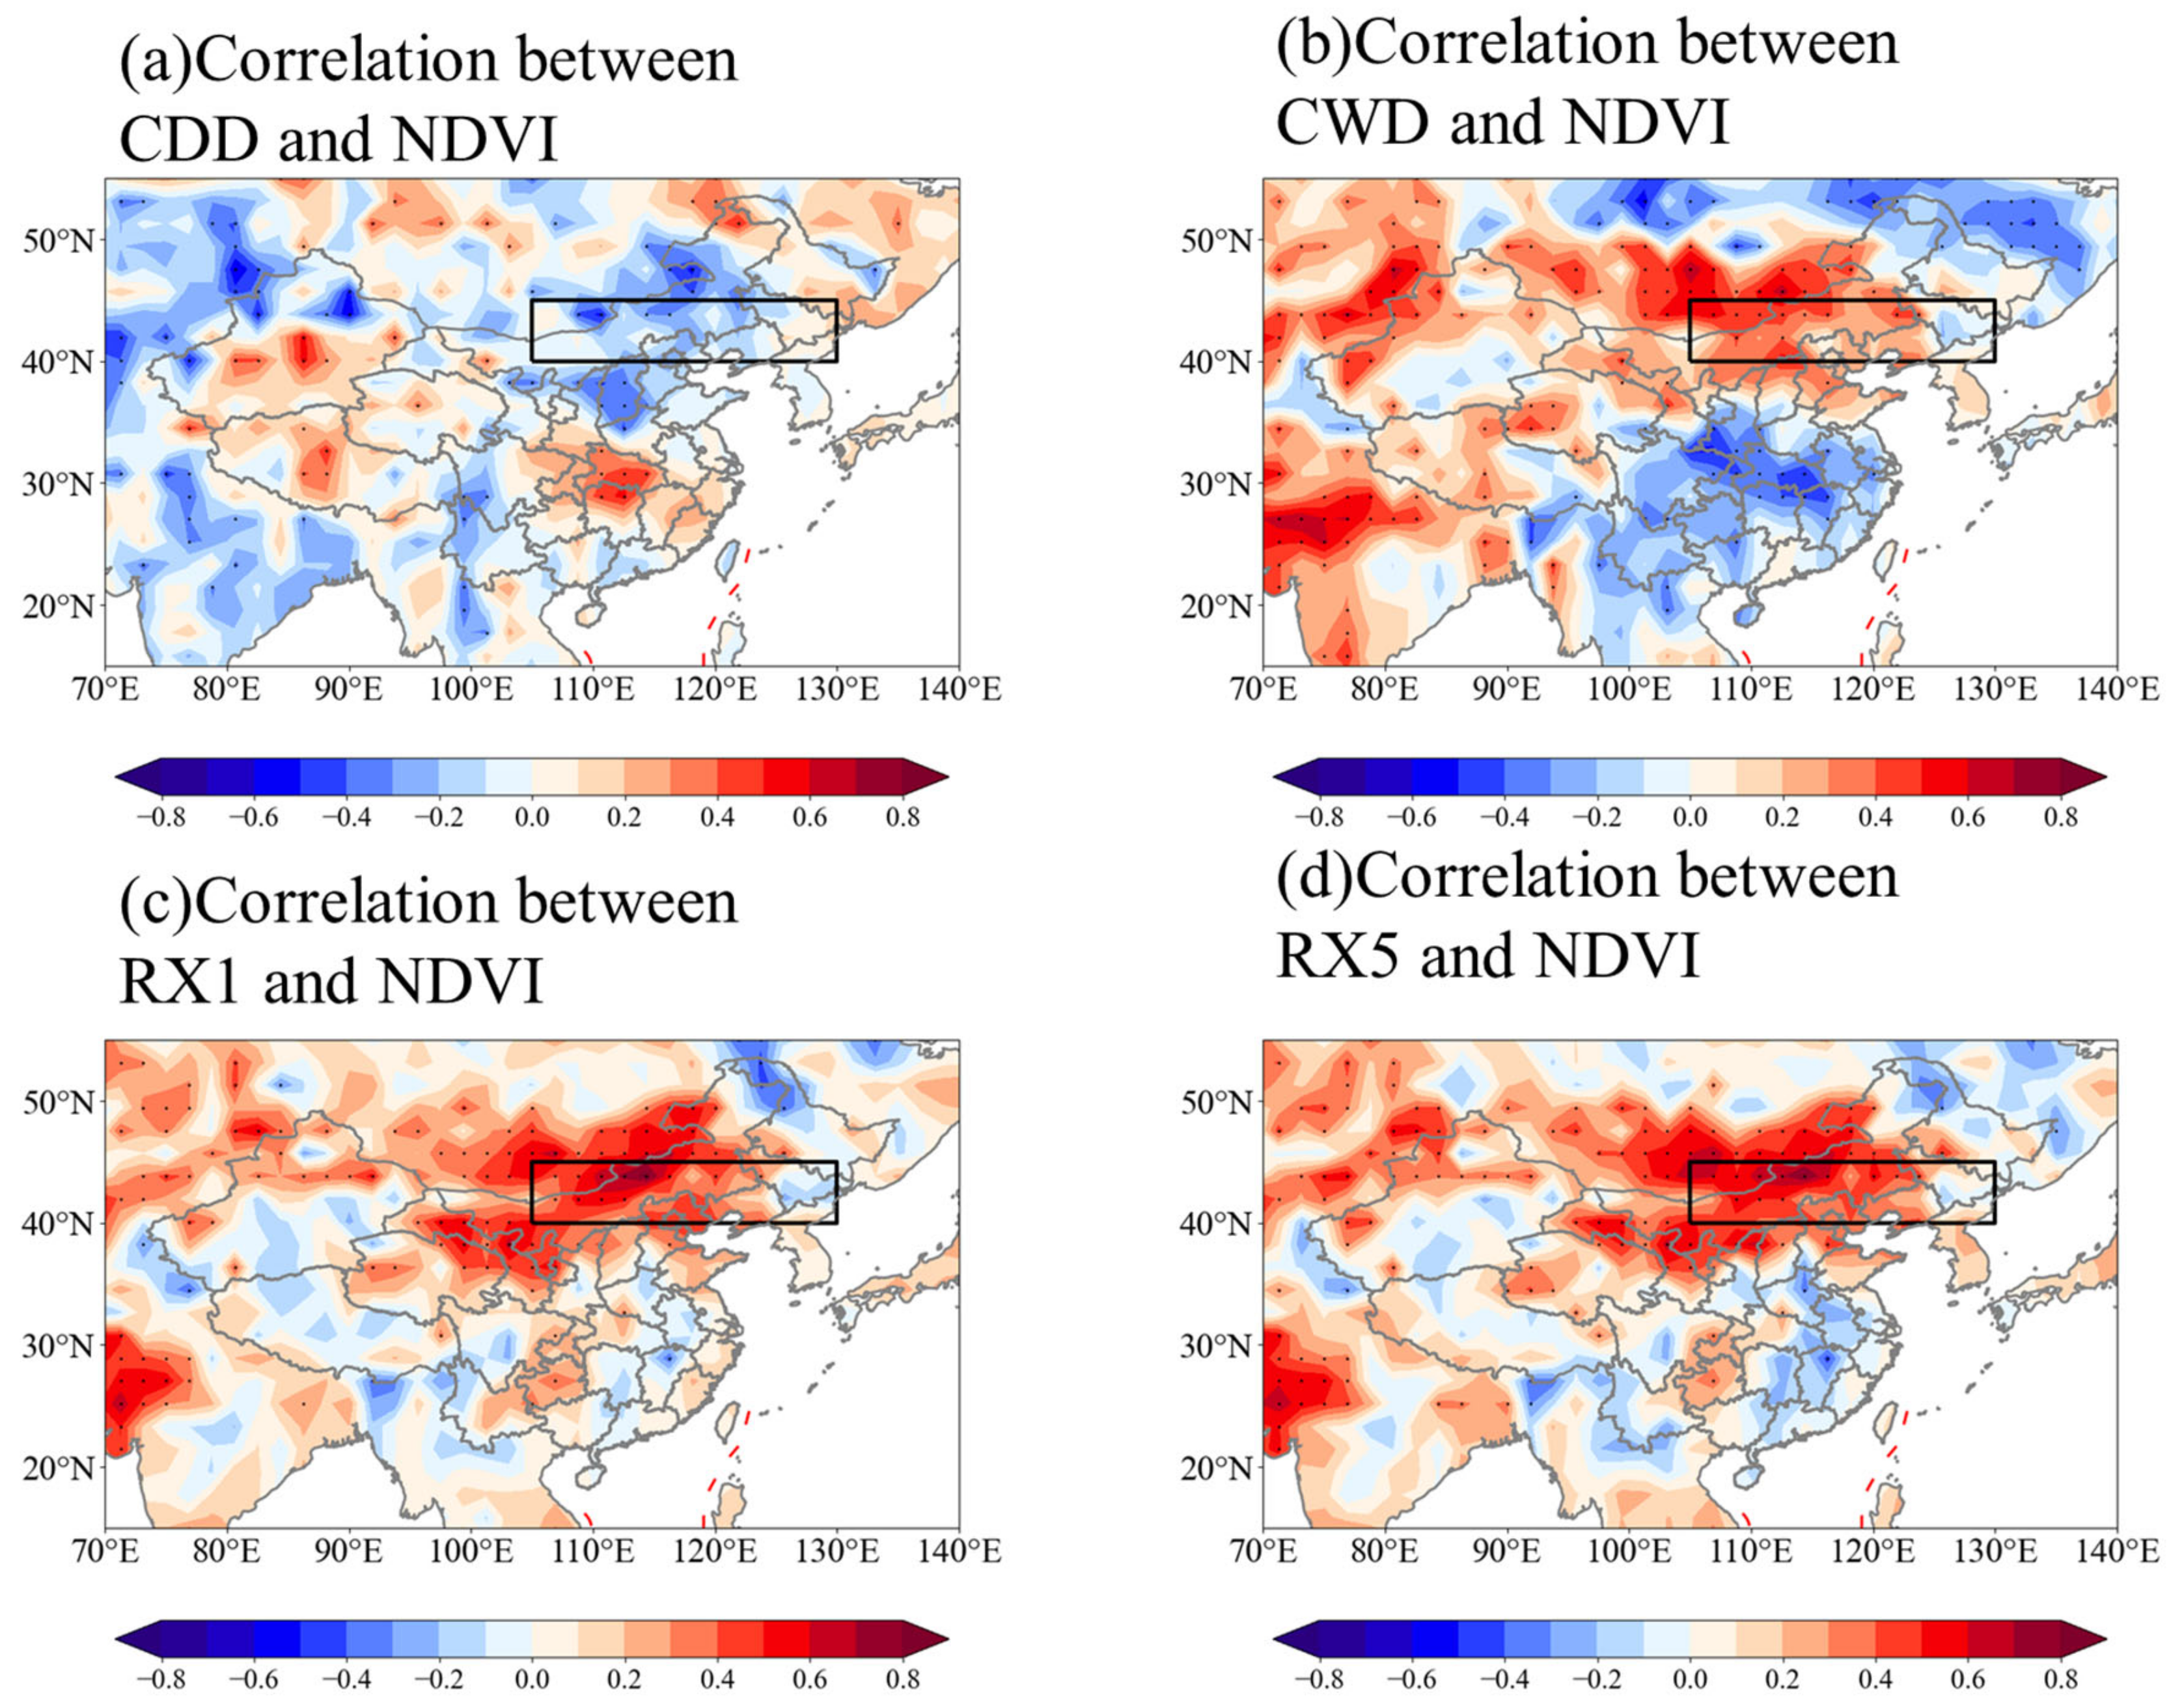
Figure 11.
Spatial correlations (grid-to-grid correlation) between NDVI and four extreme indexes related to precipitation: (a) CDD (days)–NDVI, (b) CWD (days)–NDVI, (c) RX1day (mm)–NDVI, (d) RX5day (mm)–NDVI. Note: red represents positive correlation, blue represents negative correlation. The red dashed lines in the figure represent Ten-dashed lines. The numbers below the description of the colors represent the spatial correlation coefficients. The black box in it is defined as the northeastern region of East Asia (40~45°N, 105~120°E). Dots represent significance at p < 0.1, and in the dotted areas, the effective degree of freedom varies spatially between 26–30.
Among the four temperature-related extreme climate indices (Figure 10), the cold nights (TN10p) show a weak negative correlation with NDVI in the western part of the study area, and the correlation is not obvious in the rest of the area. The warm days (TX90p) show a relatively obvious negative correlation with NDVI in the central part of the study area and a weak positive correlation in the rest of the area. The minimum daily minimum temperature (TNn) shows a weak negative correlation with NDVI in the central and eastern parts of the study area and a weak positive correlation in the southwest. The maximum daily maximum temperature (TXx) shows a weak negative correlation with NDVI in the central part of the study area and a weak positive correlation in the eastern and southwestern parts of the study area. The average temperature and NDVI show a positive correlation in the southwestern part of the study area, a weak negative correlation in some areas in the central part, a weak positive correlation in some areas, and a weak positive correlation in the eastern part. The correlation between NDVI and the extreme temperature index, as well as the average temperature index, shows some spatial heterogeneity. The central part of the study area is mainly a temperate grassland in Inner Mongolia, where the increase in temperature will increase evaporation, soil water loss, and intensify drought, which is not conducive to normal plant life activities and has an inhibitory effect on vegetation growth. There are coniferous and broad-leaved forests in the eastern part of the study area with a cold climate and sufficient water resources. The increase in temperature can promote the growth of vegetation in the area. In the southwest, there are deserts and grasslands with arid and cold climates, and the increase in temperature is beneficial to vegetation growth. Therefore, NDVI and extreme temperature indices (TX90p, TXx) generally show negative correlations in the central part of the study area and positive correlations in the eastern and southwestern parts.
The four precipitation-related extreme climate indices show significant correlations throughout the study area (Figure 11); for example, CDD shows a significant negative correlation with NDVI, and CWD, Rx1day, and Rx5day show significant positive correlations with NDVI in all regions except for the eastern part of the study area, where the correlation is not significant. Average precipitation and NDVI show negative correlations only in the eastern part of the study area, while the rest shows significant positive correlations. In the eastern part of the study area, water resources are relatively abundant, the soil is moist, and water is not a limiting factor for vegetation growth, while in the central and western parts of the study area, water resources are relatively scarce, soil water content is low, and vegetation has higher water requirements. The correlations suggest that the vegetation in the eastern part of the study area is less sensitive to the mean precipitation changes. Nevertheless, extreme precipitation events may inhibit vegetation growth in the eastern part of the region. In contrast, the increase in precipitation is beneficial to the growth of vegetation in the central and western parts of the study area.
In summary, the nonsignificant correlation between vegetation and temperature in northeastern East Asia suggests that vegetation in the region is not sensitive to changes in temperature and temperature extremes. The temperature is not a limiting factor for vegetation growth in the region. The significant correlation between NDVI and precipitation in northeastern East Asia suggests that precipitation, especially extreme precipitation, may be an important stressor for vegetation growth in this region.
The correlations of temperature, precipitation, and their extreme climate indices with the regional average time series of NDVI are further calculated using Pearson coefficients (Table 2). The observations indicate that NDVI is strongly correlated with the precipitation-related extreme climate indices, with the absolute values of the correlation coefficients above 0.3. Among them, NDVI is most sensitive to the annual average maximum 1-day precipitation (Rx1day) (0.53) and the annual average maximum 5-day consecutive precipitation (Rx5day) (0.49), followed by the number of continuously wet days (CWD) (0.43) and the number of continuously dry days (CDD) (−0.43). In contrast, the absolute values of the correlation coefficients of NDVI and temperature-related climate indices are all below 0.3 (TN10p (−0.24), TX90p (0.14), TNn (0.12), TXx (0.10)), with weak correlations. Compared with the average precipitation index, the correlation coefficients of the extreme precipitation index and NDVI are larger (0.53 > 0.31) and are more correlated. This indicates that vegetation growth changes in northeastern East Asia in the humid–arid transition zone are more sensitive to extreme precipitation, confirming the finding of Li (2018) and Liu (2013) that vegetation changes in arid and semiarid regions are highly sensitive to extreme precipitation [36,37]. Moreover, Tan (2015), Cui (2019), and Felton (2019) found a significant correlation between NDVI and extreme rainfall [38,39,40]. Pei (2021) and Zhao (2018) concluded that increased intensity and frequency of extreme precipitation promoted vegetation growth [11,41]. In the present study, NDVI is significantly and positively correlated with extreme precipitation index, a finding that differs from Zhao, Dai et al.’s study [6]. Although northeastern East Asia is located at high latitudes, vegetation growth in the region is not controlled by temperature but is sensitive to changes in precipitation. This is because the vegetation in the humid–arid transition zone has a high water demand, and extreme temperature increases can only exacerbate the aridity of the zone to inhibit vegetation growth. At the same time, extreme precipitation increases can bring sufficient water to satisfy the metabolic demand for vegetation growth and can effectively improve vegetation productivity. This indicates that the vegetation can be well grown in arid and semiarid regions as long as the precipitation is sufficient. The accumulation of precipitation can be influenced by the single-day precipitation extremes or multi-day precipitation accumulation, so the correlation with Rx1day, Rx5day is stronger than CWD, CDD.
Table 2.
Correlation coefficients of temperature and precipitation and related extreme indexes with NDVI.
3.5. Possible Causes for the Change in NDVI Trend
Changes in vegetation growth trends are caused by a combination of many factors, including rising CO2 concentrations [42], nitrogen deposition [43], climate change [44], human activities [45], volcanic eruptions [46], the response of vegetation activity to climate change [47], etc. The causes for vegetation changes vary from region to region; for example, in boreal regions, vegetation growth cycles become longer due to global warming, and in Australia, vegetation suddenly turns green after volcanic eruptions due to the warming and humidifying effects of weak El Niño events [48]. Temperature and extreme temperatures may enhance photosynthesis and water use, promoting vegetation growth. Precipitation and extreme precipitation may replenish large amounts of water, effectively stimulating vegetation growth. However, these effects are not absolute and will vary by regions and seasons. For the present study, the difference in vegetation growth trends in northeastern East Asia between 1982–1998 and 1998–2014 is not due to temperature but probably to changes in precipitation. This is also consistent with the previous finding of Goetz, Bunn et al. that browning in the north is mainly attributed to stress within the growing season rather than to changes in growing season length [49].
Combining the spatial and temporal characteristics of NDVI and climate indices and the results of correlation analysis, extreme high temperature (TX90p, TNn, TXx), extreme precipitation (Rx1day, Rx5day, CWD), average temperature, and average precipitation all show a significant increasing trend during 1982–1998, and NDVI also shows an enhancing trend during this period. This increased NDVI may be related to the abundant water and heat. In a typical monsoon climate, extremely high temperatures and increased frequency of precipitation, rain, and heat provide a suitable environment for plant growth. However, during 1998–2014, TX90p, TNn, and TXx decrease significantly. The growth rates of Rx1day, Rx5day, and CWD slow down. In terms of the changing trend, precipitation and NDVI are basically consistent, while NDVI lags behind the change of temperature. The correlation between extreme precipitation and NDVI is more significant than that between temperature climate index and average precipitation during 1982–2014. Therefore, extreme precipitation may be an important stressor affecting vegetation growth in northeastern East Asia. In arid and semiarid zones, precipitation significantly affects vegetation activity [36,37], while temperature is not a limiting factor in arid and semiarid regions, and extreme temperatures in arid and semiarid regions only exacerbate regional water evaporation and drought levels, further inhibiting vegetation activity. Northeastern East Asia is in the East Asian monsoon climate transition zone, mainly surrounded by arid and semiarid zones with weak soil water-holding capacity and low water content. Vegetation in this region is particularly sensitive to climate change. The region is a typical ecologically fragile zone and agro-pastoral interlacing zone, where extreme precipitation can significantly affect the stability of this ecosystem [50]. Compared with the average precipitation, extreme precipitation can bring a huge amount of water, effectively improve the soil moisture condition, increase the effectiveness of nitrogen in the soil, and satisfy the needs of normal life activities of vegetation [51], thus promoting significant growth of vegetation in northeastern East Asia. Thus, where does the water come from? What controls how often extreme precipitation occurs?
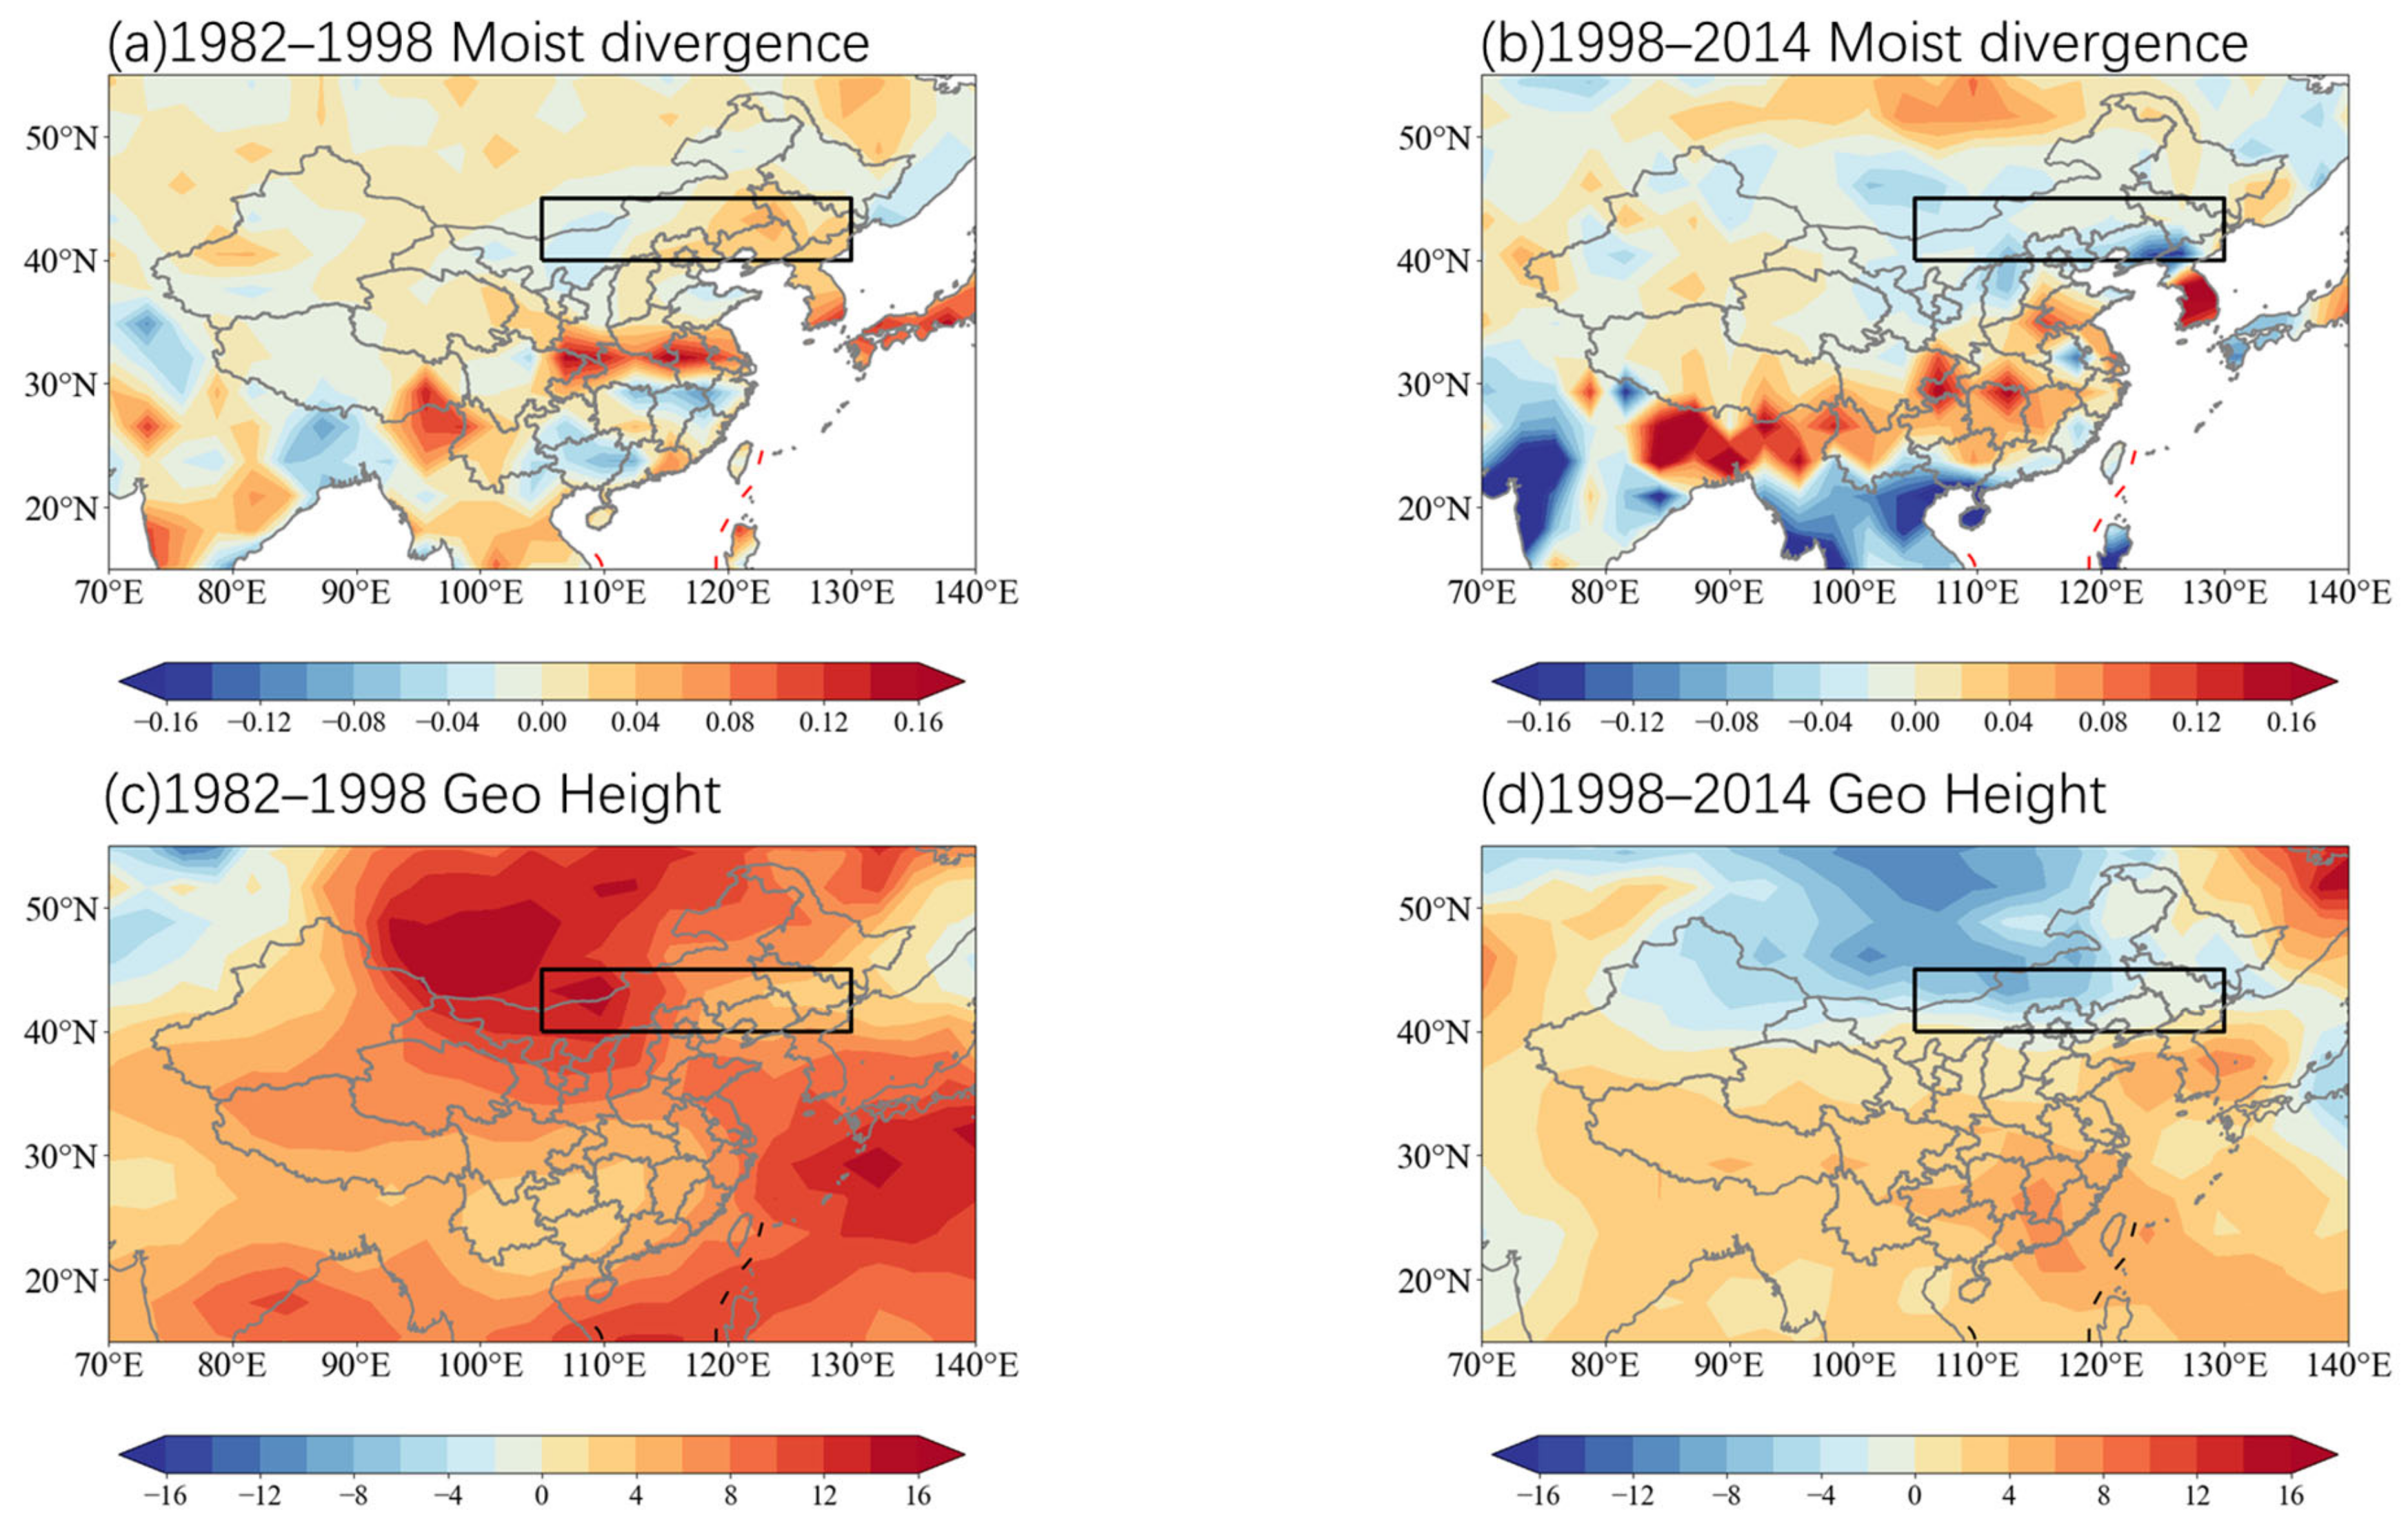
The Northwest Pacific subtropical high (NPSH) pressure is an important circulation system affecting moisture transport in northeastern East Asia. The formation of extreme rainfall is directly related to moisture supply, and the North Pacific subtropical high pressure plays an important role in moisture supply in northeastern East Asia, and the intensity and frequency of rainfall in many northeastern regions are related to the subalpine [52]. A 500 hPa geopotential height field is widely used to describe the activity of NPSH [53,54], and the water vapor transport flux field can characterize the water vapor balance of a region [55]. Therefore, further trend analysis of the water vapor transport flux field (indicated by the column-integrated moisture divergence) and 500 hPa geopotential height concludes (Figure 12) that during 1982–1998, the subtropical high pressure located near 30° N significantly intensified, bringing a large amount of water vapor from the adjacent ocean to the northern region of East Asia, resulting in enhanced water vapor convergence, increased water vapor, and a wetter atmosphere in northeastern East Asia, so the frequency and intensity of extreme precipitation increased. During the period 1998–2014, the trend of NPSH was much weaker compared with the previous period, and the water vapor convergence capacity in northeastern East Asia was reduced. The atmospheric water content decreased, so the trend of increasing extreme precipitation during this period is slowed down.
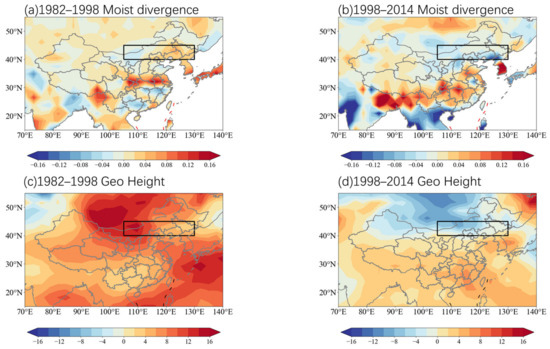
Figure 12.
Trends of column-integrated moisture divergence (upper row, shading, positive is convergence and negative is divergence, units: 10−5 kg/s·m2/a) and 500 hPa geopotential height (bottom row, units: m/a) in JJA. Note: warm tones represent an increasing trend, cool tones represent a decreasing trend. The black dashed lines in the figure represent Ten-dashed lines. The numbers below the description of the colors represent the trend slope value. The black box in it is defined as the northeastern region of East Asia (40~45°N, 105~130°E).
In addition, from the analysis of the spatial and temporal characteristics of extreme climate indices, we find relationships between changes in extreme precipitation indices and changes in extreme temperature indices. Williams, Torn et al. [56] and Betts, Alfieri et al. [57] noted that the change in precipitation depends on the change in temperature. The increase in temperature leads to an increase in atmospheric water content, as well as changes in the hydrological cycle [58,59]. Therefore, we hypothesize that precipitation also has a lagged effect on changes in temperature and that lower temperatures and weaker evaporation reduce atmospheric water content, which, in turn, reduces a certain amount of precipitation, slowing down the rate of precipitation increase.
Therefore, northeastern East Asia is an extreme precipitation-sensitive area, and the North Pacific subtropical high pressure controls the frequency and intensity of extreme precipitation occurrence in this area by influencing the moisture supply and water vapor convergence in northeastern East Asia. Extreme precipitation can effectively alleviate drought in northeastern East Asia and is an important stressor affecting vegetation growth in northeastern East Asia. The temperature directly affects vegetation growth in northeastern East Asia to some extent by affecting photosynthesis, on the one hand, and indirectly affecting vegetation activity by affecting evaporation and changing atmospheric water content, and thus precipitation, on the other hand.
4. Discussion
The NDVI in northeastern East Asia showed an increasing trend during 1982–2014, which is consistent with the study of Sun et al. (2021) [60] and Liu et al. (2021) [61], and we further found a significant change in NDVI growth rate in northern East Asia around 1998, showing a trend of slowing down during 1998–2014. It has been shown that NDVI changes are closely related to temperature and precipitation [62]. While vegetation changes at high latitudes are mainly limited by temperature [63], our study shows that NDVI trends over northeastern East Asia are more consistent with precipitation changes, especially sensitive to extreme precipitation. Vegetation activity in the region increases when precipitation is abundant enough, mainly due to the fact that northeastern East Asia is in the East Asian monsoon climate transition zone, which is under the stress of drought. However, vegetation response to extreme climate events often has a lag of several months, with a general one-month lag in NDVI for extreme temperature and a two-month lag for extreme precipitation [28,40,64]. The lag time remains uncertain due to differences in the magnitude, duration, and frequency of vegetation types and extreme climate events. In addition, the relationship between the extreme climate index and NDVI varies seasonally [65]. Therefore, the impact of extreme climate events on vegetation activity deserves further study through different seasons and lag time periods in the future. Moreover, the influence of human activities is not considered in the current study. The implementation of afforestation projects and programs in northeastern East Asia since 2000 has increased the vegetation cover in the region, and the vegetation growth, in turn, may affect the surrounding climate [66]. Future studies using terrestrial ecosystem models are warranted to quantify the effects of climate change on vegetation growth in East Asia by excluding the effects of human activities, atmospheric CO2 concentration, and nitrogen deposition, and these changes in vegetation growth may affect the terrestrial carbon cycle and thus feed back into the Earth’s climate system.
5. Conclusions
In this study, we investigate the changes in vegetation growth trends over northeastern East Asia (40~45°N,105~130°E), situated in the monsoon transition zone, during 1982–2014. By using regional averaging and trend analysis, we analyze the trends of related climate factors and examine the relationship between vegetation growth and climate factors in northeastern East Asia using Pearson’s correlation. The results show that the NDVI in northeastern East Asia maintains an increasing trend during 1982–2014. However, the increasing trend slowed down during 1998–2014 compared to 1982–1998, consistent with previous studies on the change in vegetation growth trends across Eurasia around 1997–1998 [12]. Correlation analysis of relevant climatic factors shows that vegetation growth in northeastern East Asia is significantly affected by precipitation, and vegetation activity is more sensitive to extreme precipitation events. Furthermore, we find that the Northwest Pacific subtropical high (NPSH) plays an important role in the trend changes of precipitation-related extreme indices. Before 1998, strengthened NPSH enhanced the moisture transport to the NEA, providing abundant water vapor favorable for extreme precipitation events. However, after 1998, the NPSH trend weakened, decreasing the moisture transport trend.
Author Contributions
Conceptualization: C.S.; methodology: C.S. and Z.G.; formal analysis: Z.G.; writing: Z.G., W.L. and C.S.; writing (review and editing): C.S., W.L., Z.G. and B.H. All authors have read and agreed to the published version of the manuscript.
Funding
This research received no external funding.
Data Availability Statement
The GIMMS3g NDVI Dataset and CRU TS4.05 dataset were downloaded from the KNMI Climate Explorer (available from http://climexp.knmi.nl/, accessed on 1 March 2022). The ERA5 reanalysis data were downloaded from the the European Center for Medium-Range Weather Forecasting (ECMWF) (available from https://www.ecmwf.int/, accessed on 1 March 2022).
Acknowledgments
We would like to thank the five anonymous reviewers for their constructive comments that helped improve our manuscript. This work is jointly supported by the National Key Research and Development Program of China (2020YFA0608401), Aeronautical observation system support of National High Resolution Special (30-H30C01-9004-19/21), and National Programme on Global Change and Air-Sea Interaction (GASI-IPOVAI-06 and GASI-IPOVAI-03).
Conflicts of Interest
The authors declare no conflict of interest.
References
- Norbert, S. The Role of the Terrestrial Vegetation in the Global Carbon Cycle; Georgii, H.W., Jaeschke, W., Eds.; Springer: Dordrecht, The Netherlands, 1982; pp. 185–202. [Google Scholar]
- Hui, J.; Chen, Z.; Ye, B.; Shi, C.; Bai, Z. Remote Sensing Monitoring of the Spatial Pattern of Greening and Browning in Xilin Gol Grassland and Its Response to Climate and Human Activities. Remote Sens. 2022, 14, 1765. [Google Scholar] [CrossRef]
- Munavar, Z.; Mönnig, C.; Hergarten, C.; Darr, D.; Wrage-Mönnig, N. Assessment of vegetation degradation in mountainous pastures of the Western Tien-Shan, Kyrgyzstan, using eMODIS NDVI. Ecol. Indic. 2018, 95, 527–543. [Google Scholar] [CrossRef]
- Guan, Q.; Yang, L.; Pan, N.; Jinkuo, L.; Xu, C.; Wang, F.; Liu, Z. Greening and Browning of the Hexi Corridor in Northwest China: Spatial Patterns and Responses to Climatic Variability and Anthropogenic Drivers. Remote Sens. 2018, 10, 1270. [Google Scholar] [CrossRef] [Green Version]
- Das, P. 20 years MODIS-NDVI monitoring suggests that vegetation has increased significantly around Tehri Dam reservoir, Uttarakhand, India. Remote Sens. Appl. Soc. Environ. 2021, 24, 100610. [Google Scholar] [CrossRef]
- Zhao, L.; Dai, A.; Dong, B. Changes in global vegetation activity and its driving factors during 1982–2013. Agric. For. Meteorol. 2018, 249, 198–209. [Google Scholar] [CrossRef]
- Xu, X.; Liu, H.; Jiao, F.; Gong, H.; Lin, Z. Time-varying trends of vegetation change and their driving forces during 1981–2016 along the silk road economic belt. CATENA 2020, 195, 104796. [Google Scholar] [CrossRef]
- Li, J.; Li, Z.; Dong, S.; Wei, M.; Zhou, J. Spatial and temporal changes in vegetation and desertification (1982–2018) and their responses to climate change in the Ulan Buh Desert, Northwest China. Theor. Appl. Climatol. 2021, 143, 1643–1654. [Google Scholar] [CrossRef]
- Angert, A.; Biraud, S.; Bonfils, C.; Henning, C.C.; Buermann, W.; Pinzon, J.; Tucker, C.J.; Fung, I. Drier summers cancel out the CO2 uptake enhancement induced by warmer springs. Proc. Natl. Acad. Sci. USA 2005, 102, 10823–10827. [Google Scholar] [CrossRef] [Green Version]
- Piao, S.; Wang, X.; Ciais, P.; Zhu, B.; Wang, T.; Liu, J. Changes in satellite-derived vegetation growth trend in temperate and boreal Eurasia from 1982 to 2006. Glob. Chang. Biol. 2011, 17, 3228–3239. [Google Scholar] [CrossRef]
- Zhao, A.; Zhang, A.; Liu, X.; Cao, S. Spatiotemporal changes of normalized difference vegetation index (NDVI) and response to climate extremes and ecological restoration in the Loess Plateau, China. Theor. Appl. Climatol. 2018, 132, 555–567. [Google Scholar] [CrossRef]
- Zhou, L.; Tucker, C.; Kaufmann, R.; Slayback, D.; Shabanov, N.V.; Myneni, R.B. Variation in northern vegetation activity inferred from satellite data of vegetation index during 1981 to 1999. J. Geophys. Res. 2001, 106, 20069–20084. [Google Scholar] [CrossRef]
- Barber, V.A.; Juday, G.P.; Finney, B.P. Reduced growth of Alaskan white spruce in the twentieth century from temperature-induced drought stress. Nature 2000, 405, 668–673. [Google Scholar] [CrossRef]
- Nemani, R.; White, M.; Thornton, P.; Nishida, K.; Reddy, S.; Jenkins, J.; Running, S. Recent trends in hydrologic balance have enhanced the terrestrial carbon sink in the United States. Geophys. Res. Lett. 2002, 29, 106. [Google Scholar] [CrossRef] [Green Version]
- Zhai, P.; Sun, A.; Ren, F.; Liu, X.; Gao, B.; Zhang, Q. Changes of Climate Extremes in China. In Weather and Climate Extremes: Changes, Variations and a Perspective from the Insurance Industry, Karl, T.R., Nicholls, N., Ghazi, A., Eds.; Springer: Dordrecht, The Netherlands, 1999; pp. 203–218. [Google Scholar]
- Jiang, D.; Zhang, H.; Zhang, Y.; Wang, K. Interannual variability and correlation of vegetation cover and precipitation in Eastern China. Theor. Appl. Climatol. 2014, 118, 93–105. [Google Scholar] [CrossRef]
- Bokhorst, S.; Tømmervik, H.; Callaghan, T.V.; Phoenix, G.K.; Bjerke, J.W. Vegetation recovery following extreme winter warming events in the sub-Arctic estimated using NDVI from remote sensing and handheld passive proximal sensors. Environ. Exp. Bot. 2012, 81, 18–25. [Google Scholar] [CrossRef]
- Sun, J.; Cheng, G.; Li, W.; Sha, Y.; Yang, Y. On the Variation of NDVI with the Principal Climatic Elements in the Tibetan Plateau. Remote Sens. 2013, 5, 1894–1911. [Google Scholar] [CrossRef] [Green Version]
- Wang, X.; Hou, X. Variation of Nor-malized Difference Vegetation Index (NDV1) and lts Response toExtreme Climate in the Coustal Area of China during 1982–2014. Geogr. Res. 2019, 2019, 807–821. [Google Scholar] [CrossRef]
- Jiang, M.; He, Y.; Song, C.; Pan, Y.; Qiu, T.; Tian, S. Disaggregating climatic and anthropogenic influences on vegetation changes in Beijing-Tianjin-Hebei region of China. Sci. Total Environ. 2021, 786, 147574. [Google Scholar] [CrossRef]
- Fu, C.; Wen, G. Variation of Ecosystems over East Asia in Association with Seasonal, Interannual and Decadal Monsoon Climate Variability. Clim. Chang. 1999, 43, 477–494. [Google Scholar] [CrossRef]
- Cui, J.; Piao, S.; Huntingford, C.; Wang, X.; Lian, X.; Chevuturi, A.; Turner, A.G.; Kooperman, G.J. Vegetation forcing modulates global land monsoon and water resources in a CO2-enriched climate. Nat. Commun. 2020, 11, 5184. [Google Scholar] [CrossRef]
- Lee, M.-H.; Ho, C.-H.; Kim, J.; Song, C.-K. Assessment of the changes in extreme vulnerability over East Asia due to global warming. Clim. Chang. 2012, 113, 301–321. [Google Scholar] [CrossRef]
- Park, H.-S.; Sohn, B.J. Recent trends in changes of vegetation over East Asia coupled with temperature and rainfall variations. J. Geophys. Res. Atmos. 2010, 115, D14101. [Google Scholar] [CrossRef]
- Zhou, D.; Zhao, X.; Hu, H.; Shen, H.; Fang, J. Long-term vegetation changes in the four mega-sandy lands in Inner Mongolia, China. Landsc. Ecol. 2015, 30, 1613–1626. [Google Scholar] [CrossRef]
- Zhang, P.; Jeong, J.-H.; Yoon, J.-H.; Kim, H.; Wang, S.-Y.S.; Linderholm, H.W.; Fang, K.; Wu, X.; Chen, D. Abrupt shift to hotter and drier climate over inner East Asia beyond the tipping point. Science 2020, 370, 1095–1099. [Google Scholar] [CrossRef]
- Sun, C.; Zhu, L.F.; Liu, Y.S.; Hao, Z.C.; Zhang, J. Changes in the drought condition over northern East Asia and the connections with extreme temperature and precipitation indices. Glob. Planet. Chang. 2021, 207, 103645. [Google Scholar] [CrossRef]
- Shao, H.; Zhang, Y.D.; Gu, F.X.; Shi, C.M.; Miao, N.; Liu, S.R. Impacts of climate extremes on ecosystem metrics in southwest China. Sci. Total Environ. 2021, 776, 145979. [Google Scholar] [CrossRef]
- Myneni, R.B.; Keeling, C.D.; Tucker, C.J.; Asrar, G.; Nemani, R.R. Increased plant growth in the northern high latitudes from 1981 to 1991. Nature 1997, 386, 698–702. [Google Scholar] [CrossRef]
- Harris, I.; Jones, P. CRU TS4.01: Climatic Research Unit (CRU) Time-Series (TS) Version 4.01 of High-Resolution Gridded Data of Month-by-Month Variation in Climate (Jan. 1901–Dec. 2016); Centre for Environmental Data Analysis (CEDA): Oxford, UK, 2017. [Google Scholar] [CrossRef]
- Pl, F.; Alexander, L.; Della-Marta, P.; Gleason, B.; Haylock, M.; Klein, T.; Tc, P. Observed coherent changes in climatic extremes during 2nd half of the 20th century. Clim. Res. 2002, 19, 193–212. [Google Scholar] [CrossRef] [Green Version]
- Yuan, P.; Van Malderen, R.; Yin, X.; Vogelmann, H.; Awange, J.; Heck, B.; Kutterer, H. Characterizations of Europe’s integrated water vapor and assessments of atmospheric reanalyses using more than two decades of ground-based GPS. Atmos. Chem. Phys. Discuss. 2021, 2021, 1–38. [Google Scholar] [CrossRef]
- He, C.; Lin, A.; Gu, D.; Li, C.; Zheng, B.; Wu, B.; Zhou, T. Using eddy geopotential height to measure the western North Pacific subtropical high in a warming climate. Theor. Appl. Climatol. 2018, 131, 681–691. [Google Scholar] [CrossRef] [Green Version]
- Hersbach, H.; Bell, B.; Berrisford, P.; Hirahara, S.; Horanyi, A.; Munoz-Sabater, J.; Nicolas, J.; Peubey, C.; Radu, R.; Schepers, D.; et al. The ERA5 global reanalysis. Q. J. R. Meteorol. Soc. 2020, 146, 1999–2049. [Google Scholar] [CrossRef]
- Liu, Y.; Sun, C.; Li, J. The Boreal Summer Zonal Wavenumber-3 Trend Pattern and Its Connection with Surface Enhanced Warming. J. Clim. 2021, 35, 833–850. [Google Scholar] [CrossRef]
- Li, C.; Wang, J.; Hu, R.; Yin, S.; Bao, Y.; Ayal, D.Y. Relationship between vegetation change and extreme climate indices on the Inner Mongolia Plateau, China, from 1982 to 2013. Ecol. Indic. 2018, 89, 101–109. [Google Scholar] [CrossRef]
- Liu, G.; Liu, H.; Yin, Y. Global patterns of NDVI-indicated vegetation extremes and their sensitivity to climate extremes. Environ. Res. Lett. 2013, 8, 025009. [Google Scholar] [CrossRef] [Green Version]
- Cui, L.; Wang, L.; Qu, S.; Singh, R.P.; Lai, Z.; Yao, R. Spatiotemporal extremes of temperature and precipitation during 1960–2015 in the Yangtze River Basin (China) and impacts on vegetation dynamics. Theor. Appl. Climatol. 2019, 136, 675–692. [Google Scholar] [CrossRef]
- Felton, A.J.; Zavislan-Pullaro, S.; Smith, M.D. Semiarid ecosystem sensitivity to precipitation extremes: Weak evidence for vegetation constraints. Ecology 2019, 100, e02572. [Google Scholar] [CrossRef]
- Tan, Z.; Tao, H.; Jiang, J.; Zhang, Q. Influences of Climate Extremes on NDVI (Normalized Difference Vegetation Index) in the Poyang Lake Basin, China. Wetlands 2015, 35, 1033–1042. [Google Scholar] [CrossRef]
- Pei, F.; Zhou, Y.; Xia, Y. Assessing the Impacts of Extreme Precipitation Change on Vegetation Activity. Agriculture 2021, 11, 487. [Google Scholar] [CrossRef]
- Norby, R.J.; DeLucia, E.H.; Gielen, B.; Calfapietra, C.; Giardina, C.P.; King, J.S.; Ledford, J.; McCarthy, H.R.; Moore, D.J.P.; Ceulemans, R.; et al. Forest response to elevated CO2 is conserved across a broad range of productivity. Proc. Natl. Acad. Sci. USA 2005, 102, 18052–18056. [Google Scholar] [CrossRef] [Green Version]
- Magnani, F.; Mencuccini, M.; Borghetti, M.; Berbigier, P.; Berninger, F.; Delzon, S.; Grelle, A.; Hari, P.; Jarvis, P.G.; Kolari, P.; et al. The human footprint in the carbon cycle of temperate and boreal forests. Nature 2007, 447, 849–851. [Google Scholar] [CrossRef]
- Woodward, F.I.; Kelly, C.K. Responses of global plant diversity capacity to changes in carbon dioxide concentration and climate. Ecol. Lett. 2008, 11, 1229–1237. [Google Scholar] [CrossRef] [PubMed]
- Piao, S.; Ciais, P.; Friedlingstein, P.; de Noblet-Ducoudré, N.; Cadule, P.; Viovy, N.; Wang, T. Spatiotemporal patterns of terrestrial carbon cycle during the 20th century. Glob. Biogeochem. Cycles 2009, 23, GB4026. [Google Scholar] [CrossRef]
- Ciais, P.; Reichstein, M.; Viovy, N.; Granier, A.; Ogée, J.; Allard, V.; Aubinet, M.; Buchmann, N.; Bernhofer, C.; Carrara, A.; et al. Europe-wide reduction in primary productivity caused by the heat and drought in 2003. Nature 2005, 437, 529–533. [Google Scholar] [CrossRef] [PubMed]
- Yuan, F.; Liu, J.; Zuo, Y.; Guo, Z.; Wang, N.; Song, C.; Wang, Z.; Sun, L.; Guo, Y.; Song, Y.; et al. Rising vegetation activity dominates growing water use efficiency in the Asian permafrost region from 1900 to 2100. Sci. Total Environ. 2020, 736, 139587. [Google Scholar] [CrossRef] [PubMed]
- De Jong, R.; Verbesselt, J.; Schaepman, M.E.; de Bruin, S. Trend changes in global greening and browning: Contribution of short-term trends to longer-term change. Glob. Chang. Biol. 2012, 18, 642–655. [Google Scholar] [CrossRef]
- Goetz, S.J.; Bunn, A.G.; Fiske, G.J.; Houghton, R.A. Satellite-observed photosynthetic trends across boreal North America associated with climate and fire disturbance. Proc. Natl. Acad. Sci. USA 2005, 102, 13521–13525. [Google Scholar] [CrossRef] [PubMed] [Green Version]
- Zhang, Q.; Zeng, J.; Yue, P.; Zhang, L.; Wang, S.; Wang, R. On the land-atmosphere interaction in the summer monsoon transition zone in East Asia. Theor. Appl. Climatol. 2020, 141, 1165–1180. [Google Scholar] [CrossRef]
- Burke, I.C.; Lauenroth, W.K.; Parton, W.J. Regional and Temporal Variation in Net Primary Production and Nitrogen Mineralization in Grasslands. Ecology 1997, 78, 1330–1340. [Google Scholar] [CrossRef]
- Zhou, T.-J.; Yu, R.-C. Atmospheric water vapor transport associated with typical anomalous summer rainfall patterns in China. J. Geophys. Res. Atmos. 2005, 110, D08104. [Google Scholar] [CrossRef] [Green Version]
- He, C.; Zhou, T.; Lin, A.; Wu, B.; Gu, D.; Li, C.; Zheng, B. Enhanced or Weakened Western North Pacific Subtropical High under Global Warming? Sci. Rep. 2015, 5, 16771. [Google Scholar] [CrossRef] [Green Version]
- Hui, Y.; Shuqing, S. Longitudinal displacement of the subtropical high in the western Pacific in summer and its influence. Adv. Atmos. Sci. 2003, 20, 921–933. [Google Scholar] [CrossRef]
- Rasmusson, E. Atmospheric water vapor transport and the water balance of North America: Part I. Characteristics of the water vapor flux field. Mon. Weather Rev. 1967, 95, 403–426. [Google Scholar] [CrossRef]
- Williams, I.N.; Torn, M.S.; Riley, W.J.; Wehner, M.F. Impacts of climate extremes on gross primary production under global warming. Environ. Res. Lett. 2014, 9, 094011. [Google Scholar] [CrossRef] [Green Version]
- Betts, R.A.; Alfieri, L.; Bradshaw, C.; Caesar, J.; Feyen, L.; Friedlingstein, P.; Gohar, L.; Koutroulis, A.; Lewis, K.; Morfopoulos, C.; et al. Changes in climate extremes, fresh water availability and vulnerability to food insecurity projected at 1.5 degrees C and 2 degrees C global warming with a higher-resolution global climate model. Philos. Trans. R. Soc. A Math. Phys. Eng. Sci. 2018, 376, 20160452. [Google Scholar] [CrossRef]
- Casanueva, A.; Rodríguez-Puebla, C.; Frías, M.D.; González-Reviriego, N. Variability of extreme precipitation over Europe and its relationships with teleconnection patterns. Hydrol. Earth Syst. Sci. 2014, 18, 709–725. [Google Scholar] [CrossRef] [Green Version]
- Zhu, B.; Xie, X.; Meng, S.; Lu, C.; Yao, Y. Sensitivity of soil moisture to precipitation and temperature over China: Present state and future projection. Sci. Total Environ. 2020, 705, 135774. [Google Scholar] [CrossRef]
- Rui, S.; Chen, S.; Su, H. Climate Dynamics of the Spatiotemporal Changes of Vegetation NDVI in Northern China from 1982 to 2015. Remote Sens. 2021, 13, 187. [Google Scholar] [CrossRef]
- Liu, Y.; Tian, J.; Liu, R.; Ding, L. Influences of Climate Change and Human Activities on NDVI Changes in China. Remote Sens. 2021, 13, 4326. [Google Scholar] [CrossRef]
- Zhao, W.; Hu, Z.; Guo, Q.; Wu, G.; Chen, R.; Li, S. Contributions of climatic factors to inter-annual variability of vegetation index in northern China grasslands. J. Clim. 2019, 33, 175–183. [Google Scholar] [CrossRef]
- Xiao, J.; Moody, A. Geographical distribution of global greening trends and their climatic correlates: 1982–1998. Int. J. Remote Sens. 2005, 26, 2371–2390. [Google Scholar] [CrossRef]
- Wang, L.; Hu, F.; Miao, Y.; Zhang, C.; Zhang, L.; Luo, M. Changes in Vegetation Dynamics and Relations with Extreme Climate on Multiple Time Scales in Guangxi, China. Remote Sens. 2022, 14, 2013. [Google Scholar] [CrossRef]
- Fang, J.; Piao, S.; Zhou, L.; He, J.; Wei, F.; Myneni, R.B.; Tucker, C.J.; Tan, K. Precipitation patterns alter growth of temperate vegetation. Geophys. Res. Lett. 2005, 32, L21411. [Google Scholar] [CrossRef] [Green Version]
- Cai, D.; Ge, Q.; Wang, X.; Liu, B.; Goudie, A.; Hu, S. Contributions of ecological programs to vegetation restoration in arid and semiarid China. Environ. Res. Lett. 2020, 15, 114046. [Google Scholar] [CrossRef]


Publisher’s Note: MDPI stays neutral with regard to jurisdictional claims in published maps and institutional affiliations. |
© 2022 by the authors. Licensee MDPI, Basel, Switzerland. This article is an open access article distributed under the terms and conditions of the Creative Commons Attribution (CC BY) license (https://creativecommons.org/licenses/by/4.0/).