Article

Linkage of Strong Intraseasonal Events of the East Asian Winter Monsoon to the Tropical Convections over the Western Pacific

1
Center for Monsoon System Research, Institute of Atmospheric Physics, Chinese Academy of Sciences, Beijing 100029, China
2
College of Earth and Planetary Sciences, University of the Chinese Academy of Sciences, Beijing 100049, China
3
Guangzhou Meteorological Observatory, Guangzhou 511430, China
4
Department of Marine Meteorology, College of Oceanic and Atmospheric Sciences, Ocean University of China, Qingdao 266100, China
5
CAS Key Laboratory of Regional Climate-Environment for Temperate East Asia, Institute of Atmospheric Physics, Chinese Academy of Sciences, Beijing 100029, China
*
Author to whom correspondence should be addressed.
Remote Sens. 2022, 14(13), 2993; https://doi.org/10.3390/rs14132993
Submission received: 18 May 2022 / Revised: 18 June 2022 / Accepted: 20 June 2022 / Published: 22 June 2022

Abstract

:
The East Asian winter monsoon (EAWM) is the most important climate system for transporting Arctic cold air to the tropics in boreal winter. Rapid intensification of the EAWM, such as a cold surge, can lead to increased tropical convection over the western Pacific, but the possible effects from the intraseasonal variation of EAWM is unclear. Using high temporal and spatial resolution satellite data, including Outgoing Longwave Radiation (OLR) and Tropical Rainfall Measuring Mission (TRMM) precipitation, we show that strong intraseasonal EAWM events are associated with increased tropical convection over the western Pacific for about 6–8 days. Our statistical analysis shows that the lifetime of a strong intraseasonal EAWM event is about 2 weeks, with the beginning, peak, and ending phases occurring at days −6, 0, and 6, respectively. During days 0 to 8, increased convection is observed over the western tropical Pacific, due to the anomalous convergence associated with the strengthened northerly winds over the South China Sea. Over land, increased precipitation is observed over Vietnam, northwestern Kalimantan, and the southern Philippines. In addition, the East Asian local Hadley circulation is strengthened during these days, in association with the enhanced tropical convection.

1. Introduction

The East Asian winter monsoon (EAWM), which refers to the near-surface northerly flow along East Asia, is the primary channel for air mass and energy exchange between the Arctic and tropical regions in boreal winters [1,2,3,4,5]. The EAWM carries cold air from Siberia to low latitudes and even across the equator. Anomalous activities of EAWM, such as cold surges, often cause increased convective activities over the western tropical Pacific (denoted as WTP) e.g., [6,7]. It is well known that the heat source over the WTP plays a critical role in the global and regional atmospheric circulation processes, e.g., [8,9]. Recent studies also reported that the EAWM-related heat source over the WTP may lead to downstream wave train propagation, which in turn impacts temperatures in North America [10,11]. Thus, it is important to understand the role of EAWM in tropical convection.
Most previous studies on the relationship between EAWM and tropical convection have focused on synoptic time scales, such as cold surges or cold air outbreaks (about 2–8 days). Early pilot studies by Chang et al. [12,13] revealed the extratropical–tropical interaction processes associated with the cold surges: immediately after the cold surge, the convection in the equatorial South China Sea intensifies, which further strengthens the local East Asian Hadley circulation and the two (Indian and Pacific Ocean) Walker circulations. Most of the cold surges last less than 4 days, and a few can persist more than 5 days [14,15,16]. Cold air outbreak events can be classified into three categories according to their propagation characteristics, two of which reach low latitudes (less than 30°N) that can significantly enhance the rainfall in the equatorial South China Sea [15]. There are also studies which reported that cold surges can interact with the Madden–Julian Oscillation and thereby enhance the convection over the WTP [17,18].
The EAWM circulation system also exhibits significant intraseasonal variability [19,20,21,22], although the effects of intraseasonal variations in EAWM on tropical convections have not been well analyzed. Compared to the synoptic variations, intraseasonal variations usually have a greater and more persistent impact on the weather and climate. For example, associated with a weakened EAWM, two extreme cold events successively hit East Asia during the period of late December 2020 to mid-January 2021, causing record-breaking cold surface air temperatures and heavy snowstorms over broad areas [23,24]; the severe haze over the North China Plain during November–December 2015 is associated with the persistent weakening of EAWM during that period [25]. Previous studies have indicated that boreal winter intraseasonal variability over East Asia displays obvious peaks below a 30-day time period [19,26,27]. In particular, the 9–29-day variations represent the main component (80%) of its total intraseasonal signal [19]. However, relatively few studies have explored the effects of EAWM on tropical convections over the WTP on this time scale.
Variations in the intensity and spatial distribution of tropical convection, especially over the open oceans, are monitored by satellites. Outgoing Longwave Radiation (OLR) is a measure of the amount of energy emitted from the earth into space, and is an important proxy for tropical and subtropical convection, since the cloud’s top temperature is an indicator of cloud height (colder is higher) (https://climatedataguide.ucar.edu/climate-data/outgoing-longwave-radiation-olr-avhrr, accessed on 4 May 2022). The tropical rainfall measuring mission (TRMM [28]) is an international joint space mission to monitor and study precipitation in the tropics and subtropics (https://climatedataguide.ucar.edu/climate-data/trmm-tropical-rainfall-measuring-mission, accessed on 4 May 2022). The high temporal and spatial resolution OLR and TRMM provide much needed information that help us to investigate the intraseasonal variations in tropical convection associated with mid-latitude disturbances.
The present study aims to investigate the possible impacts of intraseasonal variations of EAWM on tropical convection over the WTP using OLR and TRMM data. The rest of the paper is organized as follows. Section 2 describes the data, definitions, and methods. Section 3 first presents the characteristics of intraseasonal variation in EAWM, then investigates the associated changes in tropical convective activities over the WTP. Conclusions and discussions are provided in Section 4.

2. Data and Methods

2.1. Data

The National Centers for Environmental Prediction/National Center for Atmospheric Research (NCEP/NCAR) reanalysis [29] daily data are used in this study to analyze the variations in atmospheric circulations. The NCEP/NCAR reanalysis has a horizontal resolution of 2.5° × 2.5°, 17 vertical levels from 1000 to 10 hPa, and covers the period of 1949–present. OLR data from NCAR archives, with gaps filled with temporal and spatial interpolation [30], is used as a proxy to describe the variations in tropical convection. This interpolated OLR has a spatial resolution of 2.5° × 2.5° and temporal coverage of 1974/06–present. We also use the TRMM precipitation [28] to investigate the changes in tropical rainfall. The spatial resolution of this TRMM precipitation is 0.25° × 0.25°; the spatial coverage is 50°S–50°N; and the temporal coverage is 1998–2019. Since the TRMM precipitation has a limitation on the temporal coverage, we also used the Climate Prediction Center (CPC) global daily precipitation [31]. This CPC precipitation data covers the period 1979–present and has a 0.5° × 0.5°grid spatial resolution over global land.

2.2. Methods

This study focuses on the 9–29-day time scale, which is the dominant part of the EAWM intraseasonal variations, as will be shown in Section 3.1. Winter refers to the months from November to March (NDJFM), which is also known as the extended winter. The 9–29 day signal is obtained by a 9 day running mean minus a 29 day running mean [20].
To suppress possible effects from El Niño and La Niña, which are suggested to interact with the intraseasonal oscillation over the western North Pacific [32], only neutral El Niño–South Oscillation (ENSO) winters are considered in this study. Here, a neutral ENSO winter refers to the absence of both El Niño and La Niña events. Based on the CPC, an El Niño (a La Niña) event is identified when the Oceanic Niño index, which is the 3-month running mean of ERSSTv5 [33] SST anomalies in the Niño 3.4 region (5°S–5°N, 120°–170°W) based on centered 30-year base periods, is greater than 0.5 (less than 0.5) for at least 5 consecutive overlapping seasons. According to the above criteria, the CPC provides a list of El Niño, La Niña, and neutral periods on their website (https://origin.cpc.ncep.noaa.gov/products/analysis_monitoring/ensostuff/ONI_v5.php, accessed on 17 May 2022). The list shows that there are 14 neutral ENSO winters during the period 1979–2021; they are 1981, 1982, 1986, 1990, 1991, 1993, 1994, 1997, 2002, 2004, 2013, 2014, 2017, and 2020 (1981 refers to the NDJFM 1980/81, and so on).
Composite analysis is used to obtain the evolutionary characteristics of intraseasonal variations in the EAWM and associated tropical convection anomalies. The bootstrapping method [34] is employed to estimate the statistical confidence level, and resampling (with replacements) is performed 1000 times in this study.

2.3. Identification of Strong Intraseasonal EAWM Events

According to Chen et al. (2000) [2], the EAWM index is defined as the area-averaged near-surface (1000 hPa) meridional wind anomaly in the two regions (25°–40°N, 120°–140°E and 10°–25°N, 110°–130°E, red boxes in Figure 1a). A negative (positive) index indicates anomalous northerly (southerly) winds and thus a stronger (weaker) EAWM.
A strong intraseasonal EAWM event is identified when the 9–29-day bandpass EAWM index reaches a minimum that is less than −1 standard deviation (std). Specifically, we first rank the EAWM index in descending order to find the strongest EAWM day, then this day is marked as day 0 of a strong EAWM event. Once a day 0 is identified, the consecutive days from −10 to 10 cannot be defined as other events. Repeat this procedure until the EAWM indexes for the remaining dates are larger than −1 std. Thus, we identify 52 strong intraseasonal EAWM events during the 14 neutral ENSO winters (Table A1).

3. Results

3.1. Characteristics of the Intraseasonal Variation of the EAWM

We begin by showing the climatological distribution and variations of the EAWM during the 14 neutral ENSO winters. Figure 1a,b show the mean state and variance of the 1000 hPa meridional wind (denoted as V), respectively. Strong northerly 1000 hPa V with relatively large variance occurs along the East Asian coastal regions. Spectra of the EAWM index display peaks at synoptic and intraseasonal time scales (Figure 1c). Particularly, the 9–29-day time scale of 1000 hPa V accounts for 70–80% of its total intraseasonal variance (Figure 1d, the average in the red boxes is 75%), consistence with [19]. The variance of the 9–29-day 1000 hPa V exhibits relatively large values along the East Asian coastal regions (Figure 1e). In the South China Sea area, the percent of 9–29-day 1000 hPa V reaches 20–30% of its total variance (Figure 1f). The above analyses suggest that the 9–29-day band of EAWM not only accounts for a significant portion of the total variance, but also represents the major component of the intraseasonal signal. As such, this study concentrates on 9–29-day intraseasonal variations of EAWM.
Then, we examine the characteristics of the strong intraseasonal EAWM events identified in Section 2.3. Composite anomalies for the peak day of (day 0) the strong EAWM events show a typical strengthened EAWM circulation system (Figure 2a–c). Figure 2a shows positive surface level pressure (SLP) anomalies over eastern Eurasia, indicating an enhanced and southeastward-shifted Siberian high. Negative SLP anomalies and cyclonic circulation anomalies appear east of Japan, contributing to northerly wind anomalies along the East Asian coast. In the mid troposphere, negative geopotential height anomalies occur over Japan, which indicate a deepened East Asian trough (Figure 2b). In the upper troposphere, positive and negative zonal wind anomalies occur north and south of the westerly jet stream core near Japan, respectively (Figure 2c). This indicate that the East Asian jet stream is strengthened and slightly shifted southward at day 0 of the strong EAWM events.
Figure 2d shows the temporal evolutions of the composite indexes for the components of the EAWM system during the strong intraseasonal EAWM events. We can see that the EAWM index has negative values during days −6 to 6 and reaches a minimum at day 0. The variation in the East Asian trough intensity index [35] is basically synchronized with the EAWM index. The variation in the Siberian High intensity index [36] is about 3 days ahead of the EAWM index, while the East Asian jet stream intensity index [37] lags the EAWM index by about 1–2 days. The above evidence suggests that the strong intraseasonal EAWM events are accompanied by an intensified Siberian High, deepened East Asian trough, and strengthened East Asian jet stream; they are about 3 days ahead, almost synchronized, and 1–2-days lagging the changes in EAWM, respectively.
The temporal evolutions of the above indexes indicate that a typical life time for a strong intraseasonal EAWM event is about two weeks, consistent with results in previous studies [27]. According to the evolution of the EAWM index, we identify that the beginning, peak, and ending phases of the strong intraseasonal EAWM events occur at about day −6, 0, and 6, respectively. In the following analysis, we will investigate the changes in tropical convection over the western Pacific during the lifetime of the strong intraseasonal EAWM events.

3.2. Possible Effects of Intraseasonal EAWM Variations on Tropical Convection

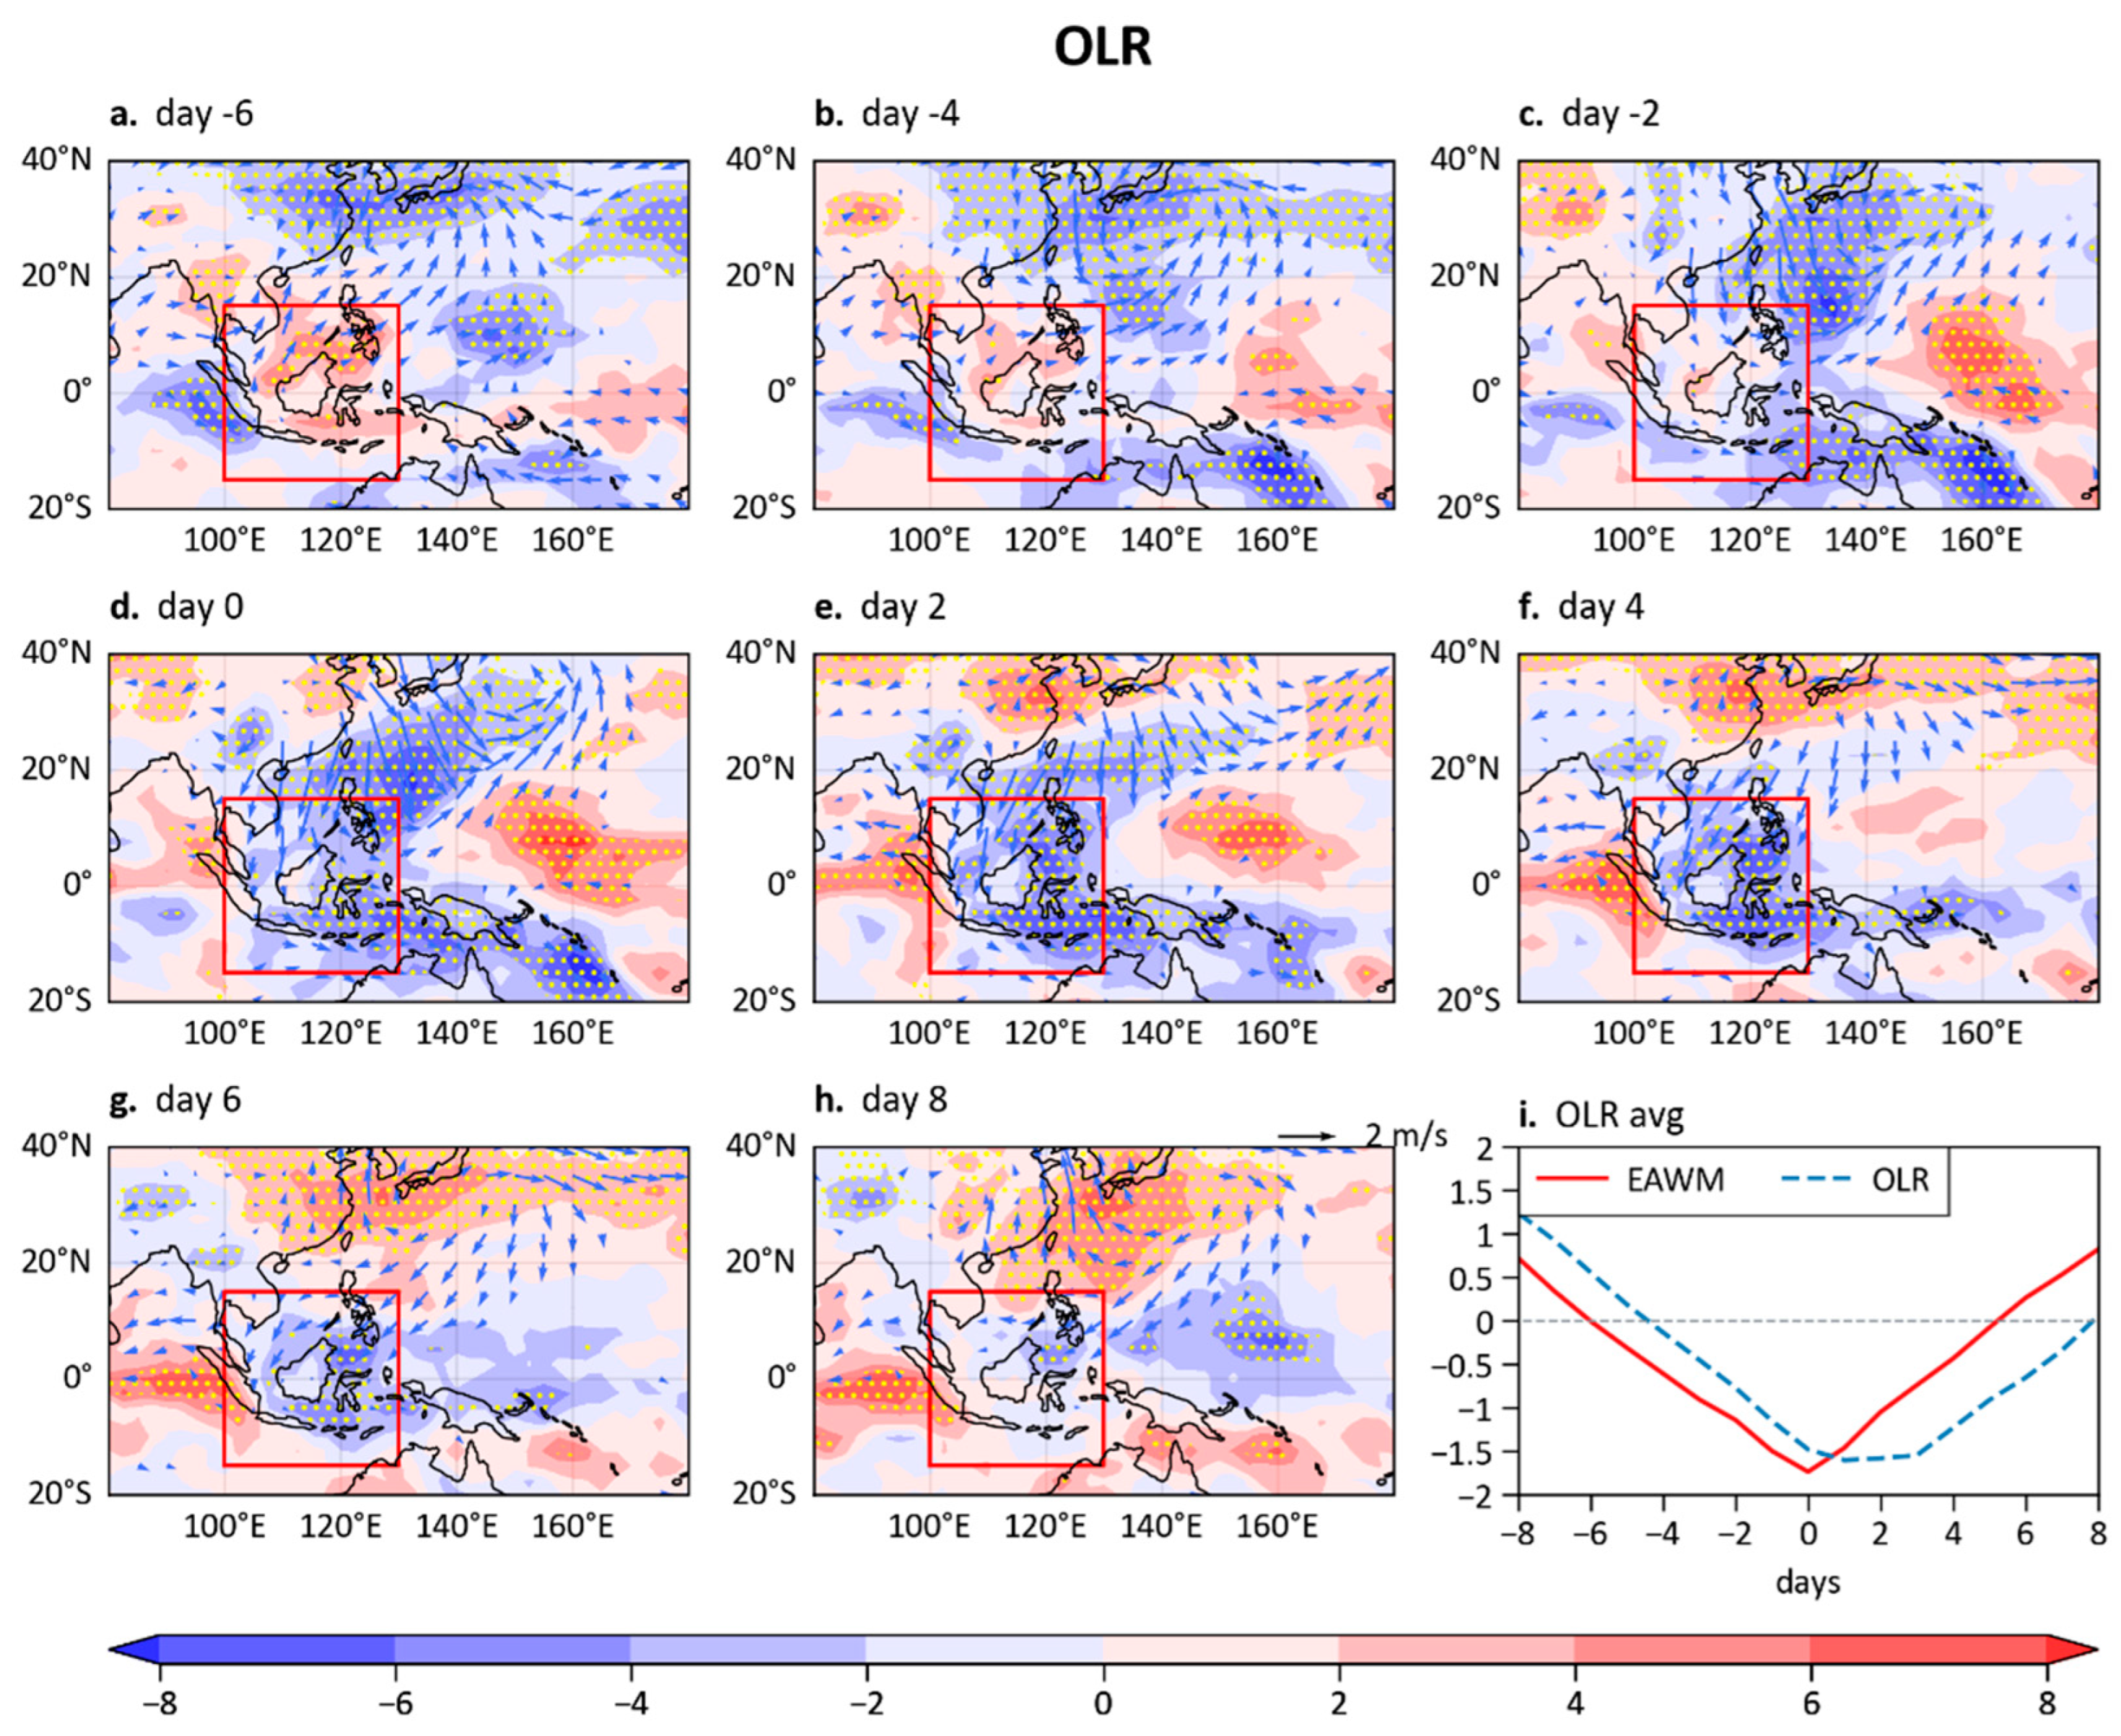
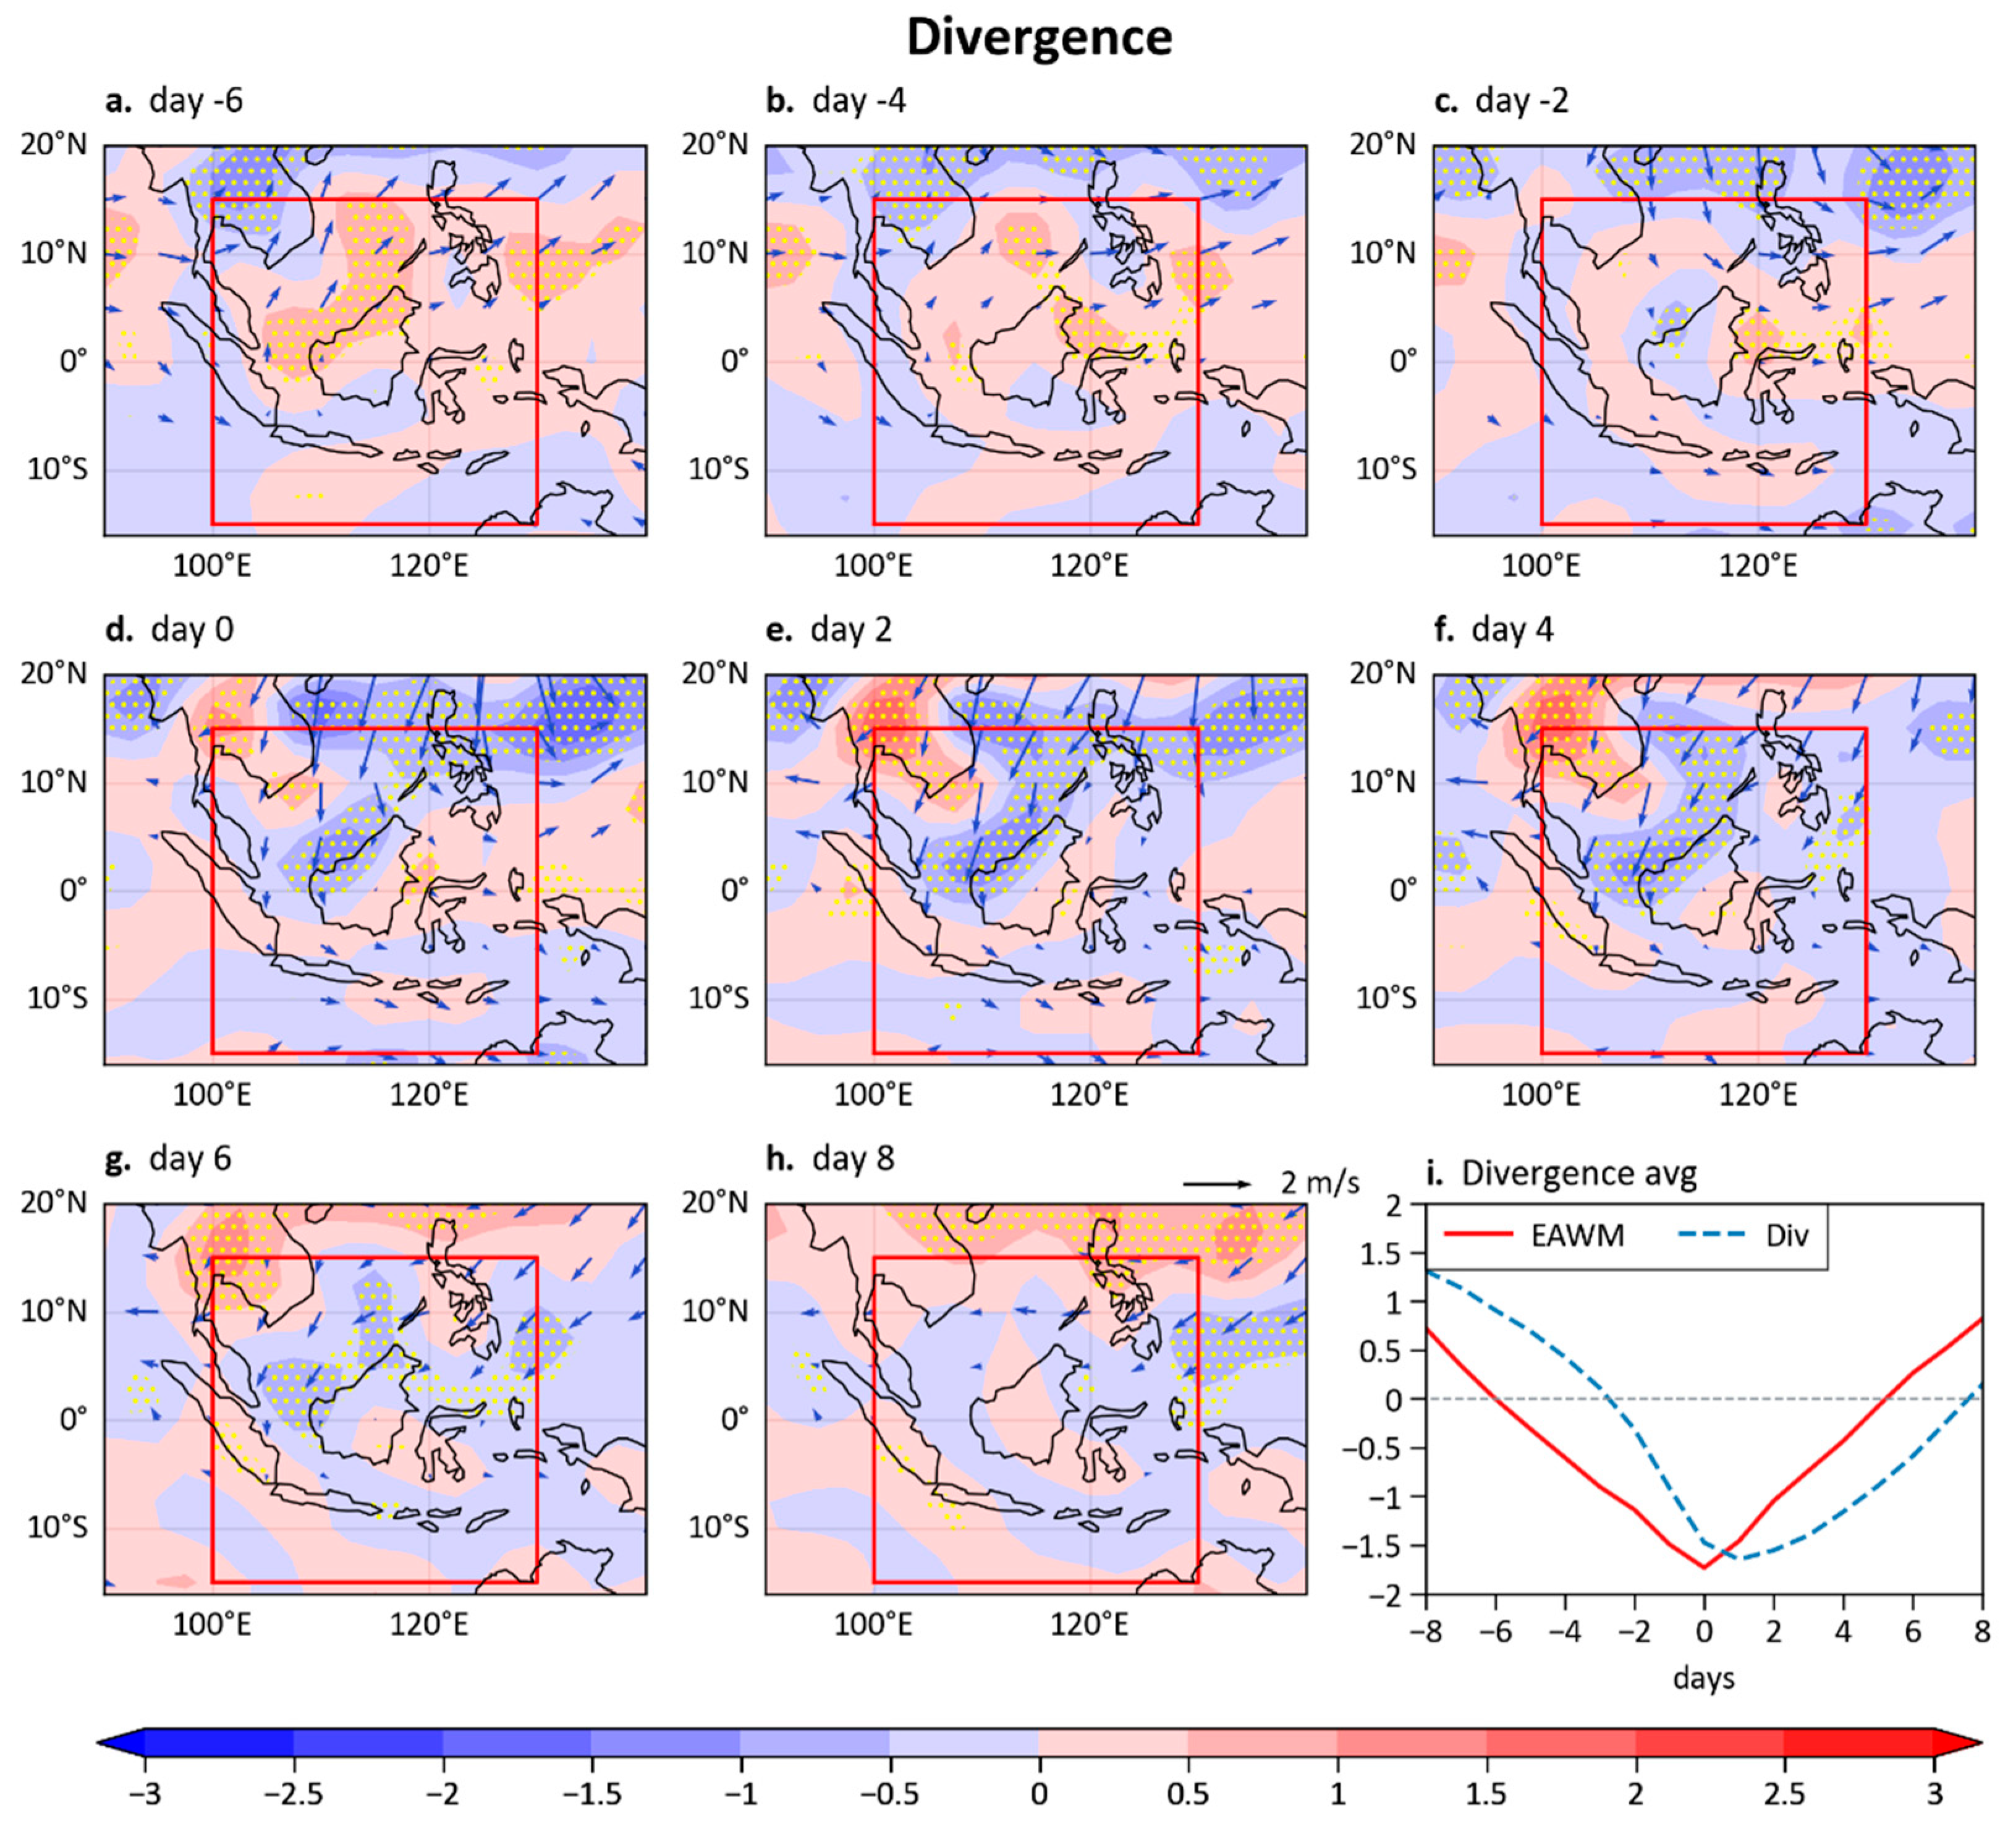
Figure 3 and Figure 4 show composite anomalies of OLR and 1000 hPa winds and the corresponding divergence for the strong intraseasonal EAWM events. We observe evident changes in OLR over the mid-latitudes of East Asia and the WTP regions during different stages of the strong EAWM events (Figure 3). During days −6 to 0, northerly wind anomalies first emerge near eastern China, and then gradually strengthen and progress southeastward to the WTP. Particularly, the northerly wind anomalies reach the northern South China Sea at day −2 and cover most of the South China Sea region at day 0. Associated with the intrusion of northerly anomalies, anomalous convergence appears over the WTP (Figure 4). This feature can be attributed to the combined effects of conservation of planetary vorticity and deflection of the terrain [6]. The convergence anomalies lead to an enhancement of the tropical convection over the WTP region (negative OLR anomalies, Figure 3). Moreover, the northerly wind anomalies and associated convergence over the WTP persisted for ~6 days after the peak day, resulting in enhanced tropical convection there for about 6 days.
Figure 3i shows the evolution of area-averaged OLR anomalies over the WTP region (15°S–15°N, 100°–130°E) during the strong EAWM events. We can see that the temporal variation in the WTP-averaged OLR captures the above-mentioned OLR variations during the strong EAWM events well. During the beginning stage, the WTP-averaged OLR lags the EAWM index for about 2 days. This feature is related to the fact that the northerly wind anomaly from the mid-latitudes takes several times to travel to the tropics. The WTP-averaged OLR reaches a minimum immediately after the peak of the EAWM, and this minimum lasts for about 3 days. Then, the OLR anomaly gradually decays and turns to positive values after day 8. The above results suggest that the strong intraseasonal EAWM events can lead to increased tropical convection over the WTP for about 6–8 days after the peak day.
Figure 5 compares the distributions of the area-averaged OLR anomaly for days 0–2 of the strong EAWM events (blue) and for the whole period (red). The WTP-averaged OLR anomaly during the 0–2 days of EAWM is obviously shifted towards negative values compared to the whole period (Figure 5a). On average, the strong EAWM events decrease the OLR over the WTP region by 2.64 W m−2. This value corresponds to 0.38 times the standard deviation of the area-averaged OLR. Similar is the case (−2.20 W m−2) for the South China Sea.
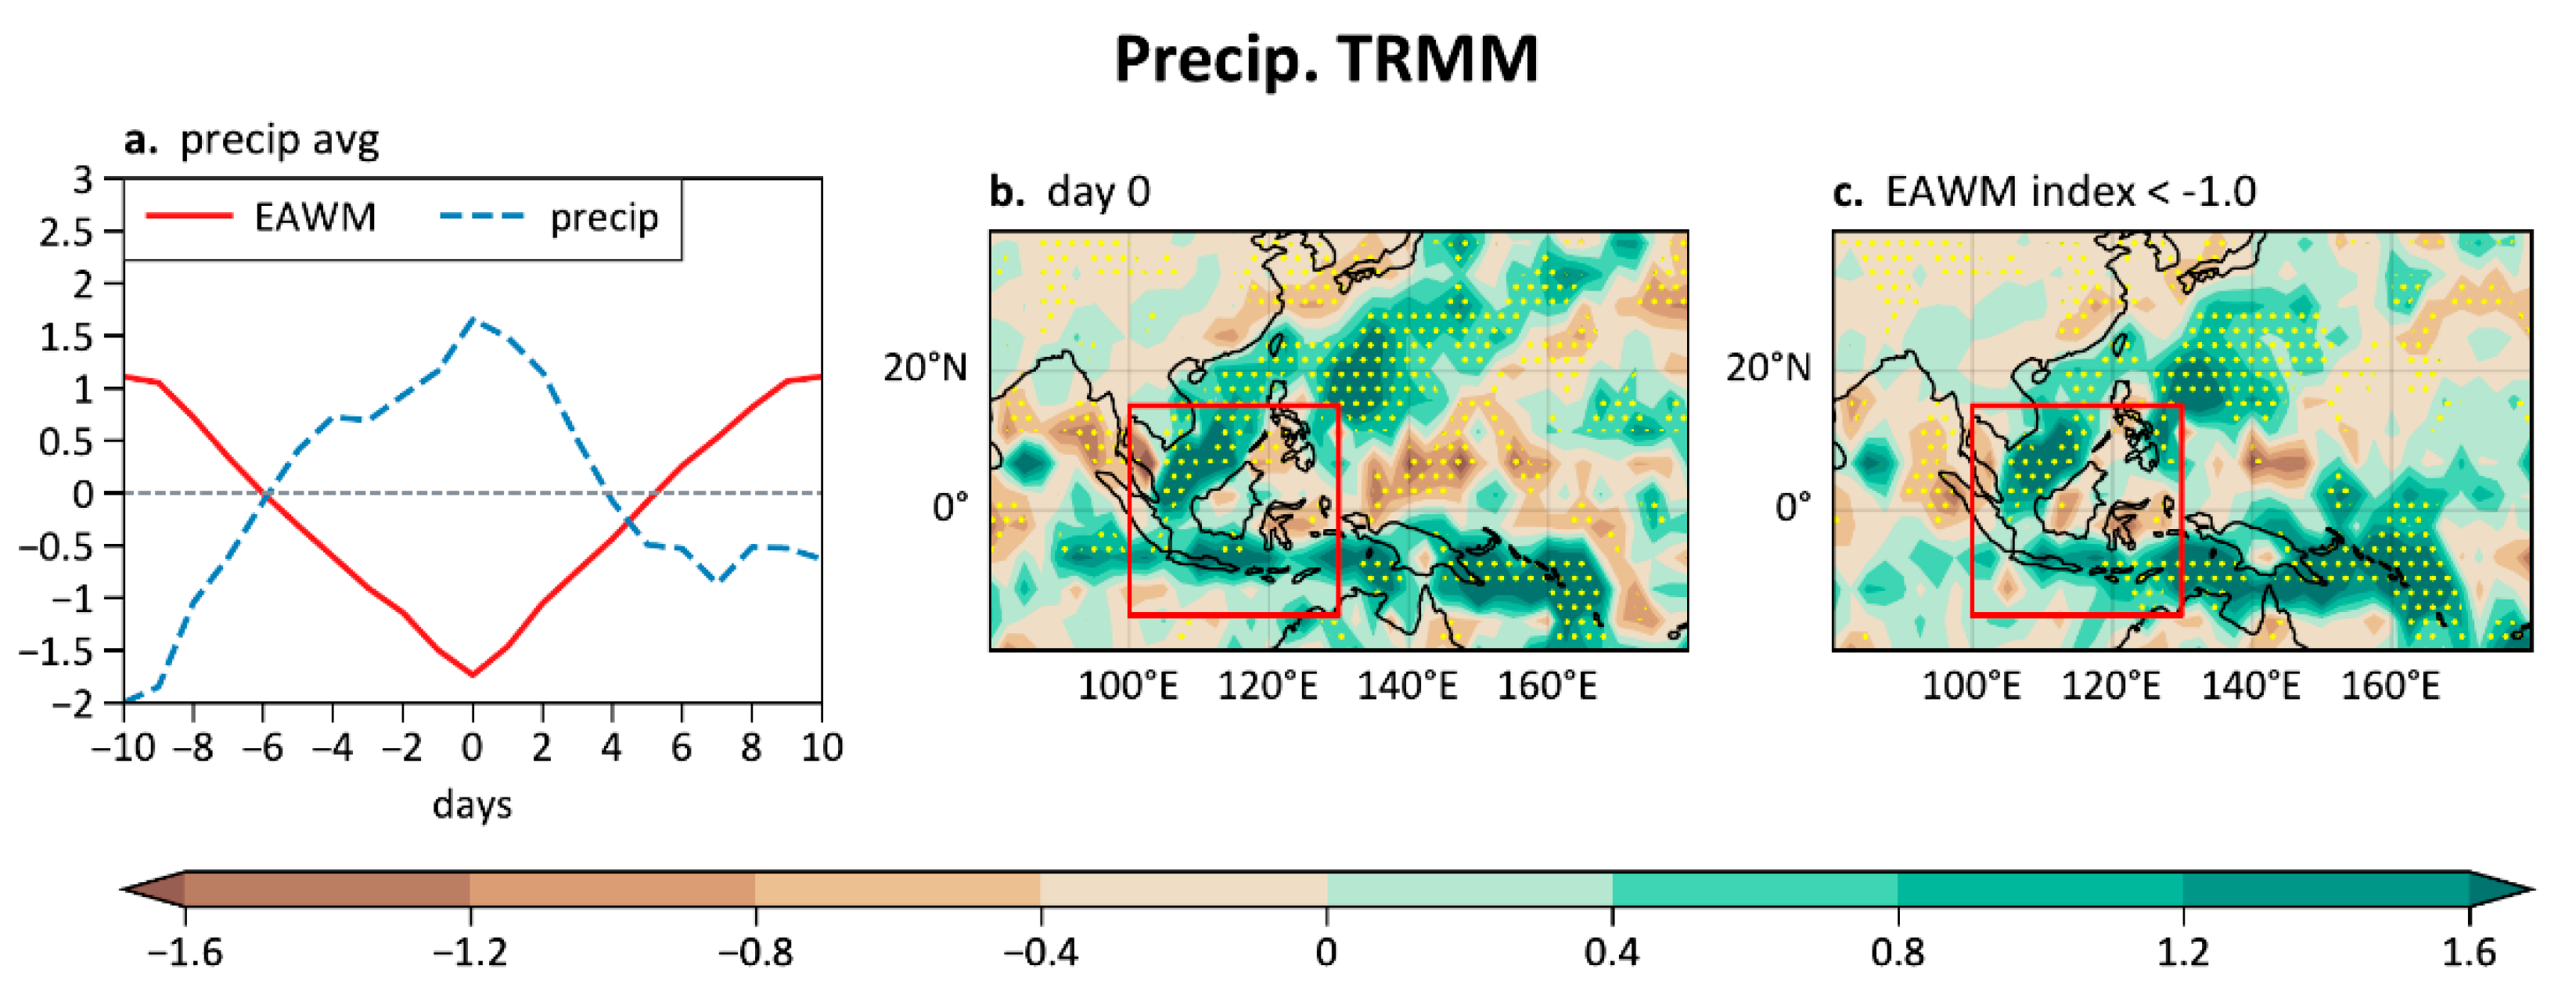
We also examined the tropical precipitation anomalies observed by TRMM during the strong intraseasonal EAWM events. It should be noted that this TRMM precipitation covers a shorter period (1998–2019) than other data, and there are 17 strong EAWM events within the temporal coverage of TRMM. Figure 6a shows the evolution of WTP-averaged precipitation anomalies during the strong EAWM events. The WTP-averaged precipitation increases as the EAWM strengthens from day −6 to day 0, and then decreases as the EAWM weakens in the following days. Figure 6b shows the spatial distribution of precipitation anomalies at day 0 of the strong EAWM events. Increased precipitation anomalies occur over the southern South China Sea and Java, due to anomalous convergence there (Figure 4f). At the same time, decreased precipitation anomalies appear in the eastern China−southern Japan region, consistent with the results in [38]. Since there are only 17 “day 0” samples in Figure 6b, we add Figure 6c to further confirm the effect of EAWM perturbations on tropical rainfall anomalies. Figure 6c shows composite anomalies for all days when the EAWM index < −1 std (111 samples, Table 1). We can see that Figure 6b,c are almost identical, confirming that a stronger than normal EAWM tends to be associated with increased rainfall in the WTP region.
Given that the sample size of strong EAWM events is relatively small within the temporal coverage of TRMM, we further examine the precipitation anomalies for all days when the EAWM index exceeds the 1.5, 1, and 0.5 std thresholds. Table 1 shows the statistical results. There are 48, 111, and 228 days corresponding to an EAWM index less than −1.5, −1, and −0.5 std, respectively. The average precipitation anomalies for these days in the WTP are 0.89, 0.42, and 0.41 mm day−1, respectively. These values correspond to 0.8, 0.38, and 0.37 times the standard deviation of the area-averaged precipitation anomalies. Similar is the case for the South China Sea. In sum, the above analysis suggests that strong intraseasonal EAWM events tend to cause increased precipitation over the WTP region.
Topographic features of the Maritime Continent have strong influences on the distribution of the tropical deep convective activities [6,39]. In addition to that, the TRMM precipitation radar algorithm likely underestimates precipitation over land [28]. Thus, to further check the effects of intraseasonal variation of EAWM on land precipitation over the western Maritime Continent, we show the high-resolution gauge-based CPC precipitation anomalies during the strong EAWM events in Figure 7. During days −6 to −2, the northerly wind anomaly has not reached the South China Sea, where it remains covered by southerly wind and divergent anomalies (Figure 4). These southerly and divergent anomalies contribute to reduced rainfall over the surrounding landmass such as in Vietnam and Philippine. During days 0–6, increased precipitation anomalies are observed in the Vietnam, northwestern Kalimantan, and southern Philippines, due to the interaction of winds and local topography. Figure 7i further shows that the area-mean precipitation anomalies over Southeast Asia, the Philippines, and Kalimantan can persist for about 6–8 days after the peak of EAWM. The results obtained by CPC precipitation and OLR consistently indicate that the tropical convective activities over the WTP are enhanced for about 6–8 days following the peak of EAWM.
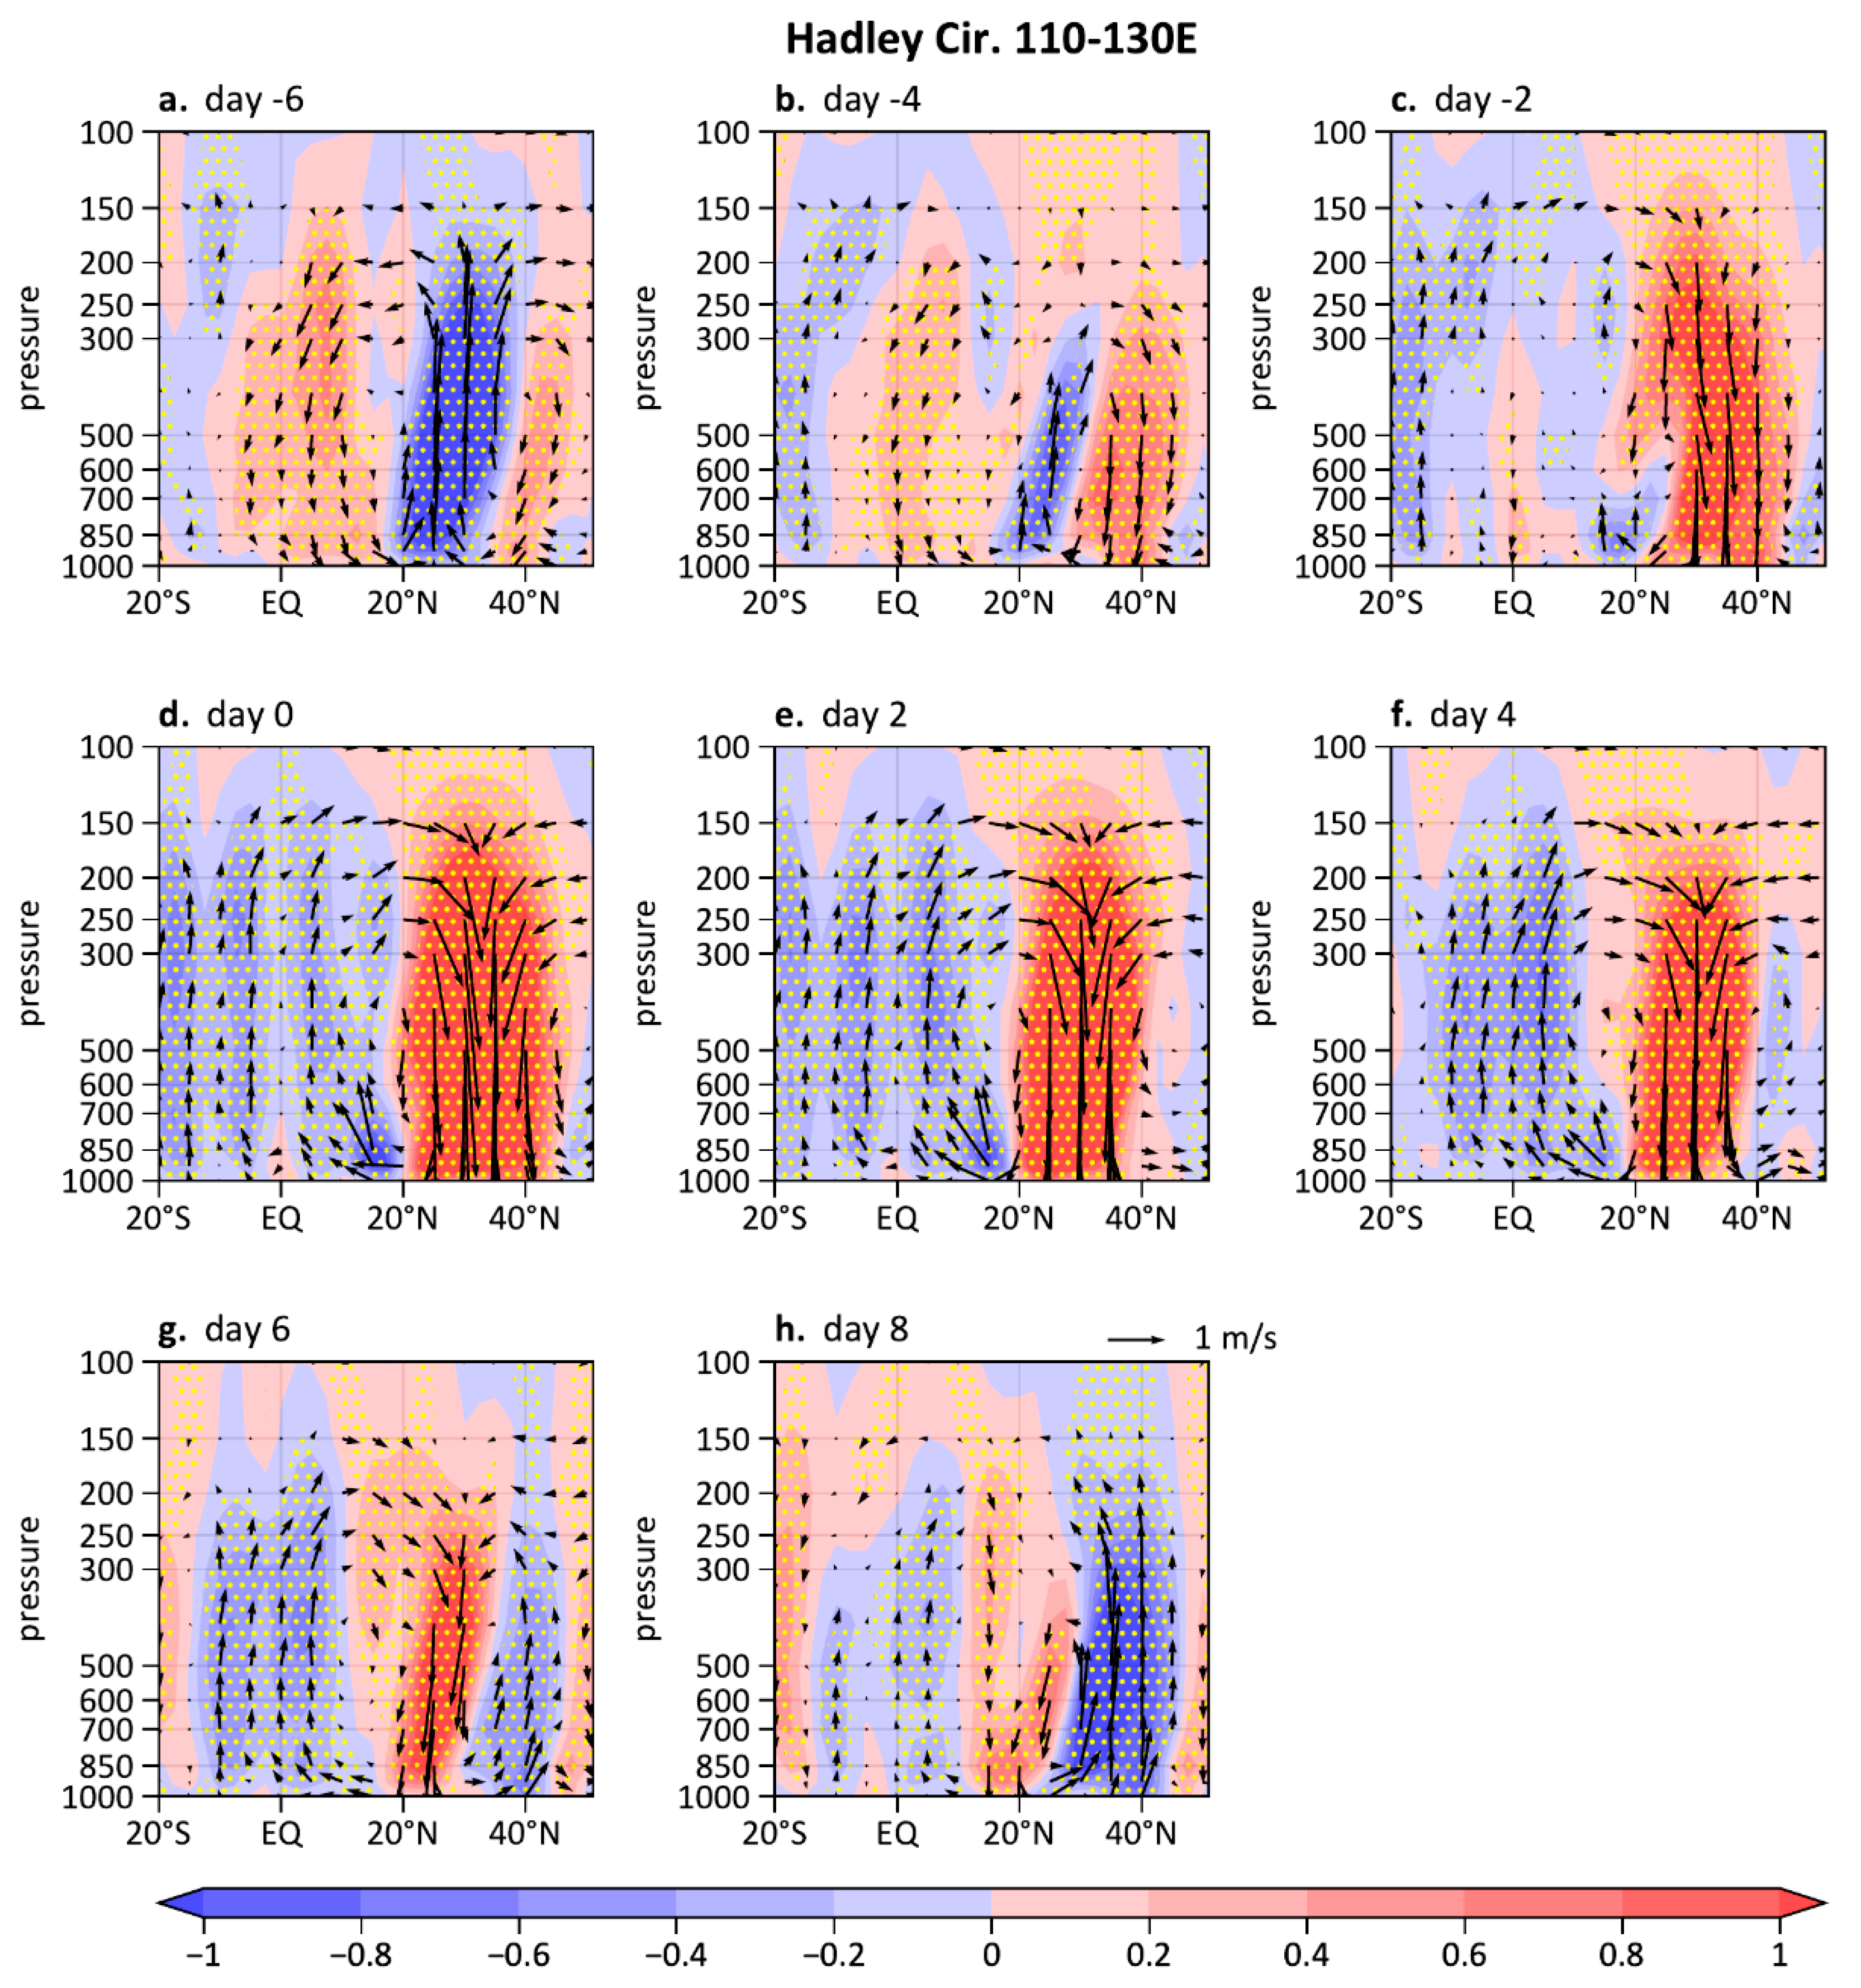
The East Asian local Hadley circulation is a part of the thermal-driven meridional Hadley cell along the East Asian region, with an ascending branch over the WTP and descending branch in the subtropics. The WTP is an area with the warmest sea surface temperature (known as the Pacific Warm Pool) and the most active convection. Due to the latent heat released by the convective activity, the air over the WTP becomes warm, rises, and flows poleward in both hemispheres, with the Northern Hemispheric branch sinking in the subtropical East Asia. The air then flows back to the tropics, thus generating the East Asian local Hadley circulation [40,41,42]. Figure 8 presents the composite anomalies of East Asian local Hadley cells along 110°–130°E during the strong EAWM events. We can see that the East Asian local Hadley circulation is enhanced during days 0–6 of the strong EAWM events. The strengthening of the East Asian local Hadley circulation can be attributed to the increased convection over the WTP during days 0–6 associated with the strong EAWM events (Figure 3d–h). The anomalous diabatic heating released from the increased convection tends to warm the air over the WTP, and thus contributes to anomalous ascending motion there. This anomalous ascending motion may further strengthen the local East Asian Hadley circulation. Regarding the response time of the local Hadley circulation, our results are consistent with previous studies. For example, using winter Monsoon Experiment (winter MONEX) twice-daily data, Chang and Lau [12] have shown that immediately after a cold surge (<1 day), the convection over the equatorial South China Sea intensifies, which causes a strengthening of the East Asian local Hadley circulation. In addition, Chan et al. [43] reported that the local Hadley cell over East Asia plays a dominant role in the intensity variation of the East Asian jet stream. The enhanced East Asian local Hadley cell may potentially contribute to the strengthening of the East Asian jet stream during days 0–6 of the strong EAWM events (Figure 2d). The above results suggest that strong intraseasonal EAWM events tend to cause strengthened East Asian local Hadley circulation during the 6 days following its peak.

4. Conclusions

The present study investigates the possible influence of the intraseasonal variation in EAWM on the tropical convection over the western Pacific. Satellite data such as OLR and TRMM precipitation are used to estimate the variations in tropical convection. In this study, we first identify the characteristics of the intraseasonal EAWM variations, then examine the associated impacts on the tropical convection over the WTP. Our main results are summarized below:
(1) Spectrum analysis of the EAWM index showed that it has peaks on both synoptic and intraseasonal time scales. In particular, the 9–29-day variation of the low-level (1000 hPa) northerly monsoon winds along the East Asian coast constitutes the major part (80%) of its intraseasonal variation. We identify 52 strong intraseasonal EAWM events in the 14 neutral ENSO winters during 1979–2021. These strong intraseasonal EAWM events have a typical lifetime of about 2 weeks. The beginning, peak, and ending phases occur approximately at day −6, 0, and 6, respectively. During the strong EAWM events, there are systematic changes in the atmospheric circulation over the mid-latitude East Asia: the Siberian High intensifies first and reaches a maximum around day −3, then the East Asian trough deepens and the low-level northerly wind strengthens, with both peaking at day 0; after that, the East Asian jet strengthens and reaches a peak around day 1–2.
(2) The strong intraseasonal EAWM events tend to lead to enhanced tropical convection over the WTP region for about 6–8 days immediately after the peak day of these EAWM events. During days −6 to −2 of the strong EAWM events, northerly wind anomalies first appear over eastern China and gradually progress southward. From day −2 on, the northerly wind anomalies reach the South China Sea–Philippine Sea region. At day 0, the northerly wind anomalies prevail over most regions of the South China Sea. The northerly anomalies lead to anomalous convergence over the WTP region, and the convergence further enhances the tropical convective activities there. In the following 6–8 days, the northerly wind and convergence anomalies persist over the WTP region, and continuously contribute to increased tropical convection there. Quantitative analysis shows that the area-averaged precipitation anomalies over the WTP region are 0.89, 0.42, and 0.41 mm per day−1 for days when the EAWM index is less than −1.5, −1, and 0.5 std, respectively. Over the landmass surrounding the South China Sea, increased rainfall is observed over Vietnam, northwestern Kalimantan Island, and southern Philippines during days 0–8 of the strong EAWM events. In addition, the East Asian local Hadley circulation is enhanced during these days, which may be attributed to increased convections over the WTP and decreased convections over mid-latitude East Asia.

5. Discussions

Despite recent progress in understanding the effects of EAWM on tropical convection over the WTP [11,14,39], it remains unknown how the response of tropical convection to EAWM will change under global warming. Hu et al. [44] suggested that under global warming, even if the ENSO’s SST amplitude remains unchanged, the responses of tropical Pacific rainfall and humidity to ENSO are amplified. These amplified responses are primarily due to the Clausius–Clapeyron relationship, i.e., saturation water vapor pressure increases exponentially with temperature, and thus the vapor response is larger under a warmer state. Their study sheds some light on the above issue, that is, if the amplitude of EAWM perturbation remains unchanged under global warming, the response of tropical rainfall may be amplified.

Author Contributions

Conceptualization, W.C. and T.M.; Methodology, T.M. and H.G.; Software, T.M. and P.H.; Formal analysis, T.M., P.H., Y.J., L.W. and X.A.; Supervision, W.C.; Writing—original draft preparation, T.M.; Writing—review and editing, T.M.; All authors have read and agreed to the published version of the manuscript.

Funding

This work was supported jointly by the National Natural Science Foundation of China (Grants 42005032 and 41961144016) and the China Postdoctoral Science Foundation (Grant 2020M670417).

Data Availability Statement

The NCEP/NCAR reanalysis: https://psl.noaa.gov/data/gridded/data.ncep.reanalysis.derived.html, accessed on 4 May 2022; The NOAA interpolated OLR: https://psl.noaa.gov/data/gridded/data.interp_OLR.html, accessed on 4 May 2022; The TRMM precipitation: https://disc.gsfc.nasa.gov/datasets, accessed on 4 May 2022; The CPC global precipitation: https://psl.noaa.gov/data/gridded/data.cpc.globalprecip.html, accessed on 4 May 2022. The CPC ENSO events list: https://origin.cpc.ncep.noaa.gov/products/analysis_monitoring/ensostuff/ONI_v5.php, accessed on 4 May 2022.

Conflicts of Interest

The authors declare no conflict of interest.

Appendix A

Table A1. The list of dates for day 0 of the strong intraseasonal EAWM events.
NumberDay Month YearNumberDay Month YearNumberDay Month Year
113 January 19811911 January 19913729 November 2003
223 February 19812020 February 19913811 February 2004
37 November 19812113 March 1991395 March 2004
416 December 19812229 November 1992407 December 2012
516 January 19822329 January 19934112 February 2013
613 February 19822416 March 19934224 December 2013
728 March 19822520 November 19934318 January 2014
816 December 19852624 December 19934412 February 2014
98 January 19862722 January 1994459 March 2014
107 February 19862828 February 1994465 November 2016
1128 February 19862915 November 19964726 November 2016
1221 March 1986309 January 19974827 December 2016
1317 November 19893118 February 19974910 February 2017
1411 December 19893220 March 1997505 December 2019
152 January 19903321 November 2001512 February 2020
1623 January 19903429 December 20015214 March 2020
173 March 19903515 February 2002
1830 November 1990367 March 2002

References

  1. Staff members of Academia Sinica. On the general circulation over Eastern Asia (I). Tellus 1957, 9, 432–446. [Google Scholar]
  2. Chen, W.; Graf, H.F.; Huang, R.H. The interannual variability of East Asian winter monsoon and its relation to the summer monsoon. Adv. Atmos. Sci. 2000, 17, 48–60. [Google Scholar]
  3. Zhang, Y.; Sperber, K.R.; Boyle, J.S. Climatology and interannual variation of the East Asian winter monsoon: Results from the 1979-95 NCEP/NCAR reanalysis. Mon. Weather Rev. 1997, 125, 2605–2619. [Google Scholar] [CrossRef]
  4. Ding, Y.; Krishnamurti, T.N. Heat-Budget of the Siberian High and the Winter Monsoon. Mon. Weather Rev. 1987, 115, 2428–2449. [Google Scholar] [CrossRef] [Green Version]
  5. Yu, Y.; Cai, M.; Shi, C.; Ren, R. On the Linkage among Strong Stratospheric Mass Circulation, Stratospheric Sudden Warming, and Cold Weather Events. Mon. Weather Rev. 2018, 146, 2717–2739. [Google Scholar] [CrossRef]
  6. Chang, C.P.; Harr, P.A.; Chen, H.J. Synoptic disturbances over the equatorial South China Sea and western Maritime Continent during boreal winter. Mon. Weather Rev. 2005, 133, 489–503. [Google Scholar] [CrossRef]
  7. Wang, L.; Chen, W. How well do existing indices measure the strength of the East Asian winter monsoon? Adv. Atmos. Sci. 2010, 27, 855–870. [Google Scholar] [CrossRef]
  8. Li, T.; Wang, B.; Wu, B.; Zhou, T.; Chang, C.-P.; Zhang, R. Theories on Formation of an Anomalous Anticyclone in Western North Pacific during El Nino: A Review. J. Meteorol. Res. 2017, 31, 987–1006. [Google Scholar] [CrossRef]
  9. Zhang, R.; Sumi, A.; Kimoto, M. Impact of El Nino on the East Asian monsoon: A diagnostic study of the ‘86/87 and ‘91/92 events. J. Meteorol. Soc. Jpn. 1996, 74, 49–62. [Google Scholar] [CrossRef] [Green Version]
  10. Ma, T.; Chen, W.; Nath, D.; Graf, H.-F.; Wang, L.; Huangfu, J. East Asian Winter Monsoon Impacts the ENSO-related Teleconnections and North American Seasonal Air Temperature Prediction. Sci. Rep. 2018, 8, 6547. [Google Scholar] [CrossRef] [Green Version]
  11. Ma, T.; Chen, W. Climate variability of the East Asian winter monsoon and associated extratropical–tropical interaction: A review. Ann. N. Y. Acad. Sci. 2021, 1504, 44–62. [Google Scholar] [CrossRef] [PubMed]
  12. Chang, C.P.; Lau, K.M.W. Northeasterly cold surges and near-equatorial disturbances over the winter MONEX area during December 1974. Part II: Planetary-scale aspects. Mon. Weather Rev. 1980, 108, 298–312. [Google Scholar] [CrossRef] [Green Version]
  13. Chang, C.P.; Erickson, J.E.; Lau, K.M. Northeasterly cold surges and near-equatorial disturbances over the winter MONEX area during December 1974. Part I: Synoptic Aspects. Mon. Weather Rev. 1979, 107, 812–829. [Google Scholar] [CrossRef] [Green Version]
  14. Pang, B.; Lu, R.; Ren, R. Influence of Siberian Blocking on Long-Lived Cold Surges over the South China Sea. J. Clim. 2020, 33, 6945–6956. [Google Scholar] [CrossRef]
  15. Liu, Q.; Chen, G.; Wang, L.; Kanno, Y.; Iwasaki, T. Southward Cold Airmass Flux Associated with the East Asian Winter Monsoon: Diversity and Impacts. J. Clim. 2021, 34, 3239–3254. [Google Scholar] [CrossRef]
  16. Feng, J.; Lian, T.; Ding, Y.; Li, X.; Sun, C.; Chen, D. Two Types of the East Asian Cold Surge and Their Impacts on El Nino. Geophys. Res. Lett. 2022, 49, e2021GL096108. [Google Scholar] [CrossRef]
  17. Wang, L.; Kodera, K.; Chen, W. Observed triggering of tropical convection by a cold surge: Implications for MJO initiation. Q. J. R. Meteorol. Soc. 2012, 138, 1740–1750. [Google Scholar] [CrossRef]
  18. Pang, B.; Lu, R.; Ling, J. Impact of cold surges on the Madden-Julian oscillation propagation over the Maritime Continent. Atmos. Sci. Lett. 2018, 19, e854. [Google Scholar] [CrossRef]
  19. Jiao, Y.; Wu, R.; Song, L. Individual and Combined Impacts of Two Eurasian Wave Trains on Intraseasonal East Asian Winter Monsoon Variability. J. Geophys. Res. Atmos. 2019, 124, 4530–4548. [Google Scholar] [CrossRef]
  20. Wu, R. Coupled intraseasonal variations in the East Asian winter monsoon and the South China Sea-western North Pacific SST in boreal winter. Clim. Dyn. 2016, 47, 2039–2057. [Google Scholar] [CrossRef]
  21. Takaya, K.; Nakamura, H. Mechanisms of intraseasonal amplification of the cold Siberian high. J. Atmos. Sci. 2005, 62, 4423–4440. [Google Scholar] [CrossRef]
  22. Yang, S.; Li, T. Intraseasonal variability of air temperature over the mid-high latitude Eurasia in boreal winter. Clim. Dyn. 2016, 47, 2155–2175. [Google Scholar] [CrossRef]
  23. Zhang, X.D.; Fu, Y.F.; Han, Z.; Overland, J.E.; Rinke, A.; Tang, H.; Vihma, T.; Wang, M.Y. Extreme Cold Events from East Asia to North America in Winter 2020/21: Comparisons, Causes, and Future Implications. Adv. Atmos. Sci. 2022, 39, 553–565. [Google Scholar] [CrossRef]
  24. Zheng, F.; Yuan, Y.; Ding, Y.; Li, K.; Fang, X.; Zhao, Y.; Sun, Y.; Zhu, J.; Ke, Z.; Wang, J.; et al. The 2020/21 Extremely Cold Winter in China Influenced by the Synergistic Effect of La Niña and Warm Arctic. Adv. Atmos. Sci. 2021, 39, 546–552. [Google Scholar] [CrossRef]
  25. An, X.; Sheng, L.; Liu, Q.; Li, C.; Gao, Y.; Li, J. The combined effect of two westerly jet waveguides on heavy haze in the North China Plain in November and December 2015. Atmos. Chem. Phys. 2020, 20, 4667–4680. [Google Scholar] [CrossRef] [Green Version]
  26. Yao, S.X.; Sun, Q.F.; Huang, Q.; Chu, P. The 10–30-day intraseasonal variation of the East Asian winter monsoon: The temperature mode. Dyn. Atmos. Ocean. 2016, 75, 91–101. [Google Scholar] [CrossRef] [Green Version]
  27. Song, L.; Wang, L.; Chen, W.; Zhang, Y. Intraseasonal Variation of the Strength of the East Asian Trough and Its Climatic Impacts in Boreal Winter. J. Clim. 2016, 29, 2557–2577. [Google Scholar] [CrossRef]
  28. Huffman, G.J.; Bolvin, D.T.; Nelkin, E.J.; Wolff, D.B.; Adler, R.F.; Gu, G.; Hong, Y.; Bowman, K.P.; Stocker, E.F. The TRMM Multisatellite Precipitation Analysis (TMPA): Quasi-Global, Multiyear, Combined-Sensor Precipitation Estimates at Fine Scales. J. Hydrometeorol. 2007, 8, 38–55. [Google Scholar] [CrossRef]
  29. Kalnay, E.; Kanamitsu, M.; Kistler, R.; Collins, W.; Deaven, D.; Gandin, L.; Iredell, M.; Saha, S.; White, G.; Woollen, J.; et al. The NCEP/NCAR 40-Year Reanalysis Project. Bull. Am. Meteorol. Soc. 1996, 77, 437–472. [Google Scholar] [CrossRef] [Green Version]
  30. Liebmann, B.; Smith, C.A. Description of a complete (interpolated) outgoing longwave radiation dataset. Bull. Am. Meteorol. Soc. 1996, 77, 1275–1277. [Google Scholar]
  31. Xie, P.; Yatagai, A.; Chen, M.; Hayasaka, T.; Fukushima, Y.; Liu, C.; Yang, S. A Gauge-based analysis of daily precipitation over East Asia. J. Hydrometeorol. 2007, 8, 607–626. [Google Scholar] [CrossRef]
  32. Zhang, R.H.; Li, T.R.; Wen, M.; Liu, L.K. Role of intraseasonal oscillation in asymmetric impacts of El Nino and La Nina on the rainfall over southern China in boreal winter. Clim. Dyn. 2015, 45, 559–567. [Google Scholar] [CrossRef]
  33. Huang, B.; Thorne, P.W.; Banzon, V.F.; Boyer, T.; Chepurin, G.; Lawrimore, J.H.; Menne, M.J.; Smith, T.M.; Vose, R.S.; Zhang, H.-M. Extended Reconstructed Sea Surface Temperature, Version 5 (ERSSTv5): Upgrades, Validations, and Intercomparisons. J. Clim. 2017, 30, 8179–8205. [Google Scholar] [CrossRef]
  34. Mudelsee, M. Climate Time Series Analysis: Classical Statistical and Bootstrap Methods, 2nd ed.; Springer: Cham, Switzerland; Heidelberg, Germany; New York, NY, USA; Dordrecht, The Netherlands; London, UK, 2014. [Google Scholar]
  35. Sun, B.; Li, C. Relationship between the disturbances of East Asian trough and tropical convective activities in boreal winter. Chin. Sci. Bull. 1997, 42, 500–504. [Google Scholar]
  36. Gong, D.Y.; Wang, S.W.; Zhu, J.H. East Asian winter monsoon and Arctic Oscillation. Geophys. Res. Lett. 2001, 28, 2073–2076. [Google Scholar] [CrossRef]
  37. Yang, S.; Lau, K.M.; Kim, K.M. Variations of the East Asian jet stream and Asian-Pacific-American winter climate anomalies. J. Clim. 2002, 15, 306–325. [Google Scholar] [CrossRef]
  38. Jiao, Y.; Wu, R. Propagation and influence on tropical precipitation of intraseasonal variation over mid-latitude East Asia in boreal winter. Atmos. Ocean. Sci. Lett. 2019, 12, 155–161. [Google Scholar] [CrossRef] [Green Version]
  39. Chang, C.-P.; Li, T.; Yang, S. Seasonal Prediction of Boreal Winter Rainfall over the Western Maritime Continent during ENSO. J. Meteorol. Res. 2020, 34, 294–303. [Google Scholar] [CrossRef]
  40. Huang, R.; Chen, S.; Chen, W.; Hu, P. Interannual Variability of Regional Hadley Circulation Intensity Over Western Pacific During Boreal Winter and Its Climatic Impact Over Asia-Australia Region. J. Geophys. Res. Atmos. 2018, 123, 344–366. [Google Scholar] [CrossRef]
  41. Oort, A.H.; Yienger, J.J. Observed interannual variability in the Hadley circulation and its connection to ENSO. J. Clim. 1996, 9, 2751–2767. [Google Scholar] [CrossRef] [Green Version]
  42. Bjerknes, J. A possible response of the atmospheric Hadley circulation to equatorial anomalies of ocean temperature. Tellus 1966, 18, 820–829. [Google Scholar] [CrossRef] [Green Version]
  43. Chan, D.; Zhang, Y.; Wu, Q.; Dai, X. Quantifying the dynamics of the interannual variabilities of the wintertime East Asian Jet Core. Clim. Dyn. 2020, 54, 2447–2463. [Google Scholar] [CrossRef] [Green Version]
  44. Hu, K.; Huang, G.; Huang, P.; Kosaka, Y.; Xie, S.-P. Intensification of El Nino-induced atmospheric anomalies under greenhouse warming. Nat. Geosci. 2021, 14, 377–382. [Google Scholar] [CrossRef]
Figure 1. (a) Climatological-mean 1000 hPa meridional wind (denoted as V; color shading, m s−1) during NDJFM, vectors indicate the horizontal winds (m s−1); (b) variance of the 1000 hPa V (color, m2 s−2); (c) power spectrum (solid line) of the EAWM index. The two dashed lines denote the power spectrum for red noise at a significance level of 0.95 (upper) and 0.9 (lower); (d) ratios of the variance of 1000 hPa V: 9–29-day time scale to intraseasonal (9–61-day) time scale; (e) variance of the 1000 hPa V on 9–29-day time scale; (f) ratios of the variance of 1000 hPa V: 9–29-day time scale to total. Red boxes in (a,b,d,e) indicate the regions of (25°–40°N, 120°–140°E) and (10°–25°N, 110°–130°E), in which the mean of 1000 hPa V anomaly is defined as the EAWM index.
Remotesensing 14 02993 g001
Figure 2. Composite anomalies of (a) surface level pressure (SLP, hPa) and 1000 hPa wind (m s−1); (b) 500 hPa geopotential height (gpm); and (c) 200 hPa zonal wind (m s−1) for day 0 of the strong EAWM events. Stripping in (ac) indicates the anomaly values exceed the 95% confidence level. (d) Evolutions of the composite EAWM index (red line, denoted as EAWM), Siberian High index (blue dashed line, denoted as SH), East Asian trough index (green dashed line, denoted as Trough), and East Asian jet stream index (purple dotted line, denoted as Jet) during the strong intraseasonal EAWM events.
Remotesensing 14 02993 g002
Figure 3. (ah) Composite anomalies of 1000 hPa winds (vector, m s−1) and OLR (color, W m−2) at days −6 to 8 with an interval of 2 days during the strong EAWM events. Stripping regions indicate the OLR anomalies exceed the 95% confidence level. Only meridional or zonal wind anomalies that exceed the 90% confidence level are plotted. (i) Temporal evolutions of the composite EAWM index and area-averaged OLR anomaly (normalized) in the WTP region of (15°S–15°N, 100°–130°E, red box) during the strong EAWM events.
Remotesensing 14 02993 g003
Figure 4. (ah) Composite anomalies of 1000 hPa divergence (color, 10−6 s−1) and winds (vector, m s−1) at days −6 to 8 with an interval of 2 days during the strong EAWM events. Stripping regions indicate the divergence anomalies exceed the 95% confidence level. Only meridional or zonal wind anomalies that exceed the 90% confidence level are plotted. (i) Temporal evolutions of the composite EAWM index and area-averaged 1000 hPa divergence anomaly (normalized) in the WTP region of (15°S–15°N, 100°–130°E, red box) during the strong EAWM events.
Remotesensing 14 02993 g004
Figure 5. Distributions of the area-averaged OLR anomaly for days 0–2 of the strong EAWM events (blue) and for the whole period (red). (a) For the region of WTP (15°S–15°N, 100°–130°E, red box in Figure 3); (b) for the region of South China Sea (0°–20°N, 100°–120°E, denoted as SCS). µ in (a,b) indicates the mean of the TWP-averaged and SCS-averaged OLR anomalies during days 0–2 of the strong EAWM events, respectively. Double asterisk (**) indicate the anomalies exceed the 95% confidence level.
Remotesensing 14 02993 g005
Figure 6. (a) Temporal evolutions of the composite EAWM index and area-averaged TRMM precipitation anomaly (normalized) in the WTP region (15°S–15°N, 100°–130°E, shown as red box in b) during the strong EAWM events. (b) Composite anomalies of TRMM precipitation for day 0 of the strong EAWM events. It should be noted that there are 17 strong EAWM events, that is, 17 “day 0” samples, within the temporal coverage of TRMM (1998–2019). (c) Composite anomalies of TRMM precipitation for days when the EAWM index is less than –1 std. It should be noted that there are 111 days which meet the above criteria. Stripping regions in b and c indicate that the precipitation anomalies exceed the 95% confidence level.
Remotesensing 14 02993 g006
Figure 7. (ah) Composite anomalies of CPC precipitation over land (mm day−1) at days −6 to 8 with an interval of 2 days during the strong EAWM events. (i) Composite of area-mean landmass precipitation anomalies for Vietnam (10°–15°N, 105°–110°E), Kalimantan Island (5°S–8°N, 109°–119°E), and the Philippines (5°–18°N, 120°–130°E). Stripping regions in (ah) indicate the precipitation anomalies exceed the 95% confidence level.
Remotesensing 14 02993 g007
Figure 8. (ah) Composite anomalies of vertical p-velocity (color shading, 0.01 Pa s−1) and divergent meridional wind (m s−1) along 110°–130°E at days −6 to 8 and with an interval of 2-days during the strong EAWM events. Stripping regions indicate the p-velocity anomalies exceed the 95% confidence level.
Remotesensing 14 02993 g008
Table 1. Area-averaged precipitation anomaly (mm day−1) related to the intraseasonal variation of the EAWM.
AreaEAWM Index < –1.5 std (48) 1, –1 std (111) 1, –0.5 std (228) 1 EAWM Index > 1.5 std (63) 1, 1 std (112) 1, 0.5 std (213) 1
Western Tropical Pacific
(15°S–15°N, 100°–130°E)
0.89, 0.42, 0.41−0.91, −0.51, −0.43
South China Sea
(0°–20°N, 100°–120°E)
0.72, 0.47, 0.38−0.62, −0.4, −0.39
1 Numbers in the bracket indicate the sample sizes.
Publisher’s Note: MDPI stays neutral with regard to jurisdictional claims in published maps and institutional affiliations.