Article

Evaluating Effects of Medium-Resolution Optical Data Availability on Phenology-Based Rice Mapping in China

1
College of Land Science and Technology, China Agricultural University, Beijing 100193, China
2
Institute of Geographic Science and Natural Resources Research, Chinese Academy of Sciences, Beijing 100101, China
3
College of Geography and Environmental Science, Henan University, Kaifeng 475004, China
4
Department of Microbiology and Plant Biology, University of Oklahoma, Norman, OK 73019, USA
*
Author to whom correspondence should be addressed.
Remote Sens. 2022, 14(13), 3134; https://doi.org/10.3390/rs14133134
Submission received: 6 May 2022 / Revised: 15 June 2022 / Accepted: 24 June 2022 / Published: 29 June 2022

Abstract

:
The phenology-based approach has proven effective for paddy rice mapping due to the unique flooding and transplanting features of rice during the early growing season. However, the method may be greatly affected if no valid observations are available during the flooding and rice transplanting phase. Here, we compare the effects of data availability of different sensors in the critical phenology phase, thereby supporting paddy rice mapping based on phenology-based approaches. Importantly, our study further analyzed the effects of the spatial pattern of the valid observations related to certain factors (i.e., sideslips, clouds, and temporal window lengths of flooding and rice transplanting), which supply the applicable area of the phenology-based approach indications. We first determined the flooding and rice transplanting phase using in situ observational data from agrometeorological stations and remote sensing data, then evaluated the effects of data availability in this phase of 2020 in China using all Landsat-7 and 8 and Sentinel-2 data. The results show that on the country level, the number of average valid observations during the flooding and rice transplanting phase was more than ten for the integration of Landsat and Sentinel images. On the sub-country level, the number of average valid observations was high in the cold temperate zone (17.4 observations), while it was relatively lower in southern China (6.4 observations), especially in Yunnan–Guizhou Plateau, which only had three valid observations on average. Based on the multicollinearity test, the three factors are significantly correlated with the absence of valid observations: (R2 = 0.481) and Std.Coef. (Std. Err.) are 0.306 (0.094), −0.453 (0.003) and −0.547 (0.019), respectively. Overall, these results highlight the substantial spatial heterogeneity of valid observations in China, confirming the reliability of the integration of Landsat-7 and 8 and Sentinel-2 imagery for paddy rice mapping based on phenology-based approaches. This can pave the way for a national-scale effort of rice mapping in China while further indicating potential omission errors in certain cloud-prone regions without sufficient optical observation data, i.e., the Sichuan Basin.

Graphical Abstract

1. Introduction

As a major staple grain for more than a half of the global population, rice agriculture is critical for food security [1,2], water resource security [1,3,4], greenhouse gas (methane) emissions [2,5,6,7], and zoonotic infectious disease transmission [8,9]. In China, the role of rice is even more important, as the country is home to the largest rice planting area (29.9 million hectares, about 18% of the global rice planting area in 2019) and production in the world [10]. Rice consumption in China is the highest globally, and over 65% people eat rice as their staple food [11,12]. Thus, accurate information on the area and distribution of paddy rice in China is of significance for understanding food security and other environmental issues related to rice.
Great efforts have been made on paddy rice mapping in different regions [13,14,15,16,17,18,19]. The existing mapping strategies can generally be divided into two categories, first, machine learning approaches which using features from multiple aspects including spectral, spatial, texture, and temporal perspectives; and second, phenology-based approaches which use the unique phenological characteristics of the specific cultivation phases of rice. An increasing number of recent studies have tended to use phenology-based approaches for large scale paddy rice mapping, as it depends less on ground truth data [20]. Phenology-based rice mapping algorithms focus on a unique paddy rice phenological feature, namely, that rice fields are usually flooded prior to transplanting rice seedlings from a nursery into the fields [21,22,23]. The plant–water interaction of electromagnetic waves in visible light as well as in the microwave spectrum is affected, producing a unique signal of rice paddies when observed with optical remote sensing or weather-immune radar sensors [24,25]. Specifically, Land Surface Water Index (LSWI) values are temporarily greater than Normalized Difference Vegetation Index (NDVI) or Enhanced Vegetation Index (EVI) values during the flooding and rice transplanting phase up until the closed canopy phase [21]. However, there are uncertainties in this algorithm that prevent the acquisition of accurate transplanting signals, such as the setting of α (LSWI + α>EVI or NDVI), although finer-resolution images and the predefined temporal window have reduced these uncertainties in application studies [26,27].
Moderate Resolution Imaging Spectroradiometer (MODIS) data is an important source for rice mapping thanks to its hyper-temporal resolution (twice daily). Based on this approach using eight-day time series MODIS data, continental scale paddy rice area distribution has been depicted in China, South Asia, and Southeast Asia [28,29,30,31,32,33,34]. However, these MODIS-based paddy rice maps are affected by mixed pixel issues, especially in Asia, where smallholder-based fragmented fields dominate the agricultural landscape [35]. The freely available Landsat and Sentinel archives offer unprecedented opportunities to map these fragmented rice fields [36,37,38,39]. Profiting from these characteristics, new efforts have attempted retrospective continuous change detection and classification of paddy rice [27,40,41]. However, the existing efforts using 30-m medium resolution observations have mainly been conducted at local or regional scales. High frequency and cloud-free observations are important for monitoring crops [42,43]. However, the effects of satellite observations on national-scale rice mapping studies have not yet been investigated.
The current phenology-based paddy rice mapping approaches are mainly affected by data availability in the important phenology phases, e.g., flooding and rice transplanting. Only 10–15 valid global Landsat scenes are obtained on average per year, and the availability is worse in pluvial regions [44,45,46]. If good-quality observations are not available for identification of flooding and rice transplanting signals due to cloud, shadow, or other reasons [33,40], the resulting paddy rice maps may have a higher omission error. Moreover, the different overpass times of satellites and spatio-temporal differences in cloud coverage affect both the seasonal and inter-regional variability of optical data, leading to further varied performance on specific rice types (early, middle, or late rice). Therefore, revisitation cycles and cloud cover are the main limitations on the effective use of satellite data in agriculture [47]. While many studies have discussed cloud contamination in satellite imagery as the main barrier to phenology-based paddy rice mapping in cloud-prone regions, few of these studies have provided quantitative results on factors related to cloud cover and other issues with satellite image availability. Therefore, there is a need to assess the quality of satellite observations (e.g., Landsat, Sentinel) during the flooding and rice transplanting phase in different regions and its influence on phenology-based paddy rice mapping over large areas.
Here, we conducted a quantitative analysis of all available Landsat-7 and 8 and Sentinel-2 observations during the flooding and rice transplanting phase in China in 2020 in order to better understand the potential and applicability of phenology-based approaches. This study aims to answer three questions. (1) Can sufficient observations be captured in the flooding and rice transplanting phase by integrating Landsat-7 and 8 and Sentinel-2 imagery over the whole China? (2) Are there spatial variations between valid observations in different regions of the country, and which areas can obtain good performance relying on such phenology-based approaches? Finally, (3) what are the major factors limiting data availability for rice mapping?

2. Materials and Methods

2.1. Study Area

China is the country with the largest rice production and consumption in the world. The paddy rice fields are mainly distributed in the alluvial plains and river basins along the major rivers and coastal areas in eastern China, where the climate and topography are suitable for paddy rice growth. In China, the continental monsoon climate can be classified as subtropical in the south and temperate in the north [33]. The south of China mainly has a mixture of single- and double-rice cropping systems, while the north is dominated by a single rice crop per year due to the lower temperature.
However, the rice planting pattern in China has experienced obvious changes in recent decades due to many factors. For example, the rice cropping intensity in southern China has shown a downward trend and even abandonment due to urbanization, land marginalization, agricultural policy adjustments, and an increase in the opportunity cost of farming [48,49,50,51]. Another change of concern is the northward shift of the rice production center due to the warming climate [26,52,53]. Therefore, it is essential to determine whether this change pattern can be captured through sufficient remote sensing observations.

2.2. Data

2.2.1. Landsat and Sentinel Data

All available Landsat ETM+ and OLI Collection 1 Tier 1 surface reflectance (SR) data and Sentinel-2 Level-2A SR data from the Google Earth Engine (GEE) platform covering China in 2020 (a total of 190,291 scenes) were used to investigate the availability of medium-resolution optical data for phenology-based paddy rice mapping approaches. Landsat-7 and 8 and Sentinel-2 SR data were atmospherically corrected in GEE [54,55]. The Landsat SR data include a Quality Assessment (QA)(pixel_qa) generated by CFmask [56,57,58] that can mask invalid observations, including clouds, cloud shadows, snow etc., while Sentinel-2 data have a quality layer (QA60) which supports cloud-masking preprocessing.
The Sentinel-1 C-band Synthetic Aperture Radar (SAR) data archived in the GEE platform were used in this study in order to analyze whether they can potentially fill the gaps in cloud-prone regions with limited optical observations. The Sentinel data, are obtained by two satellites have a resolution of 10 m and a six-day temporal resolution. The Sentinel-1 SAR Ground Range Detected (GRD) dataset is a calibrated and ortho-corrected product and has both one- and two-polarization bands (VH, VV), which have been widely used for rice classification [59].

2.2.2. MODIS Data

MODIS data was used in this study to analyze the phenology of paddy rice and scale up the in situ observed phenology data to the whole study area. The Terra MOD09A1 Version 6 dataset is an eight-day composite surface spectral reflectance product at a spatial resolution of 500 m. The MCD43A4 Version 6 Nadir Bidirectional Reflectance Distribution Function (BRDF)-Adjusted Reflectance (NBAR) dataset is a daily product at a 500-m spatial resolution that combines Terra and Aqua satellite data [60], both of which were used to determine the start and end of the flooding and rice transplanting phase.

2.2.3. In Situ Phenology Observation Data of Paddy Rice

The in situ crop phenological data used in this study were derived from the China Meteorological Data Service Center (https://data.cma.cn/) (accessed on 1 July 2021). We selected stations with recordings about rice over ten years and collected observational data from 130 stations for single rice, 61 stations for early rice, and 41 stations for late rice for the 2011–2013 period. The transplanting dates and tillering dates for single, early, and late rice in these three years were collected from total of 766 and 712 records, respectively. Single rice is usually transplanted around May and matures around September all across China, including middle rice in southern China [61,62,63], while early rice and late rice generally grow from April to July and from July to October, respectively. The variation of the temporal window for the three kinds of rice among the studied years was less than that of the temporal window in space (Figure S3) [61,62,64]. Therefore, we used the available phenological observational data from 2011 to 2013 to determine the flooding and rice transplanting window for data availability analyses in 2020, which is reasonable considering the stable crop calendar.

2.3. Methods

2.3.1. Determination of Temporal Window of Flooding and Rice Transplanting

Obtaining the appropriate temporal window of flooding and rice transplanting is critical for paddy rice mapping based on phenology-based algorithms. With the help of both in situ phenological observation data and remote sensing data, we analyzed the relationship between phenology-based in situ observation of paddy rice and the remote sensing-based flooding and rice transplanting period in order to determine the appropriate temporal window. According to the eight-day time series MOD09A1 data analyses (LSWI + 0.05 ≥ EVI) [26] shown in Figure 1, the remote sensing-based flooding and rice transplanting period lasted from DOY 137 to DOY 185. The reliability of this temporal window was further confirmed using the daily BRDF-adjusted MODIS data (i.e., MCD43A4) (DOY 134–190) (Figure S1). Compared to the in situ phenological observation data, the remote sensing-based flooding and rice transplanting period covers two phenology phases: (1) the initial field flooding phase before the transplanting date, and (2) the second phase, when there is a mixture of water and rice plants from transplanting to canopy closure [21,25,40]. That is, the flooding and rice transplanting period identified by remote sensing generally corresponded to the transplanting (DOY 144–159) plus returning green stages (DOY 159–179) recorded by in situ observations, with a buffer of roughly 10 days (Figure 1). The same matching relationships were found for all three sites in northeastern China (Figure S2) as well as for early and late rice in southern China (Figure S2). Therefore, we defined the start and end of flooding and of the rice transplanting period (SOF and EOF for short) using the following equation (Equation (1)):
SOF = the   start   of   transplanting 10 d EOF = the   start   of   tillering + 10 d  
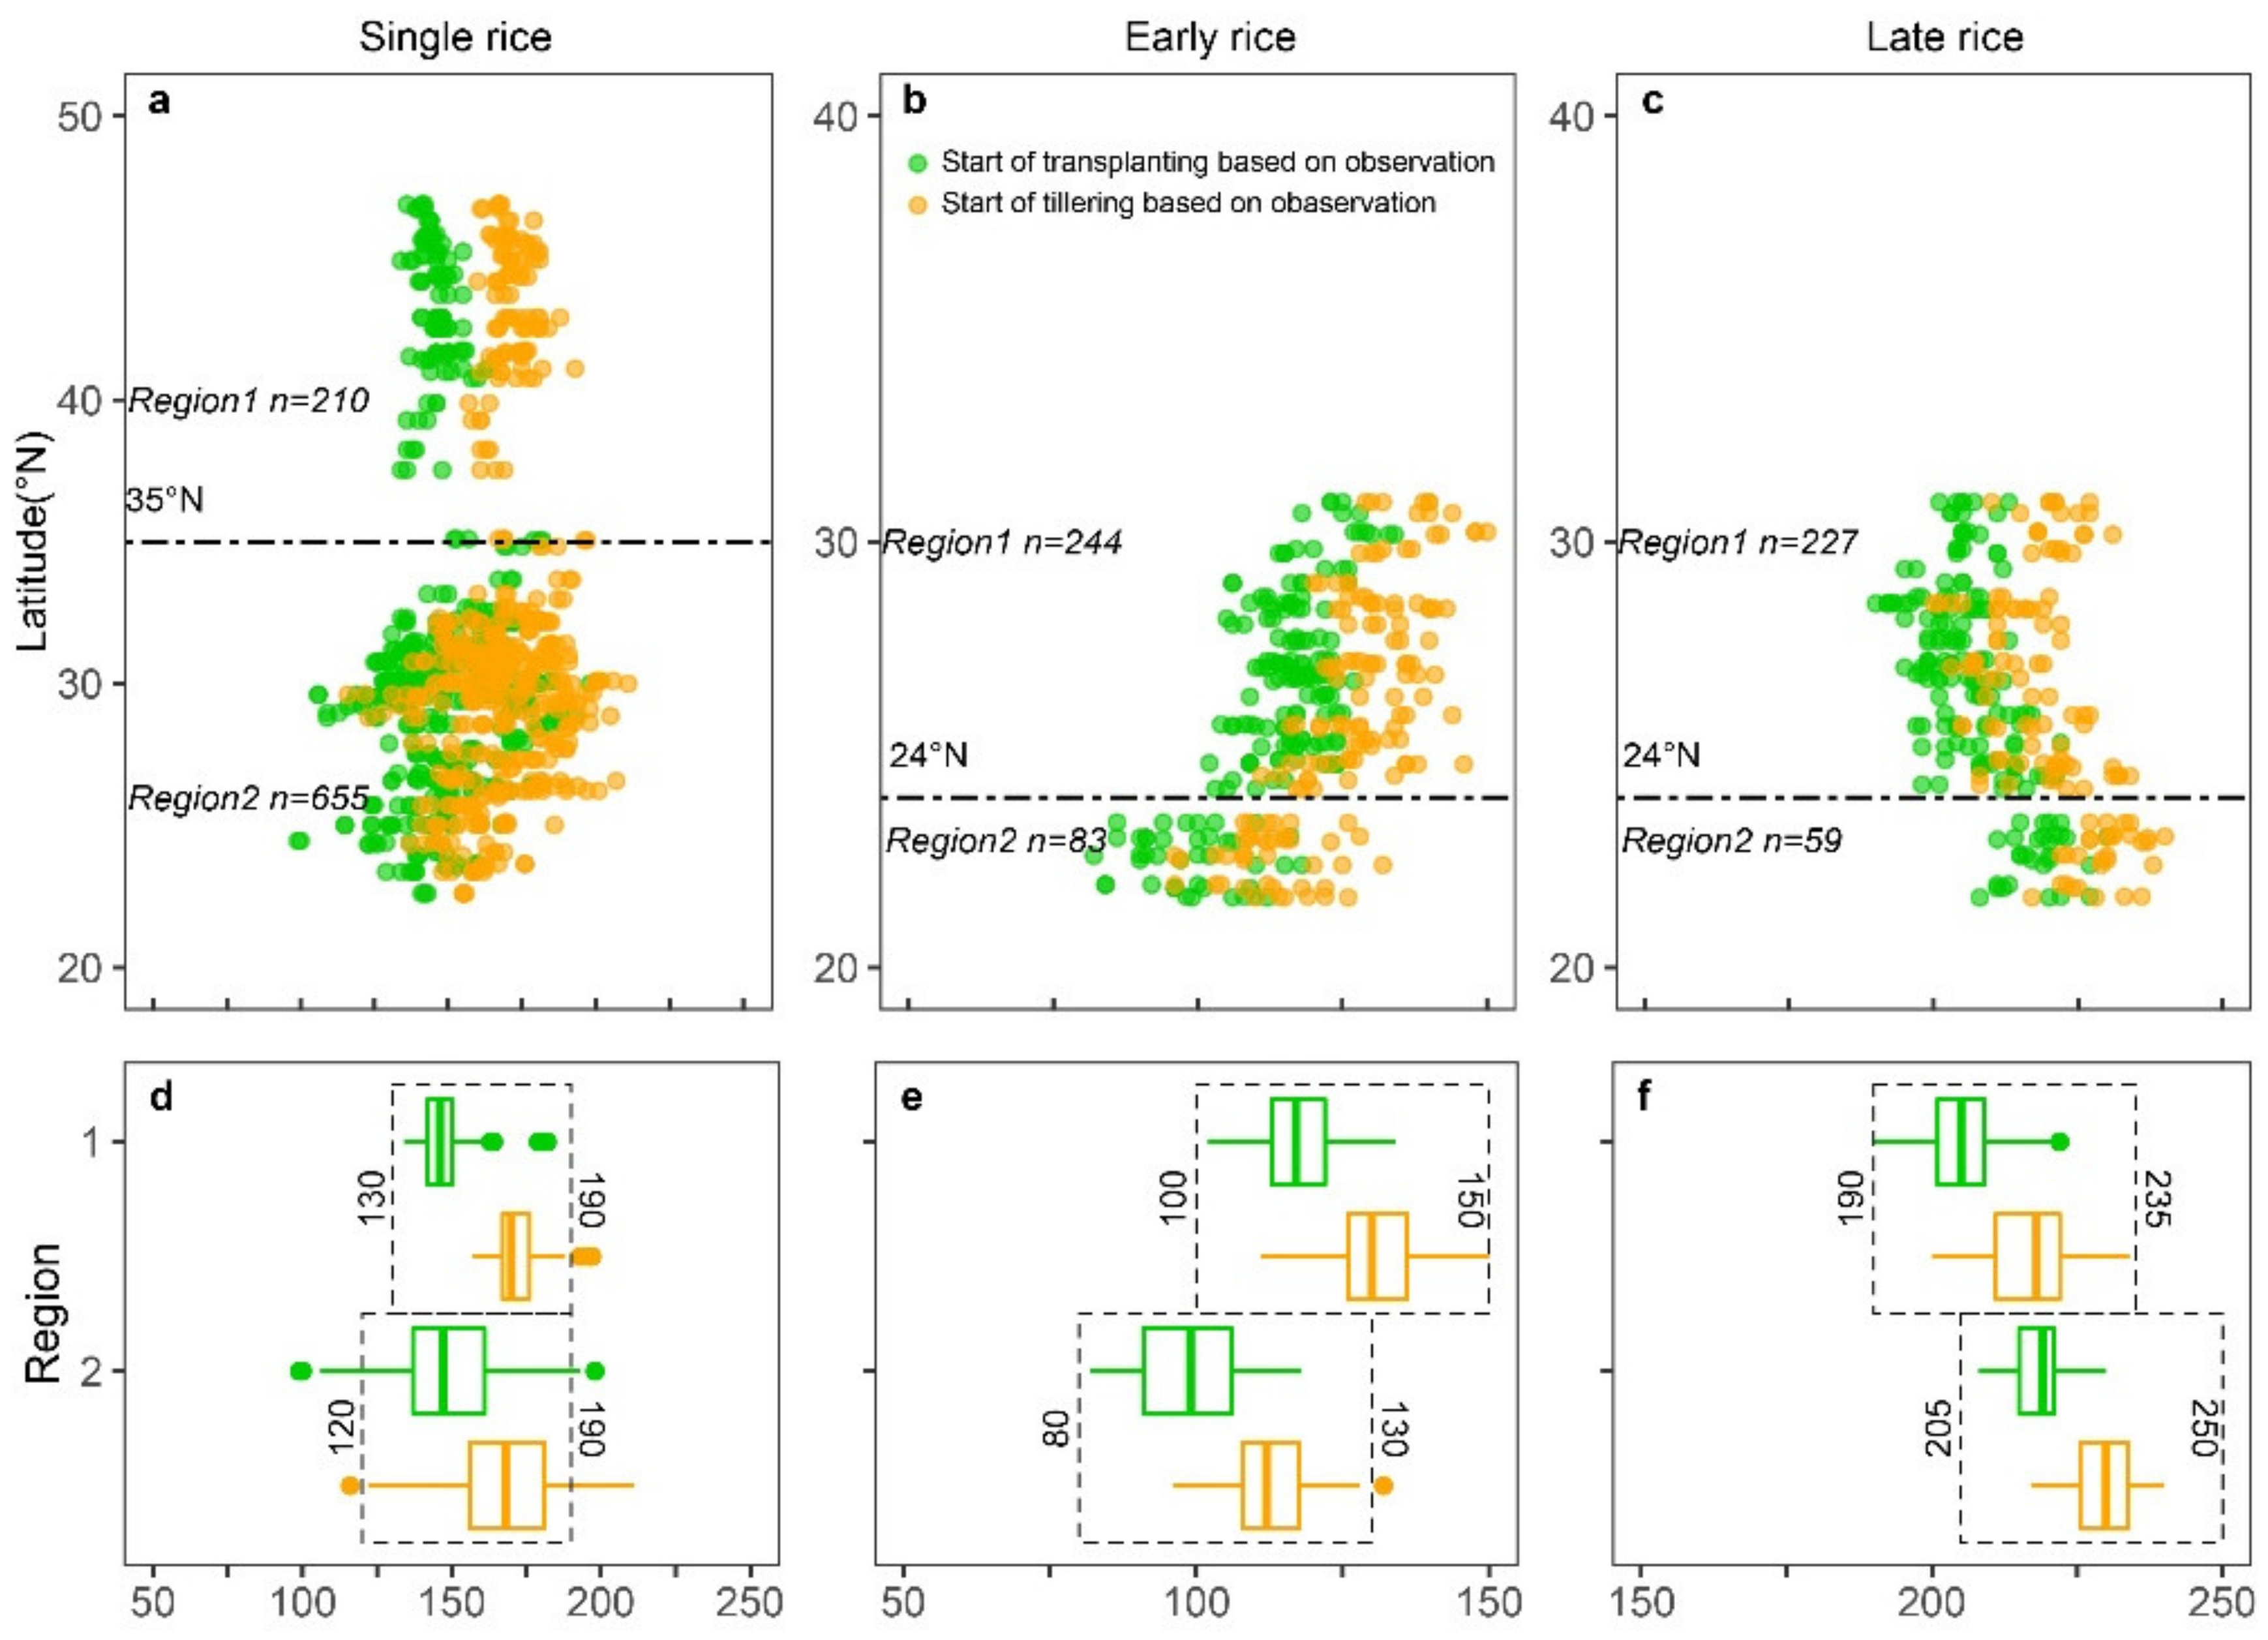
The rice systems in northern and southern China differ due to many environmental factors, notably thermal conditions. Thus, it was necessary to determine the temporal windows of flooding and rice transplanting for different rice systems (single rice, early rice, and late rice). According to the distribution of rice phenology records (Figure 2a) and the regionalization of rice cropping in China [65], the single rice cropping area was divided into the northern and southern parts of China at 35°N. In order to remove abnormal in situ phenological data, the 25% percentiles of transplanting dates and the 75% percentiles of tillering dates were taken as the start and end of the flooding and rice transplanting phase. We obtained temporal windows of DOY 130–190 (mid-May to early July) in northern China and DOY 120–190 (from early May to early July) in southern China (Figure 2d).
For double rice in southern China, the rice cropping systems are more complicated than those in northern China [66,67,68,69]. Calendars of early and late rice vary in different regions; the flooding and transplanting windows can be divided using the 24°N latitude line according to in situ phenology data (Figure 2b,c). The flooding period of early rice in southern China is DOY 100–150 (north to 24°N, mid-April to late May) and DOY 80–130 (south to 24°N, late March to early May) (Figure 2e), while the flooding and rice transplanting period of late rice in southern China is DOY 190–235 (from early July to late August, north to 24°N) and DOY 205–250 (from late July to early September, south to 24°N) (Figure 2f).

2.3.2. Statistics of Valid Landsat-7 and 8 and Sentinel-2 Observations

The valid satellite observations were acquired by removing bad quality pixels affected by clouds, circus, terrain shadows, and sensor issues (i.e., Landsat ETM+ scan line corrector (SLC)-off). Cloud-affected observations in Landsat data can be identified by a data quality assessment (QA) layer [56,57,58]. The Landsat ETM+ scan line corrector (SLC)-off gaps, accounting for 22% of the pixels within an image [70], can be identified from its metadata. Terrain shadows were identified using the solar azimuth and zenith angles and the Shuttle Radar Topography Mission (SRTM) digital elevation model (DEM) [71]. For Sentinel-2, the clouds and circus can be identified according to the Level-1C cloud mask product [72].
We counted the total valid observations of Landsat and Sentinel-2 during the flooding windows of single rice, early rice, and late rice in China in 2020. In order to compare the differences among various regions, we calculated the average valid observations by region using the following equation:
A v e r a g e r e g i o n r i c e , s e n s o r = p i x e l N r e g i o n n s e n s o r r i c e N r e g i o n
where A v e r a g e r e g i o n r i c e , s e n s o r is the regional average number of valid observations from different sensors or their combinations during the rice flooding season, n s e n s o r r i c e is the number of valid observations from one or the combination of two or three sensors in one pixel during the single, early, and late rice flooding seasons, and N r e g i o n is the total number of Landsat or Sentinel-2 pixels in a certain region (the whole country or the six sub-regions in China). The valid observation statistics were compiled separately for the six sub-regions with different rice cropping intensity and phenology patterns.
In addition, we calculated the percentage of valid pixels with more than one observation for rice mapping in the whole China and six main rice cropping regions:
P e r c e n t r i c e , s e n s o r , r e g i o n = N r i c e , s e n s o r N r e g i o n
where P e r c e n t r i c e , s e n s o r , r e g i o n is the percentage of a pixel that can be used for rice identification in a certain region with a certain satellite observation,   N r i c e , s e n s o r is the total number of Landsat or Sentinel-2 pixels with at least one valid observation, and N r e g i o n is the total number of Landsat or Sentinel-2 pixels in a certain region.
Sentinel-1 acquires imagery regardless of the weather by operating day and night, performing C-band synthetic aperture radar imaging [73]. Therefore, we used all available Sentinel-1 images as good-quality observations.
Here, we defined the effective identification of paddy rice as instances in which remote sensing was able to capture the flooding and rice transplanting signal of the rice paddy. We defined one valid observation in the flooding and rice transplanting phase as the minimum requirement for effective identification of paddy rice. We defined valid observation in a specific region as the achievement of effective identification of paddy rice, meaning that the number of the valid observations of all pixels in the region was more than one, that is, the percentage of identifiable pixels in the region was almost 100%.

2.3.3. Effects of Sidelaps, Growing Season Length, and Clouds on Data Availability

Valid observations from Landsat-7 and 8 and Sentinel-2 images during the flooding and rice transplanting period can be affected by many factors, including cloud frequency, sidelaps, and transplanting season length.
The cloud contamination and frequency were obtained from the QA-based cloud mask of the MOD09GA data. The systematic sidelaps of scene paths of the satellites were obtained by overlaying all of the Landsat-7 and 8 and Sentinel-2 scene boundaries in shapefile format. The degree of sidelaps increases from the equator to the poles, caused by fixed satellite orbits and the shape of the earth [74,75,76]. Transplanting season length data were obtained as described in Section 2.3.1. The explanatory variables utilized in the model included two continuous variables, one representing the average amount of cloud and the other the overlap of each grid. Correlation analyses between valid observations and the two factors (cloud frequency and sidelaps) were performed. A dummy variable indicating the transplanting seasons of different rice in different regions was assigned as a continuous variable from 1 to 6 (e.g., the transplanting season of single rice in northern China had a value 1).
A multivariate linear regression analysis by Ordinary Least Square (OLS) was implemented using Stata13.0 in order to evaluate how the three factors shape the pattern of valid observation across China. The OLS model is a type of global regression model that is not impacted by spatial autocorrelation or homogeneity in the feature space [77,78]. More specifically, the regression model was specified as follows:
Y = β 0 + β 1 C l o u d + β 2 O v e r l a p + β 3 T r a n s + ε
where Y is the number of valid observations, β 0 is the intercept of the regression model, β 1 ,   β 2 , and β 3 are the regression coefficients for cloud, overlap, and the transplanting season length, respectively, and ε is the regression residual.
Moreover, the importance of the three factors to valid observations can be acquired from the normalization of the three regression coefficients. We assumed that the larger absolute value of standardized regression coefficient means more significant impact of the corresponding independent variable on the dependent variable [79]. The standardized regression coefficients β i can be calculated as follows:
β i = β i S i / S Y
where β i are the raw regression coefficients and S i and S Y are the standard deviation of independent variable X i and dependent variable Y, respectively.

3. Results

3.1. Pattern of Data Availability during the Flooding and Rice Transplanting Period in China

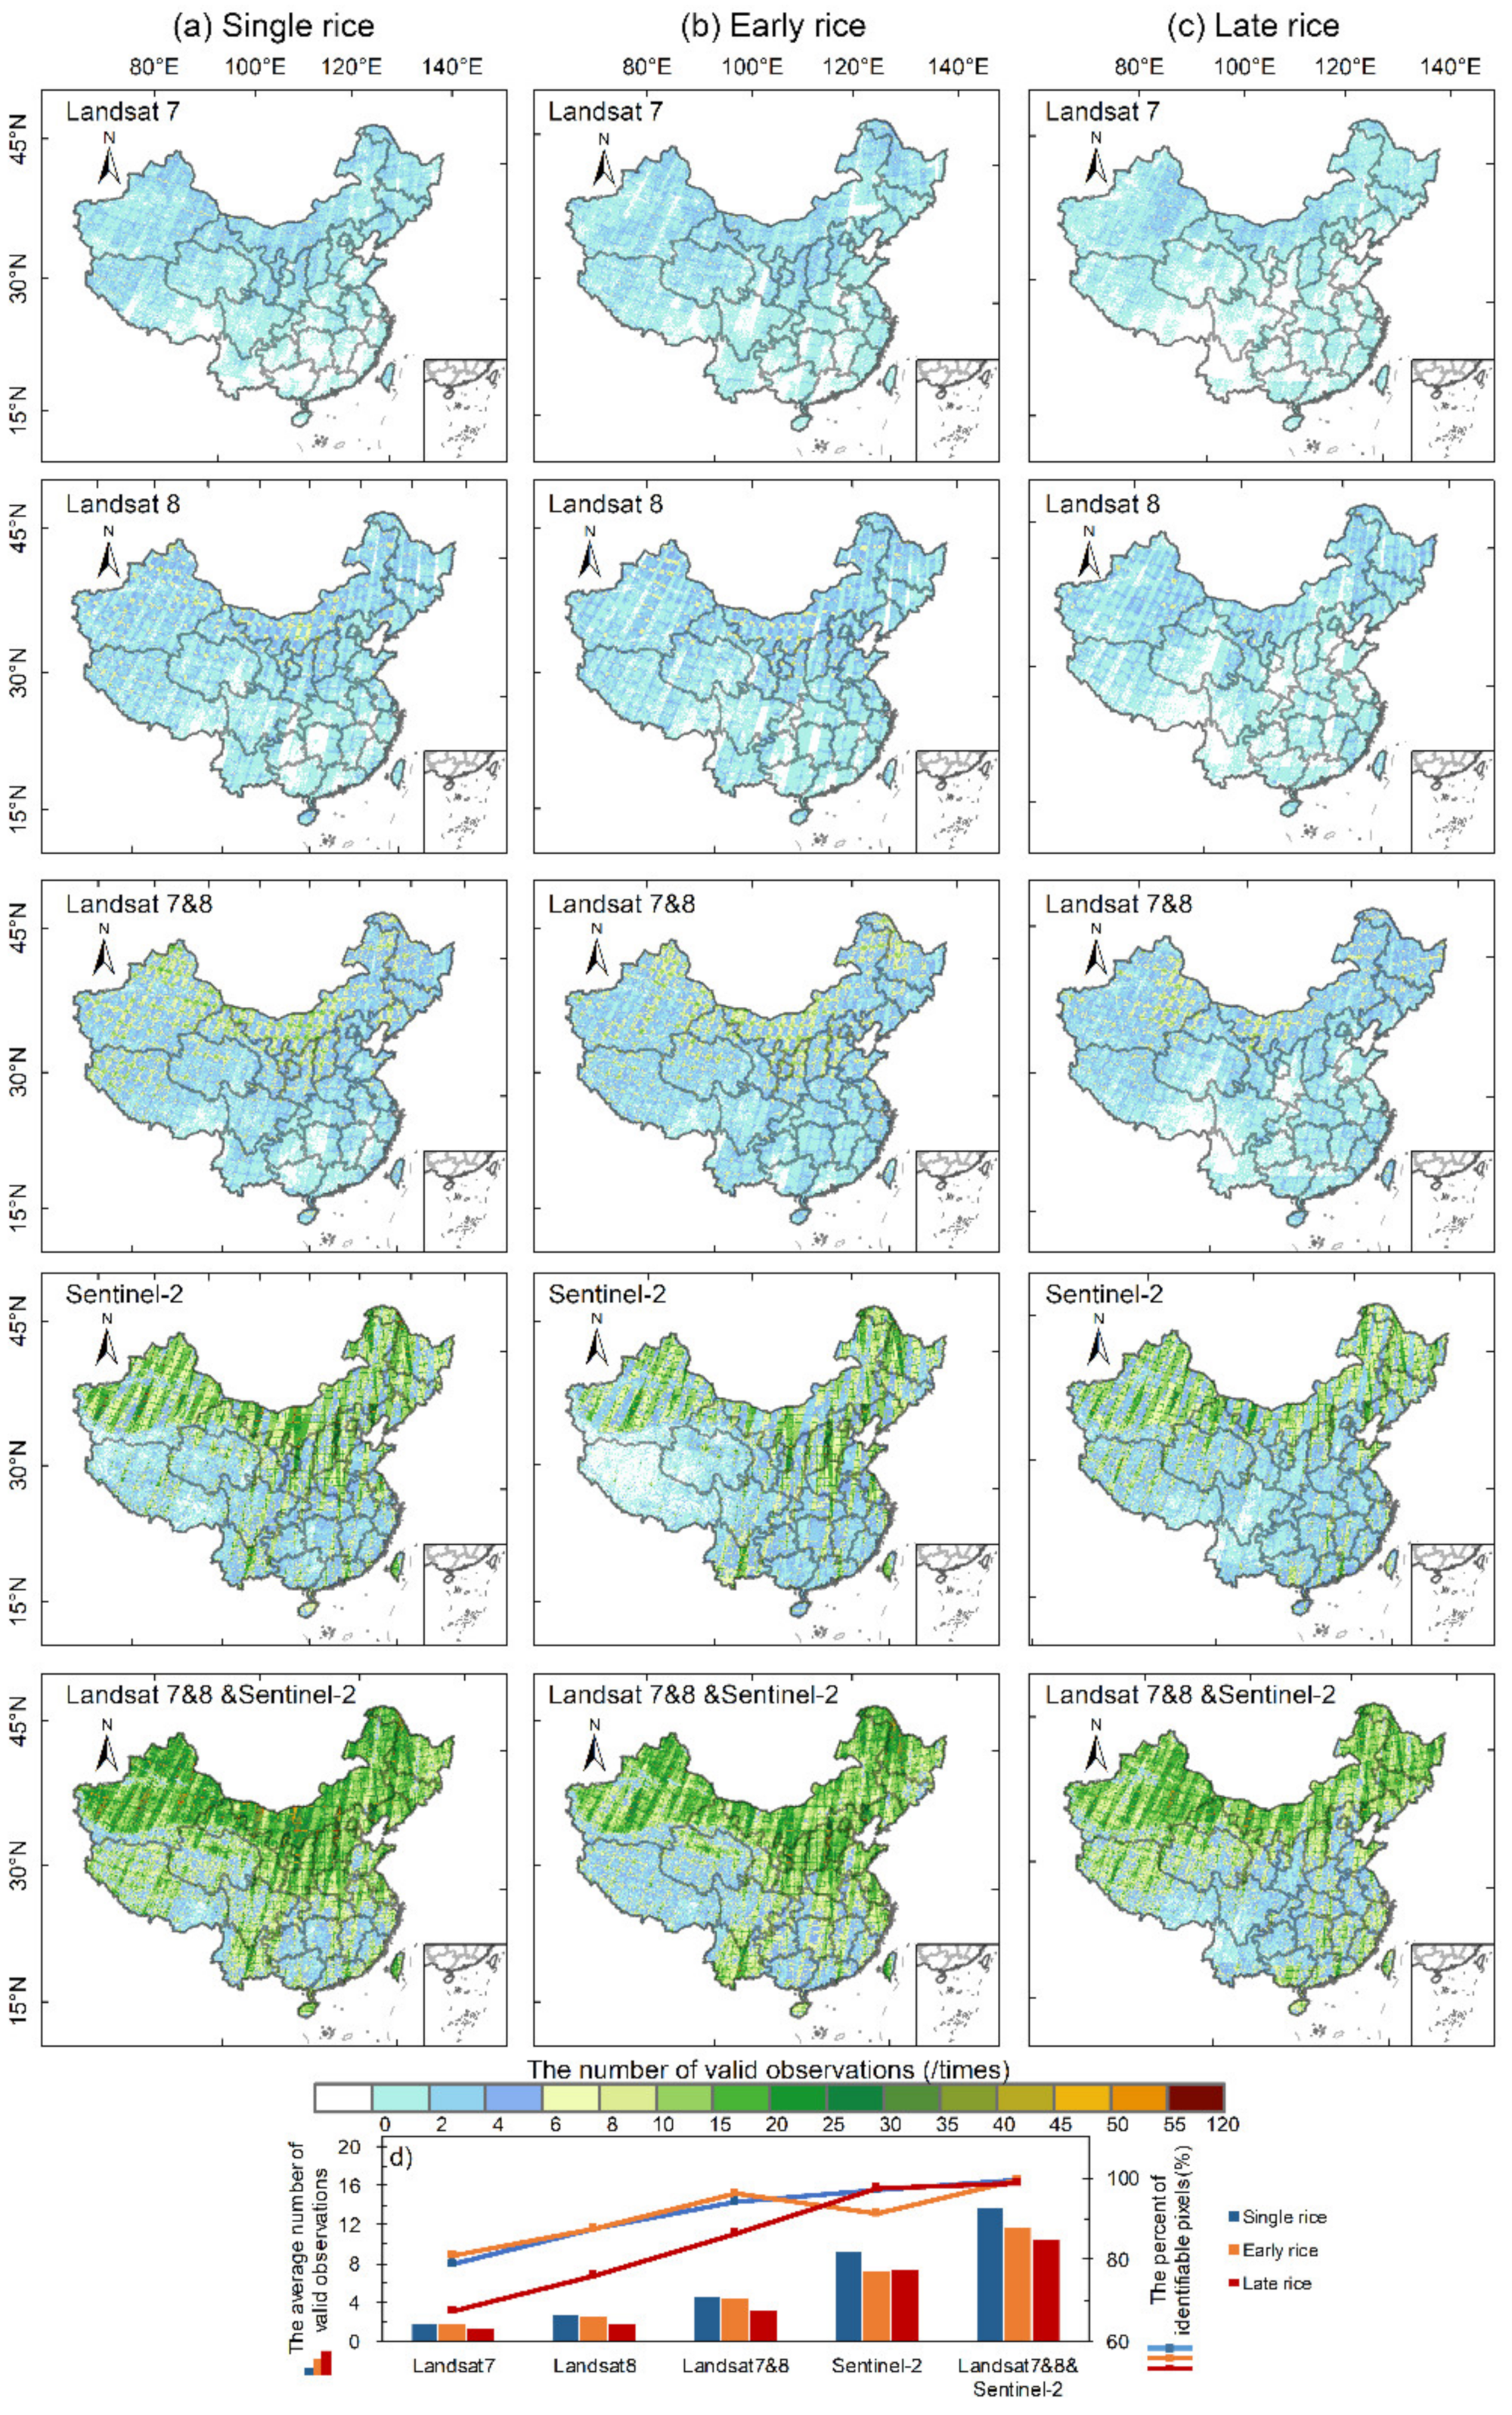
Considering all the available Landsat-7 and 8 and Sentinel-2 images in 2020, the regional average number of valid observations during the flooding and rice transplanting period of single rice in northern China is 17.4, and the areal percentage with more than one valid observation is as high as 99.9%. The average number of valid observations for single rice, early rice, and late rice in southern China is 8.95, 7.7, and 6.4, respectively, and their respective proportions with more than one valid observation in the region are 99.1%, 99.2%, and 97.1%. In general, the Landsat-7 and 8 and Sentinel-2 images support the phenology-based rice mapping data at the scale of the whole country.
Compared with Landsat, Sentinel-2 has a greater contribution to the improvement of the valid observation quality. Specifically, the average number of valid Landsat-7 and 8 observations in northern China during the flooding and rice transplanting period is five, which is eleven times lower than Sentinel-2. Compared to the Landsat observations, combining Landsat and Sentinel-2 observations increases the regional average valid observations of single rice, early rice, and late rice in southern China from 3.02, 2.99, and 1.81 to 8.95, 7.69, and 6.44, respectively. The spatial pattern of the valid observations and the percentage of identifiable pixels showed that Landsat-7 and 8 can satisfy the effective identification of single rice in northern China, while the integration of Landsat and Sentinel-2 is needed for the identification of rice in southern China. Furthermore, the involvement of the radar data (e.g., Sentinel-1) is necessary for late rice mapping compared to phenology-based approach in this region, i.e., the Sichuan Basin (Figure 3c).
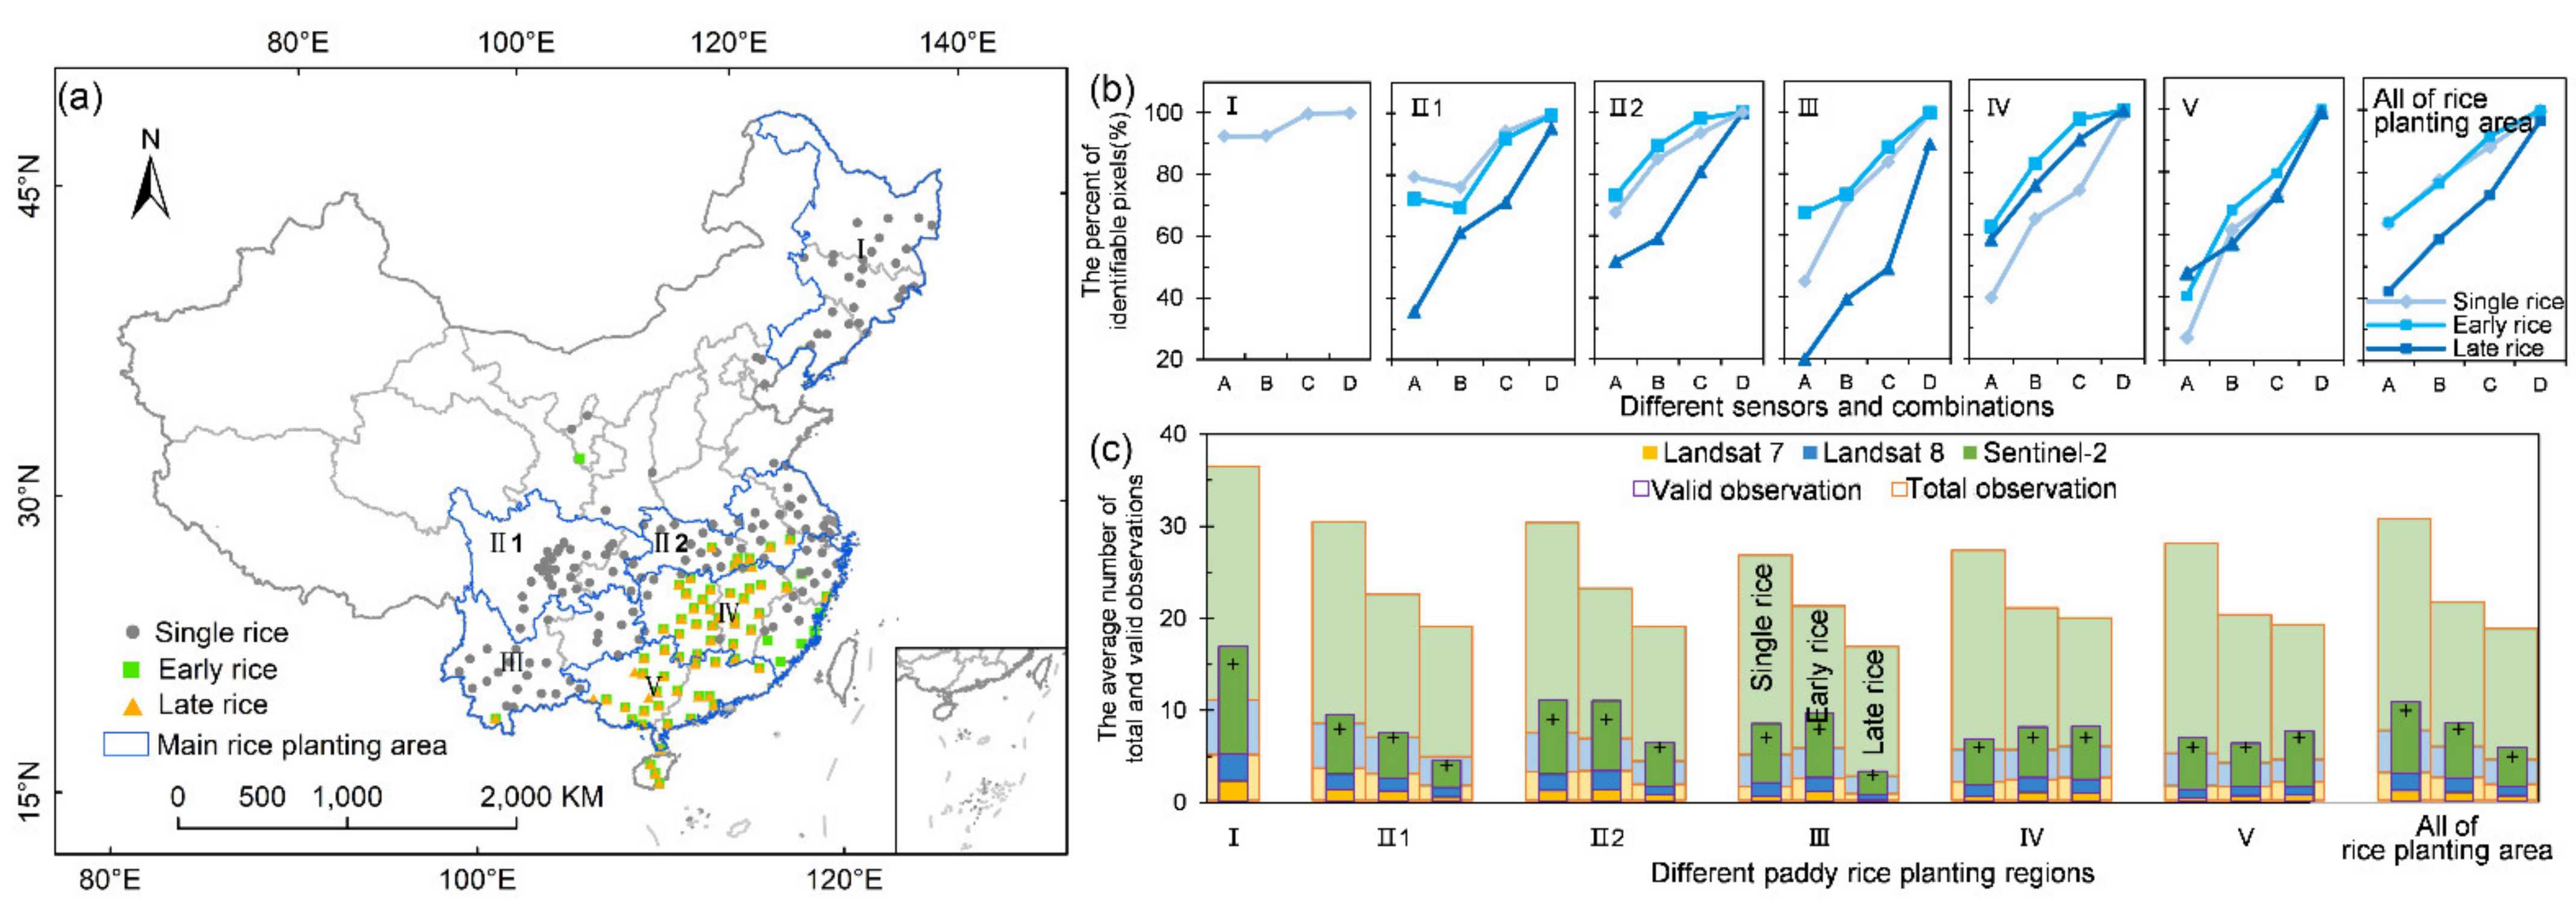
We further conducted an analyses of valid observations in the six main rice cultivation areas, which contribute about 96% and 94% of the total rice area and production in China, respectively [80] (Figure 4). Generally, the six rice cultivation areas shared similar patterns of valid observational quality with the entire country (Figure 3). This means that the combination of Landsat-7 and 8 and Sentinel-2 is necessary except for the identification of single rice in northeastern China (Ⅰ), where Landsat itself is sufficient for capturing the flooding signals during the flooding and rice transplanting periods. As Figure 4 shows, the average number of valid observations in the main rice cultivation areas exceeded five when combining Landsat-7 and 8 and Sentinel-2 observations, and the pixels with more than one valid observation almost cover the entire area. Moreover, the identification of late rice in the Yunnan–Guizhou Plateau (Ⅱ1) and Sichuan Basin (Ⅲ) regions requires supplementation with radar data. The number of valid observations during the late rice flooding and transplanting phase in these regions is less than five without the Sentinel-2 data; the percentage of identifiable pixels increases from 71%, 80%, and 49%, respectively, when relying only on Landsat fusion data to more than 90%, with an especially large improvement in Ⅲ. The valid satellite observations collected for late rice mapping are significantly worse than those for single and early rice mapping.

3.2. Impacts of Clouds, Sidelaps, and Transplanting Season Length on Data Availability for Rice Mapping

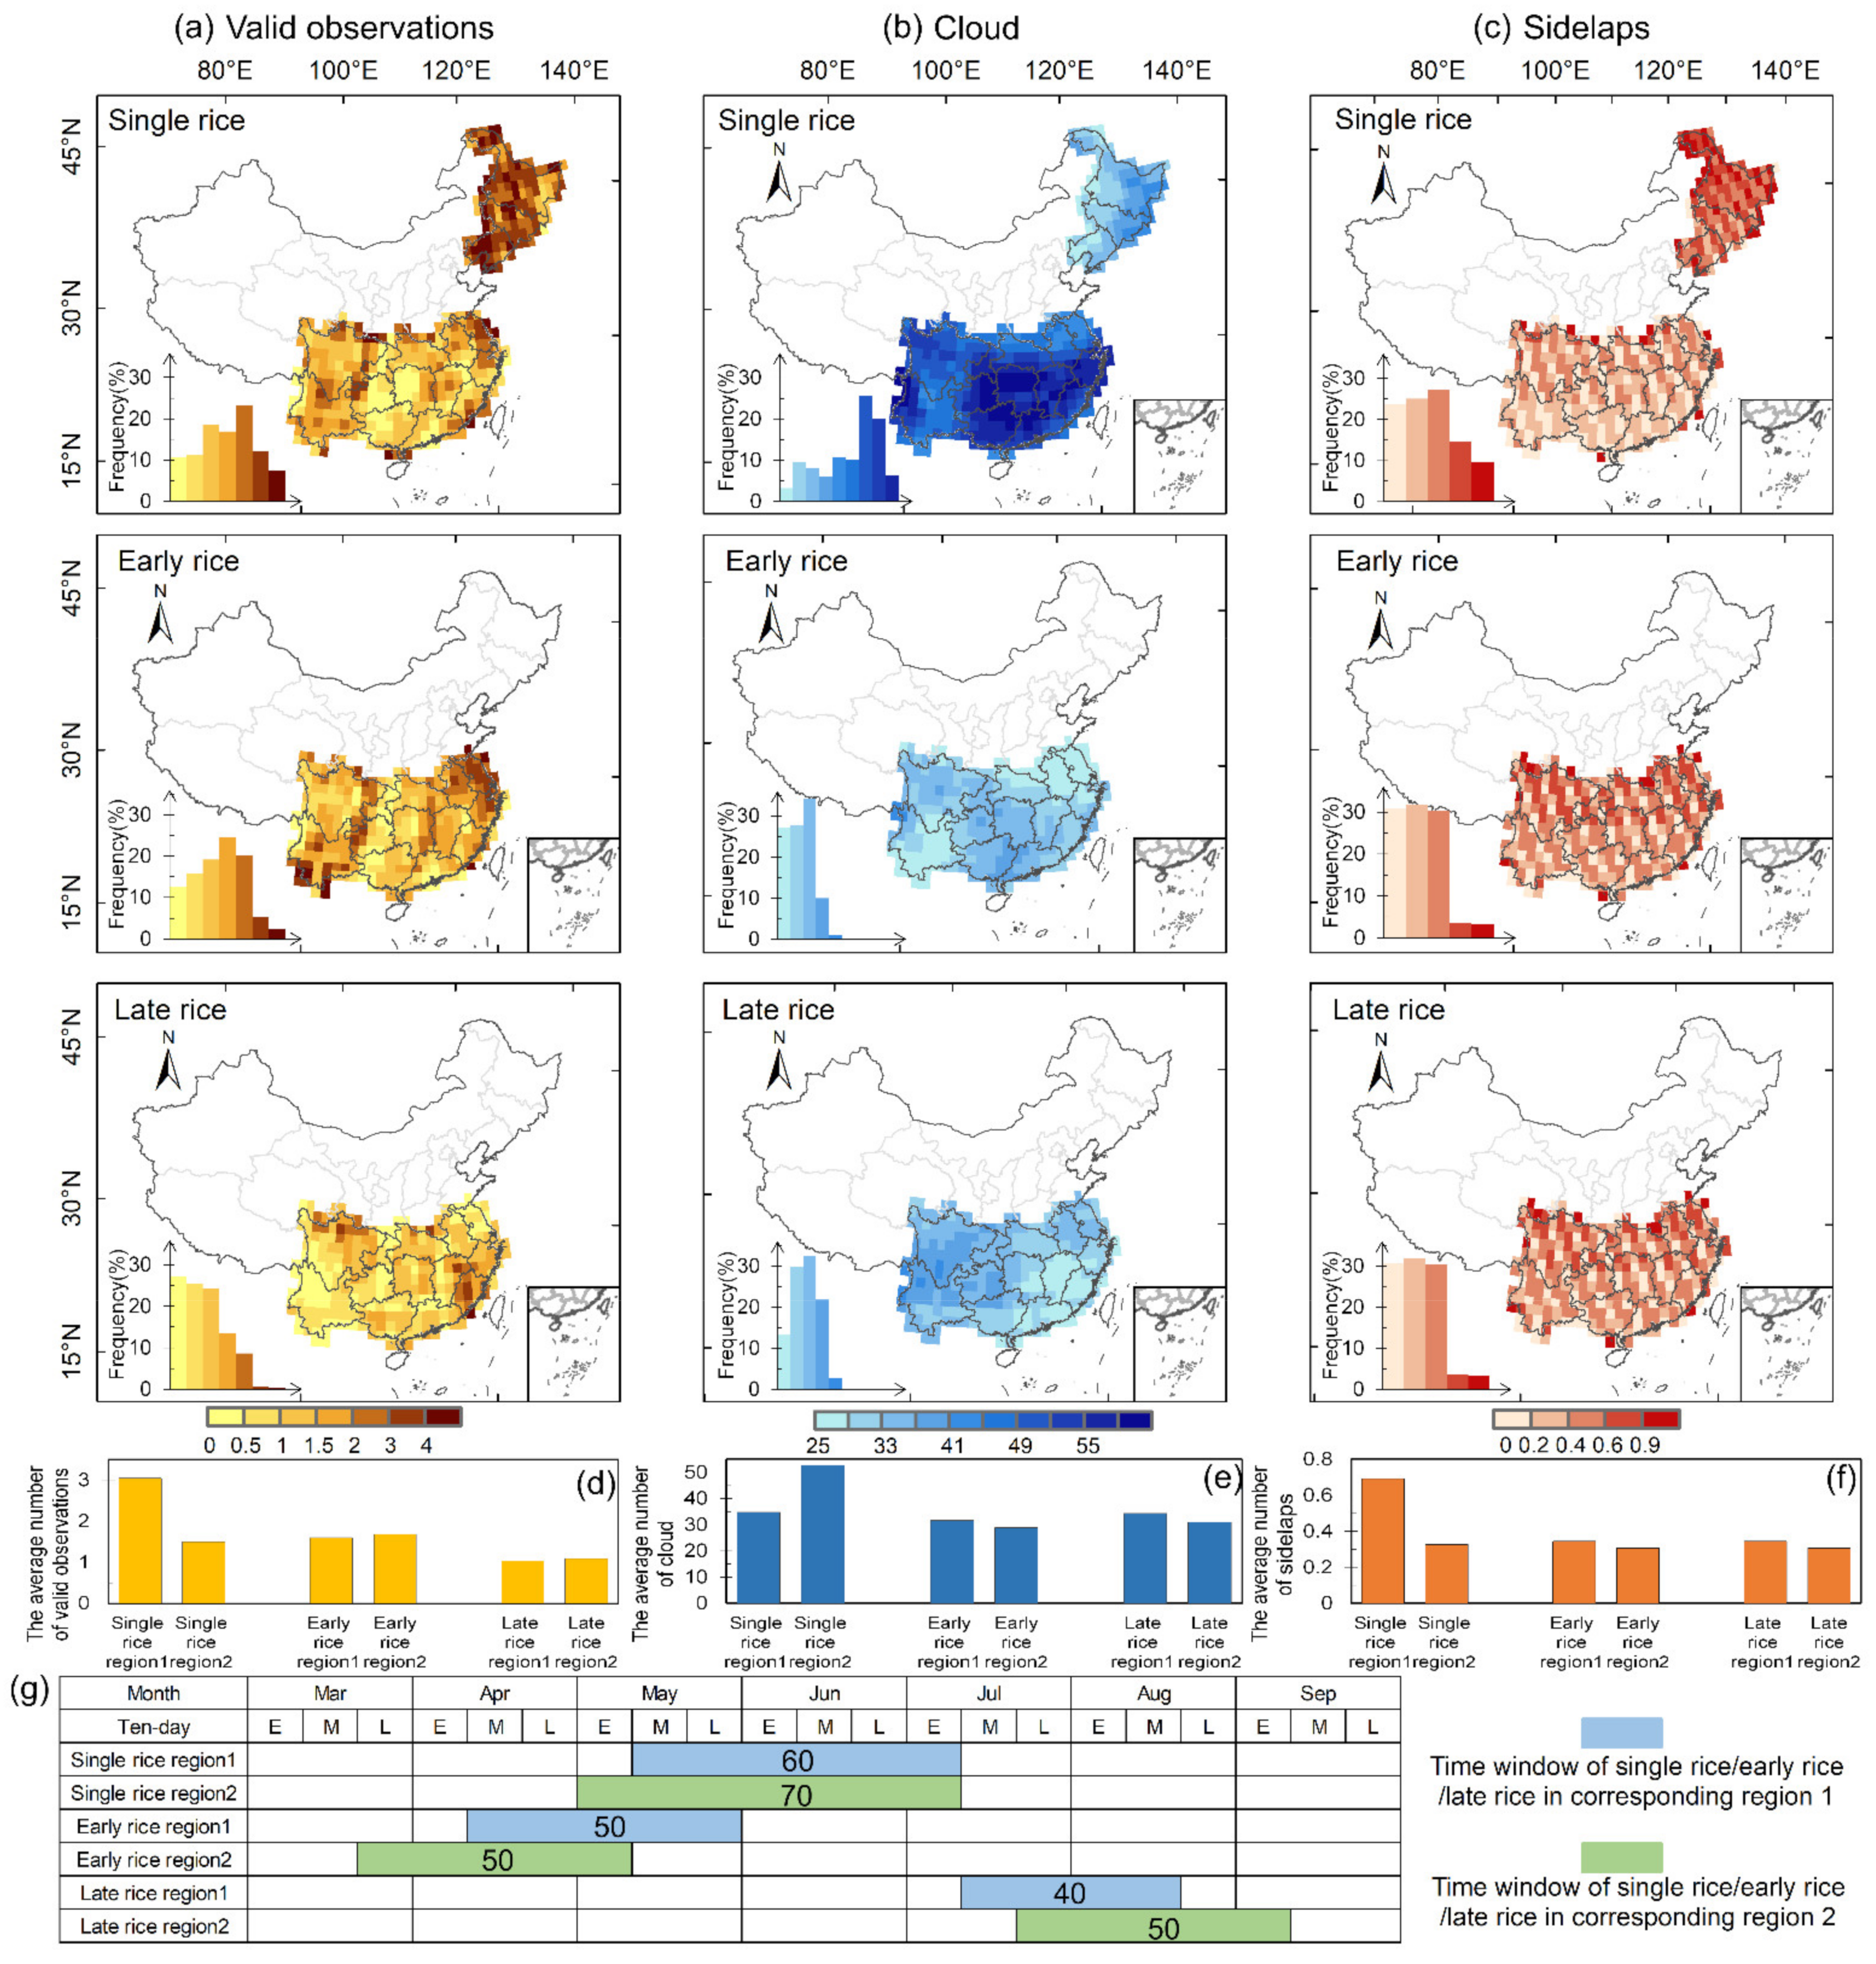
Clouds, sidelaps, and transplanting season length are three factors influencing data availability for rice mapping. All the three factors showed a divergent pattern in northern and southern China (Figure 5). First, the cloud cover during the flooding and rice transplanting phase in southern China is generally higher than that in the north, due to less precipitation in northern China [81]. Second, there is a higher frequency of sidelaps in northeastern China compared with southern China, which is consistent with the pattern of valid observations. Third, the flooding and rice transplanting phase of single rice lasts about 60 days, from May to July, which is longer than early rice (~50 days, from April to May) and late rice (~45 days, from July to August). This longer transplanting duration tends to lead to more observations.
We further quantified the contributions of different factors to data availability. Figure 6 shows that both the cloud cover and the transplanting length have a significantly negative effect on valid observations, while sidelaps are positively correlated with valid observations. It can be seen from Table 1 that the multivariate OLS model had a higher adjusted R2 value (0.481). Additionally, the model passed the F test and multicollinearity test (Mean VIF < 10), and had no autocorrelation (DW = 1.23), that is, there was no correlation between the sample data and the model was appropriate. As expected, clouds, sidelaps, and transplanting season length were all found to be important predictors of valid observations. In terms of the overall magnitude of effects, we found that transplanting length and cloud cover explained a greater proportion of the variance in valid observations than sidelaps, with standardized coefficients of −0.547, −0.453, and 0.306, respectively. These attribution analyses explain the spatial pattern addressed above.

4. Discussion

4.1. Data Availability in the Transplanting Phase for Phenology-Based Rice Mapping

Phenology-based rice mapping is dependent on the extraction of flooding signals, which mainly relies on the quantity and quality of observations captured during the transplanting season. Therefore, we conducted statistical analyses to identify the number of Landsat-7, Landsat-8, and Sentinel-2 valid observations in the flooding and rice transplanting phase rather than the entire growing season of rice [25,43] across China.
In this study, we examined the spatial pattern of the Landsat and Sentinel-2 valid observations during the flooding and transplanting phases of three major rice plantings (single rice, early rice, and late rice) in China in 2020 by using the Google Earth Engine platform to target the best satellite or virtual constellation selection for using phenology-based rice mapping efforts across China. The advantages of this study have two aspects: (1) determination of rice transplanting phase by integrating in situ observations and remote sensing; and (2) attribution analyses of data availability for rice mapping.
First, a suitable temporal window to detect the flooding signal of paddy rice fields is key to the phenology-based approach. Other land types (e.g., water and wetlands) have flooding signals for a longer period, such as snowmelt in temperate and mountainous regions and summer flooding [33], which interferes with rice flooding signal extraction and causes misclassification and omission errors. Previous studies have applied different approaches to determine the flooding and rice transplanting phase to avoid potential commission errors in phenology-based rice mapping. For example, Zhang determined the flooding and rice transplanting phase (from SOF to EOF) in northeastern China as the period between the date of LST 5 °C and EVI 0.35 [26], while other studies have defined the temporal window for all pixels in certain eight-day composites according to agricultural observations [29,82,83,84]. In this study, we determined the SOF and EOF of single rice, early rice, and late rice in different areas; our results are supported by the previous work on the temperate- and pixel-based time windows proposed by Zhang [26]. In addition, our methods to define the temporal window based on remote sensing data and agricultural phenology observational data greatly alleviates the inaccuracy of using observational data alone [29,83]. Furthermore, our results can be applied in the southern China, where remote sensing data is severely missing, the accumulated temperature is suitable for rice growth in most of the year, and LST does not help to define the flooding and rice transplanting phase.
Second, we conducted a comprehensive analysis on the drivers of data availability by considering three major factors, including cloud cover, sidelaps, and transplanting length. We found that cloud coverage has a significant negative effect on valid observations (β1 = −0.453) and is concentrated in the flooding and transplanting phase of rice in the southern China because of the heavy monsoon rain season [81,85]. The accuracy of large-scale rice mapping varies greatly between regions, and a higher omission error is generated in tropical regions due to the lack of cloud-free optical images [14,16,18,33,69,86]. The other two factors are significantly positively correlated with valid observations (β2 = 0.306, β3 = −0.547 for sidelaps and length of temporal window, respectively). The flooding and rice transplanting phase of single rice is concentrated from May to July, and the length is about twenty days longer than that of early rice and late rice, from March to May and from July to September, respectively. This difference is closely related to rice varieties, rice cropping systems, and field management [23,87,88,89].
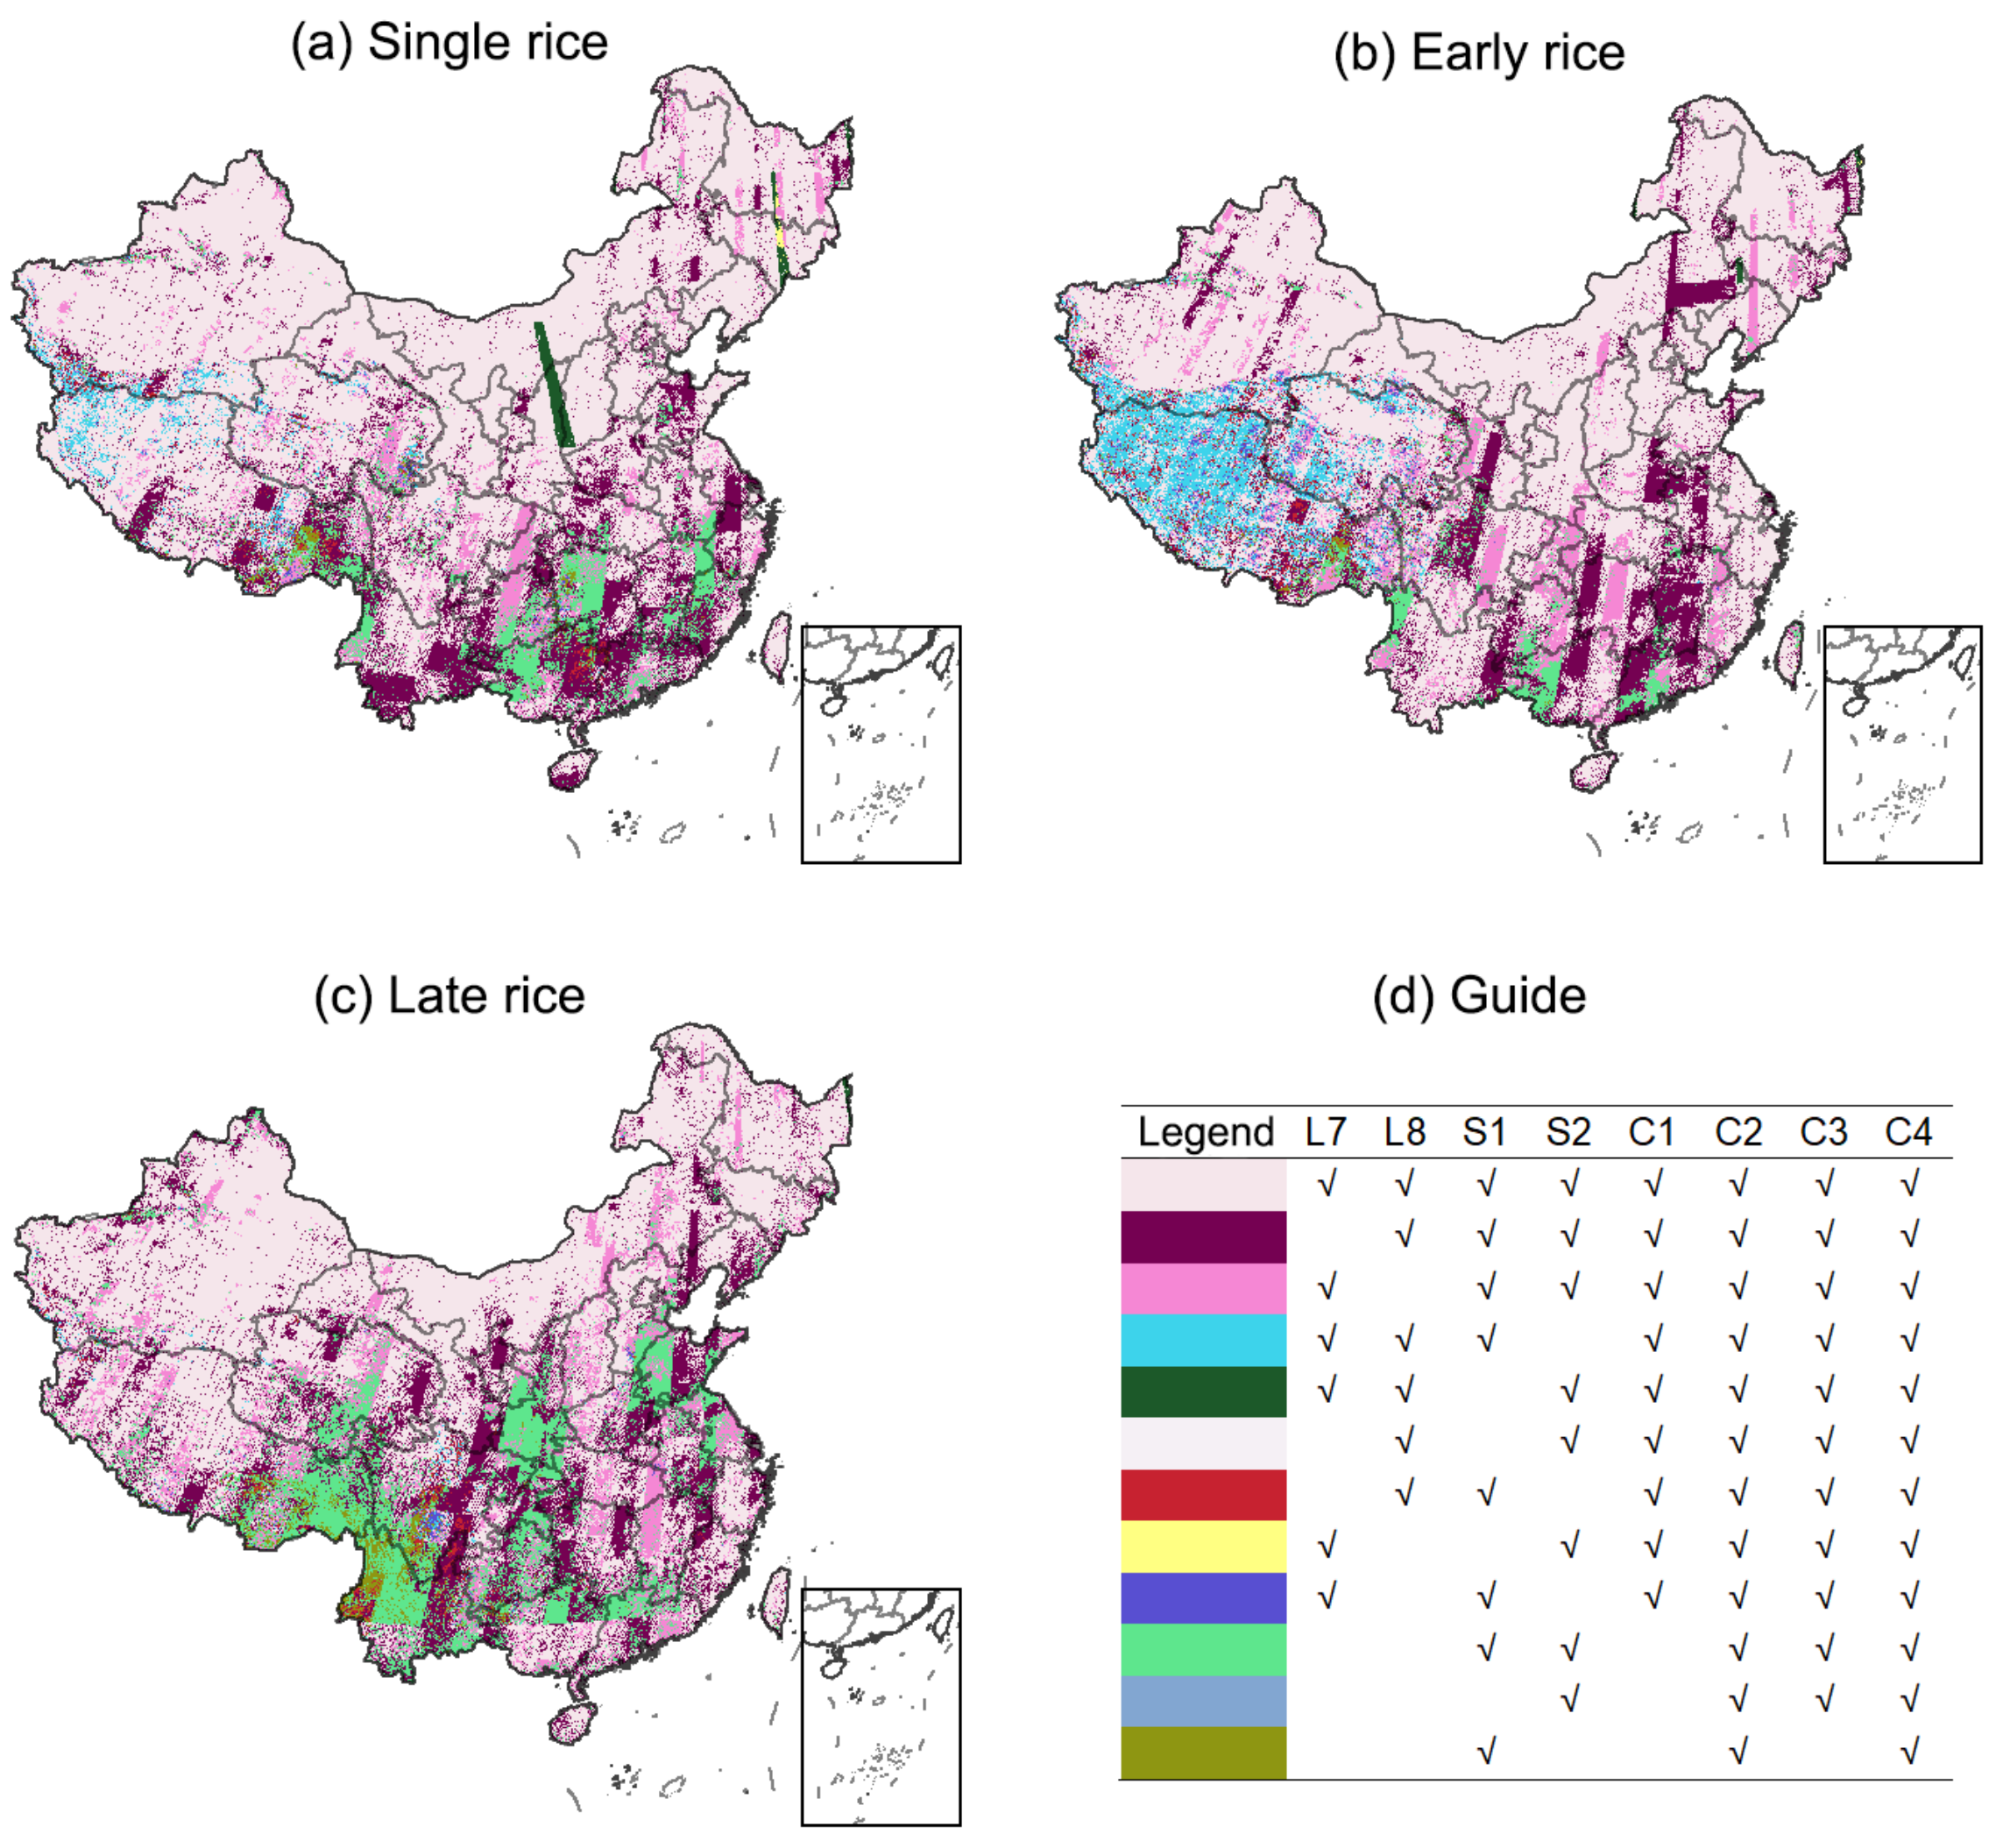
The Group on Earth Observations Global Agriculture Monitoring (GEOGLAM) [90,91] has developed a table of requirements for satellite-based Earth observation data with the purpose of demonstrating the spatial, spectral, “cloud-free” temporal resolution, and extant data requirements for a variety of agricultural monitoring applications or “target products” based on their experience in agricultural monitoring research. As articulated by the table, the use of moderate spatial resolution data collected at a more frequent rate is a priority for crop mask spanning full extent e.g., persistently cloudy and rice-growing areas. Compared to the study of GEOGLAM, our research suggests more advice as to specific satellite data requirements (Landsat-7 and 8, Sentinel-1 and 2, or their combination) for single rice, early rice, and late rice mapping by phenology-based approach across China (Figure 7 and Figure 8).

4.2. Implications and Suggestions for Phenology-Based National-Scale Rice Mapping

We found that in northern China, mainly in the northeast of China, which is dominated by single rice, Landsat-7 and 8 data fusion could support the whole area covered by pixels with more than one valid observation in the temporal window, while in southern China the combination of Sentinel-2 and Landsat datasets offered higher spatial and temporal resolution (~30 m, <5 day) [92], which therefore represents the best choice for single rice and early rice mapping. However, there are areas in Yunnan, Guizhou, and Sichuan Province that have no valid observations for late rice and where the assistance of radar data is needed. Sentinel-1 data, as a kind of SAR data, is anticipated to be a promising data source that can complement optical data (Sentinel-2 and Landsat) for paddy rice mapping in cloud-prone tropical and sub-tropical regions [93,94,95]. Thus, advanced satellite imagery (Sentinel-1/2) and multiple data fusion are necessary for the further extensive application of pixel- and phenology-based rice mapping in the whole China, which will alleviate the lack of valid observations within the temporal window (about one month in length) due to revisit cycle of singular satellite data (e.g., Landsat) and the vulnerability of optical data to cloud. Zhang et al. [17] have harmonized Landsat-8 and Sentinel (1 SAR and 2MSI) images to generate a 10 m rice map of three provinces of China by integrating pixel-based classification involving random forest (RF) with object-oriented simple linear iterative clustering (SLIC).
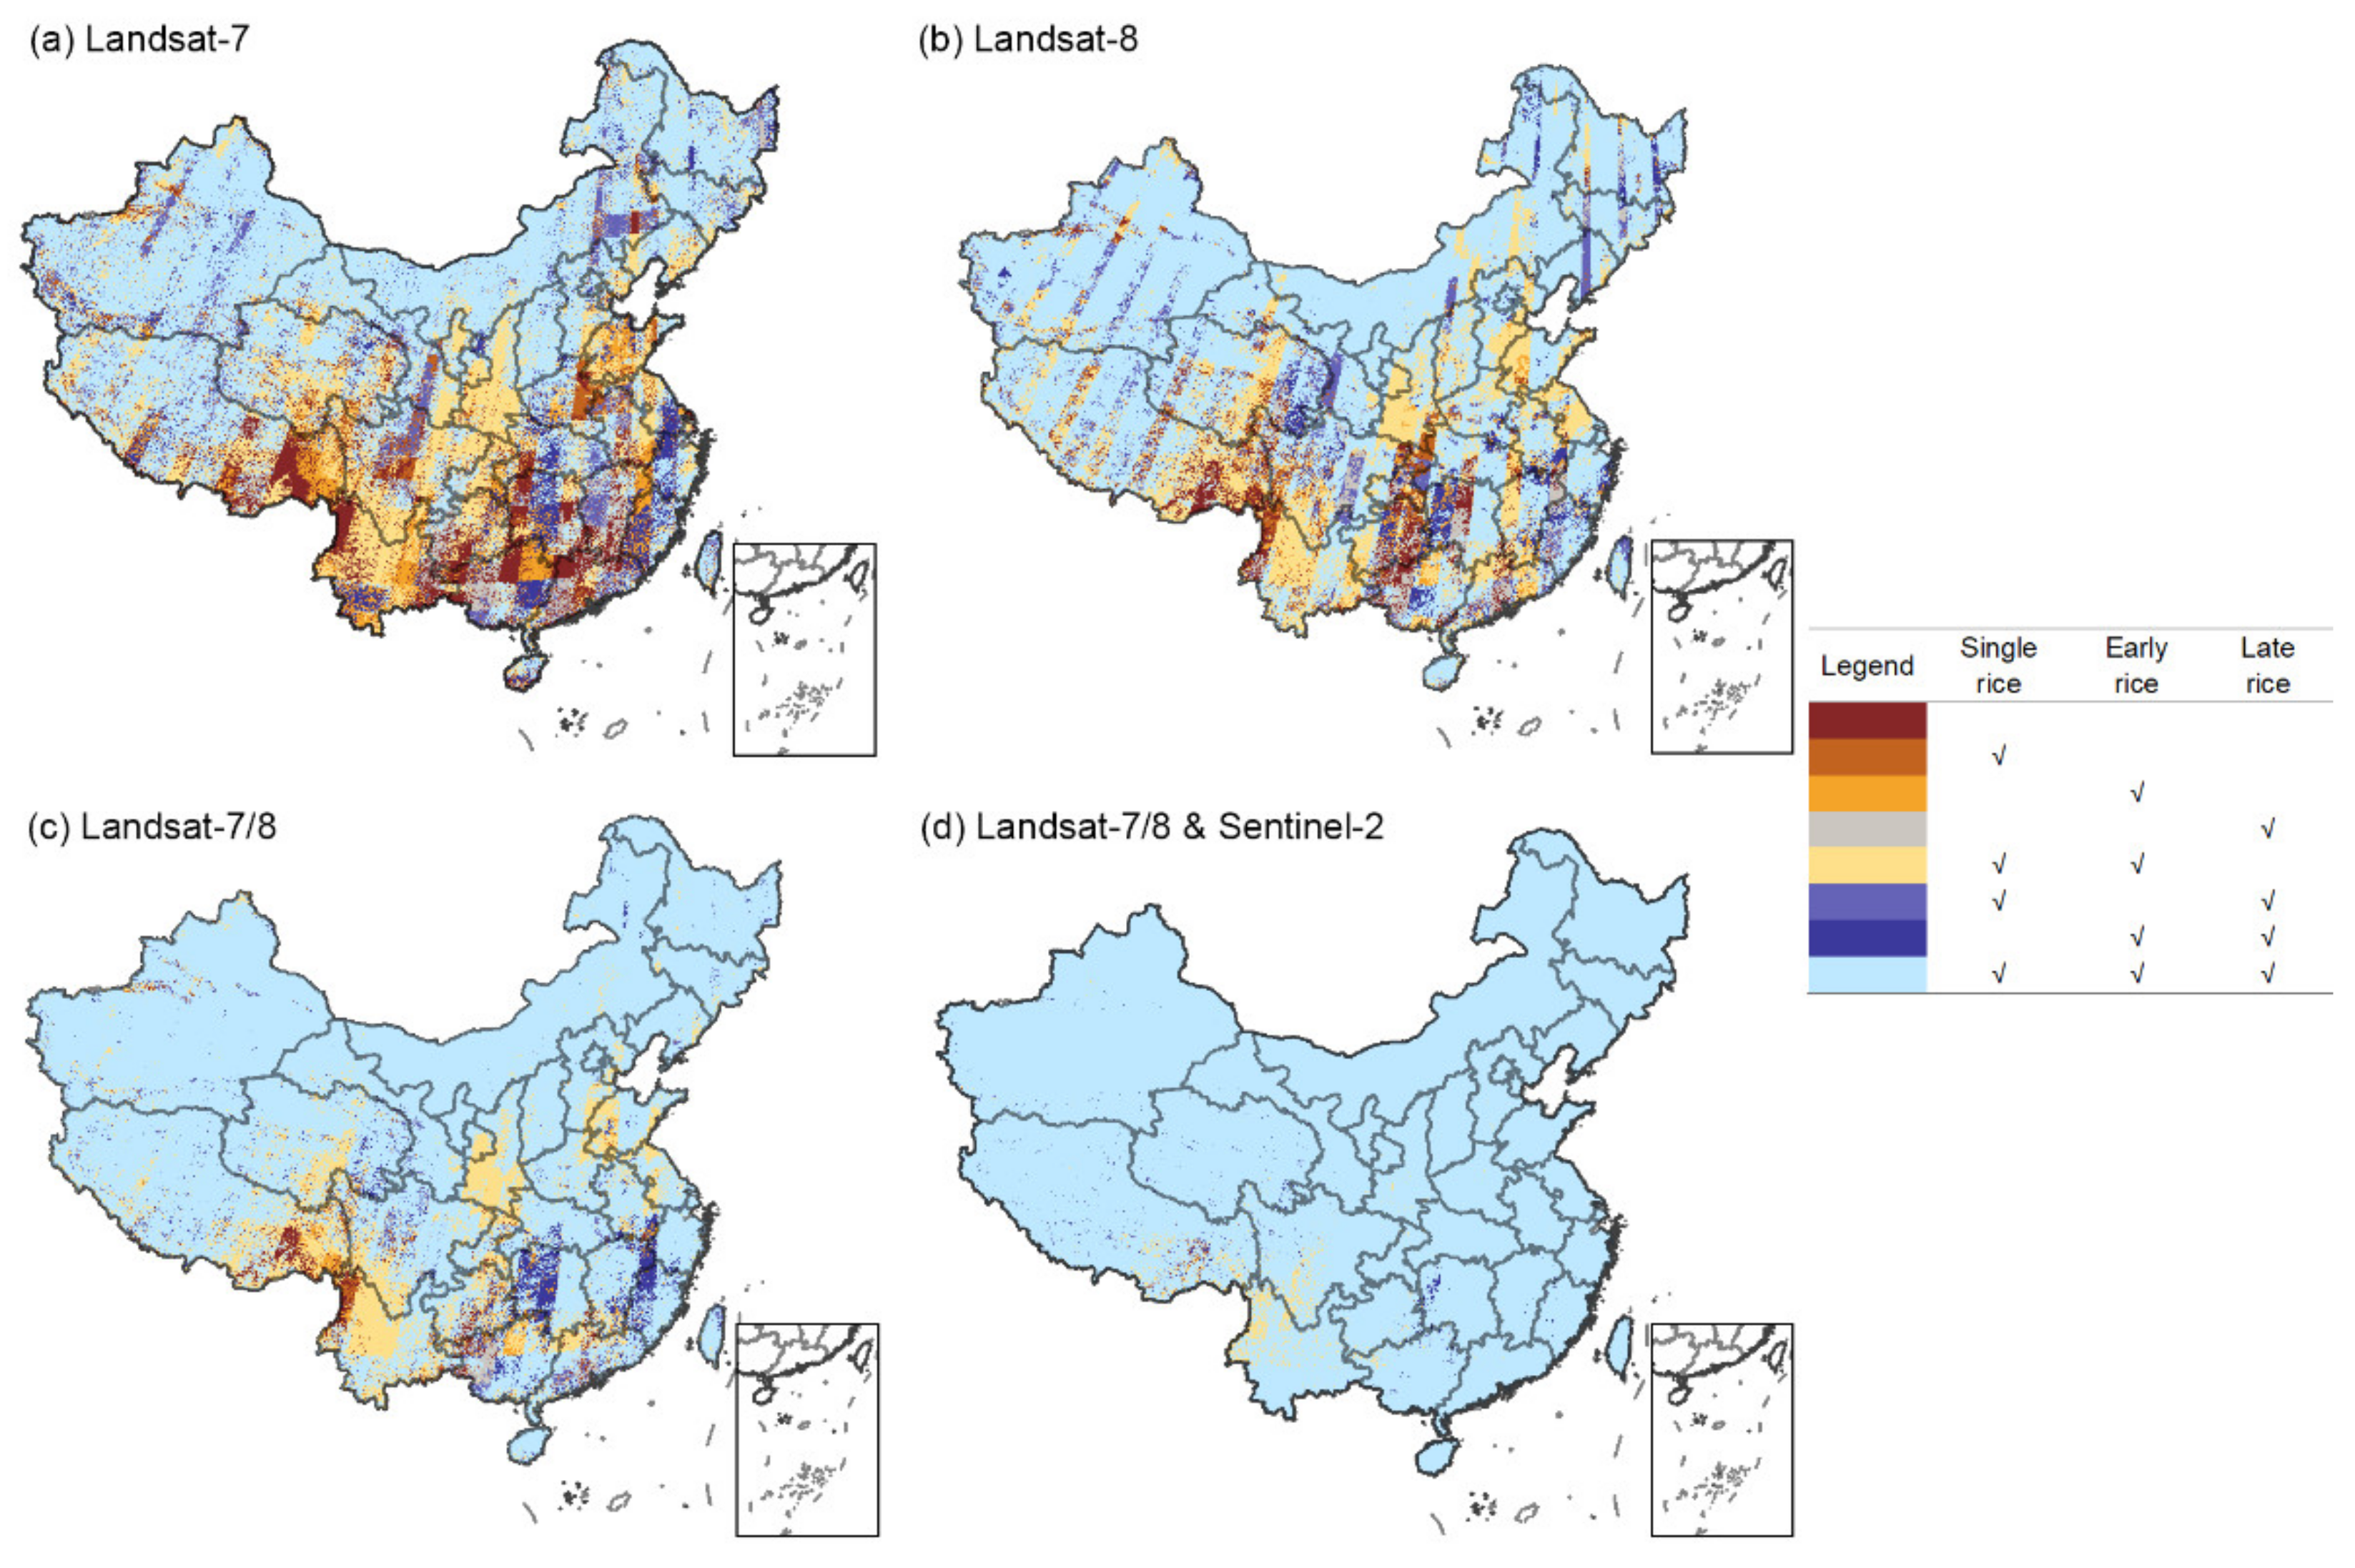
Here, we used Hunan Province as an example to showcase the effects of data availability on phenology-based single rice, early rice, and late rice mapping. As depicted in Figure 7, the valid observations from the combination of Landsat 7 and 8 can support early rice and late rice mapping in most parts of the Hunan Province, while the Sentinel-2 data are necessary for single rice mapping in this area; there are small parts of this area that do not satisfy the identifiable condition without the Sentinel-1 data (Figure 9).

4.3. Uncertainties and Implications for the Future Studies

This study only considered data availability during the rice transplanting phase for phenology-based rice mapping, which indirectly solves the classification between rice and other crops because the flooding and transplanting phase is the unique feature of paddy rice compared to others. These results were expected to provide valuable information for the increasingly widely used phenology-based rice mapping efforts. However, we did not consider data availability with respect to distinguishing rice paddies from wetlands, water bodies, and other land cover types with the same signal. Additionally, observations in other phenological phases, e.g., tillering or harvest, may play a critical role in rice mapping efforts [86,96]. These limitations should be further analyzed in future studies. We quantified three influencing factors (clouds, sidelaps, and transplanting length) for the valid observations; however, mixed pixel issues caused by field size [67,97,98], cropping pattern [66,96,99], and topography [33,100] might limit the effective use of remote sensing data as well, and therefore additional works are needed in order to comprehensively quantify these potential influencing factors.
Edaphoclimatic and crop management practices may be important conditioning factors for phenology-based crop mapping. For territorial planning purposes, there are variations in land management practices on a seasonal scale in China. Considering this, crop and land management (especially crop calendars) or edaphoclimatic conditions can vary significantly among regions. Specifically, southern China is mostly characterized by diverse land use, land management, and complex conditions; thus, e spatial clustering of the crop phenology in an area must be performed in order to develop strategies for the temporal stratification of planting/sowing dates. Many possibilities [66,101,102,103] have been discussed as potential strategies to overcome differences in crop calendars and optimize the search for available remote sensing data.
Fortunately, advanced satellite data and cloud computing technologies have emerged as potential strategies to overcome the present adversities. The harmonized Landsat and Sentinel-2 (HLS) dataset [55], a near-daily single-sensor-like surface reflectance time series, may be available in Asia in the near future. Additionally, cloud-based geospatial analysis platforms such as GEE and Amazon Web Services (AWS) include very large preprocessed databases, robust computing capability, and numerous algorithms [104]. Generally, large-scale rice mapping is promising based on the development of sufficient remote sensing data sources, robust mapping algorithm with transferability and universal applicability, and high-performance cloud platforms.

5. Conclusions

Phenology-based algorithms have been increasingly used for large-scale rice mapping, however, they are largely dependent on the availability of valid satellite observations during the flooding and rice transplanting phase. However, there are spatial and temporal differences in the availability of valid images, resulting in differences in rice mapping accuracy among different rice types and in different regions, which greatly hinders the high spatial resolution of rice mapping in large areas. Here, we assessed the feasibility of all the available Landsat and Sentinel-2 imagery for national-scale rice mapping in China. Specifically, the spatio-temporal pattern of valid observations of these three sensors (Landsat-7, Landsat-8, and Sentinel-2) and their combinations were characterized for the flooding and transplanting phase of single rice, early rice, and late rice in China in 2020. We found that the number of valid observations gradually increased with the combination of optical sensors. In addition, the number of valid observations of all sensors in northern China was greater than that in southern China, and the image quality in the flooding and transplanting phase of single rice was usually higher than that of early and late rice. Our results show that combining Landsat and Sentinel-2 observations provided 17.4 valid observations in northern China, with 8.95, 7.70, and 6.40 valid observations, respectively, for single, early, and late rice mapping in southern China. Moreover, we found that cloud cover, sidelaps, and transplanting length are the main factors influencing the spatio-temporal pattern of valid observations. The significant negative impacts of cloud cover and transplanting length are greater than the positive impacts of sidelaps. The Std. Coef. (Std. Err.) of these three factors are −0.453 (0.003), −0.547 (0.019), and 0.306 (0.094), respectively. These results are helpful in understanding the image quality during the flooding and rice transplanting phase, and can provide a guide for sensor selection during rice mapping. Most importantly, our study emphasizes the importance of cloud interference, which must be dealt with carefully when using images during the flooding and rice transplanting phase.

Supplementary Materials

The following supporting information can be downloaded at: https://www.mdpi.com/article/10.3390/rs14133134/s1, Figure S1: The relationship between site observation-based critical phenological stages of paddy rice and remote sensed flooding signal of rice paddy; Figure S2: The statistics of the start and end of flooding signal of the samples around three sites in Sanjiang Plain of northeastern China retrieved from MOD09A1 data; Figure S3: The time series of Land Surface Water Index (LSWI) and Enhanced Vegetation Index (EVI) of a paddy rice pixel from 2011 to 2020 in Sanjiang Plain of northeastern China; Table S1: The total number of available images across the entirety of China in 2018, 2019, and 2020.

Author Contributions

Conceptualization, G.Z.; methodology and formal analysis, R.L. and Y.Z.; writing—original draft preparation, review and editing, R.L., G.Z., J.D., N.Y., Y.H. and X.X. All authors have read and agreed to the published version of the manuscript.

Funding

This research was funded by the National Natural Science Foundation of China (42171115, 41871349, 81961128002).

Data Availability Statement

All the data in this study will be available through request with the corresponding author.

Conflicts of Interest

The authors declare no conflict of interest.

References

  1. Kuenzer, C.; Knauer, K. Remote sensing of rice crop areas. Int. J. Remote Sens. 2013, 34, 2101–2139. [Google Scholar] [CrossRef]
  2. Sass, R.; Cicerone, R. Photosynthate allocations in rice plants: Food production or atmospheric methane? Proc. Natl. Acad. Sci. USA 2002, 99, 11993–11995. [Google Scholar] [CrossRef] [PubMed] [Green Version]
  3. Samad, M.; Merrey, D.; Vermillion, D.; Fuchs-Carsch, M.; Mohtadullah, K.; Lenton, R. Irrigation Management Strategies for Improving the Performance of Irrigated Agriculture. Outlook Agric. 1992, 21, 279–286. [Google Scholar] [CrossRef]
  4. Rodríguez, A.; Ruiz-Ramos, M.; Palosuo, T.; Carter, T.R.; Fronzek, S.; Lorite, I.J.; Ferrise, R.; Pirttioja, N.; Bindi, M.; Baranowski, P.; et al. Implications of crop model ensemble size and composition for estimates of adaptation effects and agreement of recommendations. Agric. For. Meteorol. 2019, 264, 351–362. [Google Scholar] [CrossRef]
  5. Chen, H.; Zhu, Q.A.; Peng, C.; Wu, N.; Wang, Y.; Fang, X.; Jiang, H.; Xiang, W.; Chang, J.; Deng, X.; et al. Methane emissions from rice paddies natural wetlands, lakes in China: Synthesis new estimate. Glob. Change Biol. 2013, 19, 19–32. [Google Scholar] [CrossRef]
  6. Van Groenigen, K.J.; van Kessel, C.; Hungate, B.A. Increased greenhouse-gas intensity of rice production under future atmospheric conditions. Nat. Clim. Change 2013, 3, 288–291. [Google Scholar] [CrossRef]
  7. Li, C.; Xiao, X.; Frolking, S.; Moore, B.; Salas, W.A.; Qiu, J.; Yu, Z.; Zhuang, Y.; Wang, X.; Dai, Z.J.Q.S. Greenhouse gas emissions from croplands of China. Quat. Sci. 2003, 23, 493–550. [Google Scholar]
  8. Gilbert, M.; Golding, N.; Zhou, H.; Wint, G.R.W.; Robinson, T.P.; Tatem, A.J.; Lai, S.; Zhou, S.; Jiang, H.; Guo, D.; et al. Predicting the risk of avian influenza A H7N9 infection in live-poultry markets across Asia. Nat. Commun. 2014, 5, 4116. [Google Scholar] [CrossRef] [Green Version]
  9. Gilbert, M.; Xiao, X.; Pfeiffer, D.U.; Epprecht, M.; Boles, S.; Czarnecki, C.; Chaitaweesub, P.; Kalpravidh, W.; Minh, P.Q.; Otte, M.J.; et al. Mapping H5N1 highly pathogenic avian influenza risk in Southeast Asia. Proc. Natl. Acad. Sci. USA 2008, 105, 4769. [Google Scholar] [CrossRef] [Green Version]
  10. FAO. The State of Food and Agriculture 2021. Making Agrifood Systems More Resilient to Shocks and Stresses; FAO: Rome, Italy, 2021. [Google Scholar] [CrossRef]
  11. Muthayya, S.; Hall, J.; Bagriansky, J.; Sugimoto, J.; Gundry, D.; Matthias, D.; Prigge, S.; Hindle, P.; Moench-Pfanner, R.; Maberly, G. Rice Fortification: An Emerging Opportunity to Contribute to the Elimination of Vitamin and Mineral Deficiency Worldwide. Food Nutr. Bull. 2012, 33, 296–307. [Google Scholar] [CrossRef]
  12. Zhang, X.; Wang, D.; Fang, F.; Zhen, Y.; Liao, X. Food safety and rice production in China. Res. Agric. Moderniz. 2005, 26, 85–88. [Google Scholar]
  13. Cai, Y.; Lin, H.; Zhang, M. Mapping paddy rice by the object-based random forest method using time series Sentinel-1/Sentinel-2 data. Adv. Space Res. 2019, 64, 2233–2244. [Google Scholar] [CrossRef]
  14. Xiao, X.M.; Boles, S.; Liu, J.Y.; Zhuang, D.F.; Frolking, S.; Li, C.S.; Salas, W.; Moore, B. Mapping paddy rice agriculture in southern China using multi-temporal MODIS images. Remote Sens. Environ. 2005, 95, 480–492. [Google Scholar] [CrossRef]
  15. Zhang, M.; Lin, H. Object-based rice mapping using time-series and phenological data. Adv. Space Res. 2019, 63, 190–202. [Google Scholar] [CrossRef]
  16. Zhou, Y.; Xiao, X.; Qin, Y.; Dong, J.; Zhang, G.; Kou, W.; Jin, C.; Wang, J.; Li, X. Mapping paddy rice planting area in rice-wetland coexistent areas through analysis of Landsat 8 OLI and MODIS images. Int. J. Appl. Earth Obs. Geoinf. 2016, 46, 1–12. [Google Scholar] [CrossRef] [Green Version]
  17. Zhang, X.; Wu, B.; Ponce-Campos, G.E.; Zhang, M.; Chang, S.; Tian, F. Mapping up-to-Date Paddy Rice Extent at 10 M Resolution in China through the Integration of Optical and Synthetic Aperture Radar Images. Remote Sens. 2018, 10, 1200. [Google Scholar] [CrossRef] [Green Version]
  18. Xu, X.; Ji, X.; Jiang, J.; Yao, X.; Tian, Y.; Zhu, Y.; Cao, W.; Cao, Q.; Yang, H.; Shi, Z.; et al. Evaluation of One-Class Support Vector Classification for Mapping the Paddy Rice Planting Area in Jiangsu Province of China from Landsat 8 OLI Imagery. Remote Sens. 2018, 10, 546. [Google Scholar] [CrossRef] [Green Version]
  19. Qiu, B.; Lu, D.; Tang, Z.; Chen, C.; Zou, F. Automatic and adaptive paddy rice mapping using Landsat images: Case study in Songnen Plain in Northeast China. Sci. Total Environ. 2017, 598, 581–592. [Google Scholar] [CrossRef]
  20. Dong, J.; Xiao, X.; Sensing, R. Evolution of regional to global paddy rice mapping methods: A review. ISPRS J. Photogramm. Remote Sens. 2016, 119, 214–227. [Google Scholar] [CrossRef] [Green Version]
  21. Xiao, X.; Boles, S.; Frolking, S.; Salas, W.; Moore Iii, B.; Li, C.; He, L.; Zhao, R. Observation of flooding and rice transplanting of paddy rice fields at the site to landscape scales in China using VEGETATION sensor data. Int. J. Remote Sens. 2002, 23, 3009–3022. [Google Scholar] [CrossRef]
  22. De Datta, S.K. Principles and Practices of Rice Production; John and Wiley and Sons: Hoboken, NJ, USA, 1981. [Google Scholar]
  23. Cabangon, R.J.; Tuong, T.P. Management of cracked soils for water saving during land preparation for rice cultivation. Soil Tillage Res. 2000, 56, 105–116. [Google Scholar] [CrossRef]
  24. Clauss, K.; Ottinger, M.; Leinenkugel, P.; Kuenzer, C. Estimating rice production in the Mekong Delta, Vietnam, utilizing time series of Sentinel-1 SAR data. Int. J. Appl. Earth Obs. Geoinf. 2018, 73, 574–585. [Google Scholar] [CrossRef]
  25. Qin, Y.; Xiao, X.; Dong, J.; Zhou, Y.; Zhu, Z.; Zhang, G.; Du, G.; Jin, C.; Kou, W.; Wang, J.; et al. Mapping paddy rice planting area in cold temperate climate region through analysis of time series Landsat 8 (OLI), Landsat 7 (ETM+) and MODIS imagery. ISPRS J. Photogramm. Remote Sens. 2015, 105, 220–233. [Google Scholar] [CrossRef] [Green Version]
  26. Zhang, G.; Xiao, X.; Dong, J.; Kou, W.; Jin, C.; Qin, Y.; Zhou, Y.; Wang, J.; Menarguez, M.A.; Biradar, C.; et al. Mapping paddy rice planting areas through time series analysis of MODIS land surface temperature and vegetation index data. ISPRS J. Photogramm. Remote Sens. 2015, 106, 157–171. [Google Scholar] [CrossRef] [PubMed] [Green Version]
  27. Dong, J.W.; Xiao, X.M.; Menarguez, M.A.; Zhang, G.L.; Qin, Y.W.; Thau, D.; Biradar, C.; Moore, B. Mapping paddy rice planting area in northeastern Asia with Landsat 8 images, phenology-based algorithm and Google Earth Engine. Remote Sens. Environ. 2016, 185, 142–154. [Google Scholar] [CrossRef] [Green Version]
  28. Xiao, X.; Boles, S.; Frolking, S.; Li, C.; Babu, J.Y.; Salas, W.; Moore, B. Mapping paddy rice agriculture in South and Southeast Asia using multi-temporal MODIS images. Remote Sens. Environ. 2006, 100, 95–113. [Google Scholar] [CrossRef]
  29. Sun, H.-S.; Huang, J.-F.; Huete, A.R.; Peng, D.-L.; Zhang, F. Mapping paddy rice with multi-date moderate-resolution imaging spectroradiometer (MODIS) data in China. J. Zhejiang Univ. Sci. A 2009, 10, 1509–1522. [Google Scholar] [CrossRef]
  30. Sakamoto, T.; Van Phung, C.; Kotera, A.; Nguyen, K.D.; Yokozawa, M. Analysis of rapid expansion of inland aquaculture and triple rice-cropping areas in a coastal area of the Vietnamese Mekong Delta using MODIS time-series imagery. Landsc. Urban Plan. 2009, 92, 34–46. [Google Scholar] [CrossRef]
  31. Kontgis, C.; Schneider, A.; Ozdogan, M. Mapping rice paddy extent and intensification in the Vietnamese Mekong River Delta with dense time stacks of Landsat data. Remote Sens Env. 2015, 169, 255–269. [Google Scholar] [CrossRef]
  32. Nelson, A.; Gumma, M.K. A Map of Lowland Rice Extent in the Major Rice Growing Countries of Asia; IRRI: Los Banos, Philippines, 2015; Volume 37. [Google Scholar]
  33. Zhang, G.; Xiao, X.; Biradar, C.M.; Dong, J.; Qin, Y.; Menarguez, M.A.; Zhou, Y.; Zhang, Y.; Jin, C.; Wang, J.; et al. Spatiotemporal patterns of paddy rice croplands in China and India from 2000 to 2015. Sci. Total Environ. 2017, 579, 82–92. [Google Scholar] [CrossRef]
  34. Zhang, G.; Xiao, X.; Dong, J.; Xin, F.; Zhang, Y.; Qin, Y.; Doughty, R.B.; Moore, B. Fingerprint of rice paddies in spatial-temporal dynamics of atmospheric methane concentration in monsoon Asia. Nat. Commun. 2020, 11, 554. [Google Scholar] [CrossRef] [PubMed] [Green Version]
  35. Tan, M.; Robinson, G.M.; Li, X.; Xin, L. Spatial and temporal variability of farm size in China in context of rapid urbanization. Chin. Geogr. Sci. 2013, 23, 607–619. [Google Scholar] [CrossRef] [Green Version]
  36. Hermosilla, T.; Wulder, M.A.; White, J.C.; Coops, N.C.; Hobart, G.W.; Campbell, L.B. Mass data processing of time series Landsat imagery: Pixels to data products for forest monitoring. Int. J. Digit. Earth 2016, 9, 1035–1054. [Google Scholar] [CrossRef] [Green Version]
  37. White, J.C.; Wulder, M.A. The Landsat observation record of Canada: 1972–2012. Can. J. Remote Sens. 2014, 39, 455–467. [Google Scholar] [CrossRef]
  38. Wulder, M.A.; White, J.C.; Loveland, T.R.; Woodcock, C.E.; Belward, A.S.; Cohen, W.B.; Fosnight, E.A.; Shaw, J.; Masek, J.G.; Roy, D.P. The global Landsat archive: Status, consolidation, and direction. Remote Sens. Environ. 2016, 185, 271–283. [Google Scholar] [CrossRef] [Green Version]
  39. Markham, B.L.; Helder, D.L. Forty-year calibrated record of earth-reflected radiance from Landsat: A review. Remote Sens. Environ. 2012, 122, 30–40. [Google Scholar] [CrossRef] [Green Version]
  40. Dong, J.; Xiao, X.; Kou, W.; Qin, Y.; Zhang, G.; Li, L.; Jin, C.; Zhou, Y.; Wang, J.; Biradar, C.; et al. Tracking the dynamics of paddy rice planting area in 1986–2010 through time series Landsat images and phenology-based algorithms. Remote Sens. Environ. 2015, 160, 99–113. [Google Scholar] [CrossRef]
  41. Wang, J.; Xiao, X.; Qin, Y.; Dong, J.; Zhang, G.; Kou, W.; Jin, C.; Zhou, Y.; Zhang, Y. Mapping paddy rice planting area in wheat-rice double-cropped areas through integration of Landsat-8 OLI, MODIS and PALSAR images. Sci. Rep. 2015, 5, 1–11. [Google Scholar] [CrossRef] [PubMed] [Green Version]
  42. Zhang, Q.; Yuan, Q.; Li, J.; Li, Z.; Shen, H.; Zhang, L. Thick cloud and cloud shadow removal in multitemporal imagery using progressively spatio-temporal patch group deep learning. ISPRS J. Photogramm. Remote Sens. 2020, 162, 148–160. [Google Scholar] [CrossRef]
  43. Liu, L.; Xiao, X.; Qin, Y.; Wang, J.; Xu, X.; Hu, Y.; Qiao, Z. Mapping cropping intensity in China using time series Landsat and Sentinel-2 images and Google Earth Engine. Remote Sens. Environ. 2020, 239, 111624. [Google Scholar] [CrossRef]
  44. Ju, J.; Roy, D.P. The availability of cloud-free Landsat ETM+ data over the conterminous United States and globally. Remote Sens. Environ. 2008, 112, 1196–1211. [Google Scholar] [CrossRef]
  45. Li, J.; Roy, D.P. A Global Analysis of Sentinel-2A, Sentinel-2B and Landsat-8 Data Revisit Intervals and Implications for Terrestrial Monitoring. Remote Sens. 2017, 9, 902. [Google Scholar] [CrossRef] [Green Version]
  46. Zhu, Z.; Woodcock, C.E. Continuous change detection and classification of land cover using all available Landsat data. Remote Sens. Environ. 2014, 144, 152–171. [Google Scholar] [CrossRef] [Green Version]
  47. Sishodia, R.P.; Ray, R.L.; Singh, S.K. Applications of remote sensing in precision agriculture: A review. Remote Sens. 2020, 12, 3136. [Google Scholar] [CrossRef]
  48. Liu, J.; Kuang, W.; Zhang, Z.; Xu, X.; Qin, Y.; Ning, J.; Zhou, W.; Zhang, S.; Li, R.; Yan, C.; et al. Spatiotemporal characteristics, patterns, and causes of land-use changes in China since the late 1980s. J. Geogr. Sci. 2014, 24, 195–210. [Google Scholar] [CrossRef]
  49. Qiu, B.; Qi, W.; Tang, Z.; Chen, C.; Wang, X. Rice cropping density and intensity lessened in southeast China during the twenty-first century. Environ. Monit. Assess. 2015, 188, 5. [Google Scholar] [CrossRef]
  50. Jiang, M.; Xin, L.; Li, X.; Tan, M.; Wang, R. Decreasing Rice Cropping Intensity in Southern China from 1990 to 2015. Remote Sens. 2019, 11, 35. [Google Scholar] [CrossRef] [Green Version]
  51. Li, S.; Li, X.; Sun, L.; Cao, G.; Fischer, G.; Tramberend, S. An estimation of the extent of cropland abandonment in mountainous regions of China. Land Degrad. Dev. 2018, 29, 1327–1342. [Google Scholar] [CrossRef]
  52. Cheng, Y.; Wang, X.; Guo, J.; Zhao, Y.; Huang, J. The temporal-spatial dynamic analysis of China rice production. Sci. Agric. Sin. 2012, 45, 3473–3485. [Google Scholar]
  53. Dong, J.; Liu, J.; Tao, F.; Xu, X.; Wang, J. Spatio-temporal changes in annual accumulated temperature in China and the effects on cropping systems, 1980s to 2000. Clim. Res. 2009, 40, 37–48. [Google Scholar] [CrossRef]
  54. Dwyer, J.L.; Roy, D.P.; Sauer, B.; Jenkerson, C.B.; Zhang, H.K.; Lymburner, L. Analysis Ready Data: Enabling Analysis of the Landsat Archive. Remote Sens. 2018, 10, 1363. [Google Scholar] [CrossRef]
  55. Claverie, M.; Ju, J.; Masek, J.G.; Dungan, J.L.; Vermote, E.F.; Roger, J.-C.; Skakun, S.V.; Justice, C. The Harmonized Landsat and Sentinel-2 surface reflectance data set. Remote Sens. Environ. 2018, 219, 145–161. [Google Scholar] [CrossRef]
  56. Zhu, Z.; Woodcock, C.E. Object-based cloud and cloud shadow detection in Landsat imagery. Remote Sens. Environ. 2012, 118, 83–94. [Google Scholar] [CrossRef]
  57. Zhu, Z.; Wang, S.; Woodcock, C.E. Improvement and expansion of the Fmask algorithm: Cloud, cloud shadow, and snow detection for Landsats 4–7, 8, and Sentinel 2 images. Remote Sens. Environ. 2015, 159, 269–277. [Google Scholar] [CrossRef]
  58. Qiu, S.; Zhu, Z.; He, B. Fmask 4.0: Improved cloud and cloud shadow detection in Landsats 4-8 and Sentinel-2 imagery. Remote Sens. Environ. 2019, 231, 111205. [Google Scholar] [CrossRef]
  59. DeVries, B.; Huang, C.; Armston, J.; Huang, W.; Jones, J.W.; Lang, M.W. Rapid and robust monitoring of flood events using Sentinel-1 and Landsat data on the Google Earth Engine. Remote Sens. Environ. 2020, 240, 111664. [Google Scholar] [CrossRef]
  60. Diem, P.; Diem, N.; Hung, H. Assessment of the Efficiency of Using Modis MCD43A4 in Mapping of Rice Planting Calendar in the Mekong Delta. In IOP Conference Series: Earth and Environmental Science; IOP Publishing Ltd.: Bristol, UK, 2021; p. 012015. [Google Scholar]
  61. Zhang, S.; Tao, F.; Zhang, Z. Rice reproductive growth duration increased despite of negative impacts of climate warming across China during 1981–2009. Eur. J. Agron. 2014, 54, 70–83. [Google Scholar] [CrossRef]
  62. Tao, F.; Zhang, Z.; Shi, W.; Liu, Y.; Xiao, D.; Zhang, S.; Zhu, Z.; Wang, M.; Liu, F. Single rice growth period was prolonged by cultivars shifts, but yield was damaged by climate change during 1981–2009 in China, and late rice was just opposite. Glob. Change Biol. 2013, 19, 3200–3209. [Google Scholar] [CrossRef]
  63. Hou, W.; Geng, T.; Chen, Q.; Chen, C. Impacts of climate warming on growth period and yield of rice in Northeast China during recent two decades. Chin. J. Appl. Ecol. 2015, 26, 249–259. [Google Scholar] [CrossRef]
  64. Whitcraft, A.K.; Becker-Reshef, I.; Justice, C.O. Agricultural growing season calendars derived from MODIS surface reflectance. Int. J. Digit. Earth 2015, 8, 173–197. [Google Scholar] [CrossRef]
  65. Mei, F.; Wu, X.; Yao, C.; Li, L.; Wang, L.; Chen, Q. Rice cropping regionalization in China. Chin. J. Rice Sci. 1988, 2, 97–110. [Google Scholar]
  66. Yingli, H.; Jinwei, D.; Xiaoyong, L.; Li, S.; Zhipan, W.; Nanshan, Y.; Zhichao, L.; Ping, F. Examining rice distribution and cropping intensity in a mixed single- and double-cropping region in South China using all available Sentinel 1/2 images. Int. J. Appl. Earth Obs. Geoinf. 2021, 101, 102351. [Google Scholar]
  67. Fritz, S.; See, L.; McCallum, I.; You, L.; Bun, A.; Moltchanova, E.; Duerauer, M.; Albrecht, F.; Schill, C.; Perger, C.; et al. Mapping global cropland and field size. Glob. Change Biol. 2015, 21, 1980–1992. [Google Scholar] [CrossRef] [PubMed]
  68. Zheng, J.; Wang, W.; Liu, G.; Ding, Y.; Cao, X.; Chen, D.; Engel, B.A. Towards quantification of the national water footprint in rice production of China: A first assessment from the perspectives of single-double rice. Sci. Total Environ. 2020, 739, 140032. [Google Scholar] [CrossRef] [PubMed]
  69. Jiang, T.; Liu, X.; Wu, L. Method for Mapping Rice Fields in Complex Landscape Areas Based on Pre-Trained Convolutional Neural Network from HJ-1 A/B Data. ISPRS Int. J. Geo-Inf. 2018, 7, 418. [Google Scholar] [CrossRef] [Green Version]
  70. Arvidson, T.; Goward, S.; Gasch, J.; Williams, D. Landsat-7 long-term acquisition plan: Development and validation. Photogramm. Eng. Remote Sens. 2006, 72, 1137–1146. [Google Scholar] [CrossRef]
  71. Farr, T.G.; Rosen, P.A.; Caro, E.; Crippen, R.; Duren, R.; Hensley, S.; Kobrick, M.; Paller, M.; Rodriguez, E.; Roth, L.; et al. The shuttle radar topography mission. Rev. Geophys. 2007, 45, 1–33. [Google Scholar] [CrossRef] [Green Version]
  72. Coluzzi, R.; Imbrenda, V.; Lanfredi, M.; Simoniello, T. A first assessment of the Sentinel-2 Level 1-C cloud mask product to support informed surface analyses. Remote Sens. Environ. 2018, 217, 426–443. [Google Scholar] [CrossRef]
  73. Raspini, F.; Bianchini, S.; Ciampalini, A.; Del Soldato, M.; Solari, L.; Novali, F.; Del Conte, S.; Rucci, A.; Ferretti, A.; Casagli, N. Continuous, semi-automatic monitoring of ground deformation using Sentinel-1 satellites. Sci. Rep. 2018, 8, 1–11. [Google Scholar] [CrossRef] [Green Version]
  74. USGS. Landsat 8 (L8) Data Users Handbook. 2019. Available online: https://www.usgs.gov/landsat-missions/landsat-8-data-users-handbook (accessed on 27 December 2019).
  75. USGS. Landsat 7 (L7) Data Users Handbook. 2019. Available online: https://www.usgs.gov/landsat-missions/landsat-7-data-users-handbook (accessed on 5 December 2019).
  76. ESA. Sentinel-2 User Handbook. 2015. Available online: https://sentinels.copernicus.eu/web/sentinel/user-guides (accessed on 24 July 2015).
  77. Oshan, T.M.; Li, Z.; Kang, W.; Wolf, L.J.; Fotheringham, A.S. Mgwr: A Python Implementation of Multiscale Geographically Weighted Regression for Investigating Process Spatial Heterogeneity and Scale. ISPRS Int. J. Geo-Inf. 2019, 8, 269. [Google Scholar] [CrossRef] [Green Version]
  78. Mollalo, A.; Vahedi, B.; Rivera, K.M. GIS-based spatial modeling of COVID-19 incidence rate in the continental United States. Sci. Total Environ. 2020, 728, 138884. [Google Scholar] [CrossRef] [PubMed]
  79. Yuan, K.-H.; Chan, W. Biases and Standard Errors of Standardized Regression Coefficients. Psychometrika 2011, 76, 670–690. [Google Scholar] [CrossRef] [PubMed]
  80. Sun, W.; Huang, Y. Global warming over the period 1961–2008 did not increase high-temperature stress but did reduce low-temperature stress in irrigated rice across China. Agric. For. Meteorol. 2011, 151, 1193–1201. [Google Scholar] [CrossRef]
  81. Li, P.; Feng, Z.; Xiao, C. Acquisition probability differences in cloud coverage of the available Landsat observations over mainland Southeast Asia from 1986 to 2015. Int. J. Digit. Earth 2018, 11, 437–450. [Google Scholar] [CrossRef]
  82. Peng, D. The Study on the Method of Rice Yield Estimation Using Statistical and MODIS Data; Zhejiang Univisity: Hangzhou, China, 2009. [Google Scholar]
  83. Peng, D.; Huete, A.R.; Huang, J.; Wang, F.; Sun, H. Detection and estimation of mixed paddy rice cropping patterns with MODIS data. Int. J. Appl. Earth Obs. Geoinf. 2011, 13, 13–23. [Google Scholar] [CrossRef]
  84. Shi, J.-J.; Huang, J.-F.; Zhang, F. Multi-year monitoring of paddy rice planting area in Northeast China using MODIS time series data. J. Zhejiang Univ. Sci. B 2013, 14, 934–946. [Google Scholar] [CrossRef] [Green Version]
  85. Xiao, C.; Li, P.; Feng, Z.; Wu, X. Spatio-temporal differences in cloud cover of Landsat-8 OLI observations across China during 2013–2016. J. Geogr. Sci. 2018, 28, 429–444. [Google Scholar] [CrossRef] [Green Version]
  86. Qiu, B.; Li, W.; Tang, Z.; Chen, C.; Qi, W. Mapping paddy rice areas based on vegetation phenology and surface moisture conditions. Ecol. Indic. 2015, 56, 79–86. [Google Scholar] [CrossRef]
  87. Cabangon, R.J.; Tuong, T.P.; Abdullah, N.B. Comparing water input and water productivity of transplanted and direct-seeded rice production systems. Agric. Water Manag. 2002, 57, 11–31. [Google Scholar] [CrossRef]
  88. Bhuiyan, S.I.; Sattar, M.A.; Khan, M.A.K. Improving water use efficiency in rice irrigation through wet-seeding. Irrig. Sci. 1995, 16, 1–8. [Google Scholar] [CrossRef]
  89. Fikriyah, V.N.; Darvishzadeh, R.; Laborte, A.; Khan, N.I.; Nelson, A. Discriminating transplanted and direct seeded rice using Sentinel-1 intensity data. Int. J. Appl. Earth Obs. Geoinf. 2019, 76, 143–153. [Google Scholar] [CrossRef] [Green Version]
  90. Whitcraft, A.K.; Becker-Reshef, I.; Justice, C.O. A Framework for Defining Spatially Explicit Earth Observation Requirements for a Global Agricultural Monitoring Initiative (GEOGLAM). Remote Sens. 2015, 7, 1461–1481. [Google Scholar] [CrossRef] [Green Version]
  91. Singh Parihar, J.; Justice, C.; Soares, J.; Leo, O.; Kosuth, P.; Jarvis, I.; Williams, D.; Bingfang, W.; Latham, J.; Becker-Reshef, I. GEO-GLAM: A GEOSS-G20 initiative on global agricultural monitoring. 39th COSPAR Sci. Assem. 2012, 39, 1451. [Google Scholar]
  92. Wulder, M.A.; White, J.C.; Masek, J.G.; Dwyer, J.; Roy, D.P. Continuity of Landsat observations: Short term considerations. Remote Sens. Environ. 2011, 115, 747–751. [Google Scholar] [CrossRef] [Green Version]
  93. Shao, Y.; Fan, X.; Liu, H.; Xiao, J.; Ross, S.; Brisco, B.; Brown, R.; Staples, G. Rice monitoring and production estimation using multitemporal RADARSAT. Remote Sens. Environ. 2001, 76, 310–325. [Google Scholar] [CrossRef]
  94. Asilo, S.; De Bie, K.; Skidmore, A.; Nelson, A.; Barbieri, M.; Maunahan, A. Complementarity of Two Rice Mapping Approaches: Characterizing Strata Mapped by Hypertemporal MODIS and Rice Paddy Identification Using Multitemporal SAR. Remote Sens. 2014, 6, 12789–12814. [Google Scholar] [CrossRef] [Green Version]
  95. Zhan, P.; Zhu, W.; Li, N. An automated rice mapping method based on flooding signals in synthetic aperture radar time series. Remote Sens. Environ. 2021, 252, 112112. [Google Scholar] [CrossRef]
  96. Cao, J.J.; Cai, X.L.; Tan, J.W.; Cui, Y.L.; Xie, H.W.; Liu, F.P.; Yang, L.; Luo, Y.F. Mapping paddy rice using Landsat time series data in the Ganfu Plain irrigation system, Southern China, from 1988–2017. Int. J. Remote Sens. 2021, 42, 1556–1576. [Google Scholar] [CrossRef]
  97. Vajsová, B.; Fasbender, D.; Wirnhardt, C.; Lemajic, S.; Devos, W. Assessing Spatial Limits of Sentinel-2 Data on Arable Crops in the Context of Checks by Monitoring. Remote Sens. 2020, 12, 2195. [Google Scholar] [CrossRef]
  98. Singha, M.; Dong, J.; Zhang, G.; Xiao, X. High resolution paddy rice maps in cloud-prone Bangladesh and Northeast India using Sentinel-1 data. Sci. Data 2019, 6, 26. [Google Scholar] [CrossRef]
  99. Tian, H.; Wu, M.; Wang, L.; Niu, Z. Mapping Early, Middle and Late Rice Extent Using Sentinel-1A and Landsat-8 Data in the Poyang Lake Plain, China. Sensors 2018, 18, 185. [Google Scholar] [CrossRef] [PubMed] [Green Version]
  100. Di, Y.; Zhang, G.; You, N.; Yang, T.; Zhang, Q.; Liu, R.; Doughty, R.B.; Zhang, Y. Mapping Croplands in the Granary of the Tibetan Plateau Using All Available Landsat Imagery, A Phenology-Based Approach, and Google Earth Engine. Remote Sens. 2021, 13, 2289. [Google Scholar] [CrossRef]
  101. Li, J.; Lei, H. Tracking the spatio-temporal change of planting area of winter wheat-summer maize cropping system in the North China Plain during 2001–2018. Comput. Electron. Agric. 2021, 187, 106222. [Google Scholar] [CrossRef]
  102. Chaves, M.E.D.; Soares, A.R.; Sanches, I.D.; Fronza, J.G. CBERS data cubes for land use and land cover mapping in the Brazilian Cerrado agricultural belt. Int. J. Remote Sens. 2021, 42, 8398–8432. [Google Scholar] [CrossRef]
  103. Liu, C.; Zhang, Q.; Tao, S.; Qi, J.; Ding, M.; Guan, Q.; Wu, B.; Zhang, M.; Nabil, M.; Tian, F.; et al. A new framework to map fine resolution cropping intensity across the globe: Algorithm, validation, and implication. Remote Sens. Environ. 2020, 251, 112095. [Google Scholar] [CrossRef]
  104. Gorelick, N.; Hancher, M.; Dixon, M.; Ilyushchenko, S.; Thau, D.; Moore, R. Google Earth Engine: Planetary-scale geospatial analysis for everyone. Remote Sens. Environ. 2017, 202, 18–27. [Google Scholar] [CrossRef]
Figure 1. The relationship between site observation-based critical phenological stages of paddy rice and remote sensed flooding signals of rice paddies. The left figure shows the seasonal dynamics of the Enhanced Vegetation Index (EVI) and Land Surface Water Index (LSWI) of rice paddies (132.234°E, 46.192°N) near one agricultural meteorological site (Baoqing site) in Sanjiang Plain, northeastern China, which were obtained from MOD09A1. In the left figure, the brown arrows mean the difference between the site-observed transplanting and tillering periods and the start and end of the flooding signal retrieved from the MOD09A1 data: (1) flooding phase; (2) flooded/open-canopy phase; (3) closed canopy phase; and (4) post-harvest phase. The right image shows a corresponding landscape for a rice paddy point from Google Earth in 2011.
Remotesensing 14 03134 g001
Figure 2. Distribution of in situ observed transplanting and tillering dates of (a) single rice, (b) early rice, and (c) late rice. The areas with single rice, early rice, and late rice are divided into two regions by the 35°N, 24°N, and 24°N latitude lines respectively. The flooding and rice transplanting windows of single rice (d), early rice (e), and late rice (f) were identified according to observations (ac). The numbers near the black dashed boxes show the start and end dates of the flooding and rice transplanting windows according to in situ observed phenology data for 2011–2013.
Remotesensing 14 03134 g002
Figure 3. Spatial distributions of valid Landsat and Sentinel observations during the flooding and rice transplanting period of: (a) single rice, (b) early rice, and (c) late rice across China in 2020; (d) shows the average number of valid observations (bars) and the percentage of identifiable rice pixels (lines with symbols) with various combinations. It should be noted that although northern China is not suitable for planting early and late rice due to insufficient accumulated temperature, we show the valid observations during the periods with flooding signals of early rice and late rice in this region in order to fully demonstrate the distribution of valid observations across China.
Remotesensing 14 03134 g003
Figure 4. Observation availability of the six main rice cultivation areas in China. (a) The main rice cultivation areas with in situ phenology observation sites: Ⅰ, single rice in northeast China; Ⅱ1, single rice in the Sichuan Basin; Ⅱ2, single rice in the mid-lower Yangtze River Valley; Ⅲ, single rice in the Yunnan–Guizhou Plateau; Ⅳ, double rice in the mid-Yangtze River Valley; Ⅴ, double rice in southern China. (b) The percentages of identifiable rice paddy pixels with different sensors and combinations in each main rice cultivation area in China. A, B, C, and D at the x axis represent Landsat-7, Landsat-8, Landsat-7 and 8, and Landsat-7 and 8 with Sentinel-2, respectively. (c) The average number of total and valid observations during the flooding and rice transplanting period of single rice (the first bar), early rice (the second bar), and late rice (the third bar) for various sensors. The plus sign represents the median of valid observations of all pixels under the combination of all three sensors in each region.
Remotesensing 14 03134 g004
Figure 5. The spatial distributions and the average number of valid Landsat-8 observations (a,d), cloud (b,e), and overlap (c,f) during the period with flooding signals of single rice, early rice, and late rice at 1° × 1° grids; (g) shows the start, end, and length of the time window with flooding signals of rice paddies as determined in Section 3.1. The insets in (a–c) are the corresponding frequency diagrams.
Remotesensing 14 03134 g005
Figure 6. Relationships between spatial valid observations and (a) cloud and (b) overlap. Data are based on the statistic of three variables of these three rice types at 1° × 1° grid.
Remotesensing 14 03134 g006
Figure 7. Spatial patterns of rice types identifiable by different sensors and combinations in China: (ad) represent Landsat-7, Landsat-8, Landsat-7 and 8, and Landsat-7 and 8 with Sentinel-2, respectively.
Remotesensing 14 03134 g007
Figure 8. Spatial patterns of different sensors and their combinations for meeting the requirements of remote sensed identification of (a) single rice, (b) early rice, and (c) late rice.
Remotesensing 14 03134 g008
Figure 9. Guide to the best and most suitable satellite selection for (a) single rice, (b) early rice, and (c) late rice mapping. We considered the existing common remote sensing data, future conceived satellite sensors, and their combinations. L7, Landsat-7; L8, Landsat-8; S1, Sentinel 1; S2, Sentinel 2; C1, Landsat-7 and Landsat-8; C2, Sentinel-1 and Sentinel-2; C3, Landsat-7, Landsat-8, and Sentinel-2; C4, Landsat-7, Landsat-8, Sentinel-1, and Sentinel-2.
Remotesensing 14 03134 g009
Table 1. Relationships between valid observations and clouds, sidelaps, and transplanting length in China based on Ordinary Least Squares (OLS) regression models.
Explanatory VariablesCoef. (Std. Err.)Std. Coef.
Clouds−0.048 *** (0.003)−0.453
Sidelaps1.216 *** (0.094)0.306
Transplanting length−0.398 *** (0.019)−0.547
Constant4.232 *** (0.160)
Pseudo R20.481
Mean VIF a1.27
Observations1035
*** indicates statistical significance at the 1% levels. a Mean VIF tests the degree of multicollinearity among the independent variables.
Publisher’s Note: MDPI stays neutral with regard to jurisdictional claims in published maps and institutional affiliations.