Article

Multiscale Perspectives on an Extreme Warm-Sector Rainfall Event over Coastal South China

1
Jiangmen Meteorological Bureau, China Meteorological Administration, Jiangmen 529030, China
2
Guangzhou Institute of Tropical and Marine Meteorology, China Meteorological Administration, Guangzhou 510641, China
3
State Key Laboratory of Severe Weather, Chinese Academy of Meteorological Sciences, Beijing 100081, China
*
Author to whom correspondence should be addressed.
Remote Sens. 2022, 14(13), 3110; https://doi.org/10.3390/rs14133110
Submission received: 14 May 2022 / Revised: 24 June 2022 / Accepted: 26 June 2022 / Published: 28 June 2022
(This article belongs to the Special Issue Synergetic Remote Sensing of Clouds and Precipitation)

Abstract

:
On 22 June 2017, an extreme warm-sector rainfall event hit the western coastal area of South China, with maximum hourly and 12-h rainfall accumulations of 189.4 and 464.8 mm, respectively, which broke local historical records. Multisource observations were used to reveal multiscale processes contributing to the extreme rainfall. The results showed that a marine boundary layer jet (BLJ) coupled with a synoptic low-level jet (LLJ) inland played an important role in the formation of an extremely humid environment with a very low lifting condensation level of near-surface air. Under the favorable pre-convective conditions, convection was initialized at a mesoscale convergence line, aided by topographic lifting in the evening. During the nocturnal hours, the rainstorm developed and was maintained by a quasi-stationary mesoscale outflow boundary, which continuously lifted warm, moist air transported by the enhanced BLJ. When producing the extreme rainfall rates, the storm possessed relatively weak convection, with the 40 dBZ echo top hardly reaching 6 km. The extreme rainfall was produced mainly by the warm rain microphysical processes, mainly because the humid environment and the deep warm cloud layer facilitated the clouds’ condensational growth and collision–coalescence, and also reduced rain evaporation. As the storm evolved, the raindrop concentration increased rapidly from its initial stage and remained high until its weakening stage, but the mean raindrop size changed little. The extreme rain was characterized by the highest concentration of raindrops during the storm’s lifetime with a mean size of raindrops slightly larger than the maritime regime.

1. Introduction

Adjacent to the northern South China Sea (SCS), South China features the most abundant rainfall in China under the joint influence of tropical and mid-latitude weather systems [1,2,3,4,5]. Almost every year, the coastal areas of South China experience a high incidence of extremely heavy rainfall during and after the onset of the summer monsoon over the SCS [1,6]. The most intense rainfall in the South China coasts usually appears in the warm sector, at least a couple of kilometers ahead of a front or without a front over South China [7,8,9,10,11,12]. Compared with the heavy precipitation caused by typhoons, the warm-sector heavy rainfall on the South China coast is more localized and occurs suddenly, making it an even greater challenge for operational forecasting [13].
Numerous studies have suggested that the Asian summer monsoon [14], low-level jets (LLJs) [15,16,17,18], coastal topography [10,19,20,21,22,23,24], land–sea contrasts [12], the mesoscale convergence line [19,25,26,27,28,29], and cold pools [24,29] play important roles in the formation of warm-sector rainstorms in South China. A distinct mesoscale feature of the coastal storms producing extreme rain is the slow-moving rainband training organization [30,31], which is closely related to the convectively generated cold outflows, rear inflows inside the rainband, and boundary layer (BL) airflows from the northern SCS [22,28,29]. The vertical coupling of a marine BL jet (BLJ) and a synoptic LLJ in the lower troposphere could exert profound impacts on the initiation and development of heavy rainfall-producing storms through a combination of thermodynamic and kinematic factors [32]. However, observational analyses of the evolution of double LLJs and the mesoscale features associated with the warm-sector extreme rainfall over South China coasts are still limited in the literature.
Numerous studies have suggested the close relationship of heavy rainfall with mixed-phase microphysics [33,34,35] and warm-rain processes [36,37,38]. Application of polarimetric radars have provided a new point of view on precipitation microphysics in both ice and liquid phases [39,40,41,42]. The recent dual polarization upgrade of the operational weather radars in coastal South China has provided an opportunity to analyze the microphysical characteristics of precipitation over the coastal areas of South China, such as the rainband of Typhoon Nida [43], two consecutive mesoscale convective systems (MCSs) leading to a maximal rainfall accumulation of 451 mm on 11 May 2014 [29], the record-breaking rainfall event of 7 May 2017 influencing the megacity of Guangzhou [37], and an early summer event with coexisting frontal and warm-sector heavy rainfall [44]. Two case studies [29,37] and a statistical analysis focusing on extreme precipitation over coastal South China [45] consistently suggested that the extreme precipitation could be accompanied by a variety of convective intensities (i.e., the strength of mixed-phase processes) ranging from weak to intense, and has much more populous raindrops than the “continental” regime with a mean size larger than the “maritime” regime. However, the understanding of microphysical processes leading to the generation of extreme precipitation worldwide is still far from complete.
This study investigated the extreme warm-sector rainfall event that occurred in the western coastal area of South China on 22 June 2017, with a maximal hourly rainfall of 189.4 mm h−1 and 12-h rainfall of 464.8 mm at Jinjiang station in Jiangmen City (Figure 1b,d). About 90% of the total rainfall accumulation over Jinjiang was produced within 4 h. The 1- and 3-h rainfall accumulations broke the historical records of Yangjiang (YJ) and Jiangmen, respectively, causing a direct economic loss of 167 million RMB. The objectives of this study were twofold. One was to investigate the formation of the mesoscale environments favoring the initiation and maintenance of the rainstorm, particularly the role of LLJs. The other was to reveal the microphysical characteristics during the rainstorm’s evolution. These objectives were achieved through analyzing the integrated dataset from multiple observing platforms, including the dual polarimetric radar at YJ, a 2D video distrometer (2DVD), a microwave radiometer, wind profilers, sounding stations (their locations are shown in Figure 1a), and the densely distributed surface automatic weather stations (AWSs), in addition to reanalysis of the data. The following section introduces the data and methods. Section 3 describes the rainfall and the storm’s evolution. Section 4 presents the synoptic background and environmental conditions, followed by the surface mesoscale features in Section 5. Section 6 discusses the microphysical characteristics during the rainstorm’s lifetime. This article ends with the conclusions in Section 7.

2. Data and Methods

2.1. Data and Instruments

Surface air temperature, wind, and precipitation recorded by the AWSs (Figure 1b) were used to examine spatiotemporal distribution of the rainfall and surface mesoscale features. The ERA5 reanalysis dataset with a horizontal resolution of 0.25° × 0.25°, available every 6 h (https://doi.org/10.24381/cds.bd0915c6, accessed on 9 January 2021), was used to analyze the synoptic background. The sounding observations at the YJ station (about 50 km southwest of Jinjiang), the vertical profiles of temperature and humidity from the microwave radiometer at the Bohe station, and the 30-min observations from the wind profiling radars on Hailing Island and the inland Guangzhou station were collectively used to examine the mesoscale environmental conditions.
Observations from the YJ S-band polarimetric radar (YJ S-POL), including radar reflectivity (ZH), the differential reflectivity factor (ZDR), and the specific differential phase shift (KDP), were analyzed to discuss the microphysical characteristics. The YJ S-POL is located about 10 km from the coastline and 105.7 m above sea level. It was upgraded from the China New Generation Weather Radar/SA (CINRAD/SA) to polarimetric radar in March 2016 [46]. The YJ S-POL operates with the volume coverage pattern 21 (VCP-21) scanning mode, consisting of single-elevation plan position indicator (PPI) scans between 0.5° and 19.5° with a 0.95° beam width and a 0.25 km radial resolution. The YJ S-POL observations are quality controlled using methods similar to those in Chen et al. [47] and Li et al. [48], namely, non-standard blockage mitigation, identification of ground clutter and biological scatter, and threshold checks for the cross-correlation coefficient and signal-to-noise ratio. Moreover, the raindrop size distributions (RSDs) observed by the 2DVD (a third-generation raindrop spectrometer, Joanneum Research Company, Graz, Austria) at Enping station (i.e., the Longmen Cloud Physics Field Experiment Base of China Meteorological Administration), located 6.8 km southwest of Jinjiang, were used to verify the RSDs retrieved from the YJ S-POL measurements (See Section 2.4 for the method). The method proposed by Tokay et al. [49] was used for quality control of the 2DVD data.

2.2. Estimation of Liquid and Ice Water Contents

The contents of liquid and ice water were estimated from the YJ S-POL observations. For pure rain, the constrained gamma raindrop size distribution method [50] was used to retrieve the liquid water content (LWC). For mixed-phase precipitation, the difference reflectivity (ZDP; unit: dB) method [36] was used. This method utilizes the ZDPZrain relationship to separate the fraction of Z produced by liquid particles. ZDP is calculated as follows:
ZDP = 10 × log (ZHZV)
where ZH and ZV are the horizontal and vertical radar reflectivity, respectively. The ZrainZDP relationship was obtained from the 2-year 2DVD measurements in South China [48]:
Zrain = 0.0044 × ZDP2 + 0.58054 × ZDP + 16.591
Zice = ZHZrain
The liquid water content and ice water content (IWC) were calculated using the Z-M relationship [36,41,43,51,52,53]:
LWC = 3.44 × 10⁻³ (Zrain)4/7
IWC = 1000πρiN03/7 ((5.28 × 10⁻¹⁸ Zice)/720)4/7
where ρi is the ice density and N0 is the intercept index, assuming the ice follows an inverse exponential distribution. For pure ice, Equation (5) was used to calculate the water content of ice.

2.3. Hydrometeor Classification

Based on the polarization variables of YJ S-POL, the phase state of the detected samples could be identified and classified [54]. The optimized hydrometeor classification algorithm (HCA) developed by Wu et al. [55] was used in this study to classify the radar echoes into 10 categories: ground clutter or anomalous propagation (GC/AP), biological scatter (BS), dry aggregated snow (DS), wet snow (WS), crystals of various orientations (CR), graupel (GR), big drops (BD), light and moderate rain (RA), heavy rain (HR), and a mixture of rain and hail (RH). Microphysical processes can also be inferred from the particle types. For example, DS implies aggregation, WS is related to melting, and GR represents riming.

2.4. Retrieval of Raindrop Size Distribution

Raindrop size distribution (RSD) parameters were retrieved from polarimetric variables in this study, based on the constrained-gamma (C-G) model proposed by Zhang et al. [50]. The three-parameter Γ function can reflect the characteristics of RSD well [56]:
N(D) = N0 Dμ exp (−ΛD)
where D is the particle diameter, N0 is the intercept, μ is the shape factor, and Λ is the slope. The curve is sunken or raised when μ > 0 or μ < 0, respectively. The three parameters (N0, μ, and Λ) in Equation (6) are not independent of each other [56,57], and there is a significant positive correlation between μ and Λ [50,58]. Therefore, the constrained gamma (C-G) model was used to reduce the number of independent parameters from three to two by alternately establishing the relationship in Equation (6) using the μ–Λ relationship. The empirical μ–Λ relationship depends on RSD observations, so it varies in different geographical locations and precipitation types. Based on 6966 observation samples of the 2DVD data acquired during May−August 2016 at the Longmen Cloud Physics Field Experiment Base, CMA, Liu et al. [59] applied a localized μΛ relationship (Equation (7)) into the C-G model and derived the fitting formula between the RSD parameters (N0, Λ) and the Guangzhou polarimetric radar data (ZH, ZDR). Equations (8) and (9) are the fitting equations obtained:
Λ = 0.0241μ2 + 0.867μ + 2.453
Λ = 2.111 × ZDR −1.044
N0 = ZH × 10−0.00188Λ4 + 0.0447Λ3 − 0.372Λ2 + 1.898Λ − 3.065
Given that the YJ S-POL and the Guangzhou polarimetric radar work in the same scanning mode and at the same frequency, it may be reasonable to apply the same fitting formula to YJ S-POL [44]. Therefore, we adopted the same formulas as Liu et al. [59] to retrieve the RSD. Microphysical variables such as the raindrop mass-weighted mean diameter (Dm, mm) and the logarithmic normalized intercept (log10Nw, where the unit of Nw is mm−1 m−3) were calculated by moments of the gamma RSD.
To verify the radar-based retrieval of RSD, Figure 2 shows the temporal evolution of ZH, Dm, and log10Nw over a 1 km × 1 km area centered at the Enping station retrieved from the 1.5° scanning of YJ S-POL, in comparison with those observed by the 2DVD at the Enping station. Note that the 2DVD is located about 50 km away from the YJ S-POL (Figure 1a), and the YJ S-POL observations at 0.5° elevation are not used in this comparison due to the terrain eclipse effect. The overall evolution of ZH, Dm, and log10Nw are apparently consistent between the 2DVD and the radar. The correlation coefficients (based on the radar data’s temporal resolution) of ZH, Dm, and log10Nw between the 2DVD and the radar are 0.90, 0.82, and 0.76, respectively, and the mean deviations are 4.06, 0.20, and 0.31 (Figure 2). This consistency is higher when the 1 min rain rates are larger. Slight differences between the two sources exist for a couple of reasons, such as the different temporal resolutions (6 min vs. 1 min) and elevations (the height of the beam is about 0.8 km above the 2DVD). Moreover, the slightly underrated log10Nw of the radar retrieval relative to the 2DVD is also contributed to by the 2DVD’s higher sensitivity to the presence of small raindrops [49].

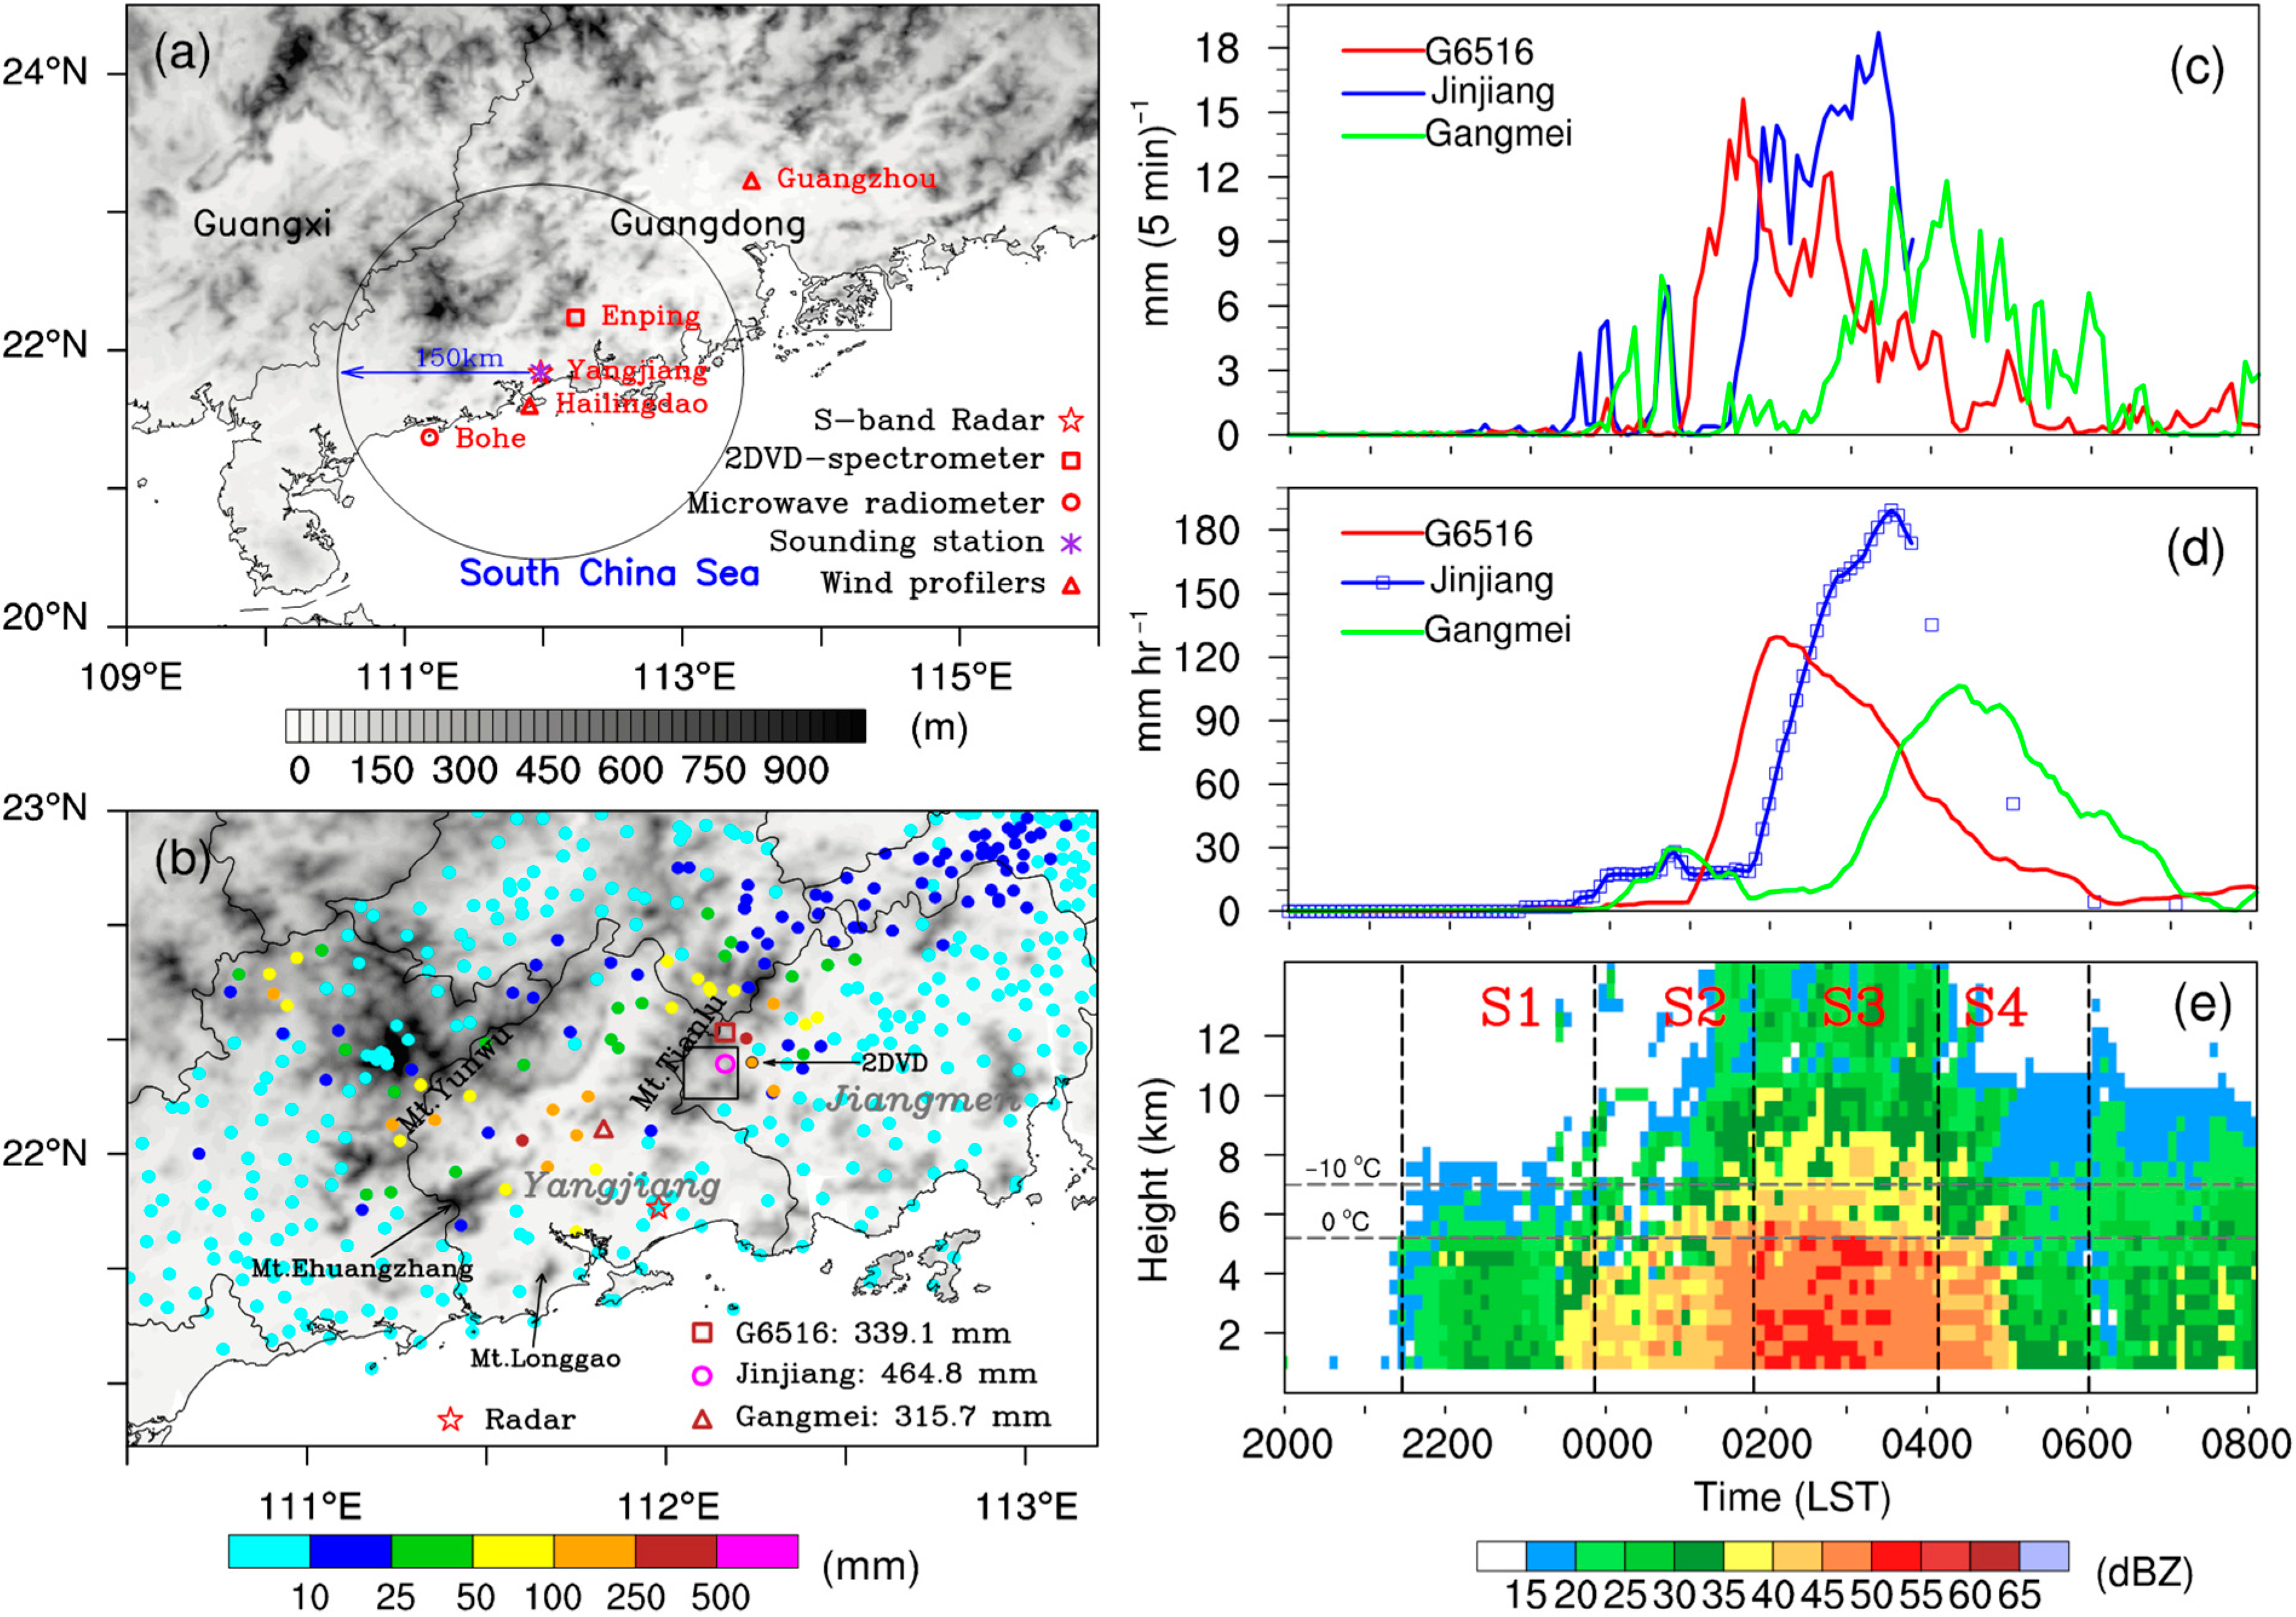
3. Overview of the Rainstorm

Figure 1b shows the distribution of rainfall accumulation from 2000 LST on 21 June to 0800 LST on 22 June 2017. Heavy rainfall (>100 mm) was mainly recorded by stations over the southeast foothills of Mt. Tianlu and the low lands surrounded by Mt. Yunwu, Mt. Ehuangzhang, and Mt. Tianlu, with five stations exceeding 250 mm. The maximal 12 h rainfall accumulation (464.8 mm) and the highest 60 min (0235–0335 LST 22 June) rainfall accumulation (189.4 mm; accumulated every 5 min) (Figure 1d) were both located at the Jinjiang station, with an elevation of 150 m (Figure 1b). The rainstorm was initiated near Mt. Ehuangzhang in the evening of 21 June and then moved slowly northeastward. It was of weak convective intensity (ZH mostly < 35 dBZ) and located about 30–50 km to the west and northwest of the YJ S-POL at 2130 LST on 21 June (Figure 3a). In about 2 h, the convective cells intensified slightly and were mainly located around Jinjiang, i.e., the key region with the maximum 12 h and hourly rainfall accumulation (purple box in Figure 3c). From about 0100 to 0400 LST, strong radar reflectivity (ZH > 50 dBZ) remained quasi-stationary over the key region, pouring intense rainfall of ≥10 mm (5 min)−1 (Figure 1c and Figure 3d). Meanwhile, several convective cells developed to the southwest near Mt. Ehuangzhang and Mt. Longgao (black and gray triangles in Figure 3, respectively), and gradually merged (0230 LST 22 June) around the Gangmei station (blue box in Figure 3e–i). At about 0230 LST on 22 June, a northeast-to-southwest oriented convective band formed, with the largest ZH (55 dBZ) over the key region until about 0318 LST on 22 June. Later on, the rainstorm influencing the key region weakened, while the convective elements around Gangmei continued to develop, producing 100 mm h−1 rainfall during 0400–0430 LST on 22 (Figure 1d and Figure 3g). After 0624 LST on 22 June (Figure 3i), the convective rainband moved northward and weakened substantially in convective intensity, with reduced rain rates. On the basis of the abovementioned results, combined with the intensity and vertical extension of ZH over Jinjiang (Figure 1e), the rainfall event can be divided into four stages, namely, the initial (S1, 2120–2350 LST on 21 June), developing (S2, 2350 LST 21 June–0150 LST 22 June), mature (S3, 0150–0410 LST 22 June), and dissipating (S4, 0410–0600 LST 22 June) stages for convenience in further investigations of the microphysical features of the extreme rainfall.

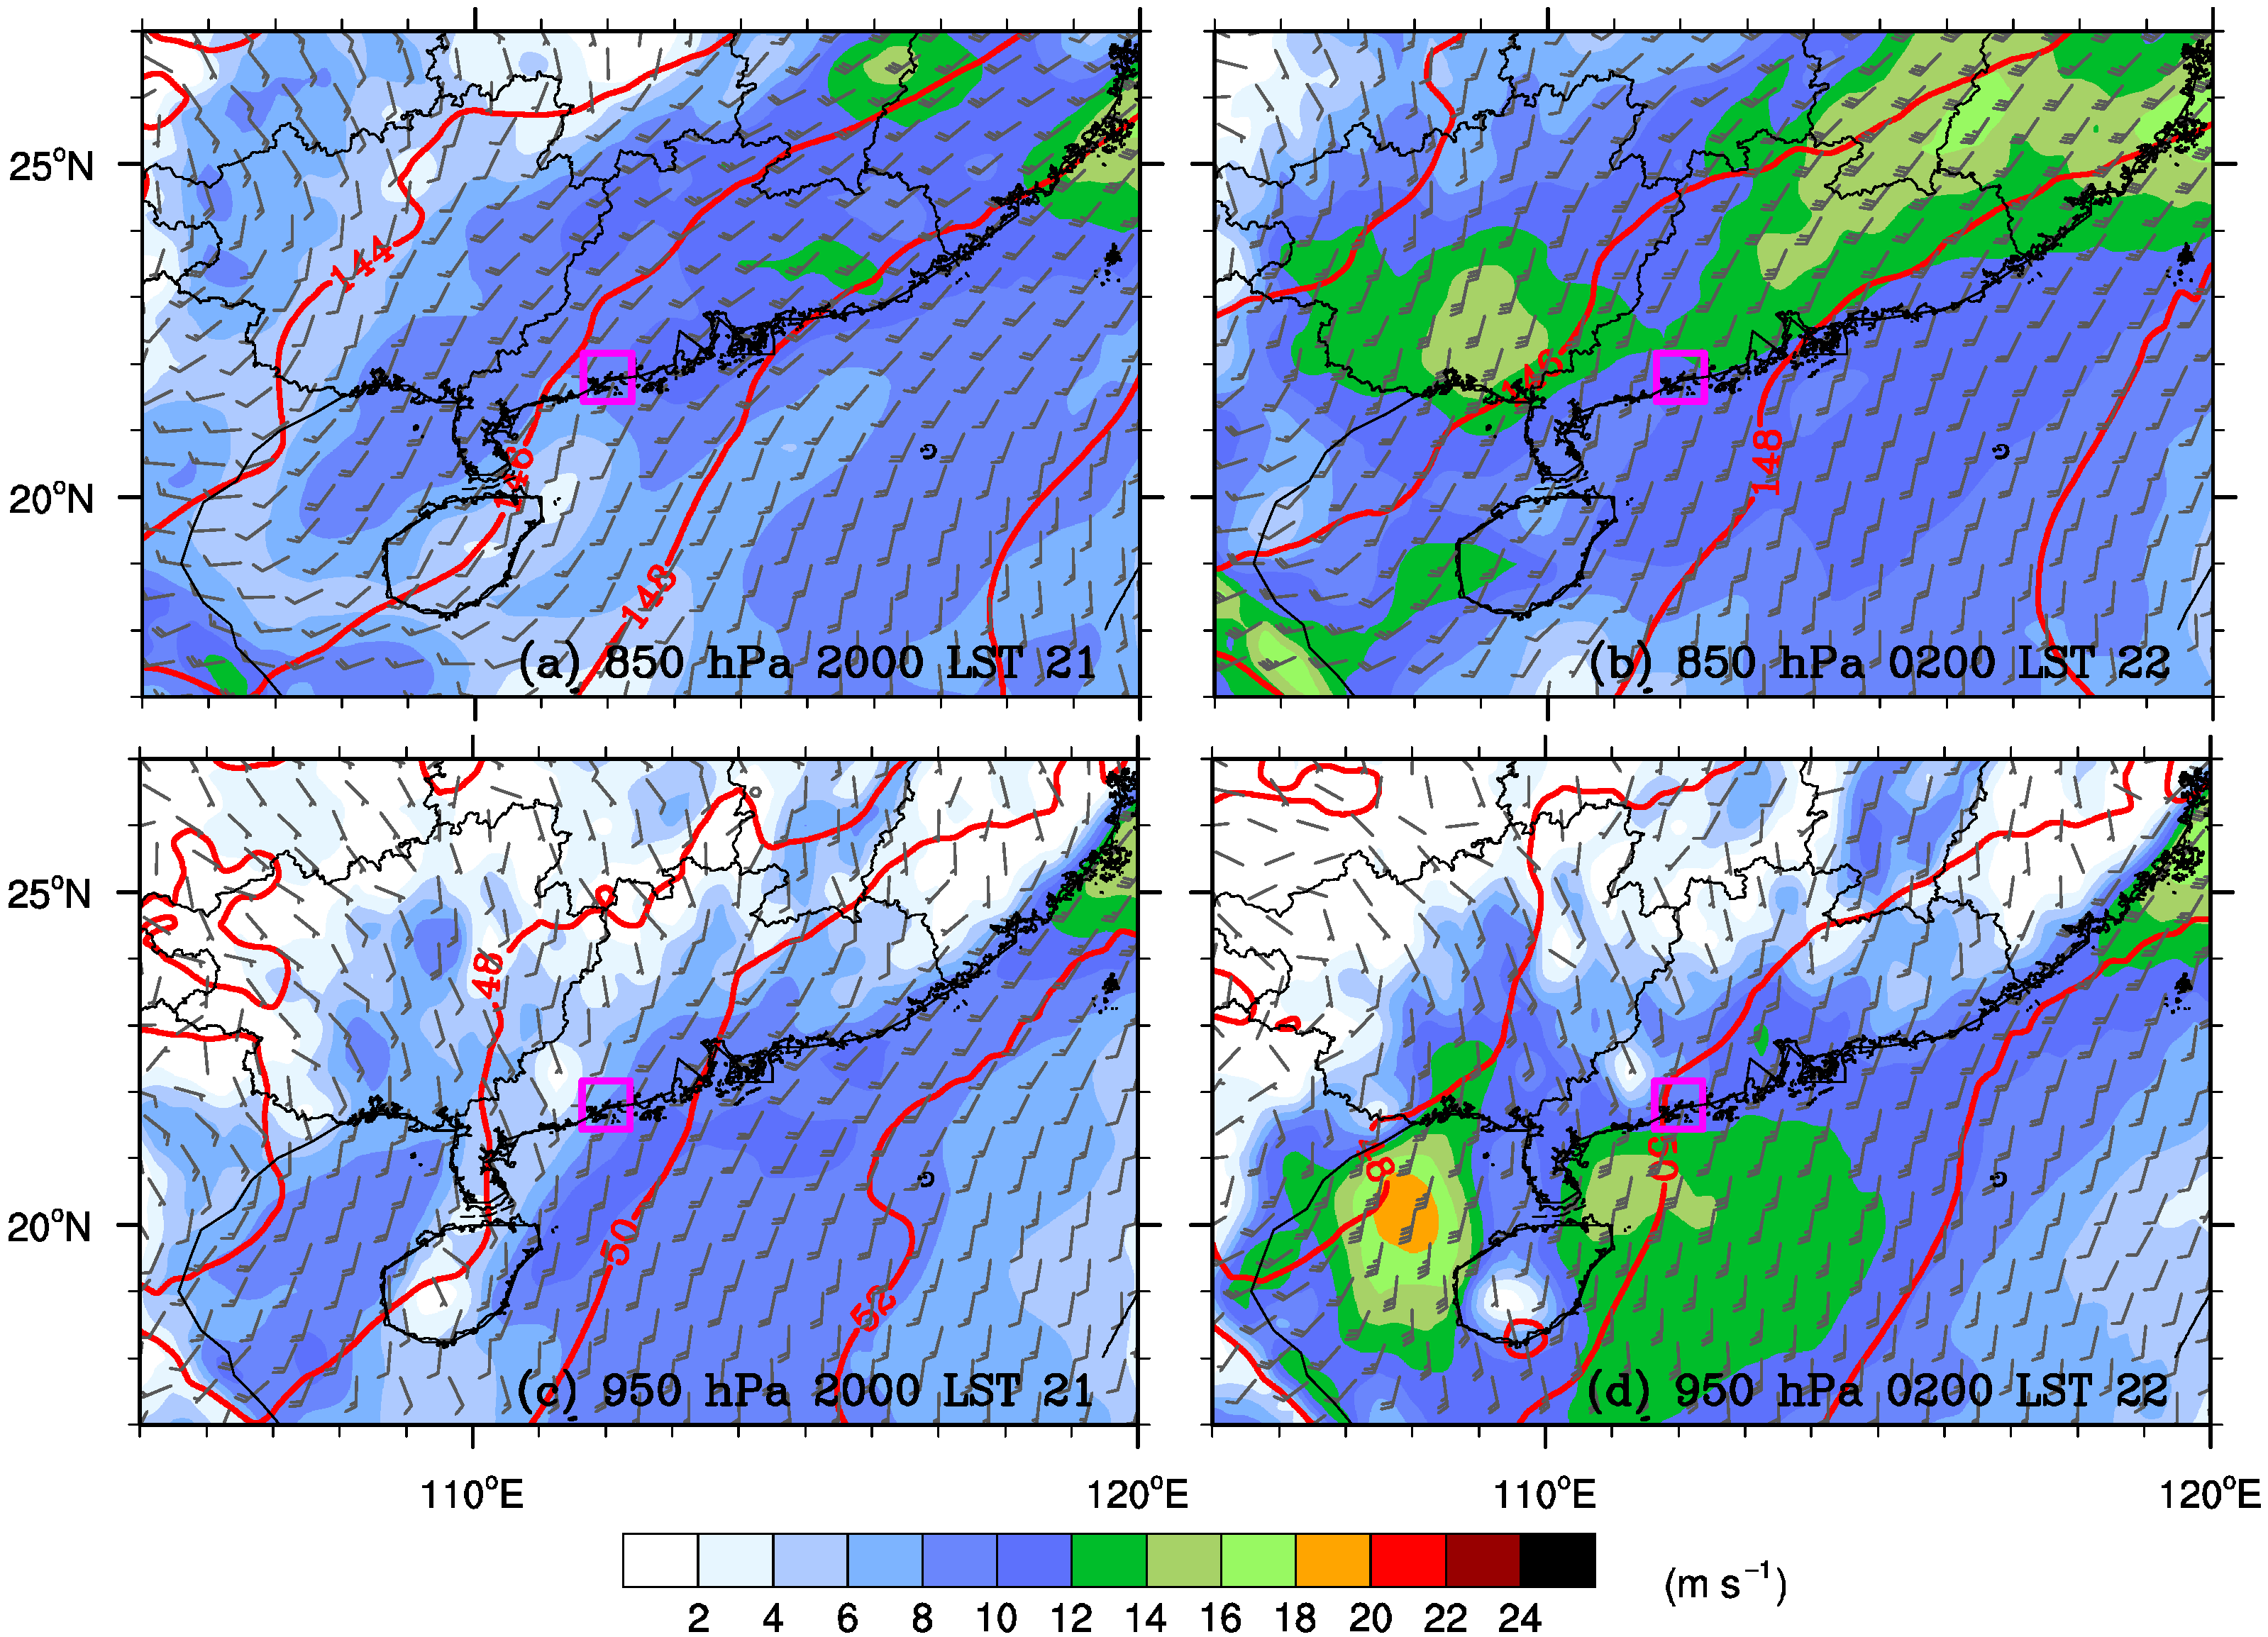
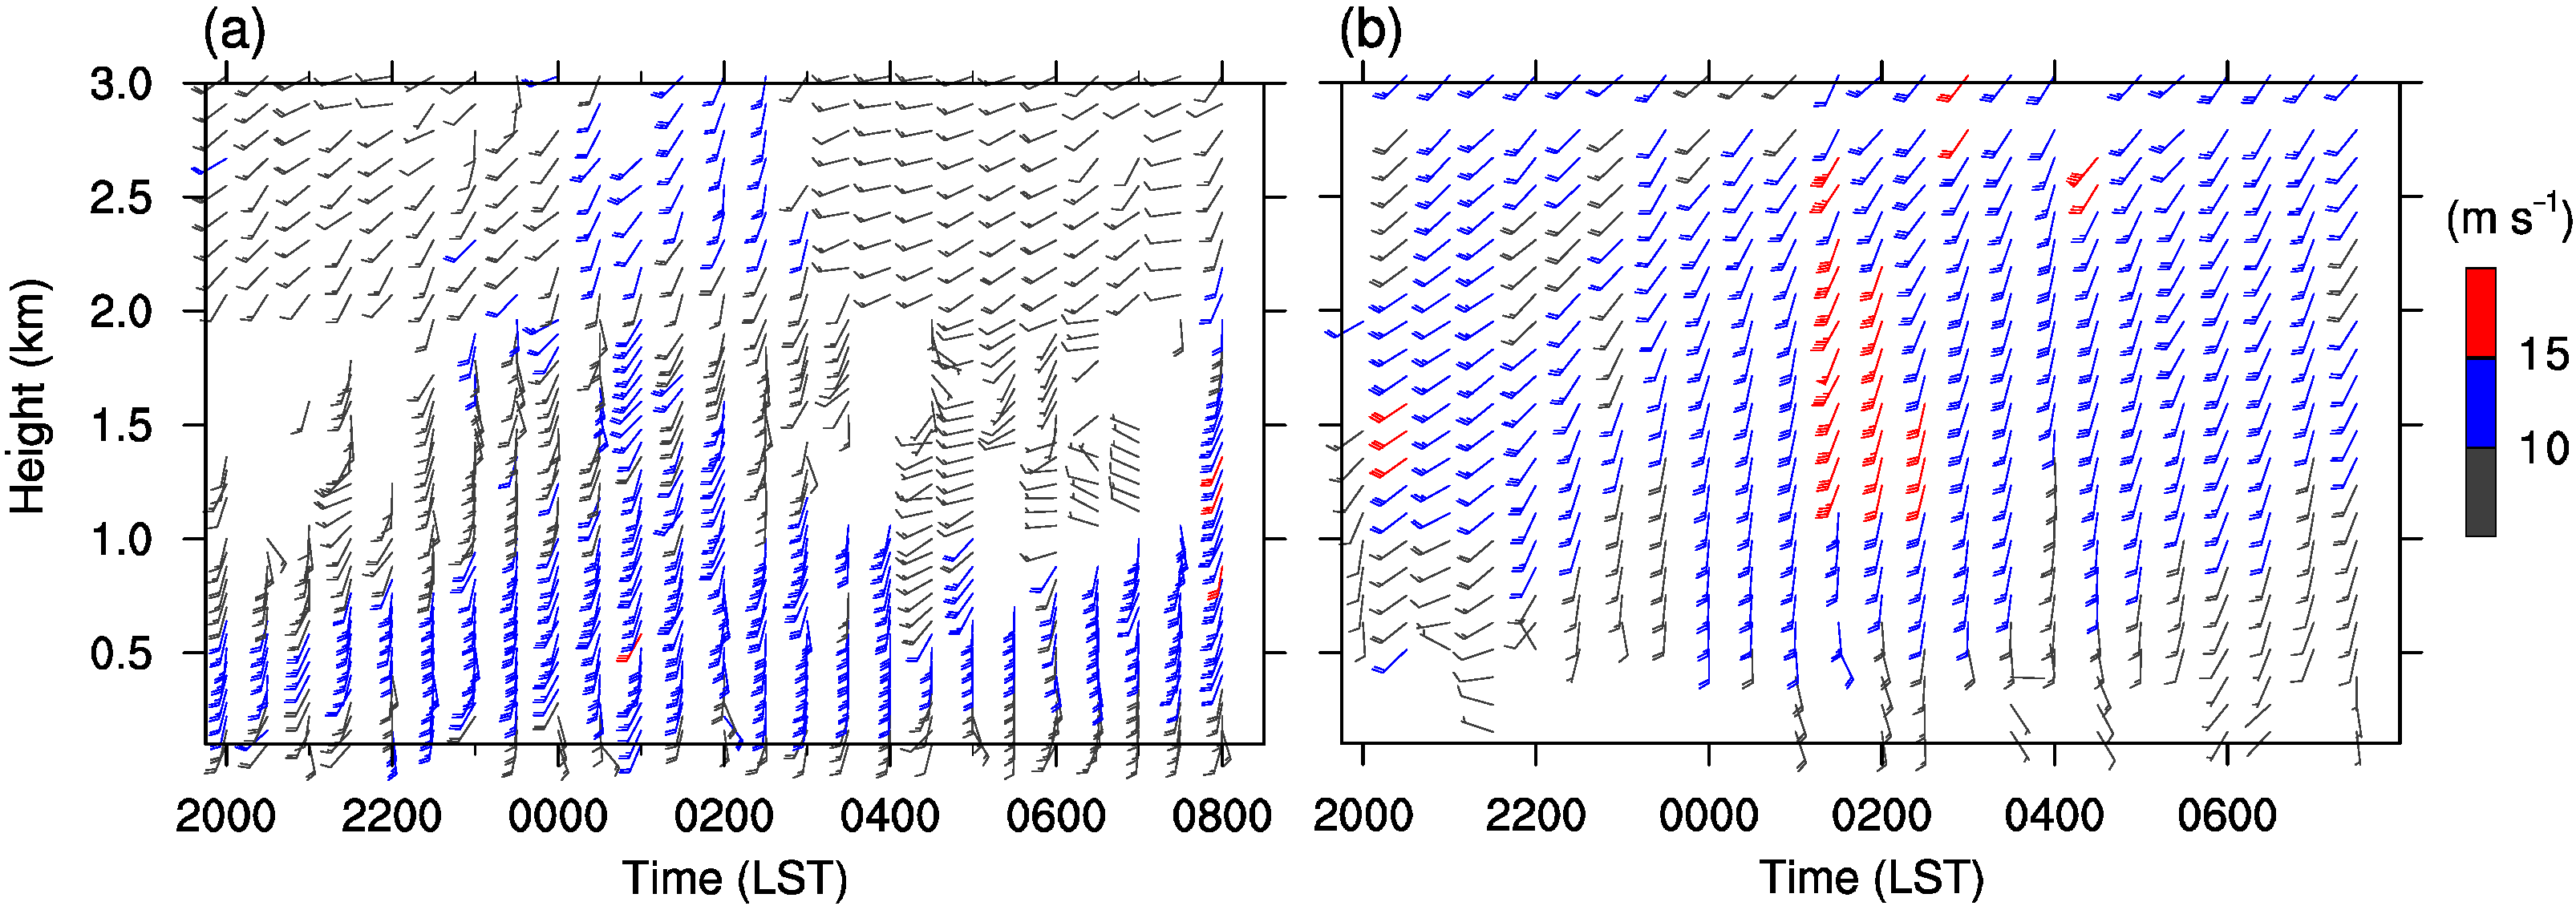
4. Synoptic Background and Mesoscale Environments

The reanalyzed ERA5 data suggest that the extreme rainfall event of interest occurred under the influence of a warm, humid southerly airflow at low levels, without the presence of a front or low-level vortex over South China (Figure 4). A couple of hours prior to the convection initiation (Figure 3a), the presence of an 850 hPa LLJ over coastal and inland South China and a marine BLJ over the northern SCS can be seen (Figure 4a,c). Several hours later, both jets intensified and the key region was situated at the leading edge of the marine BLJ and the entrance of the 850 hPa LLJ (Figure 4b,d). This vertical coupling of low-level winds appears consistent with the conceptual model of double LLJs [32,60], i.e., the vertical coupling of BL convergence and lower-troposphere divergence over the key region would provide lifting and moistening conditions that were favorable for initiation and development of convection.
The finer-scale vertical structure of the marine BLJ and the inland LLJ and their temporal evolution can be more clearly seen from the data collected by the wind profiling radars at Hailing Island and Guangzhou City, respectively (their locations are shown in Figure 1a). As shown in Figure 5a, a southerly jet stream passing over Hailing Island was established around 2230 LST on 21 June with a maximum wind speed of >10 m s−1 at about 0.7 km high. It continued to strengthen until about 0200 LST, with high wind speeds of 10 m s−1 extending vertically up to 1.5 km. The marine BL flow weakened rapidly after about 0400 LST on 22 June (Figure 5a). On the other hand, a southerly jet stream above 850 hPa (centered at about 2 km) passing over Guangzhou was found at about 0000 LST, a couple of hours later than the BLJ over Hailing Island. The inland LLJ over Guangzhou reached its peak around 0130 to 0230 LST, and fluctuated in intensity during the following hours (Figure 5b). These results indicate that the vertical coupling of the double LLJs at the coasts was established at about 0000 LST and disappeared at about 0400 LST on 22 June, lasting about 4 h. Obviously, the establishment, maintenance, and destruction of the double LLJs was closely associated with the development, maintenance, and end of the extreme rainfall-producing storm. In particular, the temporal evolution of the marine BLJ’s strength is highly correlated with the rainfall intensity around Jinjiang and Gangmei (cf. Figure 5 and Figure 1c).
The pre-convective environmental conditions were examined using the YJ station’s sounding observation at 2000 LST on 21 June (Figure 6a), about one hour before the initiation of the convection. The horizontal winds veered from southerly to southwesterly, indicating warm advection below about 500 hPa. The 0−3 km vertical wind shear (VWS) was 9.6 m s−1, which is moderate and generally favors formation of multicell-type storms [61]. The convective available potential energy (CAPE) was high (3502.8 J kg−1), but decreased with the longwave radiative cooling dominating the surface energy budget at night. The huge amount of precipitable water (PW; 70 mm) and the deep warm cloud layer (about 4.9 km) between the lifting condensation level (LCL, 0.269 km above ground level; AGL) and the 0 °C level (5.201 km AGL) were in favor of the microphysical processes of warm rain [48,62]. The dewpoint temperature profile shows a very moist environment below 500 hPa, with the average relative humidity at four representative levels (700 hPa, 850 hPa, 925 hPa, and ground level) reaching 92%. This moist condition ranks in the top 7.3% for June at 2000 LST during 2011–2020 (Table 1). Moreover, the Bohe microwave radiometer, located about 97 km southwest of the YJ sounding station, clearly revealed an increase in moisture in the BL with the establishment of the marine BLJ in a couple of hours. The averaged absolute humidity below 4 km (Figure 6b) and the relative humidity in the BL (Figure 6c) evolved in a way that was highly consistent with the BLJ (Figure 5a) and the extreme rainfall (Figure 1e). Although these thermodynamic conditions are largely similar to those of previously studied extreme rainfall events on the South China coast during early summer (e.g., [28,48]), this study more clearly illustrates not only the extremity of humidity but also the close association between the local conditions and the marine BLJ using multisource observations.

5. Surface Mesoscale Features

With the double LLJs providing favorable pre-convective conditions, a surface mesoscale analysis was conducted to explore the triggering mechanism of this extreme rainfall event. For this purpose, Figure 7 shows the surface air temperature and wind observed by the densely distributed AWSs, along with the topographic characteristics over the area of interest. The warm air flows crossing the coastline toward the colder, nearly static air masses inland, led to the formation of a southwest–northeast oriented mesoscale convergence line at 2100 LST on 21 June (Figure 7a), with significant temperature contrasts (about 4 °C). Convection initiation occurred at the southwest edge of the convergence line where the southerly flows were relatively stronger and the topographic lifting of Mt. Ehuangzhang was likely present. The convective cloud cluster moved downstream under the guidance of the southwesterly airflows aloft (Figure 6a) and arrived at the windward slope of Mt. Tianlu, where it strengthened under the joint effect of the BLJ’s enhancement and the topographic uplift. The enhancement of the BLJ made the moisture supply more abundant, and the topographic uplift of the windward slope enhanced the upward movement. The rainfall resulted in slight cooling (about 1 °C) and weak surface outflows (Figure 7b), mainly due to weak rain evaporation. With the continued development of convection, the key region experienced ground cooling of about 2 °C, and a mesoscale outflow boundary (MOB) known as MOB A (green curve in Figure 7c) formed around the southern part of the key region at 0200 LST (Figure 7c). MOB A kept within 10 km from the convective precipitation region, with slow movement during the heavy rainfall period over the key region (roughly from 0100 to 0400 LST). To the southwest, Mt. Ehuangzhang and Mt. Longgao continuously helped to lifting the warm air of tropical origin. The initiated convective elements moved northeastward and strengthened over the flat area south of Mt. Yunwu and gradually connected with the rainstorm over the key region, leading to the formation of MOB B around 0300 LST (Figure 7d). At this time, the eastern portion of MOB A sped up southeastward to ahead of the leading edge of convective precipitation (35 dBZ), while the western portion of MOB A was still near the convection boundary likely associated with the terrain blocking (Figure 7d). After MOB A had completely separated from the convective precipitation region at 0400 LST (Figure 7e), the most intense convection was located over the flat area south of Mt. Yunwu (Figure 3g), fed by strong southerly onshore flows (Figure 7e) and producing heavy rainfall over Gangmei (Figure 1c). Clearly, the slow-moving MOBs continuously lifted the unstable, moist air transported by the BLJ from SCS, leading to extreme rainfall production.

6. Microphysical Features

6.1. Vertical Structure of Polarimetric Variables and Hydrometeor Types

To examine the microphysical features during the four stages of the extreme rainfall-producing storm over the key region, the contoured frequency by altitude diagrams (CFAD) [63] and the average profiles for the polarimetric variables (ZH, ZDR, and KDP) over Jinjiang (a 10 km × 10 km area) are shown in Figure 8, while the probability of various hydrometeor types estimated using the HCA are shown in Figure 9.
During S1, the mean rain rate of Jinjiang was under 0.5 mm (5 min)−1 with a maximum rain rate of 3.8 mm (5 min)−1. The values of ZH below the melting level were mainly concentrated between 20 and 30 dBZ and the 40 dBZ echo tops hardly reached 6 km, suggesting weak convective intensity (Figure 8a). Dry snow and ice crystals coexisted above the 0 °C level, and dominated below and above the −20 °C level, respectively (Figure 9a). Due to the lack of strong updrafts, ice crystals grew slowly through deposition [64], and the ice crystals tended to have higher density and irregular shapes (more like single crystals with a larger axis ratio than raindrops) [41,42], resulting in a larger ZDR than those in the other three stages (Figure 8j). Between the −20 °C level and the 0 °C level, some ice crystals converted to dry snow through an aggregation process. The large proportions of dry snow and crystals above the 0 °C level and the dominance of light and moderate rain below this indicated that snowflakes, snow crystals, and/or crystals with various orientations melted into small raindrops after passing through the melting layer.
With the convection intensification in S2, the proportion of ZH of >35 dBZ increased substantially (Figure 8b). The ZDR and KDP also increased due to the stronger updrafts transporting more water vapor to the upper levels. During this stage, with the increase in ice supersaturation above the −20 °C level, ice crystals could grow rapidly through deposition. Due to the strengthening of convection, the aggregation process also enabled more falling snow crystals and ice crystals to turn into snowflakes (DS), increasing the average particle size above the 0 °C level. Another difference from S1 is the presence of graupel between the 0 °C and −20 °C levels, especially near the 0 °C level (Figure 9b), which indicates that the falling crystals and snow could freeze supercooled droplets on contact (riming process), producing larger ice particles or graupels. These large ice particles or graupels converted to large raindrops through melting and collision coalescence below the 0 °C level. The proportions of “heavy rain” and “mixtures of rain and hail” increased significantly during S2 relative to S1 (cf. Figure 9a,b). Correspondingly, the values of ZDR increased (Figure 8j) and the proportion of KDP greater than 1° km−1 was significantly higher than that in S1 (cf. Figure 8k,l). The mean rain rate of the Jinjiang station increased to 2.2 mm (5 min)−1 with a maximum rainfall rate of 8.2 mm (5 min)−1.
As the convective intensity reached its peak during S3, the values of ZH were mainly concentrated between 45 and 55 dBZ (Figure 8c), and the average ZH of 35 dBZ exceeded 8 km (Figure 8e). The water contents in the cloud reached the maximum among the four stages, the proportion of crystals between the −20 °C level and 15 km was the smallest, and there were few crystals below the −20 °C level. The average ZDR was the smallest above the 0 °C level among the four stages (Figure 8j), suggesting that with more water vapor being transported to the upper levels by strong updrafts, the ice crystals grew faster with a more irregular shape and a larger size [64]. In addition, the proportion of graupel reached the peak value, indicating an active riming process (Figure 9c). Thus, more dry snow above and more graupel near the 0 °C level may have converted to relatively larger raindrops through melting and collision coalescence with the raindrops below. Correspondingly, the ZDR increased rapidly from the 0 °C level to the ground due to the intense riming and melting processes inside the rainstorm. The increase in ZDR and KDP from the freezing level toward the surface indicates the processes of collision–coalescence and/or the accretion of cloud water by raindrops [41,65,66]. The average ZDR near the ground reached 1.1 dB (Figure 8j), and the average KDP near the ground reached 1.8° km−1 (Figure 8o), indicating the large mass and size of raindrops. During this stage, the mean rainfall rate of Jinjiang reached 13.8 mm (5 min)−1 and experienced its peak of 17.6 mm (5 min)−1.
The distributions of ZH, ZDR, and KDP consistently suggest that the raindrop size and the numerical concentration reduced during S4 relative to S3. The mean rainfall rate of the Jinjiang station decreased to 2.3 mm (5 min)−1. The mid-light rain dominated again below the 0 °C level and the proportion of GR decreased due to water vapor consumption and convective weakening. Compared with S3, the aggregation process was weaker because of the smaller proportion of DS (Figure 9c,d), although it was still an important process above the 0 °C level, while the riming process weakened significantly.

6.2. Contributions of the Warm-Rain Versus Ice-Phase Processes to Extreme Rain

IWC and LWC calculated using the difference reflectivity method (see Section 2.3) [53] were used to qualitatively discuss the relative contributions of the warm-rain and ice-phase processes (Figure 10a). During the extreme rainfall period over Jinjiang (S3), the maximum IWC was 1.0 g m−3 at about the 0 °C level while the maximum LWC was close to 4.5 g m−3. This IWC accounted for only 22.2% of the LWC, even if all the ice water melted into rainwater, which was less than that in the squall line in Eastern China [42], suggesting that the precipitation over Jinjiang was mainly produced by the warm-rain processes. Although the contribution of ice-phase process in this event was relatively limited, it was still much higher than that during the rainfall process of the inner rainbands of a typhoon [41].
The relatively high contribution of warm-rain process is also consistent with the low tops with a 40 dBZ echo during S3 (about 6 km; Figure 1e), suggesting the relatively weak convective intensity [67] of the extreme rainfall-producing storm. However, it should be noted that about 43.5% of the radar volume scans during S3 showed that the 40 dBZ echo top could reach or exceed 6 km. This indicates that the ice-phase processes near or above the freezing level were also active during S3, which is consistent with the active riming process mentioned above in Figure 9c. On the other hand, the LWC and mean Dm increased downward to about 2 km during S3 (Figure 10a,b) and the mean log10Nm slightly decreased from 4 km to the ground (Figure 10c), collectively indicating the collision–coalescence of raindrops and the accretion of cloud water by raindrops. This feature is different from the case of the squall line mentioned above [42], where intense evaporation process resulted in a more significant drop in log10Nw from the freezing level down to the ground [42]. The interactions between continuous condensation and coalescence when raindrops fell in the extremely moist environment resulted in the high efficiency of warm-cloud precipitation process.

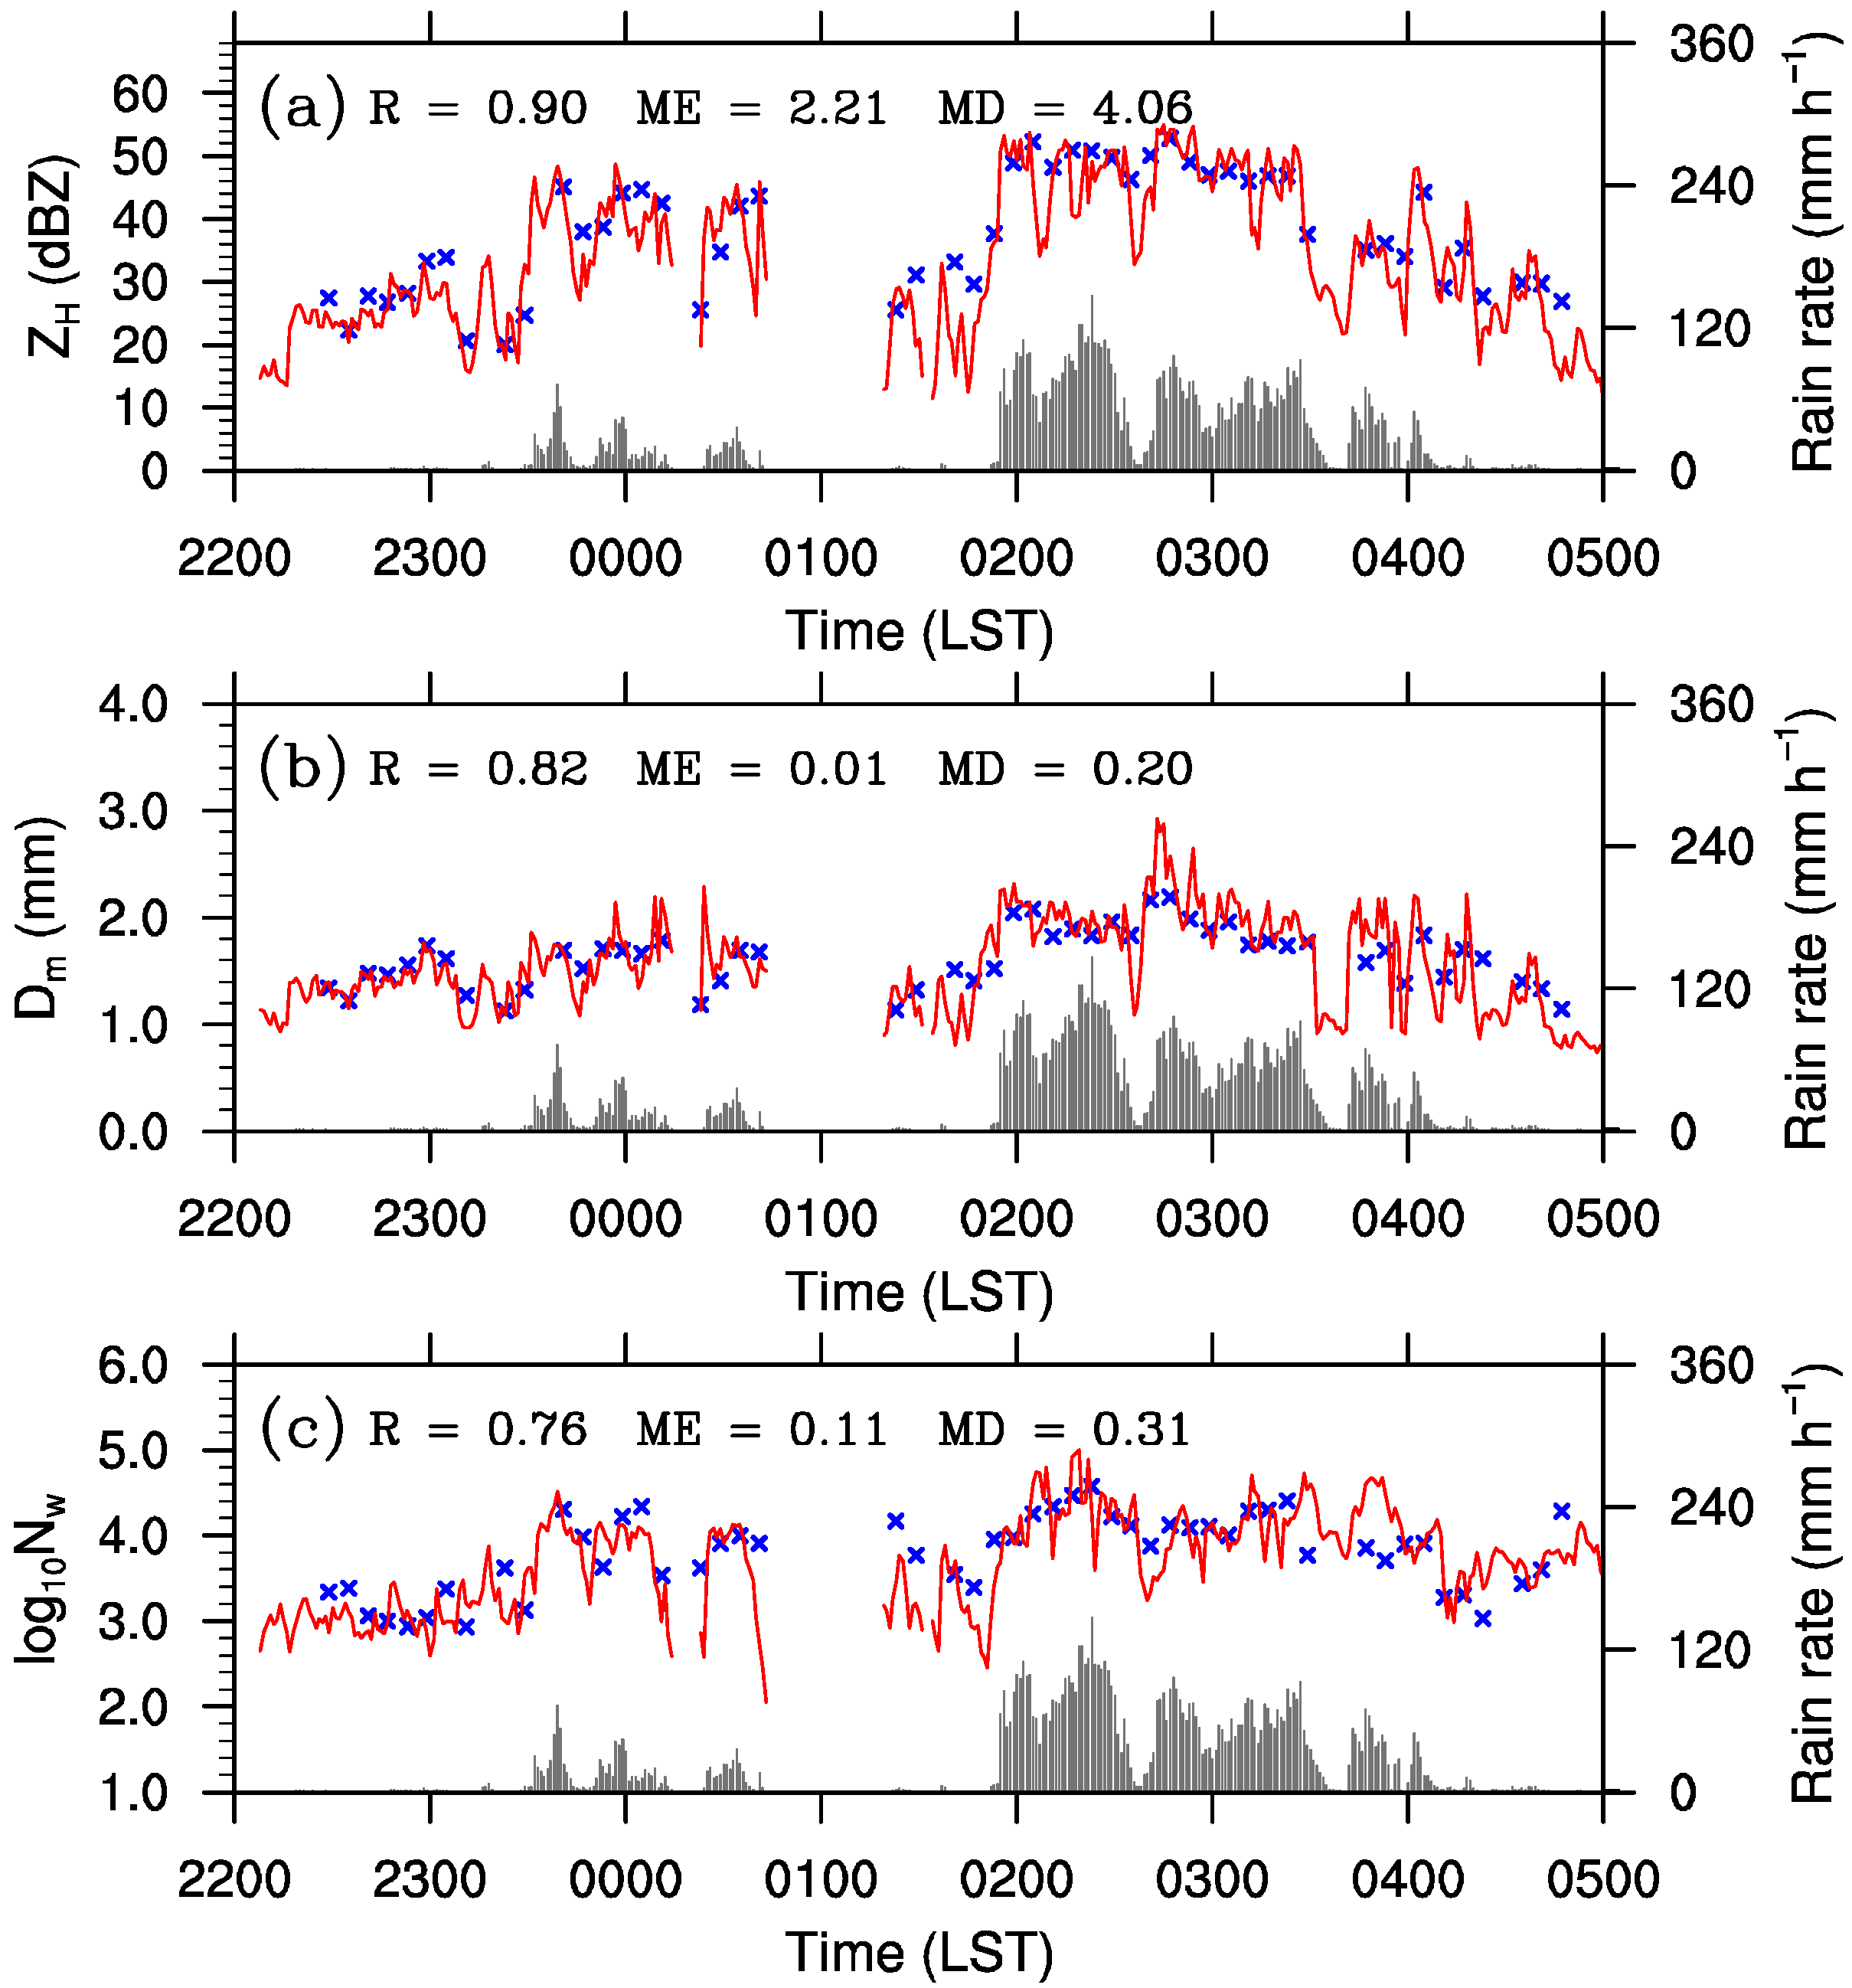
6.3. Characteristics of RSD

In order to compare the raindrop spectra of convective precipitation at different stages, Figure 11 shows the probability distribution of Dm and log10Nw for the convective precipitation (with ZH > 35 dBZ) over Jinjiang during each of the four stages. A high population of raindrops, i.e., comparable with the maritime regime and about one order of magnitude higher than the continental regime [39], was found during all stages except for the initial stage, with the highest population during S3 with the extreme rainfall rates. The average log10Nw was as high as 4.31 and the fraction of log10Nw > 4.5 (i.e., beyond the maritime regime) was about 43.2% in S3. On the other hand, the average Dm and its probability distribution varied little among the stages. Although the Dm values were mostly smaller than those of the continental regime, the average Dm was still slightly larger than the those of maritime regime.
Compared with the previously reported summer rainfall over East China [68,69,70], the mean log10Nw and Dm of convective raindrops during the mature stage were larger, except that Wen et al. [70] reported a slightly larger log10Nw, likely due to their use of a 2DVD that was more sensitive to the presence of small raindrops [49]. Compared with the extreme precipitation features with weak convection (40 dBZ echo top < 6 km) over South China revealed by Yu et al. [45] based on two warm-season observations from the Guangzhou radar, the extreme rain during S3 had a comparable mean size (1.76 mm vs. 1.82 mm) but a larger mean log10Nw (4.31 vs. 3.98). This difference in raindrop concentration could be caused by differences in the analysis methods and the convection itself.

7. Conclusions

This study analyzed the multiscale features leading to the extreme rainfall using multisource observations, including the LLJs, mesoscale environmental conditions, triggering and maintenance mechanisms, and microphysical characteristics of the convection during an extreme warm-sector rainfall event in the coastal area of South China that occurred on 22 June 2017. The major conclusions are summarized below.
(1)
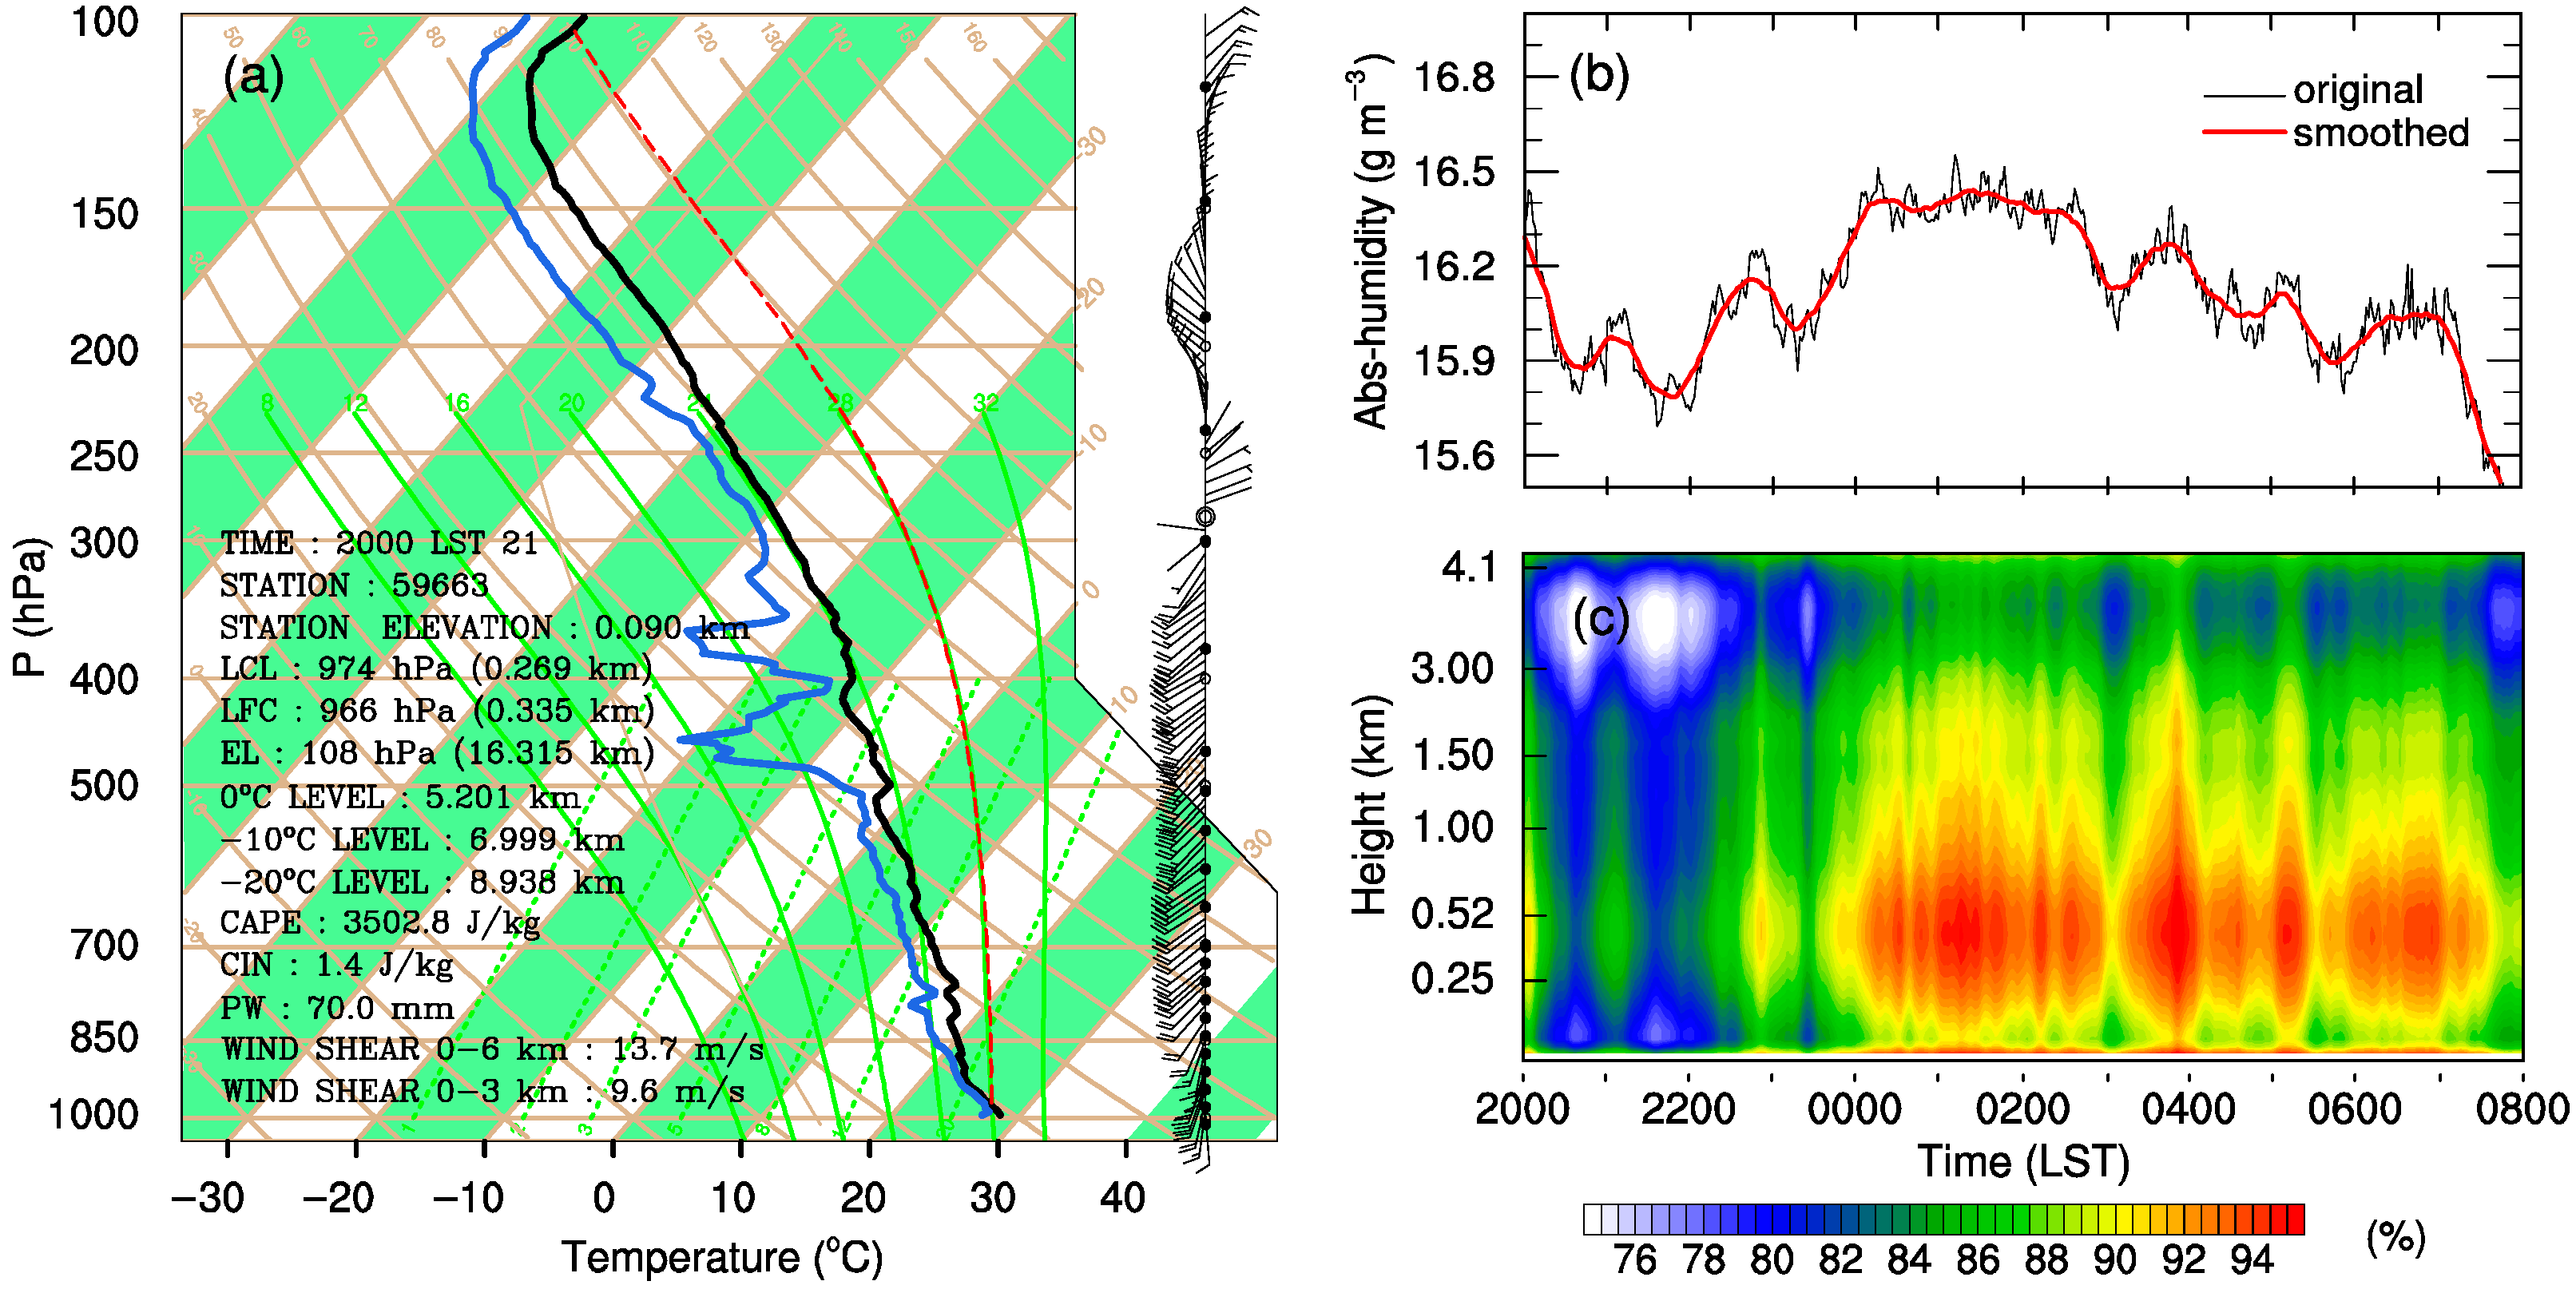
The extreme rainfall event occurred under conditions of a low-level warm and humid southerly airflow without the influence of a frontal system. The establishment of nighttime LLJs provided favorable thermal-dynamic and water vapor conditions for the initiation and development of convection. In particular, the establishment, maintenance, and weakening of the BLJ were highly correlated with the evolution of the precipitation.
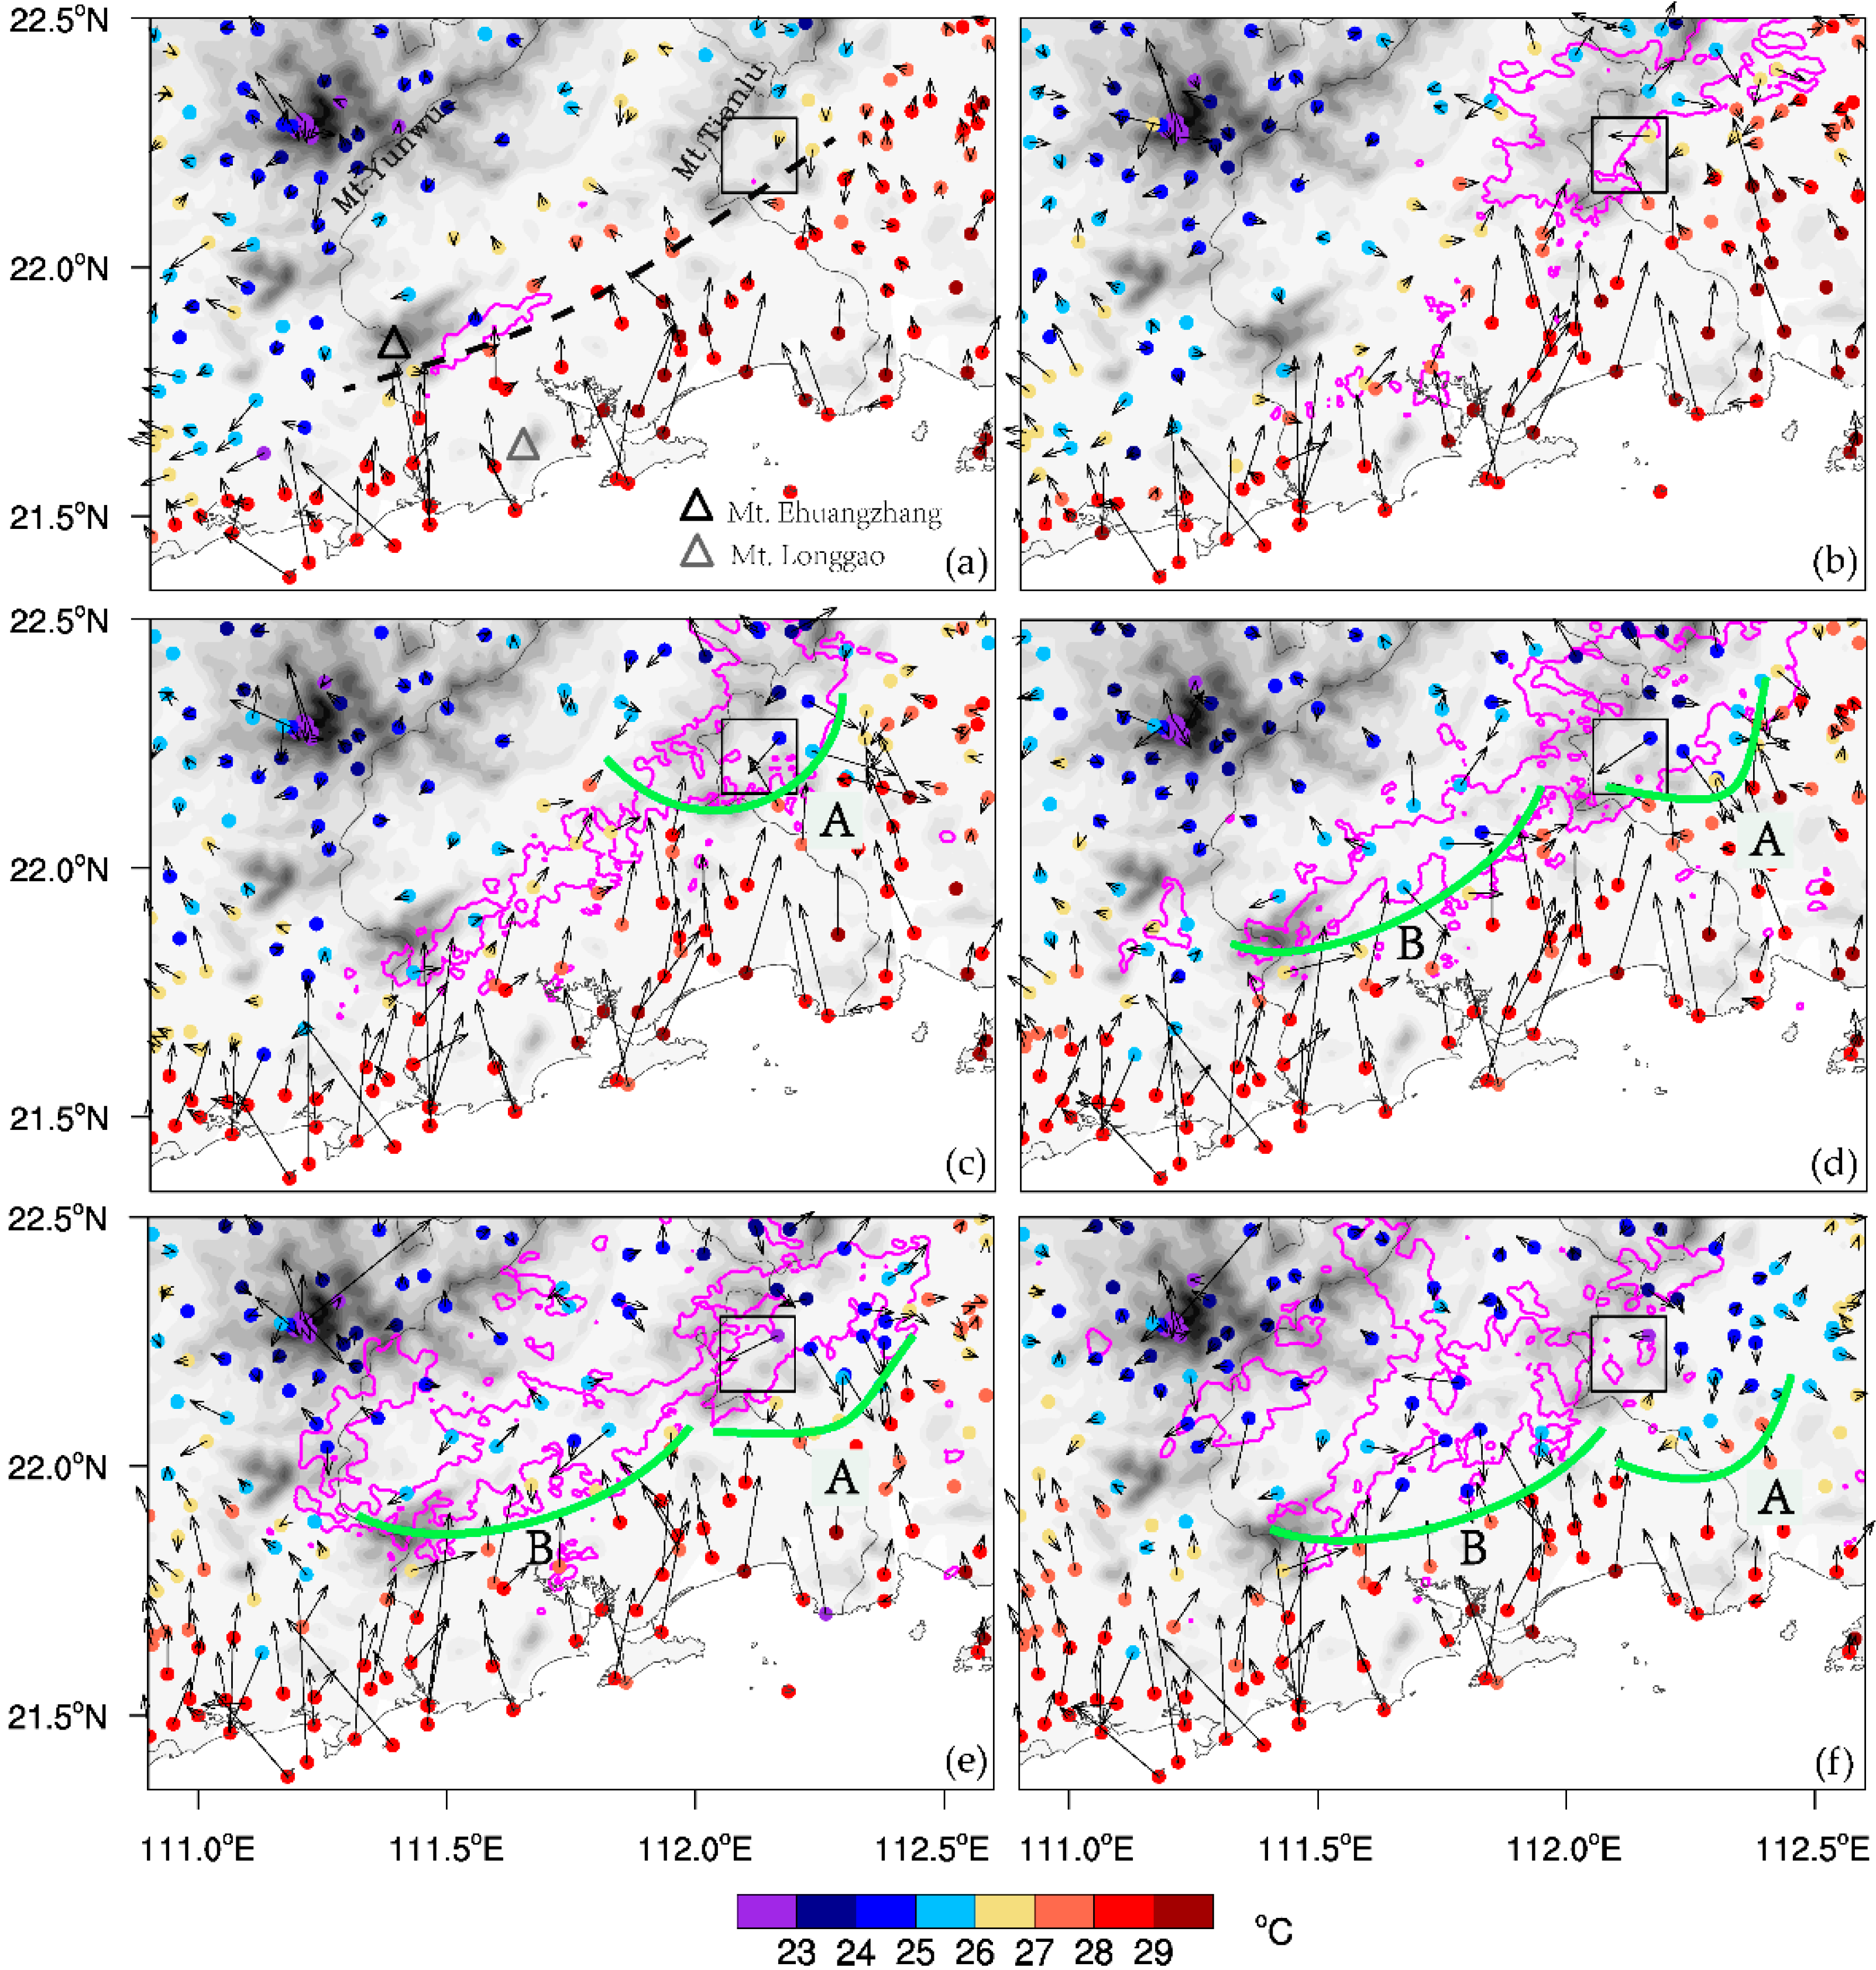
(2)
The initial convection occurred to the southwest of the mesoscale convergence line. The convection near Jinjiang was strengthened under the joint effect of the enhancement of jet streams and the orographic lifting effect. Due to the extremely humid environmental conditions, the cold outflow boundary formed mainly by rain evaporative cooling was weak, leading to formation of the quasi-stationary outflow boundary, which continuously lifted the warm and humid unstable air from the northern SCS and resulted in extreme precipitation over Jinjiang.
(3)
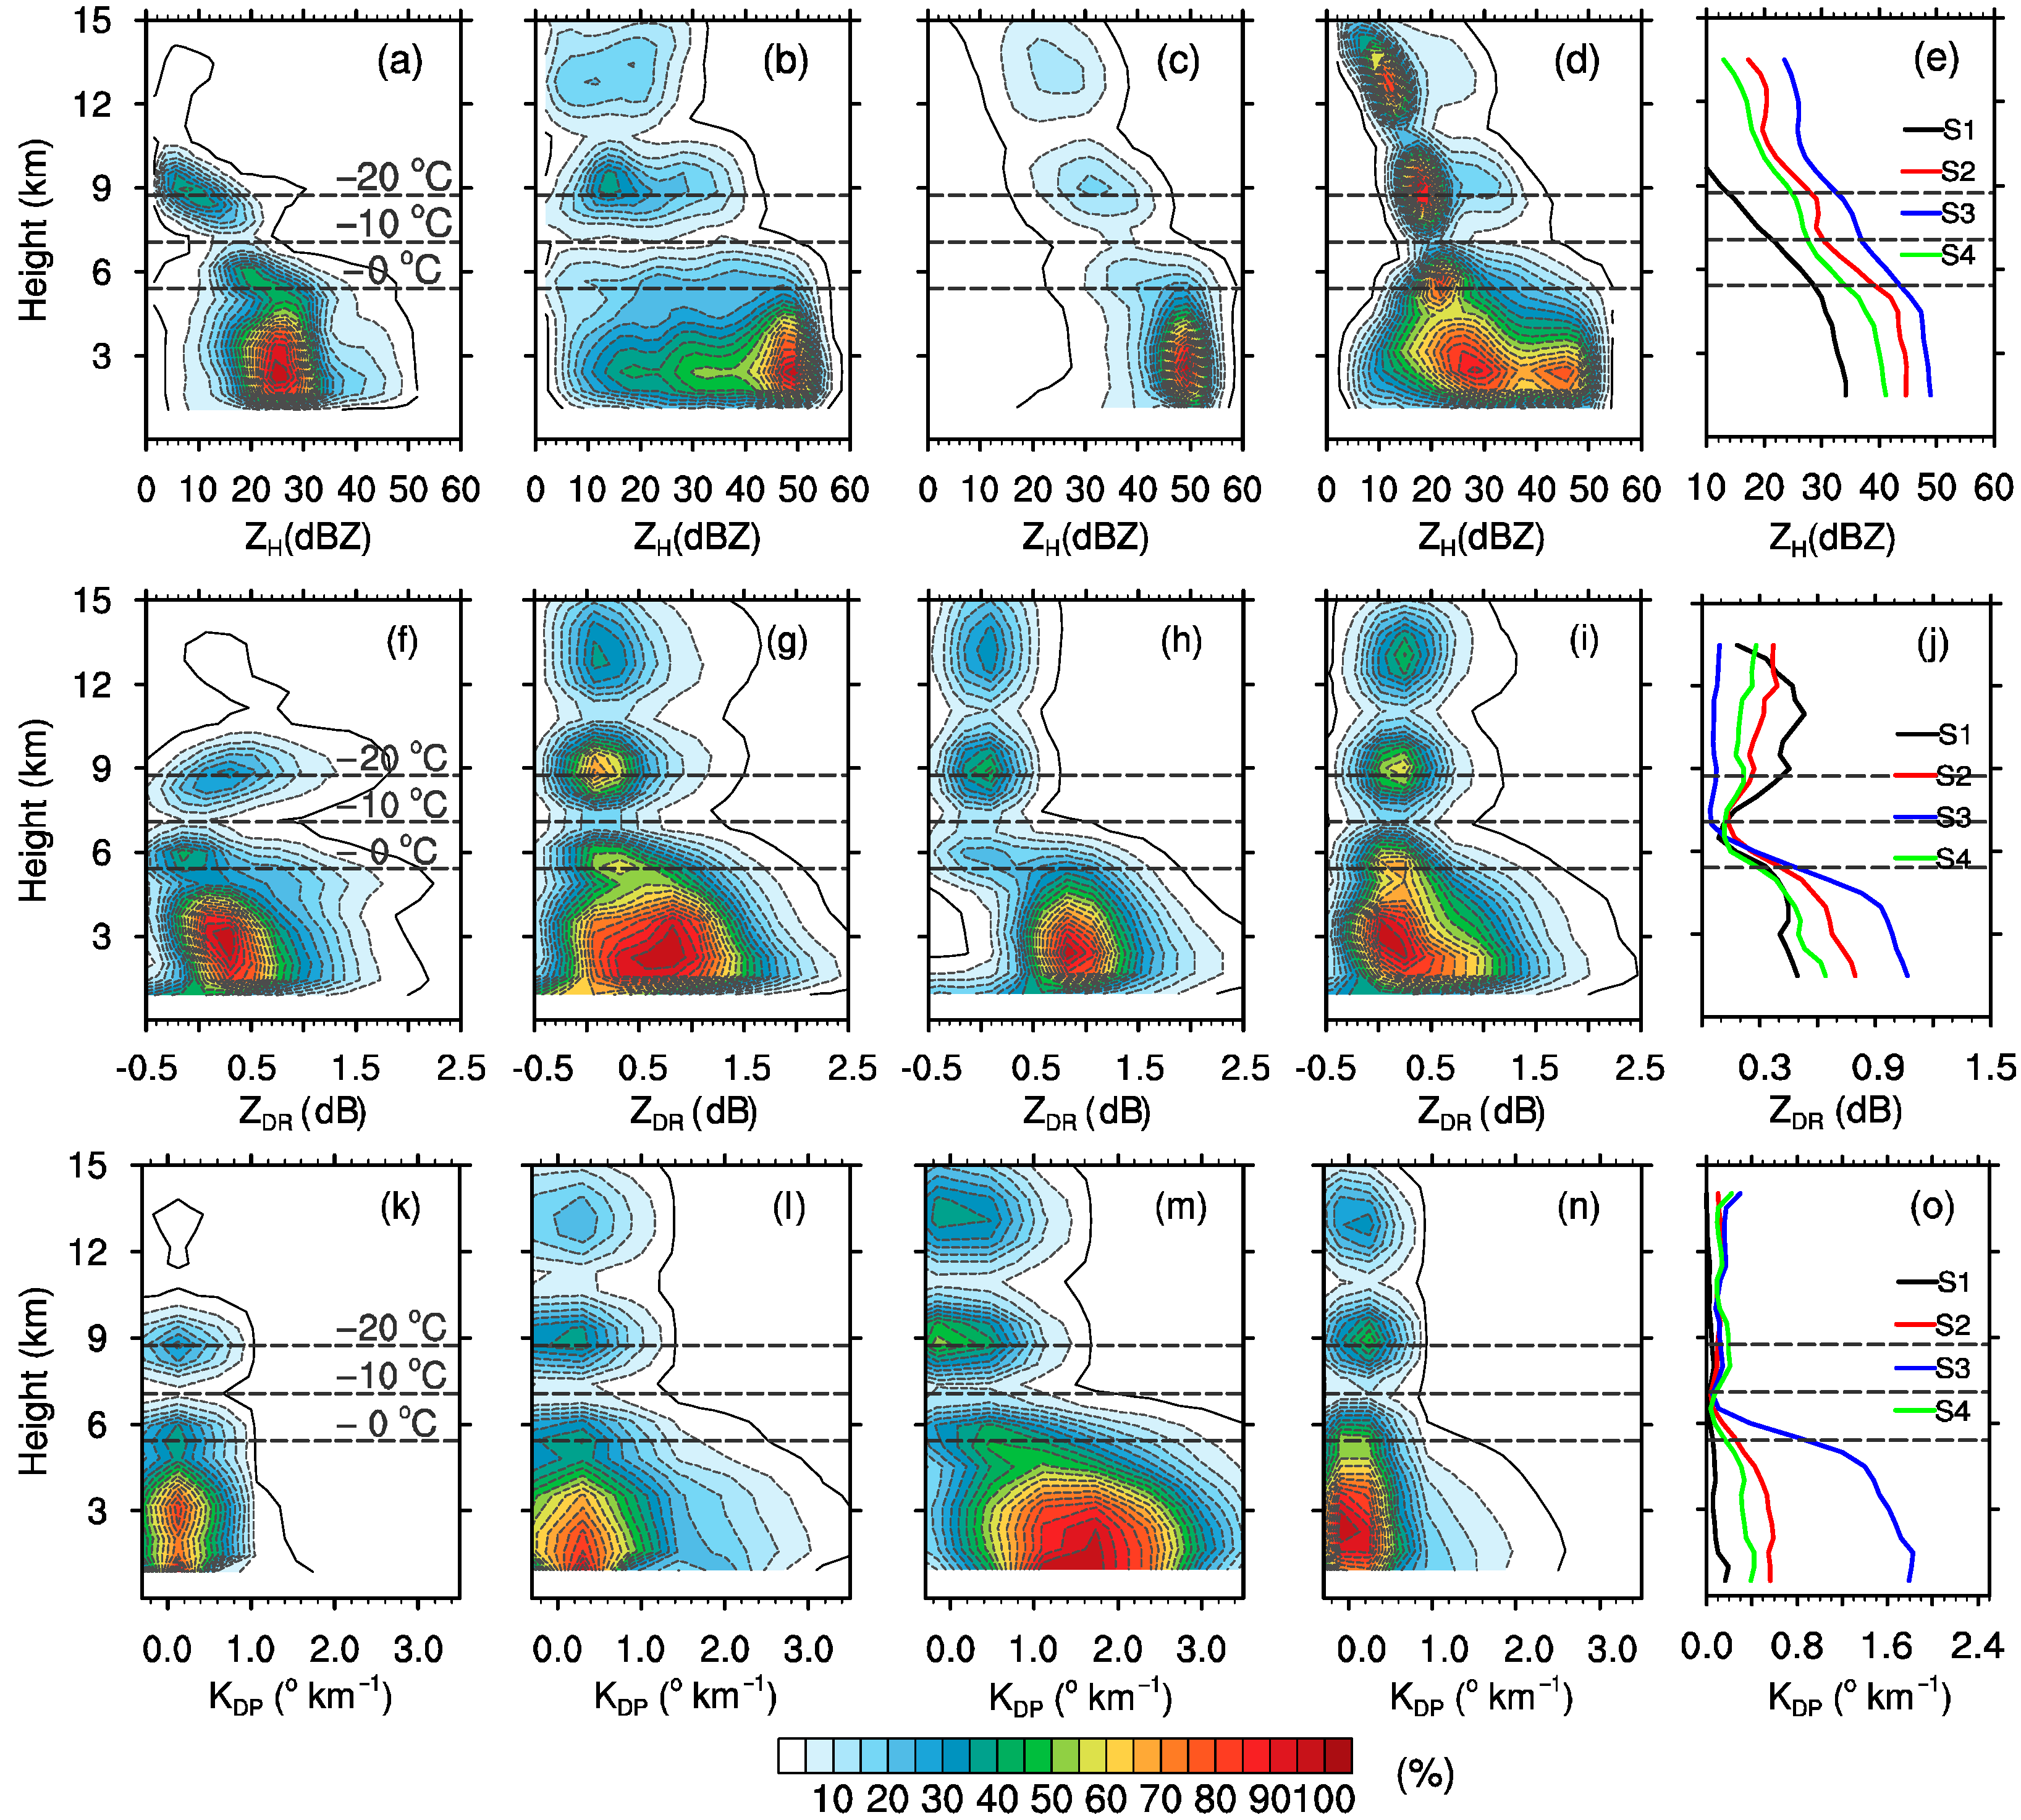
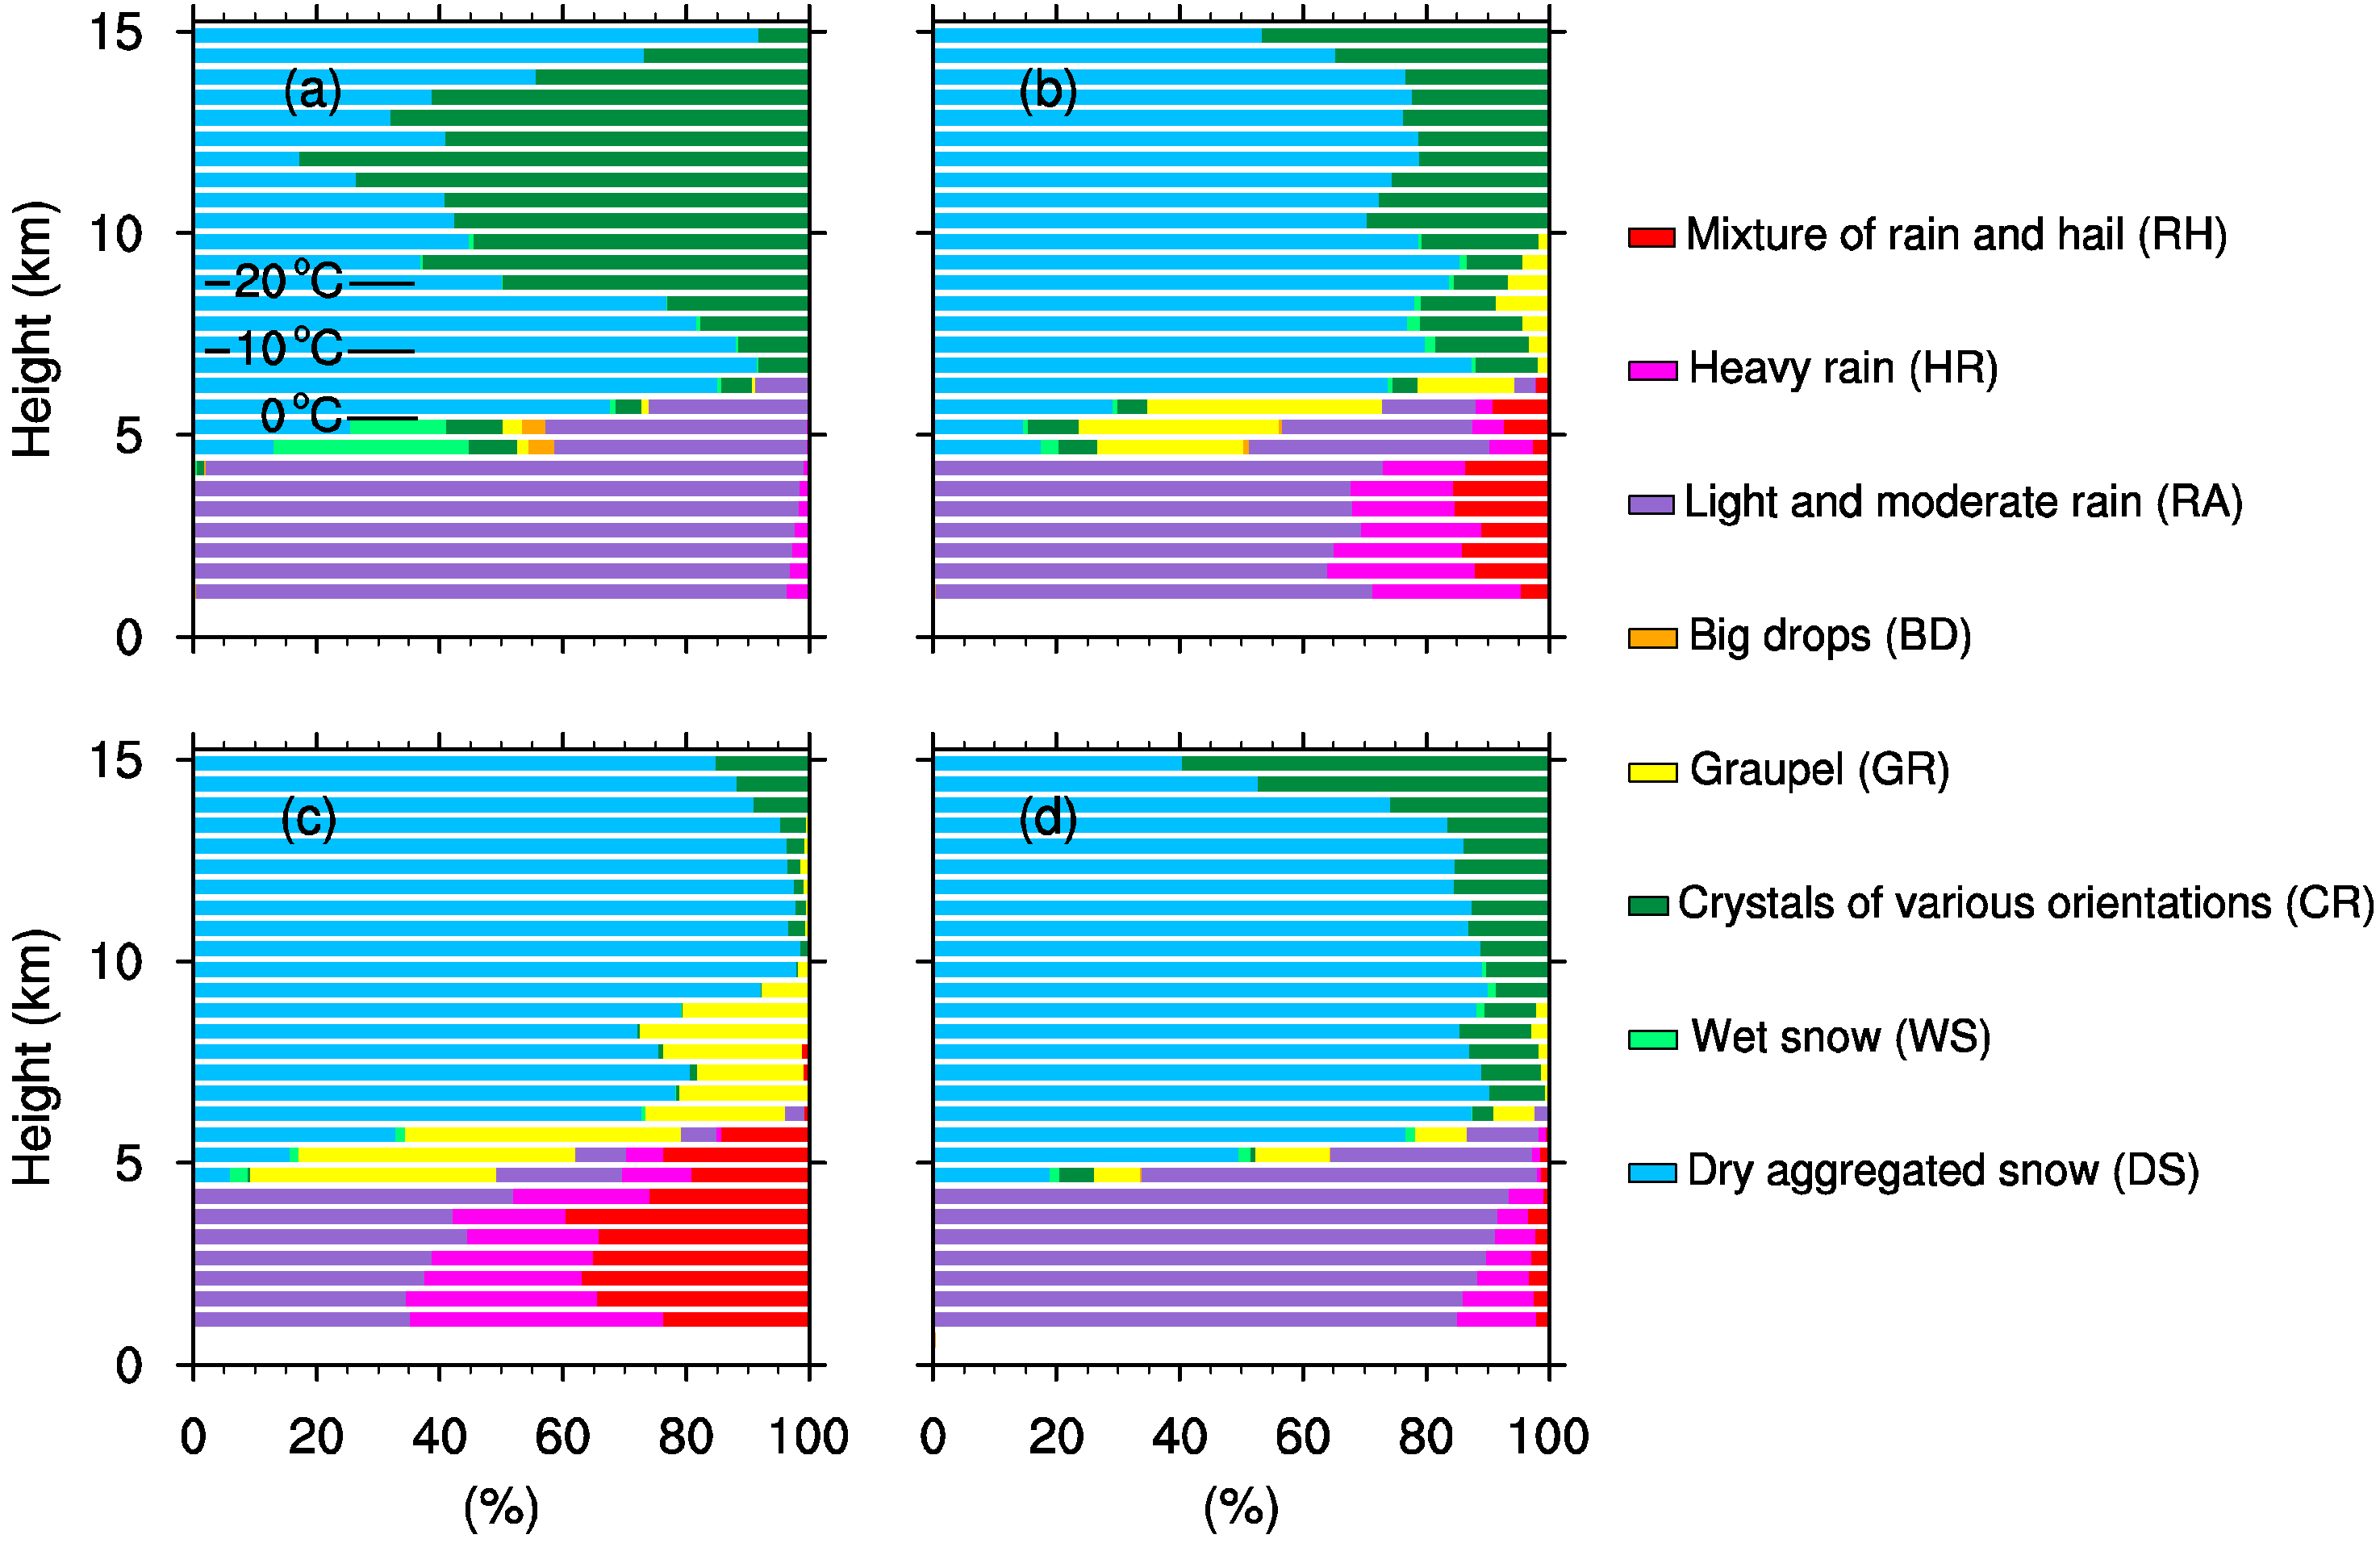
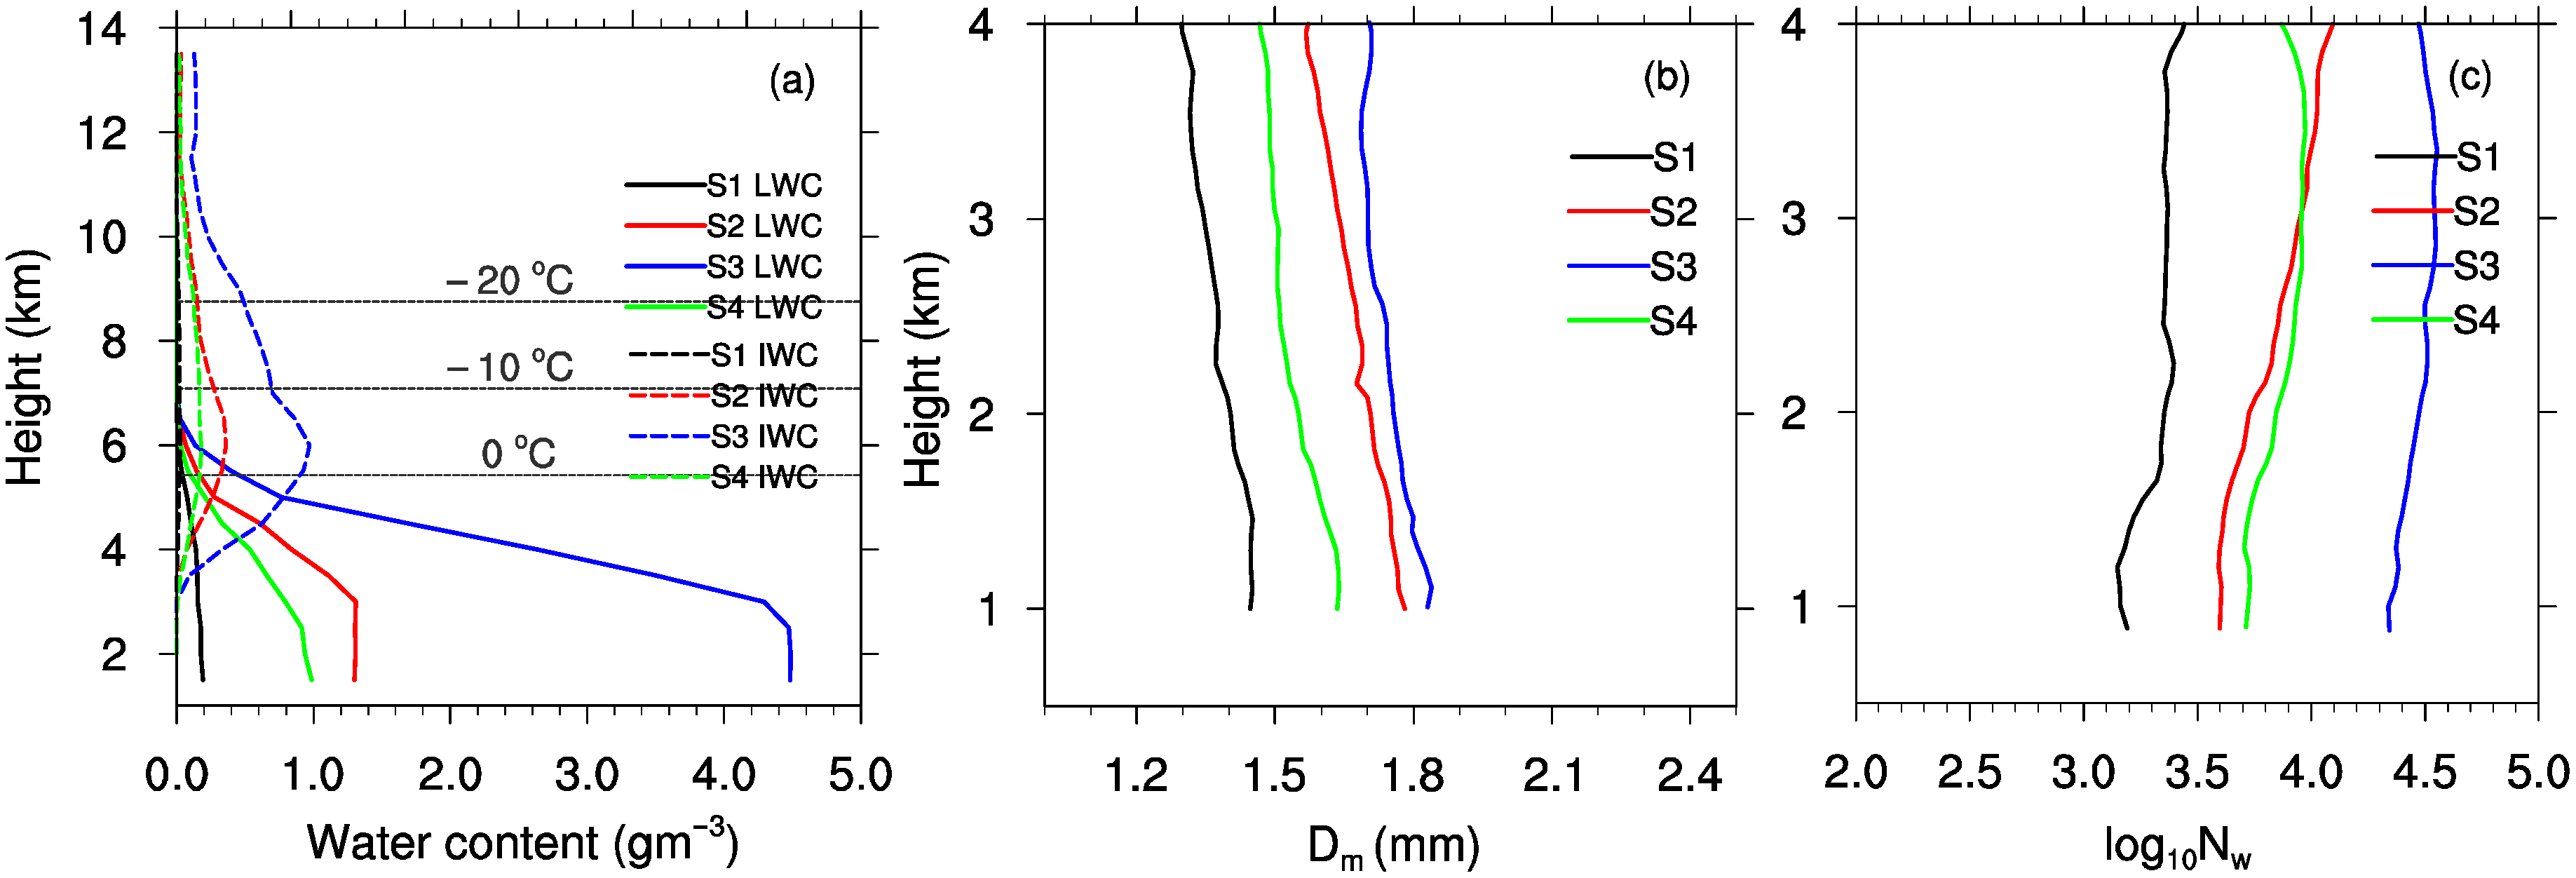
In the initial stage of the extreme rainfall-producing storm, the ice crystals and snowflakes grew slowly through deposition and aggregation above the 0 °C level. The ice crystal and snowflakes mostly directly melted into raindrops after passing through the freezing level. The water contents increased with the enhancement of convection, and the mean particle size also increased due to enhanced deposition and aggregation processes. Additionally, during the developing and mature stages, large ice particles or graupels, and the increase in the proportion of heavy rainfall indicated that the riming processes from the 0 °C level layer to the −20 °C level, and the melting and collision coalescence processes below this were important microphysical processes.
(4)
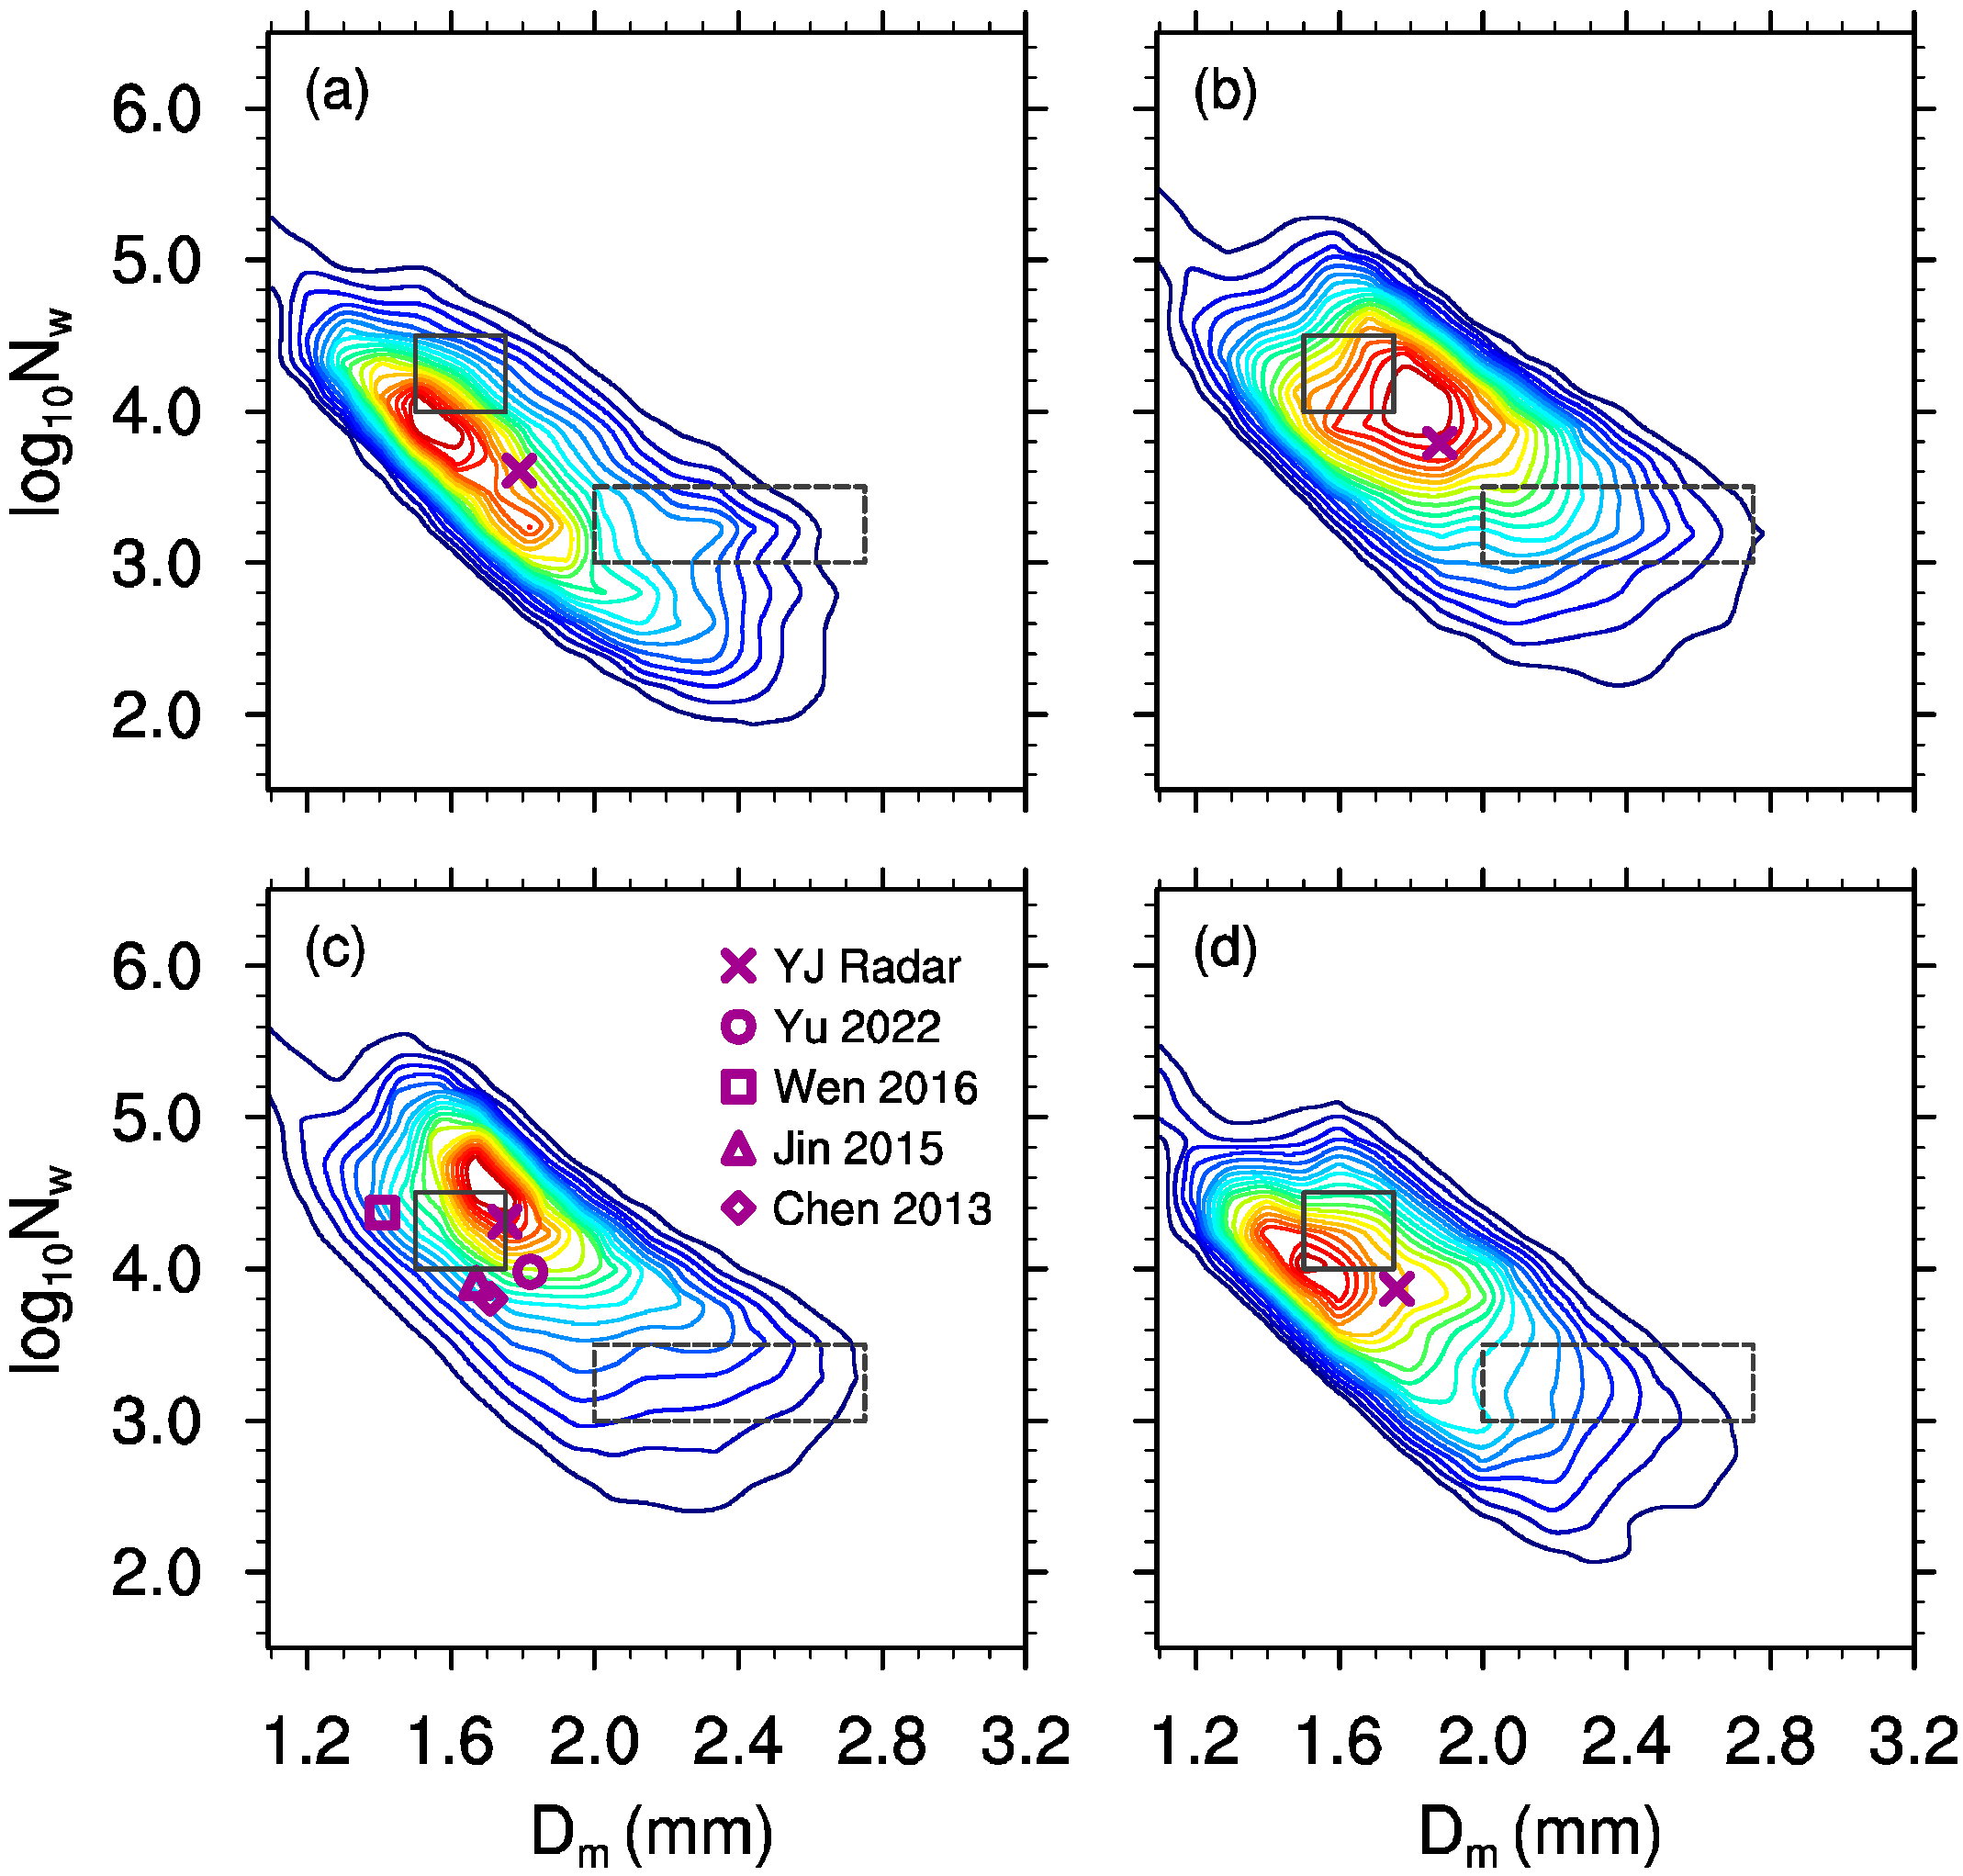
The maximum ice water content accounted for about 22.2% of the maximum liquid water content, indicating that the contribution of warm rain was much higher than that of the ice-phase process in this rainfall event. The continuous increase in liquid water from freezing level to 2 km AGL was due to extreme moist environment and the low lifting condensation level. The mean Dm and log10Nw of raindrops increased continuously as the convection developed to the maturity stage, which was similar to the characteristics of an “oceanic” convection event. In addition, the high precipitation efficiency over Jinjiang was mainly reflected by a greater log10Nw.
The detailed analyses using multisource observations in this study have added to the knowledge of the warm-sector extreme rainfall in South China. Taking full advantage of the increasingly advanced observations over South China, more studies are needed to further reveal the multiscale features, especially the meso-γ-scale and microphysical properties of different types of rainstorms, e.g., those in the warm sector or associated with fronts and tropical cyclones over South China.

Author Contributions

Conceptualization, Y.P., Y.L. and S.H.; data curation, X.L., Y.P. and F.X.; formal analysis, Y.P., S.H. and Y.L.; methodology, S.H. and Y.L.; validation, Y.L., X.L., H.L., L.H., L.Y. and L.G.; writing—original draft, Y.P. and X.L.; writing—review and editing, Y.P., Y.L. and S.H. All authors have read and agreed to the published version of the manuscript.

Funding

This work was jointly supported by the National Natural Science Foundation of China (Grant Nos. 42030610, 41975138, 41905047, and 42075086), and the Natural Science Foundation of Guangdong Province (Grant No. 2019A1515010814).

Conflicts of Interest

The authors declare no conflict of interest.

References

  1. Tao, S. Rainstorms in China; Science Press: Beijing, China, 1980; pp. 45–46. (In Chinese) [Google Scholar]
  2. Chen, H.; Zhao, S. Heavy rainfalls in South China and related circulation during first GARP global experiment period. Chin. J. Atmos. Sci. 2000, 24, 238–252, (In Chinese with English Abstract). [Google Scholar] [CrossRef]
  3. Zhou, T.; Yu, R.; Chen, H.; Dai, A.; Pan, Y. Summer precipitation frequency, intensity, and diurnal cycle over China: A comparison of satellite data with rain gauge observations. J. Clim. 2008, 21, 3997–4010. [Google Scholar] [CrossRef]
  4. Zhao, S.; Bei, N.; Sun, J. Mesoscale Analysis of a Heavy Rainfall Event over Hong Kong During a Pre-rainy Season in South China. Adv. Atmos. Sci. 2007, 24, 555–572. [Google Scholar] [CrossRef]
  5. Zhao, Y.; Wang, Y. A review of studies on torrential rain during pre-summer flood season in South China since the 1980′s. Torrential Rain Disasters 2009, 28, 193–202, (In Chinese with English Abstract). [Google Scholar] [CrossRef]
  6. Luo, Y.; Zhang, R.; Wan, Q.; Wang, B.; Xiao, Y. The Southern China Monsoon Rainfall Experiment (SCMREX). Bull. Am. Meteor. Soc. 2017, 98, 999–1013. [Google Scholar] [CrossRef]
  7. Ninomiya, K.; Akiyama, T. The development of the medium-scale disturbance in the Baiu front. J. Meteorol. Soc. Jpn. 1971, 49A, 663–677. [Google Scholar] [CrossRef]
  8. Ninomiya, K.; Akiyama, T. Band Structure of Mesoscale Echo Clusters Associated with Low-Level Jet. J. Meteorol. Soc. Jpn. 1974, 52, 300–313. [Google Scholar] [CrossRef] [Green Version]
  9. Ninomiya, K.; Akiyama, T.; Ikawa, M. Evolution process and fine structure of a long-lived meso-α-scale convective system in Baiu front. Part1: Evolution and meso-β-scale characteristics. J. Meteorol. Soc. Jpn. 1988, 66, 331–350. [Google Scholar] [CrossRef] [Green Version]
  10. Huang, S. Rainstorm during Prerainy Season in South China; Guangdong Science and Technology Press: Guangzhou, China, 1986; pp. 9–10, (In Chinese with English Abstract). [Google Scholar]
  11. Meng, W.; Wang, A.; Li, J.; Fong, S.; Hou, E. Moist potential vorticity analysis of the heavy rainfall and mesoscale convective systems in South China. Chin. J. Atmos. Sci. 2004, 28, 330–341, (In Chinese with English Abstract). [Google Scholar] [CrossRef]
  12. Wu, N.; Ding, X.; Wen, Z.; Chen, G.; Meng, Z.; Lin, L.; Min, J. Contrasting frontal and warm-sector heavy rainfalls over South China during the early-summer rainy season. Atmos. Res. 2020, 235, 104693. [Google Scholar] [CrossRef]
  13. Luo, Y.; Li, L.; Johnson, R.; Chang, C.; Chen, L.; Wong, W.; Chen, J.; Furtado, K.; McBride, J.; Tyagi, A.; et al. Science and Prediction of Monsoon Heavy Rainfall. Sci. Bull. 2019, 64, 1557–1561. [Google Scholar] [CrossRef] [Green Version]
  14. Sun, J.; Zhang, Y.; Liu, R.; Fu, S.; Tian, F. A review of research on warm-sector heavy rainfall in China. Adv. Atmos. Sci. 2019, 36, 1299–1307. [Google Scholar] [CrossRef]
  15. Chen, G.; Sha, W.; Iwasaki, T. Diurnal variation of precipitation over southeastern China: Spatial distribution and its seasonality. J. Geophys. Res. Atmos. 2009, 114, D13103. [Google Scholar] [CrossRef] [Green Version]
  16. Chen, X.; Zhao, K.; Xue, M. Spatial and temporal characteristics of warm season convection over Pearl River Delta region, China, based on 3 years of operational radar data. J. Geophys. Res. Atmos. 2014, 119, 12447–12465. [Google Scholar] [CrossRef]
  17. Chen, X.; Zhao, K.; Xue, M.; Zhou, B.; Huang, X.; Xu, W. Radar-observed diurnal cycle and propagation of convection over the Pearl River delta during Mei-Yu season. J. Geophys. Res. Atmos. 2015, 120, 12557–12575. [Google Scholar] [CrossRef] [Green Version]
  18. He, L.; Chen, T.; Kong, Q. A review of studies on prefrontal torrential rain in South China. J. Appl. Meteorol. Sci. 2016, 27, 559–569, (In Chinese with English Abstract). [Google Scholar] [CrossRef]
  19. Chen, T. Mesoscale features observed in the Taiwan Mei-Yu season. J. Meteorol. Soc. Jpn. 1992, 70, 497–561. Available online: http://140.112.114.62/handle/246246/98623 (accessed on 13 May 2022). [CrossRef] [Green Version]
  20. Xia, R.; Zhao, S. Diagnosis and modeling of Meso-β-scale systems of heavy rainfall in warm sector ahead of front in South China (middle part of Guangdong Province) in June 2005. Chin. J. Atmos. Sci. 2009, 33, 468–488, (In Chinese with English Abstract). [Google Scholar] [CrossRef]
  21. Li, B.; Liu, L.P.; Zhao, S.; Huang, C. Numerical experiment of the effect of local low terrain on heavy rainstorm of south china. Plateau Meteorol. 2013, 32, 1638–1650, (In Chinese with English Abstract). [Google Scholar] [CrossRef]
  22. Wang, H.; Luo, Y.; Jou, B. Initiation, maintenance, and properties of convection in an extreme rainfall event during SCMREX: Observational analysis. J. Geophy. Res. Atmos. 2014, 119, 13206–13232. [Google Scholar] [CrossRef]
  23. Bao, X.; Luo, Y.; Gao, X. The Synoptic Impacts on the Convection Initiation of a Warm-sector Heavy Rainfall Event over Coastal South China Prior to the Monsoon Onset: A Numerical Modeling Study. J. Geophys. Res. Atmos. 2021, 126, e2020JD034335. [Google Scholar] [CrossRef]
  24. Wang, Q.; Zhang, Y.; Zhu, K.; Tan, Z.; Xue, M. A case study of the initiation of parallel convective lines back-building from the south side of a mei-yu front over complex terrain. Adv. Atmos. Sci. 2021, 38, 717–736. [Google Scholar] [CrossRef]
  25. Ding, Y.; Liu, Y. Onset and the evolution of the summer monsoon over the South China Sea during SCSMEX field experiment in 1998. J. Meteorol. Soc. Jpn. 2001, 79, 255–276. [Google Scholar] [CrossRef] [Green Version]
  26. Luo, Y.; Wang, H.; Zhang, R.; Qian, W. Comparison of rainfall characteristics and convective properties of monsoon precipitation systems over south China and Yangtze-and-Huai rivers basin. J. Clim. 2013, 26, 110–132. [Google Scholar] [CrossRef] [Green Version]
  27. Xu, W.; Zipser, E.; Chen, Y.; Liu, C.; Liou, Y.; Lee, W.; Jou, B. An orography-associated extreme rainfall event during TiMREX: Initiation, storm evolution and maintenance. Mon. Weather Rev. 2015, 140, 2555–2574. [Google Scholar] [CrossRef] [Green Version]
  28. Wu, M.; Luo, Y. Mesoscale Observational Analysis of Lifting Mechanism of a Warm-sector Convective System Producing the Maximal Daily Precipitation in China Mainland during Presummer Rainy Season of 2015. J. Meteorol. Res. 2016, 30, 719–736. [Google Scholar] [CrossRef]
  29. Liu, X.; Luo, Y.; Guan, Z.; Zhang, D. An extreme rainfall event in coastal south China during SCMREX-2014: Formation and roles of rainband and echo trainings. J. Geophys. Res. Atmos. 2018, 123, 9256–9278. [Google Scholar] [CrossRef] [Green Version]
  30. Luo, Y.; Gong, Y.; Zhang, D. Initiation and organizational modes of an extreme-rain-producing mesoscale convective system along a Mei-Yu Front in East China. Mon. Weather Rev. 2014, 142, 203–221. [Google Scholar] [CrossRef] [Green Version]
  31. Chen, Y.; Luo, Y.; Liu, B. General features and synoptic-scale environments of mesoscale convective systems over South China during the 2013–2017 pre-summer rainy seasons. Atmos. Res. 2022, 266, 105954. [Google Scholar] [CrossRef]
  32. Du, Y.; Chen, G. Heavy Rainfall Associated with Double Low-Level Jets over Southern China. Part II: Convection Initiation. Mon. Weather Rev. 2019, 147, 543–565. [Google Scholar] [CrossRef]
  33. Mohr, K.; Toracinta, R.; Zipser, E.; Orville, R. A Comparison of WSR-88D Reflectivities, SSM/I Brightness Temperatures, and Lightning for Mesoseale Convective Systems in Texas. Part II. SSM/I Brightness Temperatures and Lightning. J. Appl. Meteorol. Climatol. 1996, 35, 919–931. [Google Scholar] [CrossRef] [Green Version]
  34. Zipser, E.; Lutz, K. The vertical profile of radar reflectivity of convective cells: A strong indicator of storm intensity and lightning probability. Mon. Weather Rev. 1994, 122, 1751–1759. [Google Scholar] [CrossRef] [Green Version]
  35. Xu, W. Thunderstorm climatologies and their relationships to total and extreme precipitation in China. J. Geophys. Res. Atmos. 2020, 125, e2020JD033152. [Google Scholar] [CrossRef]
  36. Carey, L.; Rutledge, S. The relationship between precipitation and lightning in tropical island convection: A C-band polarimetric radar study. Mon. Weather Rev. 2000, 128, 2687–2710. [Google Scholar] [CrossRef] [Green Version]
  37. Li, M.; Luo, Y.; Zhang, D.; Chen, M.; Wu, C.; Yin, J.; Yun, M. Analysis of a Record-Breaking Rainfall Event Associated with a Monsoon Coastal Megacity of South China Using Multisource Data. IEEE Trans. Geosci. Remote Sens. 2021, 59, 6404–6414. [Google Scholar] [CrossRef]
  38. Sohn, B.; Ryu, G.; Song, H.; Ou, M. Characteristic features of warm-type rainproducing heavy rainfall over the korean peninsula inferred from TRMM measurements. Mon. Weather Rev. 2013, 141, 3873–3888. [Google Scholar] [CrossRef]
  39. Bringi, V.; Chandrasekar, V.; Hubbert, J.; Gorgucci, E.; Randeu, W.; Schoenhuber, M. Raindrop size distribution in different climatic regimes from disdrometer and dual-polarized radar analysis. J. Atmos. Sci. 2003, 60, 354–365. [Google Scholar] [CrossRef]
  40. Kumjian, M.; Ryzhkov, A. The Impact of Size Sorting on the Polarimetric Radar Variables. J. Atmos. Sci. 2012, 69, 2042–2060. [Google Scholar] [CrossRef]
  41. Wang, M.; Zhao, K.; Xue, M.; Zhang, G.; Liu, S.; Wen, L.; Chen, G. Precipitation microphysics characteristics of a Typhoon Matmo (2014) rainband after landfall over eastern China based on polarimetric radar observations. J. Geophys. Res. Atmos. 2016, 121, 12415–12433. [Google Scholar] [CrossRef]
  42. Wen, J.; Zhao, K.; Huang, H.; Liu, S.; Chen, G. Evolution of microphysical structure of a subtropical squall line observed by a polarimetric radar and a disdrometer during OPACC in Eastern China. J. Geophys. Res. Atmos. 2017, 122, 8033–8050. [Google Scholar] [CrossRef]
  43. Wu, D.; Zhao, K.; Kumjian, M.; Chen, X.; Huang, H.; Wang, M.; Didlake, A., Jr.; Duan, Y.; Zhang, F. Kinematics and microphysics of convection in the outer rainband of typhoon Nida (2016) revealed by polarimetric radar. Mon. Weather Rev. 2018, 146, 2147–2159. [Google Scholar] [CrossRef]
  44. Han, B.; Du, Y.; Wu, C.; Liu, X. Microphysical characteristics of the coexisting frontal and warm-sector heavy rainfall in South China. J. Geophys. Res. Atmos. 2021, 126, e2021JD035446. [Google Scholar] [CrossRef]
  45. Yu, S.; Luo, Y.; Wu, C.; Zheng, D.; Liu, X.; Xu, W. Convective and microphysical characteristics of extreme precipitation revealed by multisource observations over the Pearl River Delta at monsoon coast. Grophys. Res. Lett. 2022, 49, e2021GL097043. [Google Scholar] [CrossRef]
  46. Guo, Z.; Hu, S.; Liu, X.; Chen, X.; Zhang, H.; Qi, T.; Zeng, G. Improving S-Band Polarimetric Radar Monsoon Rainfall Estimation with Two-Dimensional Video Disdrometer Observations in South China. Atmosphere 2021, 12, 831. [Google Scholar] [CrossRef]
  47. Chen, G.; Zhao, K.; Zhang, G.; Huang, H.; Liu, S.; Wen, L.; Yang, Z.; Yang, Z.; Xu, L.; Zhu, W. Improving polarimetric c–band radar rainfall estimation with two–dimensional video disdrometer observations in eastern China. J. Hydrol. 2017, 18, 1375–1391. [Google Scholar] [CrossRef]
  48. Li, H.; Wan, Q.; Peng, D.; Liu, X.; Xiao, H. Multiscale analysis of a record-breaking heavy rainfall event in Guangdong, China. Atmos. Res. 2020, 232, 104703. [Google Scholar] [CrossRef]
  49. Tokay, A.; Petersen, W.; Gatlin, P.; Wingo, M. Comparison of Raindrop Size Distribution Measurements by Collocated Disdrometers. J. Atmos. Ocean. Technol. 2013, 30, 1672–1690. [Google Scholar] [CrossRef]
  50. Zhang, G.; Vivekanandan, J.; Brandes, E. A method for estimating rain rate and drop size distribution from polarimetric radar measurements. IEEE Trans. Geosci. Remote Sens. 2001, 39, 830–841. [Google Scholar] [CrossRef] [Green Version]
  51. Cifelli, R.; Petersen, W.; Carey, L.; Rutlsdge, S. Radar observations of the kinematic, microphysical, and precipitation characteristics of two MCSs in TRMM LBA. J. Geophys. Res. 2002, 107, 8077. [Google Scholar] [CrossRef] [Green Version]
  52. Wang, J.; Carey, L. The development and structure of an oceanic squall-line system during the South China Sea Monsoon Experiment. Mon. Weather Rev. 2005, 133, 1544–1561. [Google Scholar] [CrossRef]
  53. Chang, W.; Lee, W.; Liou, Y. The kinematic and microphysical characteristics and associated precipitation efficiency of subtropical convection during SoWMEX/TiMREX. Mon. Weather Rev. 2015, 143, 317–340. [Google Scholar] [CrossRef]
  54. Park, H.; Ryzhkov, A.; Zrnić, D.; Kim, K. The Hydrometeor Classification Algorithm for the Polarimetric WSR-88D: Description and Application to an MCS. Weather Forecast. 2009, 24, 730–748. [Google Scholar] [CrossRef]
  55. Wu, C.; Liu, L.; Wei, M.; Xi, B.; Yu, M. Statistics-based optimization of the polarimetric radar hydrometeor classification algorithm and its application for a squall line in South China. Adv. Atmos. Sci. 2018, 35, 296–316. [Google Scholar] [CrossRef]
  56. Ulbrich, C. Natural Variations in the Analytical Form of the Raindrop Size Distribution. J. Appl. Meteorol. 1983, 22, 1764–1775. [Google Scholar] [CrossRef] [Green Version]
  57. Testud, J.; Oury, S.; Amayenc, P.; Black, R.; Dou, X. The concept of “normalized” distributions to describe raindrop spectra: A tool for cloud physics and cloud remote sensing. J. Appl. Meteorol. 2001, 40, 1118–1140. [Google Scholar] [CrossRef]
  58. Zhang, G.; Vivekanandan, J.; Brandes, E.; Meneghini, R.; Kozu, T. The shape-slope relation in observed Gamma raindrop size distributions: Statistical error or useful information. J. Atmos. Ocean. Technol. 2003, 20, 1106–1119. [Google Scholar] [CrossRef] [Green Version]
  59. Liu, X.; Wan, Q.; Wang, H.; Xiao, H.; Zhang, Y.; Zheng, T.; Feng, L. Raindrop size distribution parameters retrieved from Guangzhou S-band polarimetric radar observations. J. Meteorol. Res. 2018, 32, 571–583. [Google Scholar] [CrossRef]
  60. Du, Y.; Chen, G. Heavy Rainfall Associated with Double Low-Level Jets over Southern China. Part I: Ensemble-Based Analysis. Mon. Weather Rev. 2018, 146, 3827–3844. [Google Scholar] [CrossRef]
  61. Markowski, P.; Richardson, Y. Mesoscale Meteorology in Midlatitudes; Wiley-Blackwell: Oxford, UK, 2010; 430p. [Google Scholar]
  62. Petersen, W.; Rutledge, S. Regional variability in tropical convection: Observations from TRMM. J. Clim. 2001, 14, 3566–3586. [Google Scholar] [CrossRef]
  63. Yuter, S.; Houze, R. Three-dimensional kinematic and microphysical evolution of Florida cumulonimbus. Part II: Frequency distributions of vertical velocity, reflectivity, and differential reflectivity. Mon. Weather Rev. 1995, 123, 1941–1963. [Google Scholar] [CrossRef]
  64. Bailey, M.; Hallett, J. A comprehensive habit diagram for atmospheric ice crystals: Confirmation from the Laboratory, AIRS II, and other field studies. J. Atmos. Sci. 2009, 66, 2888–2899. [Google Scholar] [CrossRef] [Green Version]
  65. Rosenfeld, D.; Ulbrich, C. Cloud microphysical properties, processes, and rainfall estimation opportunities. Meteorol. Monogr. 2003, 30, 237–258. [Google Scholar] [CrossRef]
  66. Kumjian, M.; Prat, O. The impact of raindrop collisional processes on the polarimetric radar variables. J. Atmos. Sci. 2014, 71, 3052–3067. [Google Scholar] [CrossRef]
  67. Liu, C.; Zipser, E. The globaldistribution of largest, deepest, and most intense precipitation systems. Geophys. Res. Lett. 2015, 42, 3591–3595. [Google Scholar] [CrossRef] [Green Version]
  68. Chen, B.; Yang, J.; Pu, J. Statistical Characteristics of Raindrop Size Distribution in the Meiyu Season Observed in Eastern China. J. Meteorol. Soc. Jpn. 2013, 91, 215–227. [Google Scholar] [CrossRef] [Green Version]
  69. Jin, Q.; Yuan, Y.; Ji, L.; Lu, D.; Feng, J. Characteristics of Raindrop Size Distribution for a Squall Line at Chuzhou of Anhui During Summer. J. Appl. Meteorol. Sci. 2015, 26, 725–734, (In Chinese with English Abstract). [Google Scholar] [CrossRef]
  70. Wen, L.; Zhao, K.; Zhang, G.; Xue, M.; Zhou, B.; Liu, S.; Chen, X. Statistical Characteristics of Raindrop Size Distributions Observed in East China during the Asian Summer Monsoon Season using 2D-Video Disdrometer and Micro-rain Radar Data. J. Geophys. Res. Atmos. 2016, 121, 2265–2282. [Google Scholar] [CrossRef] [Green Version]
Figure 1. (a) Topography (shading) of South China and its vicinity. The South China Sea and the provinces of Guangdong and Guangxi are labeled. The locations of the YJ S-POL and 2DVD, the microwave radiometer, the YJ sounding station, and wind profiler radars are denoted by a red pentacle, a red square, a red circle, a purple asterisk, and two red triangles, respectively. The circle has a radius of 150 km and is centered on the YJ S-POL. (b) Distribution of the accumulated rainfall at 2000 LST 21–22 June 2017 based on rain gauge observations. Grey shading represents the topography; The small box denotes the key region around Jinjiang. Mt. Tianlu, Mt. Yunwu, Mt. Ehuangzhang, and Mt. Longgao are labeled. The stations with the top three rainfall accumulations are labeled. (c) Time series of the rainfall rate (5-min rain rate) and (d) the hourly rainfall accumulation (accumulated every 5 min) recorded at the stations of Jinjiang (blue line), G6516 (red line), and Gangmei (green line), whose locations are given in (b). (e) Time–height distribution of ZH over Jinjiang (a 10 km × 10 km area centered on Jinjiang station). The dashed lines mark the four stages.
Remotesensing 14 03110 g001
Figure 2. Temporal evolution of (a) radar reflectivity (ZH, dBZ), (b) mass-weighted mean diameter (Dm, mm), and (c) logarithmic normalized intercept (log10Nw, units of Nw: mm−1 m−3) at the Enping station recorded by the 2DVD versus those retrieved from YJ S-POL at 1.5° elevation. R, ME, and MD represent the correlation coefficient, the mean error, and mean deviation of 2DVDs and the radar, respectively. Blue crosses and the red curve denote the 6 min radar-based results and the 1 min 2DVD observations, respectively, while the grey bars denote the rain rate observed by the 2DVD.
Remotesensing 14 03110 g002
Figure 3. Radar reflectivity (ZH, dBZ) of YJ S-POL (1.5° elevation) at (a) 2130 LST 21, (b) 2324 LST 21, (c) 0036 LST 22, (d) 0124 LST 22, (e) 0230 LST 22, (f) 0318 LST 22, (g) 0430 LST 22, (h) 0530 LST 22 and (i) 0624 LST 22. The asterisk represents the location of YJ S-POL; circles represent distances 50 km and 100 km from the radar. The solid magenta line box represents the key region. The blue solid-line box represents another strong convection area centered near Gangmei. Black and gray triangles represent the Mt. Ehuangzhang and Mt. Longgao, respectively.
Remotesensing 14 03110 g003
Figure 4. The horizontal wind (barbs and shadings; m s−1) and geopotential height (solid red contours at intervals of 20 gpm) at (a,c) 2000 LST on 21 June and (b,d) 0200 LST on 22 June 2017 at 850 hPa (a,b) and 925 hPa (c,d). Purple box indicates the location of the rainfall of interest.
Remotesensing 14 03110 g004
Figure 5. Time–height distribution of horizontal wind (wind barbs, a full barb is 5 m s−1) from the wind profiler at (a) Hailing Island and (b) Guangzhou station. Horizontal wind with speeds of 10−15 m s−1 and >15 m s−1 are marked in blue and red, respectively.
Remotesensing 14 03110 g005
Figure 6. (a) The skew T-logP diagram and vertical wind profile (wind barbs, a full barb is 5 m s−1) of the YJ sounding station at 2000 LST on 21 June. The black and blue lines are the temperature and dewpoint temperature profiles, respectively. The red dotted curve is the ascending path of a surface-based parcel. (b) Time series of water vapor content averaged below 4 km and (c) time–height distribution of relative humidity based on the microwave radiometer measurements at Bohe.
Remotesensing 14 03110 g006
Figure 7. Surface air temperature (solid dot) and horizontal wind (arrow) at (a) 2100 LST 21, (b) 0100 LST 22, (c) 0200 LST 22, (d) 0300 LST 22, (e) 0400 LST 22 and (f) 0500 LST 22. Terrain is shaded in gray. The black dashed line in (a) represents the mesoscale convergence line related to the initiation of convection. Solid magenta contours represent the convective precipitation regions (ZH of YJ S-POL at 1.5° elevation > 35 dBZ). Solid green lines denote the outflow boundaries based on contrasts in wind direction and temperature. The small black box represents the key region, as in Figure 1b.
Remotesensing 14 03110 g007
Figure 8. The four left-hand columns: CFADs of the (ad) ZH (dBZ), (fi) ZDR (dB), and (kn) KDR (° km−1) during the (a) initial (S1), (b) developing (S2), (c) mature (S3), and (d) dissipating (S4) stages. Contours and shading represent the frequency of occurrence relative to the maximum absolute frequency in the data sample represented in the CFAD, contoured every 5%. Right-hand column: The averaged profiles of (e) ZH, (j) ZDR, and (o) KDR. The black, red, blue and green lines represent the initial (S1), developing (S2), mature (S3), and dissipating stages, respectively. The black dashed lines represent the level of 0 °C, −10 °C, and −20 °C from bottom to top, respectively.
Remotesensing 14 03110 g008
Figure 9. Vertical distribution of the probability of various hydrometeor types over Jinjiang estimated using the HCA (%) during the four stages: (a) initial (S1), (b) developing (S2), (c) mature (S3), and (d) dissipating (S4). The level of 0 °C, −10 °C, and −20 °C are labeled from bottom to top, respectively.
Remotesensing 14 03110 g009
Figure 10. (a) Mean values of ice (dashed) and liquid (solid) water content (g m−3) over Jinjiang at the four stages. The grey dashed lines represent the level of 0 °C, −10 °C, and −20 °C from bottom to top. Mean profiles of (b) Dm (mm) and (c) log10Nw (units of Nw: mm−1 m−3) over Jinjiang at the four stages. The black, red, blue and green lines represent the initial (S1), developing (S2), mature (S3), and dissipating stages, respectively.
Remotesensing 14 03110 g010
Figure 11. Frequency of the occurrence of Dm (mm) and log10Nw (units of Nw: mm−1 m−3) of the retrieved RSDs under 2 km from the YJ S-POL data of convective precipitation over Jinjiang at the four stages: (a) initial (S1), (b) developing (S2), (c) mature (S3), and (d) dissipating (S4). The outermost line represents the 5% contours; the contour ranges from 5% to 100% with an interval of 5%. The mean values of Dm and log10Nw in the present study are distinguished by different symbols as demonstrated by the legends, with the average values being marked in magenta. The gray solid border and the dotted border are the oceanic and continental convective areas defined by Bringi et al. [39].
Remotesensing 14 03110 g011
Table 1. Comparison of relative humidity (%) at 2000 LST on 21 June 2017 and historical (2011–2020) relative humidity at 2000 LST in June based on the YJ soundings.
Level500 hPa700 hPa850 hPa925 hPaGround500 hPa to the Ground of 5 Levels700 hPa to the Ground of 4 Levels
Mean55.1%68.2%81.5%85.9%87.2%74.6%80.2%
Median58.4%71.6%85.2%90.7%88.0%75.6%81.7%
21 June 201773%89%90%97%93%88.8%92.0%
Quantile ranking38.3%12.3%31.8%6.8%14.1%11.3%7.3%
Publisher’s Note: MDPI stays neutral with regard to jurisdictional claims in published maps and institutional affiliations.

