Abstract
To gain a deeper understanding of the formation and evolutionary mechanisms of a bow-shaped squall line (BSL) that occurred in East China on 10 May 2021, observations from S-band dual-polarization radars, a disdrometer and other instruments are used to investigate the characteristics and evolution of the kinematic, microphysical and radar echo structure within the squall line during its formative and mature stages. The results are as follows. The updraft induced by upper-level divergence and vertical thermal instability induced by the cold source at the middle and top of the troposphere provided environmental conditions suitable for the formation and strengthening of a squall line. The characteristics of the vertical vorticity at the leading edge of the squall line provided a good indication of its echo structure and evolutionary trend. The mechanism behind a new echo phenomenon—double high-differential reflectivity (ZDR) bands—observed in plan position indicator scans produced by the dual-polarization radar is investigated from the kinematic and microphysical structural perspectives. The evolutionary characteristics of the microphysical structure of the bulk of the squall line and its trailing stratiform cloud region are analyzed based on the quasi-vertical profiles retrieved from the S-band dual-polarization radar in Quzhou. Moreover, a conceptual model describing this type of BSL with a trailing region of stratiform rain in the warm sector is developed to provide technical support for the monitoring and early warning of BSLs.
1. Introduction
Squall lines are highly organized, long-lived mesoscale linear or quasilinear convective systems (QLCSs) that cover a distance of 20–200 km [1] and tend to engender thunderstorm winds, hail, heavy precipitation and, occasionally, tornadoes [2]. With a unique, organized structure generally related to downbursts and catastrophic winds, bow-shaped squall lines (BSLs) are more likely to produce destructive straight-line winds or tornadoes, particularly in areas showing line echo wave patterns (LEWPs) or bulges on a radar [3,4]. By analyzing radar and disaster survey data, Fujita found that the formation of a bow echo is closely related to the relevant rear inflow (i.e., the strong rear inflow at the center of an echo drives the convective cell to move rapidly, resulting in the formation of a bow echo) and, for the first time, put forward a conceptual model to describe the evolutionary characteristics of bow-echo structures of this type [5,6]. Moreover, Fujita observed the presence of cyclonic and anticyclonic circulations at the ends of the curved portion, and Weisman referred to these northern cyclonic vortices as “bookend vortices” [7,8]. The application of Doppler radar systems has lent further evidence to the earlier finding that strong winds are formed from the descent of rear-inflow jets (RIJs) to the ground near the apex of bow echoes [4,9,10,11]. In recent years, many studies have employed single- or dual-Doppler radar systems and damage analysis to examine the structural evolution of bow echoes, RIJs, low-level mesovortices and bookend vortices, as well as the mechanisms by which they affect surface winds [4,12,13,14,15,16]. Atkins et al. also discovered the presence of a cyclonic vortex to the south of the apex of a bow echo [4], in contrast to the earlier findings that a tornadic or nontornadic vortex forms only to the north of the apex of a bow echo [17].
Mesoscale vortices play a crucial role in the formation of destructive surface winds. Consequently, an in-depth understanding of the mechanism of formation of mesoscale vortices is vitally important for the evolutionary monitoring of bow echoes and early warning of surface winds. Trapp and Weisman [18] studied the genesis of mesoscale vortices within squall lines and bow echoes and the effects of environmental vertical wind shear (VWS) on the morphology and structure of QLCSs based on a numerical cloud model. They found that QLCSs evolve into bow echoes with straight-line surface winds and mesovortices at the apex in the presence of moderate-to-strong environmental VWS. Atkins and Laurent [19] studied in detail the mechanisms of mesovortex genesis during different stages of QLCS evolution based on the Advanced Research Weather Research and Forecasting model. It is noteworthy that many radar observation and numerical simulation studies have reported that the inflow jet behind a BSL diverges to the south and north sides upon approaching the bow-echo apex [7,13,19]. Despite its critical role in the morphology and evolutionary trend of a squall line, this flow field structure is yet to be well understood in terms of its genesis and mechanism and is rarely a focus of attention in the literature.
Compared to ordinary radar, dual-polarization radar is renowned for its ability to produce high-spatiotemporal-resolution data and can thus be used to reveal the internal microphysical structural characteristics (e.g., the shape, size, orientation and concentration of hydrometeors) of storms [20,21]. Meischner et al. [22] examined the meso- and microscale structure of the kinematics of a squall-line system in southern Germany and the microphysical characteristics of the resulting precipitation based on the polarimetric variables and Doppler velocities observed by dual-polarization radar. They found that the cold pool formed from the intense precipitation within the bulk of the squall line uplifted the moist air in the front inflow while advancing forward, resulting in the formation of feeder cells composed primarily of large raindrops with low concentrations at the leading edge of the squall line, which subsequently merged with the main precipitation region and thus played a pivotal role in the maintenance and evolution of the squall-line system. Evaristo et al. [23] studied the polarimetric signatures and microphysical characteristics during the mature stage of three squall lines that occurred in West Africa and found a superimposition of the reflectivity factor at horizontal polarization (ZH) columns, differential reflectivity (ZDR) columns and specific differential phase shift (KDP) columns at their leading edges, suggesting the presence of large, highly concentrated raindrops. Wen et al. [24] analyzed the evolutionary characteristics of the microphysical structure of a squall line in eastern China during the Observation, Prediction and Analysis of Severe Convection of China (OPACC) field campaign based on dual-polarization radar and disdrometer data. Zhou et al. [25] described in detail the feedback effects of microphysical processes during the merger of a squall line and a convective cell in South China on the kinematic structure using a variational Doppler radar analysis system (VDRAS) and dual-polarization radar. They found that the inflow trailing the system weakened during the merger—which is in stark contrast to the classical model theory that inflow strengthening results in the formation of a bow echo—and that locally strengthened rainfall evaporation promoted the development of the surface cold pool and thus led to further development of the bow echo.
Accurate prediction of wind and precipitation effects of squall lines requires in-depth knowledge of the complex macro- and microphysical processes inside the storm. The low-level warm advection-forced severe convective processes in East China generally occur from April to July and are often called warm sector convective processes (which include warm sector squall lines). These processes are characterized by warm and moist advection, which develops strongly at low levels (usually below 700 hPa) and is superposed with dynamic disturbance [26]. The warm sector BSLs mainly cause short-term heavy precipitation, sometimes accompanied by thunderstorms, hail, and other mixed convective weather. When there is an obvious dry tongue at 500 hPa, the strong convective weather is mainly thunderstorms and hail. However, when the moist layer is deep, short-term heavy precipitation often occurs, accompanied by thunderstorms and gales. The contributions of the kinematic and microphysical processes to the evolution of the structure and intensity of squall lines (especially the warm sector squall lines), which are yet to be fully understood, are attracting growing attention [16,27].
The goal of this paper is to document the genesis and structural evolution of warm sector BSLs with an emphasis on the structural characteristics and mechanism of the evolution of the bow echo. Moreover, a new echo phenomenon—double high-ZDR bands—observed with dual-polarization radar during the mature stage of the squall line is analyzed. To our knowledge, the mechanisms of the different kinematic and microphysical processes of double high-ZDR bands during the mature stage of the warm sector of BSLs have not been documented. In addition, three-dimensional (3D) wind fields retrieved from multiradar measurements are used in tandem with polarimetric variables and disdrometer data to investigate the mechanism behind this phenomenon from kinematic and microphysical structural perspectives. The current findings may be helpful to further understand the evolution mechanism of warm sector squall lines and improve the predictability of numerical models to forecast this type of squall lines. In Section 2, the instruments, methodology and study area are described. The environmental conditions and case description are discussed in Section 3. Section 4 illustrates the echo characteristics and mechanism of structural evolution of the BSL. Section 5 describes the evolution of the polarimetric characteristics of the BSL from the formative to the mature stage and its related kinematic and microphysical processes. Conclusions are given in Section 6.
2. Data, Methodology, and Study Area
The observational instruments used in this study mainly included the S-band dual-polarization weather radars in Quzhou, Jinhua, Hangzhou, and Ningbo (QZ-SPOL, JH-SPOL, HZ-SPOL, and NB-SPOL, respectively); the Doppler weather radar in Lishui (LSRD); the boundary wind profile radar (WPR) (29.34°N, 120.09°E and 100 m mean sea level (MSL)) in Yiwu; the automatic weather observation station (AWS) at Quzhou station (29.00°N, 118.90°E); and the disdrometer at Dongyang station (29.27°N, 120.22°E). Figure 1 shows the study area, the placement of the instruments and the locations of the sounding stations of Nanchang, Quzhou, and Hangzhou. The dashed black line represents the leading edge location of the squall line during the formative stage (2013 BT), and the solid blue lines mark the leading edge locations of the BSL of interest at different times during the mature stage (2122, 2132, 2212, 2242, 2300, and 2348 BT). Figure 1c shows the visual timeline of radar echo patterns (scan at a 0.5° elevation angle for QZ-SPOL and JH-SPOL and a 1.5° elevation angle for HZ-SPOL) in different stages labeled with short descriptions of the evolution characteristic of the squall line.
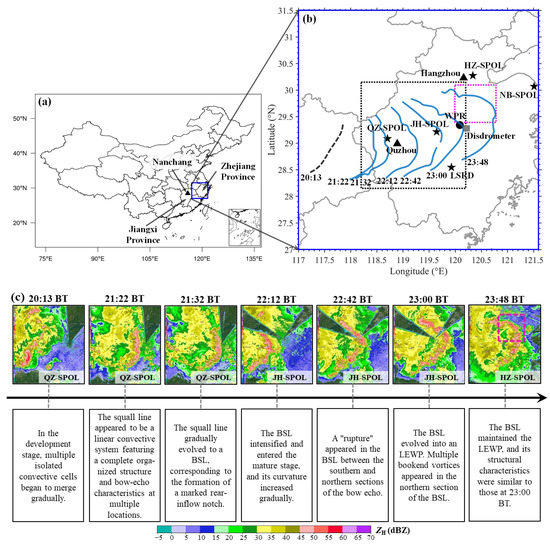
Figure 1.
(a) Map of China showing the domain for this study. The blue box and black triangle indicate the boundaries of the study area and the location of the Nanchang sounding station, respectively. (b) Locations of the observational instruments and stations. The black five-pointed stars indicate the locations of QZ-SPOL, JH-SPOL, HZ-SPOL, NB-SPOL, and LSRD. The JH-SPOL is 92 and 79 km from the QZ-SPOL and LSRD, respectively. The NB-SPOL is 114 km from the HZ-SPOL. The gray square represents the location of the disdrometer at Dongyang station, the black circle indicates the location of the WPR in Yiwu, and the black triangles denote the locations of sounding stations in Hangzhou and Quzhou (the Quzhou AWS is in the same location). The dashed black line represents the leading edge location of the squall line during the formative stage (2013 BT), and the solid blue lines mark the leading edge locations of the BSL of interest at different times during the mature stage (2122, 2132, 2212, 2242, 2300, and 2348 BT). The black and magenta dotted boxes indicate the boundaries of the retrieved 3D wind fields of QZ-SPOL, JH-SPOL, and LSRD and HZ-SPOL and NB-SPOL, respectively. (c) The visual timeline of radar echo patterns (scan at a 0.5° elevation angle for QZ-SPOL and JH-SPOL and a 1.5° elevation angle for HZ-SPOL) in different stages labeled with short descriptions of the evolution characteristic of the squall line.
The European Centre for Medium-Range Weather Forecasts reanalysis version 5 (ERA5) data (time resolution: 1 h; spatial resolution: 0.25° × 0.25°), sounding data, surface disdrometer data, WPR data, and surface temperature, pressure, precipitation, wind direction and wind speed measurements taken at intervals of 1 min at the Quzhou station were used in the analysis.
HZ-SPOL (30.27°N, 120.34°E, and 103 m MSL) operates in an intelligent observation mode. The replacement of the conventional average weight technique with radial restructuring, combined with data windowing, has enabled an increase in the azimuth resolution of data yielded by HZ-SPOL from 1.0° to 0.5°, making it suitable for detailed observations of heavy precipitation events. This radar system operates in VCP 25D mode and completes a scan (radial resolution: 125 m; azimuth resolution: 0.5°) at nine elevations (0.5°, 1.5°, 2.4°, 3.4°, 4.3°, 6.0°, 9.9°, 14.6°, and 19.5°) in 4 min [28]. QZ-SPOL (29.09°N, 118.70°E, and 1226 m MSL), JH-SPOL (29.22°N, 119.64°E, and 1204 m MSL), and NB-SPOL (30.07°N, 121.51°E, and 453 m MSL) operate in simultaneous transmission and receiving modes and Volume Coverage Pattern (VCP) 21 volume-scan strategy, completing one scan (radial resolution: 250 m; azimuth resolution: 1°; pulse repetition frequency: 322–1304 Hz) at nine elevations (0.5°, 1.5°, 2.4°, 3.4°, 4.3°, 6.0°, 9.9°, 14.6°, and 19.5°) in 6 min, with each parameter strictly calibrated. A range of variables, including ZH, radial velocity Vr, velocity spectrum width W, ZDR, KDP, and copolar correlation coefficient ρhv, can be derived from the QZ-SPOL, NB-SPOL, JH-SPOL, and HZ-SPOL data. The LSRD (28.55°N, 119.93°E, and 1099 m MSL) is a single-polarization Doppler radar system that operates in the same volume scan mode as that of the QZ-SPOL but produces scans at a radial resolution of 1000 m and an azimuthal resolution of 1°. Three basic variables—ZH, Vr, and W—can be derived from LSRD data. The technical details of HZ-SPOL, QZ-SPOL, JH-SPOL, NB-SPOL, and LSRD data can be found in Table 1.

Table 1.
Radar characteristics (PRF is pulse repetition frequency).
Here, we briefly introduce the physical meaning of the dual-polarization variables. ZDR provides information about the median shape of the radar echo and thus provides a good estimate of the median size of rain drops. KDP provides information about the liquid water content. ρhv is defined as the measure of how similarly the horizontally and vertically polarized pulses behave from pulse to pulse within a resolution volume; hence, it can be used to determine whether radar echoes are dominated by a homogeneous precipitation type, a mixture of precipitation types or nonprecipitation. Comprehensively analyzing the characteristics of these dual-polarization variables allows different microphysical processes in clouds and precipitation to be inferred [29,30]. Dual-polarization radar data were processed to remove nonmeteorological echoes using a threshold of ρhv < 0.7. Filtering was performed on ZH, ZDR, KDP, and ρhv to reduce the random fluctuations [31].
Prior to the retrieval of the 3D wind field from dual (multi)-radar data, an automated dealiasing algorithm was first applied to Vr [32], followed by 1 km horizontal and 0.5 km vertical interpolation of each measured variable to a Cartesian grid. Three-dimensional winds within the 200 × 200 km2 and 80 × 80 km2 regions (as indicated by the black and magenta dotted boxes in Figure 1, respectively) extending to an altitude of 20 km MSL were achieved using the variational multiple-Doppler wind analysis procedure [33,34]. A more technical description of this wind analysis procedure is given in Appendix A. The vertical vorticity constraint can substantially improve dual-Doppler retrievals of vertical velocity where radars fail to sample low levels of the atmosphere [33,34]. Due to the high altitude of the QZ-SPOL, JH-SPOL, and LSRD, the lowest grid altitude was 1 km above ground level. It should be noted that the relatively high altitude of the three radars resulted in inadequate sampling of low-level measurements, which may have led to underestimates of the strong updrafts in the BSL [35]. For a detailed description of the specific procedure, please refer to the literature [33,34,36].
The fundamental description of precipitation is the drop size distribution (DSD). The DSDs used in this study were collected with the Thies disdrometer located at Dongyang station, approximately 56 km east of JH-SPOL. The Thies disdrometer is a laser optical device that can concurrently measure the size and fall velocity of hydrometeors, which were assessed in detail by Frasson et al. [37], Sarkar et al. [38], and Chen et al. [39]. The Thies disdrometer uses a parallel horizontal light laser beam of 0.75 mm thickness covering an area of 45.6 cm2 (228 mm long, 20 mm wide) with a time resolution of 60 s. Hydrometeor particle sizes are subdivided into 22 classes, ranging from 0.125 to 8 mm in diameter, and the size class width varies from 0.125 to 0.5 mm. Fall velocities are subdivided into 20 classes, ranging from 0.2 to 10 m s−1, and the velocity class width is varied from 0.2 to 1.0 m s−1 [39]. To reduce the observation errors caused by strong winds, marginal drops or splashing, hydrometeor particles outside 660% of the fall velocity–diameter relationship for rain were eliminated from the observations [40,41]. In addition, data with raindrop numbers less than 10 or precipitation intensities less than 0.1 mm h−1 were also removed [42]. Since the drop size distributions N(D) (m−3 mm−1), the mass distribution m(D) (mm), the rainfall intensity R (mm h−1), the mass-weighted mean diameter Dm (g m−3 mm−1) and the generalized intercept parameter Nw (m3 mm−1) have been documented in the literature [24,43,44], the detailed steps for their calculation are not included here. In addition, we employed the high-resolution quasi-vertical profiles (QVPs) of ZH, ZDR, ρhv and Vr at an elevation angle of 19.5° [45] and represent these profiles in a time-versus-height format to investigate the temporal evolution of the vertical structure and microphysical processes leading up to the BSL.
3. Synoptic and Mesoscale Environment
3.1. Case Description and Synoptic Conditions
A BSL event occurred over a large area in eastern China during the night on the 10 May 2021 (from 1900 Beijing Time [BT] (UTC +8 h) on 10 May 2021 to 0200 BT on 11 May 2021). Storm cells first formed in Jiangxi Province (black dotted line in Figure 1b) and then evolved in Zhejiang Province into a BSL that subsequently moved rapidly to the northeast. The BSL system caused short-term intense precipitation and thunderstorm winds along its path and eventually weakened and moved eastward over the sea.
Analysis of the 200 hPa isobaric surface at 2000 BT on 10 May 2021 reveals that eastern China was beneath the divergence region of an upper-level jet stream (as indicated by the red circle in Figure 2a) and that the upper-level air exerted a pumping effect on the lower-level air. More critically, the divergence region was very cold. Temperatures in the region within the red circle were extremely low, ranging from −52 to −56 °C. Analysis of the 500 hPa isobaric surface (Figure 2b) shows that a region from northern Jiangxi extending through central Zhejiang was beneath the top of the jet stream where marked convergence occurred. Of note, there was a cold trough, centered above northwestern Jiangxi and extending down to −12 °C in temperature (as indicated by the blue L and dashed purple line in the plotted upper-level synoptic map in the lower left corner of Figure 2b, respectively), above northern Jiangxi and most of Zhejiang. The exits of the lower (700 and 850 hPa)-level jet streams (Figure 2c and Figure 2d, respectively) were located above the region extending from northern Jiangxi to western Zhejiang, while northeastern Jiangxi was below the 850 hPa level convergence region on the south side of a wind shear, where there was a warm ridge with temperatures up to 20 °C (as indicated by the solid red line in the synoptic map in the lower left corner of Figure 2b). This synoptic situation, characterized by the transport of warm and humid air by the lower-level jet streams and the presence of an ultralow-temperature region at the middle and upper levels, led to the formation of a thermally unstable stratification structure that was cold at the upper level and warm at the lower level.
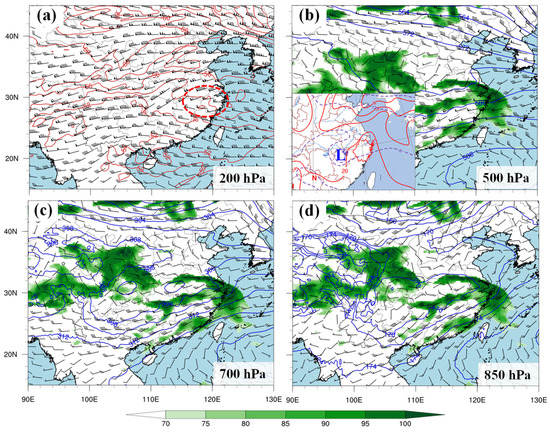
Figure 2.
Synoptic maps from ERA5 data for 2000 BT on 10 May 2021. (a) The 200 hPa synoptic map. (b) The 500 hPa synoptic map. (c) The 700 hPa synoptic map. (d) The 850 hPa synoptic map. The solid blue lines are isopotential lines. The solid red lines are isotherms. The green shades indicate the relative humidity. The barbs indicate wind velocity and direction. The dashed purple lines and solid red lines in the plotted upper-level weather map in the lower left corner of (b) represent the 500 and 850 hPa isotherms, respectively.
3.2. Analysis of Sounding Data
Figure 3a–c show the temperature–logarithm-of-pressure (T–logP) plots of the soundings taken at the Nanchang, Quzhou and Hangzhou stations at 2000 BT on 10 May 2021, which reveal the vertical atmospheric structures along the path in which the squall line formed and moved. Observation of the T–logP plot of the soundings taken at the Nanchang station located in the region where the squall line formed reveals the following. The entire layer over the Nanchang station was almost completely saturated with water vapor. At the middle level (near the 500 hPa level), there were 0.75 km-thick cold stratus clouds (as indicated by the dotted red circle in Figure 3a) [46] with minimum and dew-point (DT) temperatures of −20.4 and −21.4 °C, respectively, which were considerably lower than those at the same level above the nearby sounding stations (−8.2 and −8.9 °C, −6.9 and −14.7 °C, and −7.4 and −8.3 °C for the Quzhou, Changsha and Anqing stations, respectively). The corresponding surface temperature and DT temperature were 24.1 and 22.4 °C, respectively. These data translate to a vertical temperature decrease rate of 7.95 °C km–1, which was appreciably greater than the atmospheric mean rate (6.5 °C km–1) and thus intensified the unstable stratification. In particular, the environmental and DT temperatures increased abruptly by 20 °C, to −1.5 and −4.5 °C, respectively, at the 350–250 hPa levels (as indicated by the dotted black circle in Figure 3a). Comprehensive analysis of the surface observation data (not shown) for the same time reveals the following. Soundings were taken during a thunderstorm. From the top down, the lightning ionized the water molecules and thus caused the release of a large amount of heat, which in turn formed a high-temperature region. The sounding balloon passed through this high-temperature region during its ascent, leading to an increase in temperature. The environmental and DT temperatures began to gradually recover above 250 hPa. An ultralow-temperature (down to −77.1 °C) and unstable stratification structure that was cold at the upper level and warm at the lower level (as indicated by the blue oval in Figure 3a) also appeared at the top of the troposphere (between the 250 and 200 hPa levels). The difference between the 0–6 km wind vectors was 26.2 m s−1, indicating a high VWS level. Observation of the T–logP plot of the soundings taken at Quzhou station at 2000 BT on 10 May (Figure 3b) shows the following. Over the Quzhou station, the temperatures at the 850 and 500 hPa levels differed considerably (by 29 °C), and the convective available potential energy (CAPE) was 1770 J kg−1. Moreover, the easterly airflow in the boundary layer and the upper-level westerly wind resulted in a strong VWS. The difference between the 0–6 km wind vectors was 24 m s−1, which was favorable for the formation of highly organized convective storms [2]. The structure above Hangzhou station, as derived from the T–logP plot of the soundings taken at 2000 BT on 10 May (Figure 3c), differed from those above Nanchang and Quzhou stations in that it featured a dry layer between the near-surface and middle levels and a CAPE of 1137.7 J kg−1, which provided favorable conditions for the formation of thunderstorm winds [47].
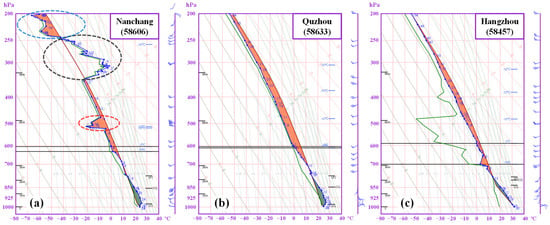
Figure 3.
T–logP plots of the soundings taken at (a) Nanchang station, (b) Quzhou station, and (c) Hangzhou station at 2000 BT on 10 May 2021. The red and green colors represent CAPE and convective inhibition (CIN), respectively.
4. Echo Characteristics and Mechanism of Structural Evolution of the BSL
4.1. Echo Structure and Path of the BSL
Figure 4 shows the path and vertical echo structure of the BSL and the changes in the surface meteorological characteristics at Quzhou station after its passage. On 10 May, multiple convective storm cells formed over northern Jiangxi at 1900 BT (not shown) and developed and organized into a squall line at 2050 BT, which gradually entered Zhejiang and intensified into a BSL at 2130 BT. The ZH gradient at the leading edge of the BSL was large, with a maximum ZH value exceeding 60 dBZ. The BSL moved in parallel to the mean environmental wind and at approximately 90 km h–1 (25 m s–1), with a stratiform cloud system trailing behind it. At 0200 BT on 11 May, the BSL weakened over Zhoushan and gradually moved over the sea. The BSL lasted for more than 5 h and was approximately 280 km long and 20–30 km wide at its strongest. Analysis of the changes in the surface meteorological elements after the passage of the squall line (Figure 4c) reveals the following. The leading edge of the squall line was the first to pass over the area in question at a low pressure (down to 995.3 hPa, which occurred at 2135 BT on 10 May, as indicated by the dotted red oval in Figure 4c), followed by the thunderstorms constituting the bulk of the squall line at a high pressure (up to 999.4 hPa, which occurred at 2151–2153 BT on 10 May). Both the surface wind velocity and pressure increased and decreased abruptly before and after the passage of the squall line, with peak values occurring 2 min earlier than the peak precipitation, which was caused by the higher descending velocity of the airflow compared with that of the raindrops. Figure 4d shows the time series of the ground-relative horizontal wind fields at different heights observed by the WPR in Yiwu (indicated by the black circle in Figure 4a) between 2100 BT on 10 May 2021 and 0100 BT on 11 May 2021. As the BSL gradually approached the WPR (2242–2248 BT), the southwesterly wind near the ground suddenly began to strengthen, the maximum wind speed exceeded 30 m s–1, and the strong southwest jet was maintained in the middle and low levels. When the BSL began to pass through the WPR at 2254 BT, the strong southwesterly wind was maintained near the surface, and then a brief southeasterly wind appeared at a low-level (0–1 km MSL) at 2300 BT. After 2324 BT, the southwesterly wind near the surface gradually weakened, and the direction of the middle- and low-level jet turned westerly and extended to the near surface. The observations from the WPR can compensate for the deficiency of the low-level observations of weather radar to a certain extent.
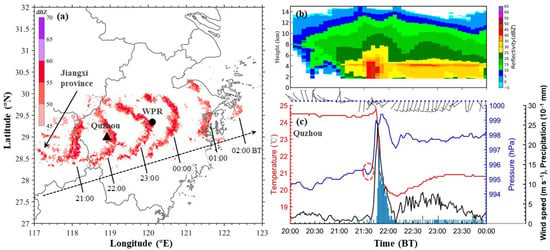
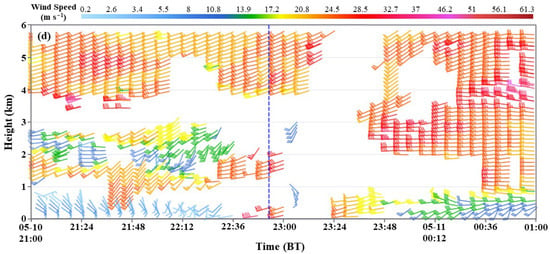
Figure 4.
Path and vertical echo structure of the squall line and changes in the surface meteorological elements. (a) Evolution of a ZH mosaic of the squall line (>45 dBZ) (the dotted black arrow indicates the approximate direction of movement of the BSL). (b) Height–time representation of QVPs of ZH retrieved from the QZ-SPOL data collected at an elevation angle of 19.5° from 2000 BT on 10 May to 0000 BT on 11 May 2021. (c) Time series of surface temperature, pressure, wind velocity, and precipitation measurements taken at intervals of 1 min and wind velocity and direction measurements taken at intervals of 5 min at Quzhou station between 2000 BT on 10 May 2021 and 0000 BT on 11 May 2021 (the dotted red oval indicates the passage of the leading edge of the squall line). (d) Time series of the ground-relative horizontal wind fields at different heights observed by the WPR in Yiwu between 2100 BT on 10 May 2021 and 0100 BT on 11 May 2021 (the dashed blue line indicates the time when the squall line passed over the WPR).
4.2. Echo Pattern and Mechanism of Evolution of the BSL
Based on the stages of the lifecycle of a squall line, as defined by Leary and Houze [48], the squall line examined in this study is divided into three stages, namely, the development stage (2000 through 2050 BT on 10 May), the mature stage (2050 BT on 10 May through 000 BT on 11 May) and the dissipation stage (0000 through 0200 BT on 11 May). The dissipation stage is not a focus of this study and is thus not analyzed. The mature stage encompassed the morphological evolution of the squall line from a straight-line echo to a bow echo.
Figure 5 shows the horizontal wind fields at a height of 1.5 km and different times during the mature stage of the BSL, as retrieved from the combination of data collected by three radars (i.e., QZ-SPOL, JH-SPOL, and LSRD) on 10 May 2021. It should be noted that the storm-relative flow was adopted here to reveal the kinematic structure inside and outside the squall line. The BSL moved to the northeast at a velocity of approximately 25 m s–1. To obtain the relative flow of the BSL, the movement velocity of the BSL was subtracted from the retrieved wind field. As the RIJ grew, the echo near the area with the highest wind velocity protruded forward. At 2132 BT, the squall line gradually evolved from a nearly straight-line echo to a bow echo, of which the southern and northern sections were nearly symmetrical, corresponding to the formation of a marked rear-inflow notch (RIN) in the ZH pattern [49]. A positive vertical vorticity was present in the northern section of the bow echo (Figure 5a). At 2212 BT, the BSL intensified and entered the mature stage. During this time, the RIJ diverged into three airflows (as indicated by solid black arrows ①, ②, and ③ in Figure 5b) that propelled the echo to the northeast, east and southeast, respectively. Moreover, the wind velocities at both ends of the bow echo were lower than those at its center. Collectively, these factors further increased the curvature of the bow echo, resulting in the formation of cyclonic shear and anticyclonic shear in its northern and southern sections, respectively. The positive vorticity at the leading edge of the northern section of the echo increased somewhat (up to 0.6 × 10⁻² s–1). In contrast, a negative vorticity (down to −0.4 × 10⁻² s–1) prevailed at the leading edge of the southern section of the echo, with a small positive vorticity existing only in the shear zone of the convergence of the rear inflow at the leading edge of the squall line and the environmental wind (southwesterly wind). The anticyclonic airflow also reduced the intensity and area of the southern section of the echo. At 2242 BT, airflows ① and ③ became separated due to differences in the velocity and orientation at the top (the apex of airflows ① and ③ moved toward the northeast and southeast, respectively), resulting in a “rupture” between the southern and northern sections of the bow echo (as indicated by the dotted red circle in Figure 5c). Note that the northern section retained the well-organized structure of a strong echo and morphologically transitioned into a straight line extending from the northwest to the southeast, where the positive vorticity at its leading edge continued to increase (up to 1.2 × 10⁻² s–1). In contrast, due to the action of the anticyclonic airflow, the southern section of the echo became appreciably less organized and weakened. At 2300 BT, the squall line evolved into an LEWP. The cyclonic vortical structure of the northern section of the squall line became more pronounced with the appearance of three bookend vortices [7] (as indicated by the purple, blue and dark-red circles in Figure 5d) with a vorticity up to 0.8 × 10⁻² s–1 at the center. The counterrotating circulations in the southern section of the squall line were maintained (as indicated by the black semicircular arrow in Figure 5d). However, shear induced by northwesterly and northeasterly winds was present at the ruptured end of the southern section of the squall line and triggered the formation of multiple new storm cells that subsequently intensified and merged into the squall line. As a result, the separated echo sections were reconnected, once again forming a complete bow echo with an increased curvature. This study showed that the development of a rear-inflow jet plays an important role in the formation of the bow-shaped echo. According to the schematic model proposed by Wakimoto et al. [16], the intense updrafts tilt the horizontal vorticity produced within the leading edge of the cold pool, producing the cyclonic vortex and anticyclonic circulation at the northern and southern ends of the bow-shaped echo, respectively, which promote the development of a rear-inflow jet. This observed flow field structure resembles those simulated by Atkins and Cunningham [50] and Atkins et al. [19] and Fujita’s conceptual model of a bow echo [5].
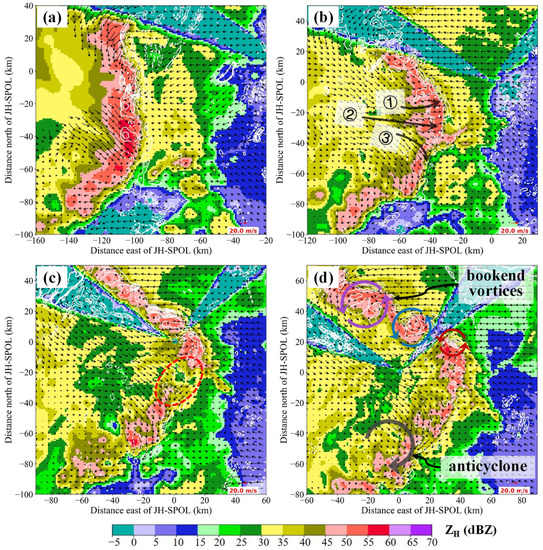
Figure 5.
Horizontal storm-relative wind fields at a height of 1.5 km at (a) 2132, (b) 2212, (c) 2242, and (d) 2300 BT on 10 May 2021, as retrieved from a combination of QZ-SPOL, JH-SPOL, and LSRD data. The solid and dashed white lines indicate the positive and negative vertical vorticity contours, respectively (unit: 10–3 s–1).
5. Dual-Polarization Characteristics and Evolution
5.1. Dual-Polarization Signatures and the Double High-ZDR Bands Feature
In the development stage (2013 BT on 10 May), multiple isolated convective cells (cells 1, 2, and 3 in Figure 6a) began to gradually merge. Of these cells, cell 3 was a bow echo, which exhibited the highest ZH, ranging from approximately 45 to 62 dBZ. A new convective cell (cell 4) formed in front of these three cells. The ZH of cell 4 was comparable to that of cells 1 and 2 and ranged from approximately 45 to 55 dBZ. Discontinuous linear convection can be observed in the plan position indicator (PPI) scan of ZH for this stage. Multiple vortices (as indicated by the black circles in Figure 6b) and a marked rear inflow are visible in the PPI scan of storm-relative Vr. With a ZDR of 2.5–3.9 dB (Figure 6c) and a KDP of 3–7.6° km–1 (Figure 6d), cell 3 similarly appears to be the strongest in the PPI scans of ZDR and KDP. During subsequent development, cell 4 merged with cell 1, cell 2, and cell 3. These mergers led to the formation of a squall line. The convective cells within the dotted circle in Figure 6a gradually weakened and dissipated in subsequent evolution.
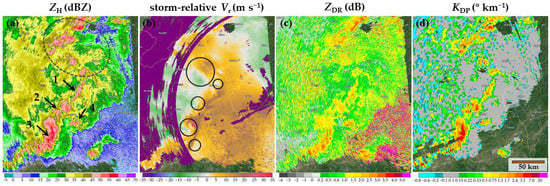
Figure 6.
Composite PPIs of (a) ZH, (b) storm-relative Vr, (c) ZDR, and (d) KDP at an elevation angle of 0.5°, as observed by QZ-SPOL data at 2013 BT on 10 May 2021. Arrows point to the storm cells on the reflectivity panels. Vortices are circled in black on the velocity panels.
During the mature stage, the squall line gradually transitioned from a quasilinear structure to a bow-shaped structure. Figure 7a,b show the PPI scans of polarization signatures ZH, storm-relative Vr, ZDR, and KDP derived from measurements taken by QZ-SPOL data at an elevation angle of 0.5° at 2122 BT on 10 May and JH-SPOL data at an elevation angle of 1.5° at 2300 BT on 10 May, respectively. At 2122 BT, the squall line appeared to be a linear convective system featuring a complete organized structure and bow-echo characteristics at multiple locations. The ZH values of the bulk of the squall line were approximately 45–58 dBZ. A hook structure also appeared at the center of the squall line (as indicated by red arrow 1). The Vr signature was characterized by a marked inflow jet (the maximum Vr reached 36 m s–1) behind the squall line (not shown). A notable vortex at a height of approximately 1.49 km (i.e., red cyclonic circulation 1 in Figure 7a) appeared to the southwest of the radar station. A high-ZDR (2–4 dB) band (as indicated by the solid blue line on the right side) is visible at the leading edge of the squall line in the PPI scan of ZDR. It is noteworthy that another high-ZDR (approximately 1.5–3 dB) band (as indicated by the solid black line) was also present on the left side of the high-ZDR band marked by the solid blue line, that is, within the bulk of the squall line. Therefore, the bulk of the squall line featured double high-ZDR bands. The corresponding KDP was generally lower at the leading edge of the squall line (as indicated by the solid blue line) than on its rear flank (as indicated by the solid black line), suggesting that large, highly concentrated raindrops were clustered primarily behind the bulk of the squall line. At 2300 BT, the squall line further evolved into a bow-shaped structure with a very large curvature (Figure 7b). Multiple hook echoes (as indicated by blue arrow 2 and purple arrow 3 in Figure 7b) are visible in the PPI scan of ZH, corresponding to pronounced vortices (i.e., blue cyclonic circulation 2 and purple cyclonic circulation 3 on the storm-relative Vr panel in Figure 7b). The presence of black cyclonic circulation 4 suggests the presence of a small nascent vortex at this stage. At 2300 BT, the ZDR and KDP of the bulk of the BSL were distributed in patterns similar to those at 2122 BT, but the curvature of the BSL increased. A marked double high-ZDR band feature was also present at 2300 BT. The BSL continually maintained this double high-ZDR band feature as it moved during the mature stage. This phenomenon lasted for nearly 3 h. What are the reasons and mechanisms behind this phenomenon?
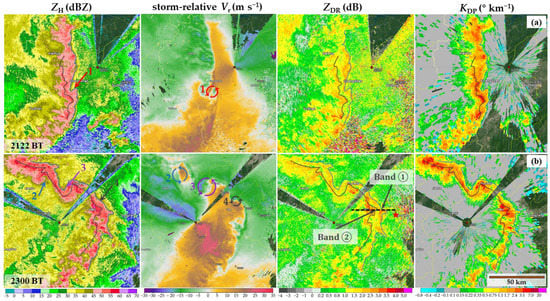
Figure 7.
Composite PPIs of ZH, storm-relative Vr, ZDR, and KDP at elevation angles of (a) 0.5° and (b) 1.5° measured by (a) QZ-SPOL and (b) JH-SPOL at (a) 2122 and (b) 2300 BT on 10 May 2021. Arrows point to the vortices on the reflectivity panels. Vortices are numbered and circled in diverse colors on the velocity panels. The solid blue and black lines represent the leading edge of the high-ZDR band on the right and left sides, respectively.
To further understand the vertical echo structure and mechanism of formation of the squall line, vertical profiles of ZH, ZDR, KDP, and ρhv along the dotted black line on the ZDR panel in Figure 7b were plotted and subsequently overlaid with the storm-relative wind field retrieved from the radar data, as seen in Figure 8. Two right-leaning ZDR columns (ZDR columns 1 and 2, as indicated by red arrows 1 and 2, respectively) are visible in Figure 8b. Within the ZDR column 1, the 2-dB ZDR contour reaches above the 0 °C isotherm, while the 1–1.5-dB ZDR contours extend to the proximity of the −20 °C isotherm, corresponding to an overhang structure in the ZH profile. ZH values greater than 55 dBZ are distributed between the 0 and −20°C isotherms. A high-KDP (1.7–2.4° km−1) region is concentrated between the 0 and −10°C isotherms. Analysis of the distribution of ρhv and the retrieved wind field reveals that the cold pool induced by the squall line and the warm and humid airflow at the leading edge of the squall line converged and uplifted and that large, highly concentrated raindrops or supercooled water droplets were lifted by a strong updraft above the 0 °C isotherm [22,51,52,53,54]. The presence of an ice–water mixed phase and strong turbulence reduced the ρhv in this region [55,56]. The low KDP (0–0.5° km−1) near the surface suggests that heavy precipitation was yet to fall to the surface and that the surface precipitation was very weak. Note that the significant downdraft 42 to 44 km east of the JH-SPOL may be the main cause of the surface gales. ZDR column 2 is shorter but wider than ZDR column 1. High (55–60 dBZ)-ZH contours extend above the 0 °C isotherm, forming a ZH column. A KDP column is present on the right side of the ZDR column, accompanied by a decrease in the corresponding ρhv near and below the 0 °C isotherm. Analysis of these findings in tandem with the retrieved wind field reveals that upper-level cold and dry air entrainment and mixing in conjunction with the presence of an ice–water mixed phase or a small- and large-sized raindrop mixture was responsible for the decrease in ρhv near and below the 0 °C isotherm. In this region, ascending motion caused by significant wind velocity fluctuations coexisted with intense descending motion induced by the combined action of heavy precipitation drag and raindrop evaporation and cooling. Overall, the double high-ZDR bands within the bulk of the squall line in the PPI scans and the two ZDR columns on the corresponding vertical profile can be attributed to two main factors. (1) ZDR column 1 formed in the new-mature cell and was caused by the uplifting of large, highly concentrated raindrops or supercooled water droplets over the 0°C isotherm by the strong updraft at the leading edge of the squall line. Below the 0°C isotherm, there were large raindrops with a low concentration [27]. Correspondingly, less precipitation fell to the surface. (2) ZDR column 2, formed in the mature-old cell, was induced by the strong downdraft and heavy precipitation behind the squall line, corresponding to a very high surface precipitation intensity. Meischner et al. [22] used C-band dual-polarization radar data to study a squall line in southern Germany. Two similar large-value ZDR columns appeared in the vertical cross section (RHI) of ZDR: one was located in the feeder cloud outside the squall line, while the other was located within the bulk of the squall line. In the present study, the two ZDR columns were located within the bulk of the squall line, and the pronounced feature of a double large-value ZDR band was observed in the corresponding PPI scans.
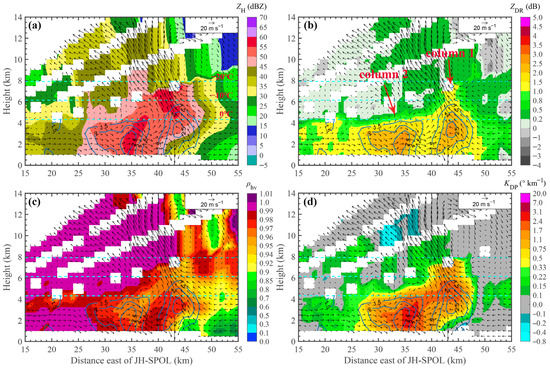
Figure 8.
Vertical profile structures of dual-polarization signatures at 2300 BT on 10 May 2021, as produced along the dotted black line in Figure 7b. (a) ZH, (b) ZDR, (c) ρhv, and (d) KDP. The black vectors represent the storm-relative wind field on the profiles retrieved from a combination of QZ-SPOL, JH-SPOL, and LSRD data. The solid blue lines represent the 1.5-, 2-, and 2.5-dB ZDR contours. The dotted blue lines represent the 0, −10, and −20 °C isotherms. Red arrows 1 and 2 represent the vertical structures corresponding to high-ZDR bands ① and ② along the dotted black line in Figure 7b, respectively.
As the altitudes of QZ-SPOL, JH-SPOL, and LSRD exceed 1 km MSL, the observation of radial velocity below 1 km cannot be obtained, so no low-level airflow (below 1 km MSL) data are presented in Figure 8. Since the structures of low-level airflow are critical for the BSL in this study, most descriptions of the kinematic characteristics are focused on heights below 2 km MSL. At 2348 BT, the BSL moved to the south of HZ-SPOL, and the squall line at that time was still in the mature stage (Figure 1b,c), with similar characteristics to those at 2300 BT. We attempt to obtain the low-level airflow (below 1 km MSL) by dual-Doppler radar wind field retrieval of the HZ-SPOL and NB-SPOL, which makes up for the lack of the low-level airflow. Figure 9 depicts the retrieved vertical wind fields along the cross section (the red dashed line) as in the inset of Figure 9a. There was an inflow before the gust front, and the rear-to-front airflow was encountered with front-to-rear airflow at the leading edge of the BLS, causing the inflow to lift.
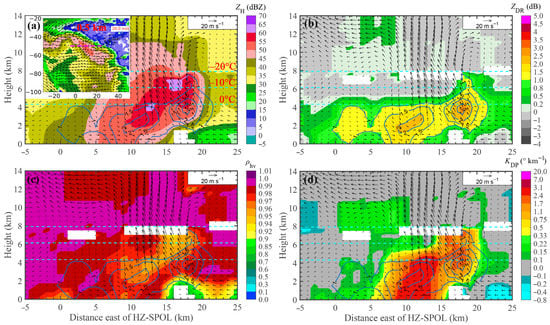
Figure 9.
As in Figure 8, (a) ZH, (b) ZDR, (c) ρhv, and (d) KDP, but for the retrieved wind fields from dual-Doppler radar (HZ-SPOL and NB-SPOL) along the cross section (the dashed red line) as in the inset of (a) at 2348 BT. The inset in (a) represents the storm-relative wind field at a height of 0.5 km MSL in the magenta dashed box in Figure 1b,c.
Between 2300 and 2336 BT, the double high-ZDR bands of the squall line successively passed over the disdrometer in Dongyang (as indicated by the red five-pointed star in Figure 7b), with ZDR columns 1 and 2 being in close proximity to (approximately 3 km from) the disdrometer. Figure 10 shows the DSD and precipitation intensity evolution derived from disdrometer measurements. ZDR columns 1 and 2 passed over the disdrometer in close succession, between 2300 and 2315 BT (the period between the dotted magenta and red lines in Figure 10 is defined as stage ①) and between 2316 and 2336 BT (the period between the dotted red and gray lines in Figure 10 is defined as stage ②), respectively. During stage ①, there was no precipitation for the first 10 min, after which the raindrops that fell to the surface were low in concentration and small in diameter. Dm (Figure 10a) and the logarithmic Nw (log10 Nw) (Figure 10d) increased significantly after 2310 BT. Peak m(D) (Figure 10b) occurred at small raindrop diameters, corresponding to a very low surface precipitation intensity (Figure 10c). During stage ②, the precipitation consisted of small- and medium-sized particles with a high concentration, while the concentration of large particles was very low. Compared to stage ①, Dm at stage ② was generally larger and ranged from 1.2 to 3.7 mm. The peak m(D) was concentrated at medium through large raindrop diameters, corresponding to a very high precipitation intensity (up to 70 mm h–1). log10 Nw increased to 4.3 mm–1 m–3. Overall, compared to ZDR column 1, ZDR column 2 contained larger and more concentrated particles in the near-surface region and had a higher precipitation intensity. Polarization signature analysis reveals that the ZH, ZDR, and KDP of ZDR column 2 were higher than those of ZDR column 1 in the near-surface region, suggesting that ZDR column 2 contained larger and more concentrated particles and had a higher precipitation intensity than ZDR column 1. The surface disdrometer measurements were generally consistent with the dual-polarization radar measurements.
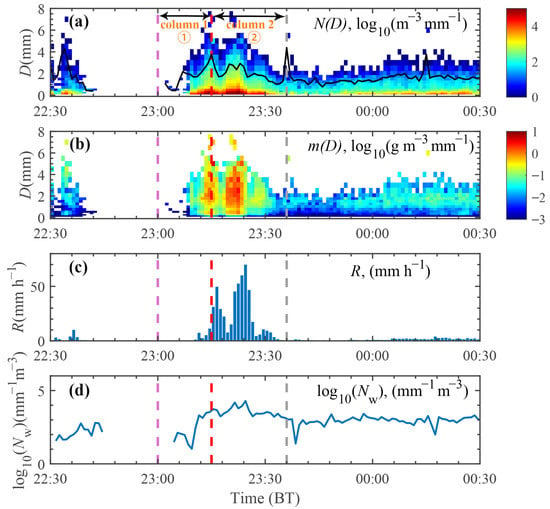
Figure 10.
Time series of precipitation DSD collected by the disdrometer at Dongyang station between 2230 BT on 10 May 2021 and 0030 BT on 11 May 2021. (a) N(D) (the color represents the number concentration; the solid black line indicates Dm). (b) m(D) (the color represents the total mass of all raindrops per unit diameter range and unit volume). (c) R. (d) log10 Nw.
5.2. Evolutionary Characteristics of the QVPs of Dual-Polarization Signatures
To gain a better understanding of the microphysical processes and evolutionary characteristics of the BSL, we analyzed the QVPs of ZH, ZDR, ρhv, and Vr retrieved from QZ-SPOL data. Figure 11 shows the QVPs of ZH, ZDR, ρhv, and Vr retrieved from QZ-SPOL data collected throughout the squall-line event between 2100 BT on 10 May 2021 and 0500 BT on 11 May 2021. Between 2132 and 2153 BT, the strong convective cloud cluster within the bulk of the squall line passed over QZ-SPOL. Analysis of the QVPs corresponding to the passage of the bulk of the squall line over the QZ-SPOL (as indicated by the blue arrows in Figure 11) reveals marked ZH characteristics associated with deep convection. The 0 °C-level bright band is no longer visible. The value of ZH within the ZH columns reaches up to 55 dBZ. The 40–45-dBZ ZH contours extend above the 0 °C isotherm (Figure 11a). A notable ZDR column is visible on the QVP of ZDR. ZDR reaches up to 1.5 dBZ above the 0 °C isotherm (Figure 11b), and the corresponding Vr is mostly positive (Figure 11d), suggesting the presence of an updraft. The ρhv values corresponding to the location of the ZDR column decrease suddenly (down to 0.96) (Figure 11c), indicating the accumulation of ice–water mixed-phase hydrometeors in this region caused by a strong updraft and downdraft. At 2200 BT, precipitation from stratiform clouds began. Figure 11a shows a strengthened high-ZH band below the 0 °C isotherm, corresponding to an increase in ZDR and a decrease in ρhv, which correspond to the bright band signature of melting snow.
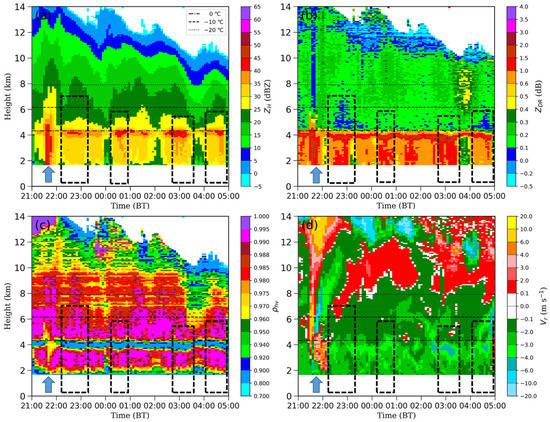
Figure 11.
Height–time representation of QVPs of (a) ZH, (b) ZDR, (c) ρhv, and (d) Vr retrieved from QZ-SPOL data collected at an elevation angle of 19.5° between 2100 on 10 May and 0500 BT on 11 May 2021. Positive velocity indicates an updraft and negative velocity indicates a downdraft.
Notably, an increase in ZH and a decrease in ZDR occurred above the melting level during the intensification of the precipitation from the stratiform clouds (as indicated by the dotted black boxes in Figure 11), suggesting the riming of ice crystals or snowflakes. This phenomenon was also accompanied by a marked “saggy bright band” (as indicated by the dotted black boxes in Figure 11b,c) [57]. These characteristics can mainly be ascribed to three factors. On the one hand, the riming and growth of ice crystals or snowflakes gradually transformed the particles into a near-spherical shape, thus reducing the ZDR above the melting level [45,58]. On the other hand, riming increased the density and sphericity of the particles and therefore increased their descending velocity. This hypothesis can be further corroborated by analysis of the Vr near the melting level within the dotted black boxes in Figure 11d. Therefore, the rimed particles melted completely at a lower height than the nonrimed particles, leading to a descent of the 0 °C-level bright band [45,57,59,60]. Moreover, riming may also have lowered the 0 °C-level bright band at a high precipitation intensity [61,62].
Based on the horizontal and vertical wind fields and dual-polarization signatures during the mature stage of the BSL, retrieved from the dual-polarization Doppler radar data in conjunction with the evolutionary characteristics of their QVPs retrieved from the QZ-SPOL data and the horizontal wind fields at different heights observed by the WPR, a conceptual model is developed to describe the kinematic, microphysical and radar echo structures of the examined BSL, as shown in Figure 12.
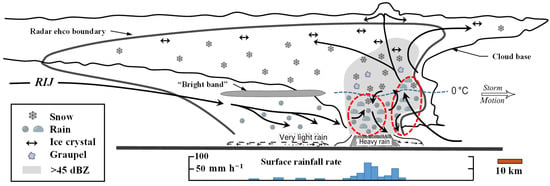
Figure 12.
Conceptual model of the kinematic, microphysical and radar echo structures of the BSL observed on 10 May 2021 in eastern China. The dotted red ovals indicate the approximate locations of the two high-ZDR bands.
6. Conclusions
In this study, the echo structure and mechanism of the evolution of a BSL that occurred in a warm sector of eastern China are examined based on ERA5, dual-polarization Doppler radar, surface disdrometer, AWS, and sounding data. The main conclusions and implications are summarized as follows:
- The presence of an ultralow-temperature region in the middle and upper levels and the transport of warm and humid airflow from the lower level led to the formation of an unstable stratification structure that was cold in the upper region and warm in the lower region. The updraft induced by upper-level divergence, together with thermal instability, promoted the occurrence and development of convection. Moreover, the strong wind shear at 0–6 km facilitated the organization and intensification of the squall-line system.
- The vertical vorticity near the leading edge of the squall line during the mature stage was a good indicator of the organized structure and evolutionary trend of the echo associated with the squall line. In other words, a positive vertical vorticity facilitated the strengthening of the echo and the organization of the echo structure, while a negative vertical vorticity indicated the loosening and weakening of the echo structure.
- The mechanism behind a new echo phenomenon—double high-ZDR bands—observed in dual-polarization radar PPI scans was studied from kinematic and microphysical structural perspectives based on 3D wind fields retrieved from multiradar data in conjunction with dual-polarization signatures and disdrometer observations. ZDR column 1 was caused by the uplifting of large, highly concentrated raindrops or supercooled water droplets over the 0 °C isotherm by the strong updraft at the leading edge of the squall line. Below the 0 °C isotherm, there were large raindrops with a low concentration. ZDR column 2 was induced by the strong downdraft and heavy precipitation behind the squall line, corresponding to a very high surface precipitation intensity. Additionally, both columns were located within the bulk of the squall line.
- The evolutionary characteristics of the microphysical structure of the bulk of the squall line and the saggy bright bands of the stratiform clouds trailing behind it were analyzed based on the QVPs retrieved from QZ-SPOL data. On this basis, together with the above findings, a conceptual model describing this type of BSL in the warm sector was established.
Author Contributions
Conceptualization, B.W.; methodology, B.W.; data, Z.W. and S.D.; validation, M.W. and B.W.; investigation, B.W. and Y.L.; writing—original draft preparation, B.W.; review and editing, M.W.; visualization, B.W., Y.L. and C.Z.; supervision, M.W. All authors have read and agreed to the published version of the manuscript.
Funding
This research was funded by the National Natural Science Foundation of China (Grant No. 41675029), Postgraduate Research & Practice Innovation Program of Jiangsu Province (No. KYCX18_0998), Science and Technology Program of Huzhou (No. 2021GZ14), Science and Technology (Key) Program of Zhejiang Meteorological Service (No. 2021ZD27), Special Program of Zhejiang Meteorological Service for the Forecaster (No. 2021YBY07) and Science and Technology Program of Zhejiang Province (No. 2022C03150).
Data Availability Statement
The data presented in this study are private, and it came from the Zhejiang Meteorological Observatory, Hangzhou, Zhejiang, China and Zhejiang Atmospheric Detection Technology Support Center, Hangzhou, Zhejiang, China.
Conflicts of Interest
The authors declare no conflict of interest.
Appendix A
The analysis uses the variational multiple-Doppler radar wind analysis procedure developed by Shapiro et al. [33] and Potvin et al. [34].
Considering that the constraining relations have many types of observational, calculation and spatiotemporal interpolation errors, uncertainties and associated limitations, the weak-constraint variational formalism was applied to the analysis of the three-dimensional winds using the dealiased radial velocity observations from the Doppler radars. The cost function is defined by
where , , , and are the cost functions associated with the observational, mass, conservation, vorticity, and smoothness constraints, respectively. In each of these cost functions, the (constant) constraint weight is represented by a subscript .
The observational cost function
where denotes the number of radars, denotes the radial wind observed by the th radar ( from 1 to ) of the Cartesian analysis space and denotes the analyzed radial wind for the th radar. To account for the translation of the wind field between = 0 and the collection time of an observation at , is given by
where represents the terminal velocity of hydrometeors, which can be estimated using radar reflectivity and an empirical equation [63]; , , and are evaluated at the backward-shifted location; and and are used to account for the intrinsic evolution of the horizontal wind field between the analysis and observation times. denotes the radial unit vector for the elevation angle and azimuth angle of the radar beam.
The mass conservation cost function is expressed by
where is the base-state atmospheric density, which is assumed to be with = 1 kg m−3 and scale height = 10 km. This and subsequent cost functions are computed over all the points on the Cartesian analysis grid (Cart).
The vorticity constraint can be expressed as
where is the vertical vorticity and and are the precalculated advection velocity components.
The smoothness cost function is expressed by
These terms of act as filters for small-scale noise suppression in the analyzed wind field and interpolate the observational variables into data voids. The use of the second-order derivatives allows spatial trends in the wind field to be extended into the regions of missing data.
At the upper-level boundary condition (the top of the atmosphere), the vertical velocity = 0 is enforced, which is commonly called the impermeability condition [64]. In the plain region, the lower boundary condition is the same as the upper-level boundary condition, = 0. For complex geometry, the setting of lower boundary conditions is based on the immersed boundary method (IBM) [65]. In this study, the Dirichlet boundary condition is applied to and the Neumann boundary condition is used for and , which can be expressed as
and
where and represent the normal derivative of and crossing the boundary, respectively, and is the terrain height. For a detailed description of the schemes for the low boundary conditions in the terrain, please refer to the previous literature [36,66,67].
References
- Glickman, T.S. Glossary of Meteorology, 2nd ed.; American Meteorological Society: Boston, MA, USA, 2000; p. 855. [Google Scholar]
- Meng, Z.Y.; Yan, D.C.; Zhang, Y.J. General Features of Squall Lines in East China. Mon. Weather Rev. 2013, 141, 1629–1647. [Google Scholar] [CrossRef]
- Nolen, R.H. A Radar Pattern Associated with Tornadoes. Bull. Am. Meteorol. Soc. 1959, 40, 277–279. [Google Scholar] [CrossRef][Green Version]
- Atkins, N.T.; Justin, M.A.; Przybylinski, R.W.; Wolf, R.A.; Ketcham, B.D. Vortex Structure and Evolution within Bow Echoes. Part I: Single-Doppler and Damage Analysis of the 29 June 1998 Derecho. Mon. Weather Rev. 2004, 132, 2224–2242. [Google Scholar] [CrossRef]
- Fujita, T.T. Manual of Downburst Identification for Project Nimrod; Satellite and Mesometeorology Research Paper 156; Department of Geophysical Sciences, University of Chicago: Chicago, IL, USA, 1978; p. 104. [Google Scholar]
- Fujita, T.T.; Byers, H.R. Spearhead Echo and Downburst in the Crash of an Airliner. Mon. Weather Rev. 1977, 105, 129–146. [Google Scholar] [CrossRef]
- Weisman, M.L. The Genesis of Severe, Long-Lived Bow Echoes. J. Atmos. Sci. 1993, 50, 645–670. [Google Scholar] [CrossRef]
- Wakimoto, R.M.; Murphey, H.V.; Nester, A.; Jorgensen, D.P.; Atkins, N.T. High Winds Generated by Bow Echoes. Part I: Overview of the Omaha Bow Echo 5 July 2003 Storm during Bamex. Mon. Weather Rev. 2006, 134, 2793–2812. [Google Scholar] [CrossRef]
- Burgess, D.W.; Smull, B.F. Doppler Radar Observations of a Bow Echo Associated with a Long-Track Severe Windstorm. In Proceedings of the 16th Conference on Severe Local Storms, American Meteor Society, Kananaskis, AB, Canada, 22–26 October 1990. [Google Scholar]
- Jorgensen, D.P.; Smull, B.F. Mesovortex Circulations Seen by Airborne Doppler Radar within a Bow-Echo Mesoscale Convective System. Bull. Am. Meteorol. Soc. 1993, 74, 2146–2158. [Google Scholar] [CrossRef][Green Version]
- Schmidt, J.M.; Cotton, W.R. A High Plains Squall Line Associated with Severe Surface Winds. J. Atmos. Sci. 1989, 46, 281–302. [Google Scholar] [CrossRef][Green Version]
- Atkins, N.T.; Bouchard, C.S.; Przybylinski, R.W.; Trapp, R.J.; Schmocker, G. Damaging Surface Wind Mechanisms within the 10 June 2003 Saint Louis Bow Echo During Bamex. Mon. Weather Rev. 2005, 133, 2275–2296. [Google Scholar] [CrossRef]
- Davis, C.; Atkins, N.; Bartels, D.; Bosart, L.; Coniglio, M.; Bryan, G.; Cotton, W.; Dowell, D.; Jewett, B.; Johns, R.; et al. The Bow Echo and MCV Experiment: Observations and Opportunities. Bull. Am. Meteorol. Soc. 2004, 85, 1075–1094. [Google Scholar] [CrossRef]
- Klimowski, B.A.; Hjelmfelt, M.R.; Bunkers, M.J. Radar Observations of the Early Evolution of Bow Echoes. Wea. Forecast. 2004, 19, 727–734. [Google Scholar] [CrossRef]
- Wheatley, D.M.; Trapp, R.J.; Atkins, N.T. Radar and Damage Analysis of Severe Bow Echoes Observed During Bamex. Mon. Weather Rev. 2006, 134, 791–806. [Google Scholar] [CrossRef]
- Wakimoto, R.M.; Stauffer, P.; Lee, W. The Vertical Vorticity Structure within a Squall Line Observed During Bamex: Banded Vorticity Features and the Evolution of a Bowing Segment. Mon. Wea. Rev. 2015, 143, 341–362. [Google Scholar] [CrossRef][Green Version]
- Funk, T.W.; Darmofal, K.E.; Kirkpatrick, J.D.; DeWald, V.L.; Przybylinski, R.W.; Schmocker, G.K.; Lin, Y.J. Storm Reflectivity and Mesocyclone Evolution Associated with the 15 April 1994 Squall Line over Kentucky and Southern Indiana. Wea. Forecast. 1999, 14, 976–993. [Google Scholar] [CrossRef]
- Trapp, R.J.; Weisman, M.L. Low-Level Mesovortices within Squall Lines and Bow Echoes. Part II: Their Genesis and Implications. Mon. Wea. Rev. 2003, 131, 2804–2823. [Google Scholar] [CrossRef]
- Atkins, N.T.; Laurent, M.S. Bow Echo Mesovortices. Part II: Their Genesis. Mon. Weather Rev. 2009, 137, 1514–1532. [Google Scholar] [CrossRef]
- Bringi, V.; Chandrasekar, V. Polarimetric Doppler Weather Radar. Principles and Applications; Cambridge University Press: Cambridge, UK, 2001; pp. 378–531. [Google Scholar]
- Ryzhkov, A.V.; Zrnić, D. Radar Polarimetry for Weather Observations; Springer International Publishing: Cham, Switzerland, 2019; pp. 63–143. Available online: https://link.springer.com/book/10.1007/978-3-030-05093-1 (accessed on 1 January 2020).
- Meischner, P.F.; Bringi, V.N.; Heimann, D.; Höller, H. A Squall Line in Southern Germany: Kinematics and Precipitation Formation as Deduced by Advanced Polarimetric and Doppler Radar Measurements. Mon. Weather Rev. 1991, 119, 678–701. [Google Scholar] [CrossRef]
- Evaristo, R.; Scialom, G.; Viltard, N.; Lemaître, Y. Polarimetric Signatures and Hydrometeor Classification of West African Squall Lines. Q. J. R. Meteorol. Soc. 2010, 136, 272–288. [Google Scholar] [CrossRef]
- Wen, J.; Zhao, K.; Huang, H.; Zhou, B.W.; Yang, Z.L.; Chen, G.; Wang, M.J.; Wen, L.; Dai, H.N.; Xu, L.L.; et al. Evolution of Microphysical Structure of a Subtropical Squall Line Observed by a Polarimetric Radar and a Disdrometer During Opacc in Eastern China. J. Geophys. Res. Atmos. 2017, 122, 8033–8050. [Google Scholar] [CrossRef]
- Zhou, A.; Zhao, K.; Lee, W.C.; Huang, H.; Hu, D.M.; Fu, P.L. VDRAS and Polarimetric Radar Investigation of a Bow Echo Formation after a Squall Line Merged with a Preline Convective Cell. J. Geophys. Res. Atmos. 2020, 125, e2019JD031719. [Google Scholar] [CrossRef]
- Xu, A.H.; SUN, J.S.; Xu, D.B.; Wan, X.L.; Guo, Y. Basic Synoptic Situation Classification and Element Character of Severe Convection in China. Meteor Mon. 2014, 40, 400–411. [Google Scholar] [CrossRef]
- Kumjian, M.R.; Khain, A.P.; Benmoshe, N.; Ilotoviz, E.; Ryzhkov, A.V.; Phillips, V.T. The Anatomy and Physics of Zdr Columns: Investigating a Polarimetric Radar Signature with a Spectral Bin Microphysical Model. J. Appl. Meteorol. Climatol. 2014, 53, 1820–1843. [Google Scholar] [CrossRef]
- Wu, B.; Wei, M.; Li, Y. Dual-Polarization Radar Observations of the Evolution of a Supercell Tornado and Analysis of the Echo Mechanisms. Atmosphere 2022, 13, 797. [Google Scholar] [CrossRef]
- Bringi, V.N.; Seliga, T.A.; Cooper, W.A. Analysis of aircraft hydrometeor spectra and differential reflectivity (ZDR) radar measurements during the Cooperative Convective Precipitation Experiment. Radio Sci. 1984, 19, 157–167. [Google Scholar] [CrossRef]
- Zhang, G.; Sun, J.; Brandes, E.A. Improving Parameterization of Rain Microphysics with Disdrometer and Radar Observations. J. Atmos. Sci. 2006, 63, 1273–1290. [Google Scholar] [CrossRef]
- Schuur, T.; Ryzhkov, A.; Heinselman, P.; Zrnic, D.; Burgess, D.; Scharfenberg, K. Observations and Classification of Echoes with the Polarimetric WSR-88D Radar; Report of the National Severe Storms Laboratory; National Severe Storms Laboratory: Norman, OK, USA, 2003; Volume 46, p. 73069. [Google Scholar]
- Zhang, J.; Wang, S.X. An Automated 2D Multipass Doppler Radar Velocity Dealiasing Scheme. J. Atmos. Ocean. Technol. 2006, 23, 1239–1248. [Google Scholar] [CrossRef]
- Shapiro, A.; Potvin, C.K.; Gao, J.D. Use of a Vertical Vorticity Equation in Variational Dual-Doppler Wind Analysis. J. Atmos. Ocean. Technol. 2009, 26, 2089–2106. [Google Scholar] [CrossRef]
- Potvin, C.K.; Shapiro, A.; Xue, M. Impact of a Vertical Vorticity Constraint in Variational Dual-Doppler Wind Analysis: Tests with Real and Simulated Supercell Data. J. Atmos. Ocean. Technol. 2012, 29, 32–49. [Google Scholar] [CrossRef]
- Bousquet, O.; Tabary, P.; Parent du Châtelet, J. Operational multiple-Doppler wind retrieval inferred from long-range radial velocity measurements. J. Appl. Meteorol. Climatol. 2008, 47, 2929–2945. [Google Scholar] [CrossRef]
- Liou, Y.-C.; Chang, Y.-J. A Variational Multiple-Doppler Radar Three-Dimensional Wind Synthesis Method and its Impacts on Thermodynamic Retrieval. Mon. Weather Rev. 2009, 137, 3992–4010. [Google Scholar] [CrossRef]
- de Moraes Frasson, R.P.; da Cunha, L.K.; Krajewski, W.F. Assessment of the Thies optical disdrometer performance. Atmos. Res. 2011, 101, 237–255. [Google Scholar] [CrossRef]
- Sarkar, T.; Das, S.; Maitra, A. Assessment of different raindrop size measuring techniques: Inter-comparison of Doppler radar, impact and optical disdrometer. Atmos. Res. 2015, 160, 15–27. [Google Scholar] [CrossRef]
- Chen, B.J.; Wang, J.; Gong, D.L. Raindrop Size Distribution in a Midlatitude Continental Squall Line Measured by Thies Optical Disdrometers over East China. J. Appl. Meteorol. Climatol. 2016, 55, 621–634. [Google Scholar] [CrossRef]
- Atlas, D.; Srivastava, R.C.; Sekhon, R.S. Doppler Radar Characteristics of Precipitation at Vertical Incidence. Rev. Geophys. 1973, 11, 1–35. [Google Scholar] [CrossRef]
- Friedrich, K.; Higgins, S.; Masters, F.J.; Lopez, C.R. Articulating and Stationary PARSIVEL Disdrometer Measurements in Conditions with Strong Winds and Heavy Rainfall. J. Atmos. Ocean. Technol. 2013, 30, 2063–2080. [Google Scholar] [CrossRef]
- Tokay, A.; Bashor, P.G. An experimental study of smallscale variability of raindrop size distribution. J. Appl. Meteorol. Climatol. 2010, 49, 2348–2365. [Google Scholar] [CrossRef]
- Guyot, A.; Pudashine, J.; Protat, A.; Uijlenhoet, R.; Pauwels, V.; Seed, A.; Walker, J.P. Effect of disdrometer type on rain drop size distribution characterisation: A new dataset for south-eastern Australia. Hydrol. Earth Syst. Sci. 2019, 23, 4737–4761. [Google Scholar] [CrossRef]
- Zhang, G.F. Weather Radar Polarimetry; CRC Press: Boca Raton, FL, USA, 2016; pp. 10–16. [Google Scholar]
- Ryzhkov, A.; Zhang, P.; Reeves, H.; Kumjian, M.; Tschallener, T.; Troemel, S.; Simmer, C. Quasi-vertical profiles–a new way to look at polarimetric radar data. J. Atmos. Ocean. Technol. 2016, 33, 551–562. [Google Scholar] [CrossRef]
- OuYang, S.C.; McNeil, D.; Lin, Y. Entering Irregularity; Meteorological Press: Beijing, China, 2002; pp. 219–221. [Google Scholar]
- Yu, X.D.; Zheng, Y.G. Advances in Severe Convection Research and Operation in China. J. Meteorol. Res. 2020, 34, 189–217. [Google Scholar] [CrossRef]
- Leary, C.A.; Houze, R.A. The Structure and Evolution of Convection in a Tropical Cloud Cluster. J. Atmos. Sci. 1979, 36, 437–457. [Google Scholar] [CrossRef]
- Przybylinski, R.W. The Bow Echo: Observations, Numerical Simulations, and Severe Weather Detection Methods. Wea. Forecast. 1995, 10, 203–218. [Google Scholar] [CrossRef]
- Atkins, N.T.; Cunningham, J.J. The Influence of Low-Level Stable Layers on Damaging Surface Winds within Bow Echoes. In Proceedings of the 23rd Conference on Severe Local Storms, American Meteor Society, Saint Louis, MO, USA, 7 November 2006. [Google Scholar]
- Illingworth, A.J.; Goddard, J.W.; Cherry, S.M. Polarization Radar Studies of Precipitation Development in Convective Storms. Q. J. R. Meteorol. Soc. 1987, 113, 469–489. [Google Scholar] [CrossRef]
- Hall, M.P.; Goddard, J.W.; Cherry, S.M. Identification of Hydrometeors and Other Targets by Dual-Polarization Radar. Radio Sci. 1984, 19, 132–140. [Google Scholar] [CrossRef]
- Caylor, I.J.; Illingworth, A.J. Radar Observations and Modelling of Warm Rain Initiation. Q. J. R. Meteorol. Soc. 1987, 113, 1171–1191. [Google Scholar] [CrossRef]
- Tuttle, J.D.; Bringi, V.N.; Orville, H.D.; Kopp, F.J. Multiparameter Radar Study of a Microburst: Comparison with Model Results. J. Atmos. Sci. 1989, 46, 601–620. [Google Scholar] [CrossRef][Green Version]
- Zhu, J.S.; Wei, M.; Gao, S.N.; Hu, H.F.; Ma, L. Study on the Scattering Mechanism of Squall Lines with C-Band Dual Polarization Radar. Part I: Echo Characteristics and Particles Phase Recognition. Front. Earth Sci. 2021. [Google Scholar] [CrossRef]
- Zhu, J.S.; Wei, M.; Gao, S.N.; Lu, C.S. The Scattering Mechanism of Squall Lines with C-Band Dual Polarization Radar. Part II: The Mechanism of an Abnormal ZDR Echo in Clear Air Based on the Parameterization of Turbulence Deformation. Front. Earth Sci. 2021. [Google Scholar] [CrossRef]
- Kumjian, M.R.; Mishra, S.; Giangrande, S.E.; Toto, T.; Ryzhkov, A.V.; Bansemer, A. Polarimetric Radar and Aircraft Observations of Saggy Bright Bands During MC3E. J. Geophys. Res. Atmos. 2016, 121, 3584–3607. [Google Scholar] [CrossRef]
- Vogel, J.M.; Fabry, F. Contrasting Polarimetric Observations of Stratiform Riming and Nonriming Events. J. Appl. Meteorol. Climatol. 2018, 57, 457–476. [Google Scholar] [CrossRef]
- Zawadzki, I.; Szyrmer, W.; Bell, C.; Fabry, F. Modeling of the Melting Layer. Part III: The Density Effect. J. Atmos. Sci. 2005, 62, 3705–3723. [Google Scholar] [CrossRef]
- Griffin, E.M.; Schuur, T.J.; Ryzhkov, A.V. A Polarimetric Radar Analysis of Ice Microphysical Processes in Melting Layers of Winter Storms Using S-Band Quasi-Vertical Profiles. J. Appl. Meteorol. Climatol. 2020, 59, 751–767. [Google Scholar] [CrossRef]
- Carlin, J.T.; Ryzhkov, A.V. Estimation of Melting-Layer Cooling Rate from Dual-Polarization Radar: Spectral Bin Model Simulations. J. Appl. Meteorol. Climatol. 2019, 58, 1485–1508. [Google Scholar] [CrossRef]
- Li, H.; Tiira, J.; Lerber, A.V.; Moisseev, D. Towards the Connection between Snow Microphysics and Melting Layer: Insights from Multifrequency and Dual-Polarization Radar Observations During BAECC. Atmos. Chem. Phys. 2020, 20, 9547–9562. [Google Scholar] [CrossRef]
- Shapiro, A.; Ellis, S.; Shaw, J. Single-Doppler Velocity Retrievals with Phoenix II Data: Clear Air and Microburst Wind Retrievals in the Planetary Boundary Layer. J. Atmos. Sci. 1995, 52, 1265–1287. [Google Scholar] [CrossRef]
- Potvin, C.; Betten, D.; Wicker, L.; Elmore, K.; Biggerstaff, M. 3DVAR versus Traditional Dual-Doppler Wind Retrievals of a Simulated Supercell Thunderstorm. Mon. weather Rev. 2012, 140, 3487–3494. [Google Scholar] [CrossRef]
- Peskin, C. Flow Patterns around Heart Valves: A Numerical Method. J. Comput. Phys. 1972, 10, 252–271. [Google Scholar] [CrossRef]
- Liou, Y.C.; Chang, S.F.; Sun, J. An Application of the Immersed Boundary Method for Recovering the Three-Dimensional Wind Fields over Complex Terrain Using Multiple-Doppler Radar Data. Mon. Weather Rev. 2012, 140, 1603–1619. [Google Scholar] [CrossRef]
- Bell, M.; Montgomery, M.; Emanuel, K. Air–Sea Enthalpy and Momentum Exchange at Major Hurricane Wind Speeds Observed During Cblast. J. Atmos. Sci. 2012, 69, 3197–3222. [Google Scholar] [CrossRef]
Publisher’s Note: MDPI stays neutral with regard to jurisdictional claims in published maps and institutional affiliations. |
© 2022 by the authors. Licensee MDPI, Basel, Switzerland. This article is an open access article distributed under the terms and conditions of the Creative Commons Attribution (CC BY) license (https://creativecommons.org/licenses/by/4.0/).