Article

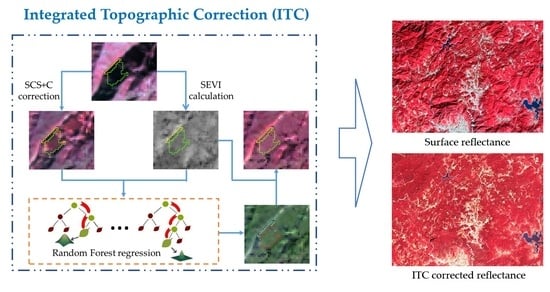
Vegetation Monitoring for Mountainous Regions Using a New Integrated Topographic Correction (ITC) of the SCS + C Correction and the Shadow-Eliminated Vegetation Index

1
Key Laboratory of Spatial Data Mining & Information Sharing of Ministry of Education, National & Local Joint Engineering Research Center of Satellite Geospatial Information Technology, Academy of Digital China (Fujian), Fuzhou University, No. 2, Wulongjiang North Rd., Fuzhou 350108, China
2
Department of Geography, Texas A&M University, College Station, TX 77843, USA
*
Author to whom correspondence should be addressed.
Remote Sens. 2022, 14(13), 3073; https://doi.org/10.3390/rs14133073
Submission received: 16 May 2022 / Revised: 19 June 2022 / Accepted: 22 June 2022 / Published: 26 June 2022

Abstract

:
The mountainous vegetation is important to regional sustainable development. However, the topographic effect is the main obstacle to the monitoring of mountainous vegetation using remote sensing. Aiming to retrieve the reflectance of frequently-used red–green–blue and near-infrared (NIR) wavebands of rugged mountains for vegetation mapping, we developed a new integrated topographic correction (ITC) using the SCS + C correction and the shadow-eliminated vegetation index. The ITC procedure consists of image processing, data training, and shadow correction and uses a random forest machine learning algorithm. Our study using the Landsat 8 Operational Land Imager (OLI) multi-spectral images in Fujian province, China, showed that the ITC achieved high performance in topographic correction of regional mountains and in transferability from the sunny area of a scene to the shadow area of three scenes. The ITC-corrected multi-spectral image with an NIR–red–green composite exhibited flat features with impressions of relief and topographic shadow removed. The linear regression of corrected waveband reflectance vs. the cosine of the solar incidence angle showed an inclination that nearly reached the horizontal, and the coefficient of determination decreased to 0.00~0.01. The absolute relative errors of the cast shadow and the self-shadow all dramatically decreased to the range of 0.30~6.37%. In addition, the achieved detection rate of regional vegetation coverage for the three cities of Fuzhou, Putian, and Xiamen using the ITC-corrected images was 0.92~6.14% higher than that using the surface reflectance images and showed a positive relationship with the regional topographic factors, e.g., the elevation and slope. The ITC-corrected multi-spectral images are beneficial for monitoring regional mountainous vegetation. Future improvements can focus on the use of the ITC in higher-resolution imaging.

Graphical Abstract

1. Introduction

Mountainous vegetation, e.g., forests and shrubs, is a vital resource for regional sustainable development [1,2,3]. However, the topographic effect hinders vegetation mapping [4,5,6], vegetation change detection [7], and vegetation biophysical parameter retrieval such as the fractional vegetation cover (FVC) [8], leaf area index (LAI) [9,10], and net primary productivity (NPP) [11]. It results in the phenomena of “same body with different spectra” and “different bodies with same spectrum”, e.g., the self-shadow, cast shadow, and sunny area caused by the anisotropic solar illumination [12,13,14]. After nearly 40 years of development, numerous topographic corrections (TCs) have been developed and can be classified as three categories. (1) Sun–terrain–sensor (STS) geometric correction methods. Assuming the terrain surface as Lambert, the STS geometric correction methods remove or reduce topographic effect by calibrating the geometric model of the sun, terrain, and sensor angles, e.g., the cosine correction [15,16,17], C-correction [17], or simple topographic correction using estimation of diffuse light (SCEDIL) [18]. These corrections rectify the solar direct irradiance successfully; however, they face difficulties in measuring the diffuse-skylight irradiance and the adjacent-terrain irradiance [13,14]. Usually, the diffuse-skylight irradiance and the adjacent-terrain irradiance are simplified as a factor in this type of correction method, e.g., as the C factor [17]. Specifically, the cast shadow exists in a “sunlit” slope or flat according to the STS geometric model, however it suffers irradiance obstruction from the higher mountain in the direction of solar incidence. This paradox between surface spectral features and topographic characteristics significantly decreases the correction accuracy of the cast shadow by these methods. (2) Physically based correction models. Considering the different bidirectional reflectance distribution functions (BRDFs) of the canopy in inclined and horizontal surfaces, many BRDF-based correction models have been developed [19,20,21], such as the Minnaert correction [22], sun–canopy–sensor (SCS) correction [23,24], SCS + C correction [25], adaptive shade compensation (ASC) model [26], gamma method [27], Sandmeier model [28], Santini model [29], BRDF-based atmospheric and topographic correction (BRATC) model [30], approach based on path length correction (PLC) [31], and the four-scale bidirectional reflection model of slope geometric optical model [32,33]. These BRDF-based correction models have a solid physical basis [34,35]; however, the ill-posed nature of the inverse problem and complicated parameters counteract their advantage in physics and constrain their practical applications [36]. What is more, these models made little progress in removal of the cast shadow in rugged terrains. (3) Spectral feature (SF) methods. The SF methods consider the spectral feature ranging in rugged mountain and the waveband reflectivity characteristics between shadow areas and sunny areas, e.g., the classic band-ratio model [37]. Recently, a type of method in the form of vegetation indices, based on the band-ratio model, has been developed to obtain the vegetation information without the topographic shadow, such as the modified enhanced vegetation index [38] and the shadow-eliminated vegetation index (SEVI) [39]. Some of them can rectify the cast shadow as well as the self-shadow, with the value in the shadows approximately corrected to that in sunny areas, e.g., the SEVI achieved a high performance in the removal of topographic shadow and was used in vegetation monitoring of protected areas in rugged mountains [40]. However, these methods lose spectral resolution [24], obtaining a single-band grayscale image where the topographic shadow was eliminated.
By comparing these existing methods, it was found that the topographic effect has been successfully corrected for in case studies of small areas of multi-spectra [3], specifically the correction of sunny areas, or for a regional grayscale image with eliminated topographic effect. However, the large-area correction of topographic shadow in multi-spectra is still a challenge, specifically of the cast shadow. We aimed to develop a new approach to remove the shadow of the frequently used spectral waveband reflectance of the red–green–blue (RGB) and near-infrared (NIR) in mountainous regions, since these four wavebands are the basic elements of optical remote sensing, e.g., the SPOT-6 and 7, GF-1 and 2, ZY-3, and Landsat have (or even only have) these four. Considering the performances of the three categories of topographic corrections, a possible solution would be to integrate the advantages of the physically based correction model and the spectral feature method. Specifically, the SCS + C correction is a pioneering method in BRDF correction with simple parameters [23] and better characterizes diffuse irradiance to reduce the overcorrection [25], so it was recommended as one of algorithms that achieved the best correction performance [41,42]. In addition, the SEVI successfully eliminated the topographic shadow effect in both the self-shadow and the cast shadow. Therefore, the objective in this study was to develop a new integrated topographic correction (ITC) using the SCS + C correction and the SEVI to remove topographic effect for retrieving the conventionally used RGB and NIR waveband reflectance for mountainous vegetation mapping.

2. Study Area and Data

The regional study area is mainly located in Fujian province of Southeast China (Figure 1), and its elevation and slope are listed in Table 1. The major land cover in this area is mountainous forest with a prominent topographic effect. We acquired three scenes of Landsat 8 Operational Land Imager (OLI) multi-spectral images with 30 m spatial resolution on 11 December 2019 and the corresponding 30 m Advanced Spaceborne Thermal Emission and Reflection Radiometer Global Digital Elevation Model Version 2 (ASTER GDEM V2) from the Geospatial Data Cloud site, Computer Network Information Center, Chinese Academy of Sciences (Geospatial Data Cloud. Available online: http://www.gscloud.cn (accessed on 22 February 2022)). The path/row, sun elevation, and azimuth of these acquired images are also listed in Table 1.

3. Methods

We supposed that the SEVI has high correlation with the topographic-corrected reflectance of frequently used RGB and NIR spectral wavebands, then the regressions between the SEVI and the waveband reflectance of sunny areas can be used to correct the waveband reflectance of topographic shadows, specifically of the cast shadow. Therefore, the ITC processing flow consists of image processing (including atmospheric correction, topographic shadow extraction, SCS + C correction, and SEVI calculation), data training, and shadow correction (including accuracy test and applicability test) (Figure 2). In data training, we used the randomly generated points as training samples. Every set of the training sample included the SEVI, surface reflectance (ρ), cosine of the solar incidence angle (cos i), and SCS + C corrected reflectance of sunny areas in a scene of Path 119/Row 042. Moreover, the shadow area of three scenes of Path 119 with Rows of 041, 042, and 043 was used subjected to correction. As for the regressing method, we selected the random forest (RF) machine learning technique [43,44,45], since related studies indicated that it produced few instances of biased estimates or overfitting [46,47,48] and it showed higher estimate accuracy than support vector regression (SVR), artificial neural network (ANN), traditional linear regression model, and so on [49,50,51]. Finally, we used the ITC-corrected multi-spectral images to extract and map the vegetation of regional cities.

3.1. Image Processing

3.1.1. Atmospheric Correction

The surface reflectance of the image was used after data pre-processing of the radiometric calibration and atmospheric correction. The radiometric calibration transformed the image’s digital number (DN) into radiance, using the band gain and bias provided by the Landsat 8 OLI metadata. The atmospheric correction by the fast line-of-sight atmospheric analysis of spectral hypercubes (FLAASH) model was used to obtain the physical parameter of surface reflectance. Major parameters of the FLAASH correction were set in the ENVI 5.3, for example, atmospheric model was set as tropical, aerosol model as rural, and aerosol retrieval as 2-band (K-T).

3.1.2. Topographic Shadow Extraction

Topographic shadow is the pixel’s lack of solar direct irradiance, including the self-shadow and the cast shadow [7,20,52]. First, the totally shady area was extracted by the spectral feature of image, using the supervised classification of the RF classifier. The water area, mixed in the shady area, was excluded using the normalized difference water index (NDWI) [53]. Then, the self-shadow was calculated from the DEM by the Formula (1), while the cast shadow was selected from the shady area adjacent to the self-shadow.
S self = { 0 ,     tan σ · cos ( π ( ω β ) ) tan γ 1 ,     tan σ · cos ( π ( ω β ) ) > tan γ ,
where Sself is the self-shadow, σ is the slope angle, ω is the solar azimuth angle, β is the aspect angle, and γ is the sun elevation angle. The values of σ and β were computed from the DEM data, and the values of γ and ω were taken directly from the header files of image.

3.1.3. SCS + C Correction

Using the surface reflectance, the SCS + C-corrected reflectance was calculated using the following model [25]:
ρ SCS + C = ρ T · ( cos θ · cos σ + c cos i + c ) ,
cos   i = cos σ · cos θ + sin σ · sin θ · cos ( β ω ) ,
where ρSCS+C is the reflectance observed for a horizontal surface after the SCS + C correction; ρT is the reflectance observed over an inclined surface; and c, which equals the quotient of intercept b and inclination a of an observed empirical linear correlation between ρT and the cos i, is assumed to be constant for a given wavelength; i is the solar incidence angle, defined as the angle between the normal to the ground and sun’s rays; and θ is the solar zenith angle. The value of θ was obtained by subtracting γ from π/2.

3.1.4. SEVI Calculation

The SEVI image was calculated from the surface reflectance of the red band and the NIR band (Formula (4)). As a key parameter, the adjustment factor balances the under-elimination or over-elimination of topographic shadow in rugged mountains. We used a calculation algorithm based on the block information entropy (the BIE-algorithm) to obtain the best adjustment factor [40]. First, the slope calculated from the ASTER GDEM V2 of the 30 m spatial resolution was resampled to a 6 km resolution. The pixels of the 1% highest slopes of the 6 km resolution were extracted as blocks. Second, the information entropy of SEVI in every block was calculated (Formulas (5) and (6)). The optimized adjustment factor for a block was obtained when the information entropy of SEVI achieved its maximum value (Formula (7)), and the best adjustment factor for a scene was obtained from the block that achieved the highest information entropy of SEVI among the blocks (Formula (8)). Finally, the three scenes of the SEVI image were normalized (Formula (9)), and the intersected area between two SEVI scenes was used to verify the SEVI mosaic accuracy.
SEVI = ρ n i r ρ r + f ( Δ ) · 1 ρ r = RVI + f ( Δ ) · SVI ,
H = i = 1 n p i · ln ( p i ) ln ( n ) ,
p i = x i i = 1 n x i ,   i = 1 n p i = 1 ,   0 < p i < 1 ,
f b = argmax ( H ) ,   f ( Δ ) ( 0.001 , 1.000 ) ,
f b = argmax ( H b ) ,   f ( Δ ) ( f b j , j = 1 , , m ) ,
where ρ n i r is the surface reflectance of the near-infrared band, ρ r is the surface reflectance of the red band, f ( Δ ) is the adjustment factor, RVI is the ratio vegetation index, SVI is the shadow vegetation index, H is the information entropy of SEVI in a block, p i is the percentage of a pixel SEVI value in a selected block, x i is a pixel value of SEVI, n is the number of pixels in a selected block, f b is an optimized adjustment factor for a block, f s is the best adjustment factor for an entire scene, H b is the maximum information entropy of SEVI in a block, and m is the number of selected blocks in a whole scene image.
SEVI = SEVI SEVI min SEVI max SEVI min ,
where SEVI is the normalized SEVI , SEVI min is the minimum SEVI of an entire scene, and SEVI max is the maximum SEVI of an entire scene.

3.2. Data Training

In all, 100,000 points were randomly generated from an entire scene of Path 119/Row 042, and about 22,000 points located in the sunny area were selected and further split as training set of 70% of the points and test data of the remaining 30% of points. The SCS + C-corrected reflectance of frequently used wavebands in sunny areas were used as the dependent variable, while the SEVI, ρ, and cos i were input independent variables (Table 2) since ρ is an elementary spectral feature of the remote sensing image and cos i is a fundamental element of the classic topographic corrections. Using a Python module of Scikit-learn, a bootstrap strategy was applied to the training points to improve the RF regressor’s generalizability. In addition, the hyper-parameters of the RF regressor were optimized using Bayesian optimization, i.e., a set of combinations of the hyper-parameters was randomly formed by assembling the possible values of every hyper-parameter. Finally, we evaluated the training accuracy using the k-fold cross-validation [54] and used the corresponding indicators of the coefficient of determination (r2) to reflect the degree of linear relationship between the observed reflectance and forecasted reflectance and the root mean squared error (RMSE) to measure the discrepancy between forecasted and observed values. Since the topographic characteristics and spectral features of the shadow area are different from those of the sunny area, the test accuracy of sunny areas cannot be used to represent the shadow correction accuracy. Considering the sunny area is not the correction target in our proposed new ITC, we evaluate the forecasting accuracy of the regressions for shadow area correction.

3.3. Shadow Correction

3.3.1. Accuracy Test

We corrected the topographic shadow using the RF regressor and inputs with high training accuracy. It is significant to evaluate the forecasting accuracy of the regressions trained using sunny areas while using them for shadow area correction; however, the test data of waveband reflectance in shadow area are difficult to obtain. Considering the conventionally used validation methods of topographic correction, we used their corresponding indicators to test forecasting accuracy: the r2 and RMSE of linear regression between waveband reflectance and the cos i, and the relative error (RE) between the waveband reflectance of sunny areas and that of topographic shadow, i.e., the REself for the self-shadow and the REcast for the cast shadow (Formula (10)). We called this method as 4R-evaluation. The 213 sets of evaluation samples were randomly selected from the scene of Path 119/Row 042 with the aid of higher-spatial-resolution images from Baidu Maps and GF-2 (yellow points in Figure 1). Considering Tobler’s first law of geography [55], every set of the evaluation sample (i.e., the sunny area, self-shadow, and cast shadow) was selected from the closely located pixels of homogenous vegetation cover.
RE = ( x ¯ s u n x ¯ s h a ) / x ¯ s u n × 100 %   ,
where RE is relative error, x ¯ s u n is mean reflectance of sunny area samples, x ¯ s h a is mean reflectance of each type of shadow sample, such as the cast shadow and the self-shadow.
In addition, according to Formula (4), if topographic effect does not exist in an image, the SEVI degrades into the RVI. Thus, as for the red or NIR waveband reflectance, if either of them removes topographic effect, the other can be calculated using an inverse computation method, e.g., Formula (11) can be used to calculate the NIR band reflectance.
ρ n i r - t c = RVI · ρ r - t c = SEVI · ρ r - t c ,
where ρnir-tc is the topographic-corrected reflectance of the NIR waveband, and ρr-tc is the topographic-corrected reflectance of the red waveband.

3.3.2. Applicability Test

The ITC approach’s applicability was tested using the retrieved waveband reflectance of the shadow area in two other scenes of Path 119/Row 041 and Path 119/Row 043, which were corrected by the regressions trained from the sunny area of the scene of Path 119/Row 042. The performance of the removal topographic shadow was evaluated by the visual analysis and the statistics of evaluation samples selected randomly from the three scenes. In visual analysis, the subareas clipped from three scenes were zoomed in for checking the elimination of topographic shadow (white rectangles in Figure 1). The statistics included the scatter plots between waveband reflectance and the cos i, and relative error between waveband reflectance of sunny area and that of the shadow area. In addition, the frequently used surface reflectance and SCS + C corrected reflectance were used for comparison with the ITC-corrected results.

4. Results

4.1. Processed Images and Topographic Shadow

The surface reflectance image after atmospheric correction displayed a strong relief effect with prominent fragmentized shadows (Figure 3a). The overall accuracy of shadow classification was 94.62%, and the kappa coefficient was 0.88. Because the reflectance of the NIR waveband is much bigger than that of the RGB wavebands, the reflectance of the NIR band and that of the RGB bands were illustrated, separately, in the box plot (Figure 4 and Figure 5). Computing from the selected 213 sets of evaluation samples, the surface reflectance means of the sunny area were 0.0232~0.0451 in RGB wavebands and 0.3392 in NIR waveband, while those of shadows ranged from 0.0081 to 0.0111 in RGB wavebands and from 0.0450 to 0.0455 in NIR waveband (Figure 4a and Figure 5a). This surface reflectance value distribution showed that the topographic effect in rugged mountains is, apparently, characterized by the surface reflectance of the shadow area less than that of the sunny area.
The SCS + C-corrected image achieved a better impression of relief reduction; however, the topographic shadow still existed, specifically the cast shadow (Figure 3b). In the box plot, the corrected reflectance of the sunny area decreased while that of the shadow area increased. The corrected reflectance means of the sunny area declined to 0.0197~0.0373 in RGB wavebands and to 0.2669 in the NIR waveband; however, those of the shadow area improved to 0.0130~0.0165 of the cast shadow and to 0.0158~0.0232 of the self-shadow in RGB wavebands, and to 0.0849 (cast shadow)~0.2014 (self-shadow) in the NIR waveband (Figure 4b and Figure 5b). Apparently, the reflectance of the shadow area was still less than that of the sunny area, specifically the reflectance of the cast shadow.
In addition, the distribution of the cos i was very similar to that of surface reflectance (Figure 3j vs. Figure 3a). However, the SEVI exhibited an overall flat feature with impressions of relief and topographic shadow removed drastically, including the self-shadow and the cast shadow (Figure 3k).

4.2. Accuracy and Corrected Images

After training by the RF regressor, the r2 and RMSE for training accuracy showed that six inputs were acceptable for the RGB wavebands (r2 > 0.73) except the input of cos i (r2 < 0.03). Meanwhile, only two inputs of ρ + cos i and SEVI + ρ + cos i were acceptable for the NIR waveband (r2 = 0.84), and the other five inputs were rejected due to the r2 being less than 0.28 (Figure 6a,b). However, the forecasting accuracy showed that the input of SEVI was prioritized for the RGB waveband correction, since the r2, RMSE, REself, and REcast of it were the best among the six inputs (Figure 6c–f). As for the NIR waveband correction, the two inputs ρ + cos i and SEVI + ρ + cos i were rejected, due to the high value of test indicators, specifically the r2 > 0.56 and the absolute REself > 75%. Therefore, we used the ITC with the input SEVI to correct the topographic shadow of the RGB wavebands and used the inverse calculation method of Formula (11) to correct the NIR band reflectance. The sample areas of the corrected image exhibited a flat feature, and the impressions of relief and topographic shadow were removed, including the cast shadow and the self-shadow (Figure 3c). The box plot showed that the reflectance of the shadows was rectified to the level of the sunny areas; with their reflectance corrected to that of the sunny area, the cast shadow and self-shadow were more approximate and distributed in more concentrated intervals of 0.0279~0.0286 (red band), 0.0365~0.0373 (green band), 0.0180~0.0197 (blue band), and 0.2788~0.3013 (NIR band), respectively (Figure 4c and Figure 5c).
The other ITC-corrected images with inputs in Table 1 were illustrated in the sample areas, and further specified the accuracy report of Figure 6 in vision. The corrected result with the input ρ showed an under-reflected effect with fragmentized shadows (Figure 3d), on the contrary, that with the inputs cos i showed an over-reflected and strong relief effects with fragmentized bright patches (Figure 3e). The corrected result with the input SEVI + ρ still showed an under-reflected effect with smaller fragmentized shadows (Figure 3f), on the contrary, that with the input SEVI + cos i showed an over-reflected and relief effect with fragmentized bright patches (Figure 3g). Finally, the corrected results with inputs ρ + cos i and SEVI + ρ + cos i had relief effect with fragmentized shadow in the cast shadow, while had an over-reflected effect in the self-shadow (Figure 3h,i). The spectral features of sample areas verified again that the ITC with the input SEVI was the best for the correction of topographic shadow in this study. Therefore, if when unspecified, ITC means the integrated topographic correction using the SCS + C correction with the SEVI in the following.

4.3. Applicability of the ITC

Using the normalized SEVI of the three scenes and the regressions trained from the sunny area in a scene of Path 119/Row 042, the shadows in RGB wavebands of the three scenes were corrected, and the corresponding NIR waveband reflectance was calculated. The three scenes and the corresponding clipped subareas of the ITC-corrected result showed a high performance in the removal of the topographic shadow, exhibiting a flat feature with the impressions of relief and topographic shadow removed (Figure 7).
Coupled with the 213 sets of samples in Path 119/Row 042, 255 sets of samples in Path 119/Row 041 and 98 sets of samples in Path 119/Row 043 were selected, respectively (Figure 1). Using these 566 sets of evaluation samples, the scatter plots of waveband reflectance vs. cos i showed that the self-shadow (black) was located where the cos i was less than 0.0, while the remaining types of samples were distributed in the area where the cos i ranged from 0.0 to 1.0, with the sequence of self-shadow (black) < cast shadow (blue) < sunny area (green) (Figure 8). The ITC-corrected reflectance of RGB and NIR in the shadow area was approximately similar to that in sunny area, the linear regression showed an inclination that nearly reached the horizontal, and the r2 decreased to 0.00~0.01. It was also found that the points were distributed in a concentrated way, evenly on both sides of the regression line (Figure 8c,f,i,l). However, before topographic correction, the surface reflectance of the shadows was lower than that of the sunny areas. Accordingly, the linear regression showed a steep inclination and a low intercept, with r2 more than 0.43 (Figure 8a,d,g,j). As for the SCS + C-corrected result, the reflectance of the self-shadow was rectified better than that of the cast shadow and was closer to that of the sunny area. The linear regression showed a medium inclination and intercept, with r2 ranging from 0.01 to 0.20 (Figure 8b,e,h,k).
The relative errors in reflectance of the shadow area vs. the sunny area are illustrated using a histogram in Figure 9. The absolute relative errors of the cast shadow and the self-shadow after the correction using the ITC all dramatically decreased to the range of 0.30%~6.37%. As a contrast, these relative errors were large before topographic correction, varying from 68.46% to 86.34%; meanwhile, the relative errors of the SCS + C-corrected values just decreased to the range of 16.38% to 57.97%.

4.4. Vegetation Mapping of Regional Cities

Considering the integrity of the city area, the regional cities of Fuzhou, Putian, and Xiamen were clipped from the Landsat images for regional vegetation mapping (Figure 10a,b). The regional mountainous vegetation exhibited a flat feature with the impressions of relief and topographic shadow removed after the correction using the ITC, which is better for regional vegetation detection and extraction. As a contrast, the corresponding surface reflectance image before topographic correction showed a strong topographic shadow effect of the mountainous vegetation, which can be easily mistaken for water. Using the RF classifier again, the vegetation of the three cities was extracted (Figure 10c,d). The averaged overall accuracy of the classification using the ITC-corrected images was 92.99%, and the corresponding averaged kappa coefficient was 0.83; while those using the surface reflectance images were 87.87% and 0.73, respectively. The regional vegetation coverage of the three cities was also calculated (Table 3). The results showed that the classified vegetation area of three cities was improved by about 15~493 km2 after topographic correction using the ITC, and the corresponding vegetation coverage was improved by about 0.92~6.14%. In addition, using the ITC-corrected data, the statistics of topographic factors showed that the regional vegetation coverage increased with the increase of elevation and slope. However, using the surface reflectance without topographic correction, the regional vegetation coverage decreased when the elevation and slope rose, e.g., the vegetation coverage of Putian (64.25%) was less than that of Xiamen (64.90%). Therefore, the ITC-corrected reflectance of frequently used RGB and NIR wavebands provides us a higher-performance image for regional mountainous vegetation mapping.

5. Discussion

5.1. Mountainous Vegetation

The removal of the topographic effect from multi-spectral images is significant for mapping regional mountainous vegetation, since the topographic effect decreases the extraction accuracy of mountainous vegetation. Due to the anisotropic solar illumination on rugged mountains, topographic effect results in the reflectance distortion of the frequently used wavebands, e.g., under-reflection in the self-shadow and the cast shadow, and over-reflection in the sunny area, which influences mountainous vegetation extraction and corresponding parameter retrieval. Specifically, it hinders the phenology study of the water, carbon, and energy fluxes of the mountainous vegetation [56,57,58], since surface illumination conditions change along with seasonal sun zenith angle [59]. Therefore, we developed the ITC to remove the cast shadow and the self-shadow of these frequently used RGB and NIR waveband reflectances, despite the different mechanisms of them. The cast shadow results from the external factor of obstruction by a higher mountain, while the self-shadow is from the mountain itself when the solar incidence angle is more than 90 degrees. After the correction using the ITC, the corrected image exhibited a flat feature with the impressions of relief and topographic shadow removed, which improves regional vegetation extraction accuracy, e.g., higher regional vegetation coverage values for Fuzhou, Putian, and Xiamen were achieved using the ITC-corrected image, despite the different percentages of mountainous vegetation in regional vegetation areas. In the next step, we are going to further study mountainous vegetation using the ITC-corrected multi-spectral images, e.g., vegetation cover classification and vegetation parameters’ estimation in regional mountainous areas.

5.2. Integration of the ITC

It is a highlight of the ITC to remove the topographic shadow, specifically the cast shadow, from a regional multi-spectral image of RGB and NIR wavebands, by integrating the advantages of a physically based model of the SCS + C correction and the spectral feature method of the SEVI. The BRDF-based SCS + C correction has a solid physical basis and simple operation. However, it faces difficulties in removing the cast shadow in rugged terrains and decreases the performance in elimination of the self-shadow for the large-area correction of rugged mountains, which are general defects of the DEM-based topographic correction methods, including the STS geometric correction method and the physically based correction model. On the contrary, the SEVI successfully removes topographic shadow, including the cast shadow and the self-shadow; however it loses spectral resolution and can achieve a grayscale image. This is also a general defect of the spectral feature method using the band ratio model. Therefore, our proposed ITC took advantages of the SCS + C correction and the SEVI using an RF machine learning algorithm. It trained the regressions between the SEVI and the SCS + C-corrected wavebands’ reflectance of the sunny area and successfully used them to correct the shadow area. The ITC shows a great potential in obtaining a large-area mountainous multi-spectral image with the removal of the topographic effect, specifically with the removal of the cast shadow. In this study, we also tested the integration of the surface reflectance and the cos i with the SCS + C corrected reflectance and the SEVI. However, the results showed their poor performance in the correction of topographic shadows, since the surface reflectance does not have a topographic correction feature, and the cos i is easily prone to over correct the topographic shadow [17]. The phenomena indicated that the correction performance depends more on data features than on data quantity and that integrating more routine data may not achieve higher corrected performance in the removal of topographic shadows. In the next step, we tried to develop new high-quality data to integrate into the ITC to further improve the topographic correction performance for regional mountainous images.

5.3. Transfer Ability

It is the second highlight of the ITC to transfer the regressions trained from the sunny area of a scene to correct the shadow area of three scenes. It usually consumes a great deal of time to prepare samples for data training and accuracy evaluation [60], so the transferability of the trained regressions becomes important to a method’s application. Considering the transferability, a machine learning technique, the RF Regressor, was used in the ITC. The ITC achieved an expected transferability from the sunny area samples of a scene to the topographic shadow correction of three scenes, due to the normalized SEVI of three scenes and the RF ability of little biased estimates or overfitting [46,47,48] though it is a traditional machine learning. In the next step, we aim to use other methods of machine learning and deep learning to improve the transferability of the ITC [43,61]. In addition, we hope to apply the ITC to the higher-spatial-resolution mountainous images of the SPOT-6 and 7, GF-2 and 1, ZY-3, and so on.

6. Conclusions

We fulfilled the objective to develop a new integrated topographic correction using the SCS + C correction and the SEVI to retrieve the frequently-used RGB and NIR wavebands’ reflectance for regional mountainous vegetation monitoring. The ITC introduced a random forest machine learning algorithm into the topographic correction field. It showed high performances in the removal of the topographic effect of the frequently used wavebands, specifically of the cast shadow, and in transferability from the sunny area of a scene to the shadow area of three scenes. Using the ITC-corrected reflectance, the calculated regional vegetation coverage was improved appropriately by 0.92~6.14% in three cities in Fujian Province, China. The ITC could be recommended for application in mountainous vegetation classification and vegetation parameter estimation in regional areas.

7. Patents

China national invention patent: A cast shadow correction method for visible spectral remote sensing images (granted number: 2021101469628; granted date: 19 April 2022).

Author Contributions

Conceptualization, H.J.; methodology, H.J. and Y.W.; software, Y.W., H.J. and A.C.; validation, H.J., A.C. and C.Z.; formal analysis, H.J., M.L. and Z.C.; investigation, H.J. and X.W.; data curation, H.J. and A.C.; writing—original draft preparation, H.J.; writing—review and editing, H.J., Z.C. and M.L.; visualization, H.J., A.C. and C.Z.; funding acquisition, H.J. and X.W. All authors have read and agreed to the published version of the manuscript.

Funding

This research was funded by the Science and Technology Plan Leading Project of Fujian Province, China, grant number 2021Y0005.

Data Availability Statement

Not applicable.

Acknowledgments

TThe authors thank the editors and anonymous reviewers for their constructive suggestions and valuable comments. We thank Yujie Li, Xin Yu, and Jing Lin for their valuable contributions.

Conflicts of Interest

The authors declare no conflict of interest.

References

  1. Bayle, A.; Carlson, B.; Thierion, V.; Isenmann, M.; Choler, P. Improved mapping of mountain shrublands using the Sentinel-2 red-edge band. Remote Sens. 2019, 11, 2807. [Google Scholar] [CrossRef] [Green Version]
  2. Buchner, J.; Yin, H.; Frantz, D.; Kuemmerle, T.; Askerov, E.; Bakuradze, T.; Bleyhl, B.; Elizbarashvili, N.; Komarova, A.; Lewińska, K.E.; et al. Land-cover change in the Caucasus Mountains since 1987 based on the topographic correction of multi-temporal Landsat composites. Remote Sens. Environ. 2020, 248, 111967. [Google Scholar] [CrossRef]
  3. Bian, J.; Li, A.; Lei, G.; Zhang, Z.; Nan, X. Global high-resolution mountain green cover index mapping based on Landsat images and Google Earth Engine. ISPRS J. Photogramm. Remote Sens. 2020, 162, 63–76. [Google Scholar] [CrossRef]
  4. Balthazar, V.; Vanacker, V.; Lambin, E.F. Evaluation and parameterization of ATCOR3 topographic correction method for forest cover mapping in mountain areas. Int. J. Appl. Earth Obs. Geoinf. 2012, 18, 436–450. [Google Scholar] [CrossRef]
  5. Huang, H.; Gong, P.; Clinton, N.; Hui, F. Reduction of atmospheric and topographic effect on Landsat TM data for forest classification. Int. J. Remote Sens. 2008, 29, 5623–5642. [Google Scholar] [CrossRef]
  6. Pimple, U.; Sitthi, A.; Simonetti, D.; Pungkul, S.; Leadprathom, K.; Chidthaisong, A. Topographic correction of Landsat TM-5 and Landsat OLI-8 imagery to improve the performance of forest classification in the mountainous terrain of northeast Thailand. Sustainability 2017, 9, 258. [Google Scholar] [CrossRef] [Green Version]
  7. Tan, B.; Masek, J.G.; Wolfe, R.; Gao, F.; Huang, C.; Vermote, E.F.; Sexton, J.O.; Ederer, G. Improved forest change detection with terrain illumination corrected Landsat images. Remote Sens. Environ. 2013, 136, 469–483. [Google Scholar] [CrossRef]
  8. Yang, G.; Pu, R.; Zhang, J.; Zhao, C.; Feng, H.; Wang, J. Remote sensing of seasonal variability of fractional vegetation cover and its object-based spatial pattern analysis over mountain areas. ISPRS J. Photogramm. Remote Sens. 2013, 77, 79–93. [Google Scholar] [CrossRef]
  9. Jin, H.; Li, A.; Xu, W.; Xiao, Z.; Jiang, J.; Xue, H. Evaluation of topographic effects on multiscale leaf area index estimation using remotely sensed observations from multiple sensors. ISPRS J. Photogramm. Remote Sens. 2019, 154, 176–188. [Google Scholar] [CrossRef]
  10. Melnikova, I.; Awaya, Y.; Saitoh, T.; Muraoka, H.; Sasai, T. Estimation of leaf area index in a mountain forest of central Japan with a 30-m spatial resolution based on landsat operational land imager imagery: An application of a simple model for seasonal monitoring. Remote Sens. 2018, 10, 179. [Google Scholar] [CrossRef] [Green Version]
  11. Bao, G.; Bao, Y.; Qin, Z.; Xin, X.; Bao, Y.; Bayarsaikan, S.; Zhou, Y.; Chuntai, B. Modeling net primary productivity of terrestrial ecosystems in the semi-arid climate of the Mongolian Plateau using LSWI-based CASA ecosystem model. Int. J. Appl. Earth Obs. Geoinf. 2016, 46, 84–93. [Google Scholar] [CrossRef]
  12. Giles, P.T. Remote sensing and cast shadows in mountainous terrain. Photogramm. Eng. Remote Sens. 2001, 67, 833–840. [Google Scholar]
  13. Li, H.; Xu, L.; Shen, H.; Zhang, L. A general variational framework considering cast shadows for the topographic correction of remote sensing imagery. ISPRS-J. Photogramm. Remote Sens. 2016, 117, 161–171. [Google Scholar] [CrossRef]
  14. Zhou, Y.; Chen, J.; Guo, Q.; Cao, R.; Zhu, X. Restoration of information obscured by mountainous shadows through Landsat TM/ETM+ images without the use of DEM data: A new method. IEEE Trans. Geosci. Remote Sens. 2014, 52, 313–328. [Google Scholar] [CrossRef]
  15. Civco, D.L. Topographic normalisation of Landsat Thematic Mapper digital imagery. Photogramm. Eng. Remote Sens. 1989, 55, 135–143. [Google Scholar]
  16. Meyer, P.; Itten, K.I.; Kellenberger, T.; Sandmeier, S.; Sandmeier, R. Radiometric corrections of topographically induced effects on Landsat TM data in an alpine environment. ISPRS J. Photogramm. Remote Sens. 1993, 48, 17–28. [Google Scholar] [CrossRef]
  17. Teillet, P.M.; Guindon, B.; Goodenough, D.G. On the slope-aspect correction of multispectral scanner data. Can. J. Remote Sens. 1982, 8, 84–106. [Google Scholar] [CrossRef] [Green Version]
  18. Lin, Q.; Huang, H.; Chen, L.; Chen, E. Topographic correction method for steep mountain terrain images. J. Remote Sens. 2017, 21, 776–784. [Google Scholar]
  19. Li, A.; Wang, Q.; Bian, J.; Lei, G. An improved physics-based model for topographic correction of Landsat TM images. Remote Sens. 2015, 7, 6296–6319. [Google Scholar] [CrossRef] [Green Version]
  20. Li, F.; Jupp, D.L.B.; Thankappan, M.; Lymburner, L.; Mueller, N.; Lewis, A.; Held, A. A physics-based atmospheric and BRDF correction for Landsat data over mountainous terrain. Remote Sens. Environ. 2012, 124, 756–770. [Google Scholar] [CrossRef]
  21. Schaaf, C.B.; Li, X.; Strahler, A.H. Topographic effects on bidirectional and hemispherical reflectances calculated with a geometric-optical canopy model. IEEE Trans. Geosci. Remote Sens. 1994, 32, 1186–1193. [Google Scholar] [CrossRef]
  22. Smith, J.A.; Lin, T.L.; Ranson, K.J. The Lambertian assumption and Landsat data. Photogramm. Eng. Remote Sens. 1980, 46, 1183–1189. [Google Scholar]
  23. Gu, D.; Gillespie, A. Topographic normalization of Landsat TM images of forest based on subpixel Sun-Canopy-Sensor geometry. Remote Sens. Environ. 1998, 64, 166–175. [Google Scholar] [CrossRef]
  24. Riano, D.; Chuvieco, E.; Salas, J.; Aguado, I. Assessment of different topographic corrections in Landsat-TM data for mapping vegetation types. IEEE Trans. Geosci. Remote Sens. 2003, 41, 1056–1061. [Google Scholar] [CrossRef] [Green Version]
  25. Soenen, S.A.; Peddle, D.R.; Coburn, C.A. SCS+C: A modified sun-canopy-sensor topographic correction in forested terrain. IEEE Trans. Geosci. Remote Sens. 2005, 43, 2148–2159. [Google Scholar] [CrossRef]
  26. Kane, V.; Gillespie, A.; McGaughey, R.; Lutz, J.; Ceder, K.; Franklin, J. Interpretation and topographic compensation of conifer canopy self-shadowing. Remote Sens. Environ. 2008, 112, 3820–3832. [Google Scholar] [CrossRef]
  27. Rudolf, R.; Tobias, K.; Hermann, K. Comparison of topographic correction methods. Remote Sens. 2009, 1, 184–196. [Google Scholar]
  28. Sandmeier, S.; Itten, K.I. A physically-based model to correct atmospheric and illumination effects in optical satellite data of rugged terrain. IEEE Trans. Geosci. Remote Sens. 1997, 35, 708–717. [Google Scholar] [CrossRef] [Green Version]
  29. Santini, F.; Palombo, A. Physically based approach for combined atmospheric and topographic corrections. Remote Sens. 2019, 11, 1218. [Google Scholar] [CrossRef] [Green Version]
  30. Wen, J.; Liu, Q.; Tang, Y.; Dou, B.; You, D.; Xiao, Q.; Liu, Q.; Li, X. Modeling land surface reflectance coupled BRDF for HJ-1/CCD data of rugged terrain in Heihe river basin, China. IEEE J. Sel. Top. Appl. Earth Observ. Remote Sens. 2015, 8, 1506–1518. [Google Scholar] [CrossRef]
  31. Yin, G.; Li, A.; Wu, S.; Fan, W.; Zeng, Y.; Yan, K.; Xu, B.; Li, J.; Liu, Q. PLC: A simple and semi-physical topographic correction method for vegetation canopies based on path length correction. Remote Sens. Environ. 2018, 215, 184–198. [Google Scholar] [CrossRef]
  32. Chen, J.; Leblanc, S. A four-scale bidirectional reflectance model based on canopy architecture. IEEE Trans. Geosci. Remote Sens. 1997, 35, 1316–1337. [Google Scholar] [CrossRef]
  33. Fan, W.; Li, J.; Liu, Q.; Zhang, Q.; Yin, G.; Li, A.; Zeng, Y.; Xu, B.; Xu, X.; Zhou, G.; et al. Topographic correction of forest image data based on the canopy reflectance model for sloping terrains in multiple forward mode. Remote Sens. 2018, 10, 717. [Google Scholar] [CrossRef] [Green Version]
  34. Couturier, S.; Gastellu-Etchegorry, J.-P.; Martin, E.; Patino, P. Building a forward-mode three-dimensional reflectance model for topographic normalization of high-resolution (1–5 m) imagery: Validation phase in a forested environment. IEEE Trans. Geosci. Remote Sens. 2013, 51, 3910–3921. [Google Scholar] [CrossRef]
  35. Soenen, S.A.; Peddle, D.R.; Coburn, C.A.; Hall, R.J.; Hall, F.G. Improved topographic correction of forest image data using a 3-D canopy reflectance model in multiple forward mode. Int. J. Remote Sens. 2008, 29, 1007–1027. [Google Scholar] [CrossRef]
  36. Quan, X.; He, B.; Li, X. A Bayesian network-based method to alleviate the ill-posed inverse problem: A case study on leaf area index and canopy water content retrieval. IEEE Trans. Geosci. Remote Sens. 2015, 53, 6507–6517. [Google Scholar] [CrossRef]
  37. Colby, J.D.; Keating, P.L. Land cover classification using Landsat TM imagery in the tropical highlands: The influence of anisotropic reflectance. Int. J. Remote Sens. 1998, 19, 1479–1500. [Google Scholar] [CrossRef]
  38. Liao, Z.; He, B.; Quan, X. Modified enhanced vegetation index for reducing topographic effects. J. Appl. Remote Sens. 2015, 9, 096068. [Google Scholar] [CrossRef]
  39. Jiang, H.; Wang, S.; Cao, X.; Yang, C.; Zhang, Z.; Wang, X. A shadow- eliminated vegetation index (SEVI) for removal of self and cast shadow effects on vegetation in rugged terrains. Int. J. Digit. Earth. 2019, 12, 1013–1029. [Google Scholar] [CrossRef] [Green Version]
  40. Jiang, H.; Yao, M.; Guo, J.; Zhang, Z.; Wu, W.; Mao, Z. Vegetation monitoring of protected areas in rugged mountains using an improved Shadow-Eliminated Vegetation Index (SEVI). Remote Sens. 2022, 14, 882. [Google Scholar] [CrossRef]
  41. Bishop, M.P.; Young, B.W.; Colby, J.D.; Furfaro, R.; Schiassi, E.; Chi, Z. Theoretical evaluation of anisotropic reflectance correction approaches for addressing multi-scale topographic effects on the radiation-transfer cascade in mountain environments. Remote Sens. 2019, 11, 2728. [Google Scholar] [CrossRef] [Green Version]
  42. Sola, I.; González-Audícana, M.; Álvarez-Mozos, J. Multi-criteria evaluation of topographic correction methods. Remote Sens. Environ. 2016, 184, 247–262. [Google Scholar] [CrossRef] [Green Version]
  43. Baez-Villanueva, O.M.; Zambrano-Bigiarini, M.; Beck, H.E.; McNamara, I.; Ribbe, L.; Nauditt, A.; Birkel, C.; Verbist, K.; Giraldo-Osorio, J.D.; Thinh, N.X. RF-MEP: A novel Random Forest method for merging gridded precipitation products and ground-based measurements. Remote Sens. Environ. 2020, 239, 111606. [Google Scholar] [CrossRef]
  44. Breiman, L. Random Forests. Mach. Learn. 2001, 45, 5–32. [Google Scholar] [CrossRef] [Green Version]
  45. Prasad, A.M.; Iverson, L.R.; Liaw, A. Newer classification and regression tree techniques: Bagging and random forests for ecological prediction. Ecosystems 2006, 9, 181–199. [Google Scholar] [CrossRef]
  46. Biau, G.; Scornet, E. Rejoinder on: A random forest guided tour. Test 2016, 25, 264–268. [Google Scholar] [CrossRef] [Green Version]
  47. Diaz-Uriarte, R.; Alvarez de Andres, S. Gene selection and classification of microarray data using random forest. BMC Bioinform. 2006, 7, 3. [Google Scholar] [CrossRef] [Green Version]
  48. Hengl, T.; Nussbaum, M.; Wright, M.N.; Heuvelink, G.; Grler, B. Random Forest as a generic framework for predictive modeling of spatial and spatio-temporal variables. PeerJ 2018, 6, e5518. [Google Scholar] [CrossRef] [Green Version]
  49. Mutanga, O.; Adam, E.; Cho, M.A. High density biomass estimation for wetland vegetation using WorldView-2 imagery and random forest regression algorithm. Int. J. Appl. Earth Obs. Geoinf. 2012, 18, 399–406. [Google Scholar] [CrossRef]
  50. Phan, P.; Chen, N.; Xu, L.; Chen, Z. Using multi-temporal MODIS NDVI Data to monitor tea status and forecast yield: A case study at Tanuyen, Laichau, Vietnam. Remote Sens. 2020, 12, 1814. [Google Scholar] [CrossRef]
  51. Wang, L.; Zhou, X.; Zhu, X.; Dong, Z.; Guo, W. Estimation of biomass in wheat using random forest regression algorithm and remote sensing data. Crop J. 2016, 4, 212–219. [Google Scholar] [CrossRef] [Green Version]
  52. Proy, C.; Tanré, D.; Deschamps, P.Y. Evaluation of topographic effects in remotely sensed data. Remote Sens. Environ. 1989, 30, 21–32. [Google Scholar] [CrossRef]
  53. McFEETERS, S.K. The use of the Normalized Difference Water Index (NDWI) in the delineation of open water features. Int. J. Remote Sens. 1996, 17, 1425–1432. [Google Scholar] [CrossRef]
  54. Baumann, K. Cross-validation as the objective function for variable-selection techniques. TrAC Trends Anal. Chem. 2003, 22, 395–406. [Google Scholar] [CrossRef]
  55. Tobler, W.R. A computer movie simulating urban growth in the detroit region. Econ. Geogr. 1970, 46, 234–240. [Google Scholar] [CrossRef]
  56. Keenan, T.F.; Darby, B.; Felts, E.; Sonnentag, Q.; Friedl, M.A.; Hufkens, K.; O’Keefe, J.; Klosterman, S.; Munger, J.W.; Toomey, M.; et al. Tracking forest phenology and seasonal physiology using digital repeat photography: A critical assessment. Ecol. Appl. 2014, 24, 1478–1489. [Google Scholar] [CrossRef] [Green Version]
  57. Moon, M.; Li, D.; Liao, W.; Rigden, A.J.; Friedl, M.A. Modification of surface energy balance during springtime: The relative importance of biophysical and meteorological changes. Agric. For. Meteorol. 2020, 284, 107905. [Google Scholar] [CrossRef]
  58. Richardson, A.D.; Keenan, T.F.; Migliavacca, M.; Ryu, Y.; Sonnentag, O.; Toomey, M. Climate change, phenology, and phenological control of vegetation feedbacks to the climate system. Agric. For. Meteorol. 2013, 169, 156–173. [Google Scholar] [CrossRef]
  59. Hantson, S.; Chuvieco, E. Evaluation of different topographic correction methods for Landsat imagery. Int. J. Appl. Earth Obs. Geoinf. 2011, 13, 691–700. [Google Scholar] [CrossRef]
  60. Saboori, M.; Homayouni, S.; Shah-Hosseini, R.; Zhang, Y. Optimum feature and classifier selection for accurate urban land use/cover mapping from very high resolution satellite imagery. Remote Sens. 2022, 14, 2097. [Google Scholar] [CrossRef]
  61. Kattenborn, T.; Leitloff, J.; Schiefer, F.; Hinz, S. Review on Convolutional Neural Networks (CNN) in vegetation remote sensing. ISPRS J. Photogramm. Remote Sens. 2021, 173, 24–49. [Google Scholar] [CrossRef]
Figure 1. Study area location and images: Landsat 8 Operational Land Imager (OLI) acquired on 11 December 2019 (near infrared–red–green (NRG) composite), subareas (white rectangles, S1–S3 are rugged areas located in the scenes of 119/041, 119/042, and 119/043, respectively), sample areas (green points), and samples (yellow points).
Remotesensing 14 03073 g001
Figure 2. Flow chart of a new integrated topographic correction (ITC) using the SCS + C correction and the shadow-eliminated vegetation index (SEVI): ① atmospheric correction, ② topographic shadow extraction, ③ calculation of the cosine of the solar incidence angle (cos i) and SCS + C correction, ④ SEVI calculation, ⑤ data training, ⑥ accuracy test, ⑦ applicability test, and ⑧ vegetation mapping. The ρb, ρg, ρr, and ρnir are the waveband reflectances of blue, green, red, and near-infrared.
Remotesensing 14 03073 g002
Figure 3. Sample areas of different processed images (NRG composite), cos i, and SEVI: (a) surface reflectance (ρ), (b) SCS + C-corrected reflectance (SCS + C), (c) ITC-corrected reflectance with input of SEVI (+S), (d) input of ρ (+ρ), (e) input of cos i (+c), (f) inputs of SEVI + ρ (+Sρ), (g) inputs of SEVI + cos i (+Sc), (h) inputs of ρ + cos i (+ρc), (i) inputs of SEVI + ρ + cos i (+Sρc), (j) cos i, and (k) SEVI.
Remotesensing 14 03073 g003
Figure 4. Box plot of the corrected red–green–blue (RGB) waveband reflectance: (a) ρ, (b) SCS + C, and (c) +S.
Remotesensing 14 03073 g004
Figure 5. Box plot of the corrected near-infrared (NIR) waveband reflectance: (a) ρ, (b) SCS + C, and (c) +S.
Remotesensing 14 03073 g005
Figure 6. The training accuracy (a,b) and the forecasting accuracy (cf) of the RGB and NIR wavebands: (a) coefficient of determination (r2) of training accuracy, (b) root mean squared error (RMSE) of training accuracy, (c) r2 of waveband reflectance vs. cos i, (d) RMSE of waveband reflectance vs. cos i, (e) reflectance relative error between the self-shadow and the sunny area (REself), and (f) reflectance relative error between the cast shadow and the sunny area (REcast). S, ρ, and c represent the ITC with input of SEVI, surface reflectance, and cos i, respectively.
Remotesensing 14 03073 g006
Figure 7. Images of three scenes and the corresponding clipped subareas (NRG composite).
Remotesensing 14 03073 g007
Figure 8. Scatter plots of waveband reflectance vs. cos i: (a) surface reflectance of blue band vs. cos i, (b) SCS+C corrected reflectance of blue band vs. cos i, (c) ITC corrected reflectance of blue band vs. cos i, (d) surface reflectance of green band vs. cos i, (e) SCS+C corrected reflectance of green band vs. cos i, (f) ITC corrected reflectance of green band vs. cos i, (g) surface reflectance of red band vs. cos i, (h) SCS+C corrected reflectance of red band vs. cos i, (i) ITC corrected reflectance of red band vs. cos i, (j) surface reflectance of NIR band vs. cos i, (k) SCS+C corrected reflectance of NIR band vs. cos i, (l) ITC corrected reflectance of NIR band vs. cos i. The red dashed line is linear regression of band reflectance vs. cos i.
Remotesensing 14 03073 g008
Figure 9. Histogram of absolute relative error for waveband reflectance of shadow area vs. that of sunny area.
Remotesensing 14 03073 g009
Figure 10. Image of regional cities (NRG composite) and vegetation extraction. (a) ITC corrected reflectance, (b) Surface reflectance, (c) Vegetation extraction using ITC corrected reflectance, (d) Vegetation extraction using surface reflectance.
Remotesensing 14 03073 g010
Table 1. Path/row, sun elevation, and azimuth of the Landsat 8 OLI and corresponding elevation and slope of study area. Mele is mean of elevation, Stdele is standard deviation of elevation.
Scene
(Path/Row)
Sun Elevation (°)Sun Azimuth (°)Elevation (m)Mele (m)Stdelev (m)Slope (°)Mslope (°)Stdslope (°)
119/04135.76156.270~19216023230~722011
119/04236.98155.560~18284533170~721710
119/04338.19154.830~14852472780~691210
Table 2. Seven inputs of independent variable(s).
Independent Variable (s)abc
SingleSEVIρcos i
DoubleSEVI, ρSEVI, cos iρ, cos i
TripleSEVI, ρ, cos i//
Table 3. Area of classified vegetation, water, and other land covers of three cities using surface reflectance and the ITC-corrected reflectance, and corresponding regional vegetation coverage (RVC), elevation mean, and slope mean. The OA is overall accuracy.
CityDataVegetation (km2)Water (km2)Others (km2)OA (%)KappaRVC (%)Elevation Mean (m)Slope Mean (°)
Fuzhou *ρ8353.18592.092447.3289.760.7673.32172.8916.25
ITC8846.10340.142206.3396.250.9077.65
Putianρ2512.35153.911244.1286.840.7164.25121.4613.62
ITC2752.61112.451045.3192.540.8270.39
Xiamenρ1024.7861.99492.3487.000.7264.9087.9510.58
ITC1039.4247.87491.8190.190.7865.82
* The cloud in Fuzhou city decreased the RVC.
Publisher’s Note: MDPI stays neutral with regard to jurisdictional claims in published maps and institutional affiliations.

