Article

Carbon Sink under Different Carbon Density Levels of Forest and Shrub, a Case in Dongting Lake Basin, China

1
State Key Laboratory of Urban and Regional Ecology, Research Center for Eco-Environmental Sciences, Chinese Academy of Sciences, Beijing 100085, China
2
School of Geography and Resource Sciences, Sichuan Normal University, Chengdu 610101, China
3
College of Resources and Environment, University of Chinese Academy of Sciences, Beijing 100049, China
*
Author to whom correspondence should be addressed.
Remote Sens. 2022, 14(11), 2672; https://doi.org/10.3390/rs14112672
Submission received: 14 April 2022 / Revised: 28 May 2022 / Accepted: 30 May 2022 / Published: 2 June 2022

Abstract

:
Terrestrial ecosystems play a critical role in the global carbon cycle and climate change mitigation. Studying the temporal and spatial dynamics of carbon sink and the driving mechanisms at the regional scale provides an important basis for ecological restoration and ecosystem management. Taking the Dongting Lake Basin as an example, we assessed the carbon sinks of forest and shrub from 2000 to 2020 based on the maps of biomass that were obtained by remote sensing, and analyzed the dynamics of carbon sinks that were contributed by different biomass carbon density levels of constant forest and shrub and new afforestation over the past two decades. The results showed that the carbon sink of forest and shrub in the Dongting Lake Basin grew rapidly from 2000 to 2020: carbon sink increased from 64.64 TgC between 2000 and 2010, to 382.56 TgC between 2010 and 2020. The continuous improvement of biomass carbon density has made a major contribution to carbon sink, especially the carbon density increase in low carbon density forests and shrubs. Carbon-dense forests and shrubs realized their contribution to carbon sink in the second decade after displaying negative carbon sink in the first decade. Carbon sink from new afforestation increased 61.16% from the first decade to the second decade, but the contribution proportion decreased. The overall low carbon density of forest and shrub in the Dongting Lake Basin and their carbon sink dynamics indicated their huge carbon sequestration potential in the future. In addition to continuously implementing forest protection and restoration projects to promote afforestation, the improvement of ecosystem quality should be paid more attention in ecosystem management for areas like Dongting Lake Basin, where ecosystems, though severely degraded, are important and fragile, to realize their huge carbon sequestration potential.

Graphical Abstract

1. Introduction

Long-term population growth, urbanization and resource utilization have led to ecosystem degradation, C loss and climate change around the world. Terrestrial ecosystems play a critical role in the global C cycle and climate change mitigation. [1] In particular, the forest, which is the largest part of terrestrial ecosystems, stores over 80% of terrestrial vegetation carbon and plays a dominant role in the global C cycle [2,3]. The Kyoto Protocol which was approved in the 1997 United Nations (UN) meeting on climate change clearly suggested increasing C sequestration through reforestation and afforestation to meet green-house gas emission targets [4]. Assessment of the temporal and spatial changes in C sinks/sources of forests as well as their driving forces are critical to estimating the regional C budget, and it can help to constitute sustainable forest management policies for climate change [5,6,7,8,9,10,11,12,13].
China’s terrestrial ecosystems have functioned as important carbon sinks [14,15]. Located in the eastern margin of Eurasia, China ranks the fifth in its forest area in the world [16] and encompasses various forest biomes [17], providing a unique area to study the regional forest C cycle [13]. With the implementation of national afforestation and reforestation programs since the late 1970s, such as the Grain for Green Program (GGP), the Natural Forest Conservation Program and the Three-north Protective Forest Program [18], forest ecosystems in China are thought to have significantly contributed to the regional and global C sinks in the past several decades [1,13,19,20,21]. Previous studies have also suggested that the increased C stock in Asian terrestrial ecosystems can primarily be attributed to considerable afforestation and reforestation [7], especially that which was implemented under China‘s national ecological restoration projects [22,23,24]. In the year 2020, China pledged to strive to peak CO2 emissions by 2030 and achieve carbon neutrality by 2060. Estimating broad-scale carbon sink and revealing the mechanisms that control forest carbon sinks are important for future policy making in China [13,25].
Previous studies have pointed out that China’s forests are characterized by young age—implying a high potential for increasing C sinks in the future [25,26] and a good understanding of the dynamics of carbon dioxide (CO2) sequestered by forest biomass is crucial [7]. Existing studies have analyzed the dynamics of China’s forests and their biomass and carbon sinks, reflecting the overall changes in the country from the 1970s to the 2000s [2,6,13,27,28]. Several studies pointed to the importance of changes in forest area in China over the last century for carbon sequestration growth and estimated the overall changes in forest area of the whole of China to characterize deforestation and reforestation/afforestation [6,27]. They concluded that China had experienced a pronounced increase in forest area and density. In addition, assessment of the relative contributions of the driving factors to carbon sinks is crucial to reveal the mechanisms that control forest carbon sinks [25]. Previous studies showed that the increase in C sequestration was attributable to the increase in forest area and growing stock density [27]. They also estimated the relative contributions of changing forest area and forest C density to the forest biomass C sink in China, Japan, and South Korea [7,25]. They found that the relative contributions of the changing factors varied among countries and forest origin [7]. However, these studies were mostly carried out at national or provincial scale by forest inventory data, or statistics for different zonal forest groups. The use of remote sensing can quantitatively obtain the aboveground biomass and forest distribution at the pixel scale of large spatial and temporal ranges, which has advantages for analyzing the temporal and spatial differences in biomass carbon density, forest area and carbon sinks, as well as the dynamics of the relative contributions of changing forest area and carbon density to carbon sinks in regional assessments [29,30,31,32,33].
Temperate forests hold ~20% of the world’s plant biomass and ~10% of terrestrial carbon [34]. In China, forest in the south accounts for more than 65% of the carbon sink [28], and subtropical forests play a key role in carbon budget [35]. The Dongting Lake Basin is the largest lake basin in China and a typical area of subtropical evergreen broadleaf forests in the mid-lower reaches of the Yangtze River Basin [35,36]. As a typical southern red soil area of China, the Dongting Lake Basin has great hydrothermal conditions and high vegetation coverage [35,37]. Forest and shrub are the predominant ecosystem types there, which provides a large quantity of carbon storage, and also plays a significant role in providing important flood mitigation, water retention, soil retention and water purification services of the Yangtze River Basin [38,39]. It is also an important agricultural production area and an ecologically fragile area [37,40]. In the past century, forest and shrub in the Dongting Lake Basin have undergone severe logging and reclamation, leading to serious carbon losses [37]. Since 2000, large scale forest protection and restoration projects such as the GGP and Natural Forest Conservation Program have been implemented in the Dongting Lake basin [35,40,41]. The study of forest carbon sink, its long-term dynamics and its driving mechanisms are of great significance for improving ecological protection and restoration and ecosystem management policies in the Dongting Lake Basin, which can also provide reference for other areas of the world with degraded, but ecologically important and fragile ecosystems.
In this study, we assessed the dynamics of the biomass carbon density and carbon sink of the forest and shrub in the Dongting Lake Basin from the year 2000 to 2020 based on ecosystem and biomass maps that were obtained by remote sensing, and analyzed changing trends in carbon sinks that were contributed by different carbon density levels and new afforestation, in order to provide a basis for the future forest ecological restoration and ecosystem management in areas of the world with degraded, but ecologically important and fragile ecosystems.

2. Materials and Methods

2.1. Study Area

The Dongting Lake Basin is one of the important sub-basins in the middle reaches of the Yangtze River Basin, with a total area of about 260,000 km2. It includes plains, hills and mountains, and covers parts of seven provinces of China, including almost all of Hunan, and parts of Hubei, Jiangxi, Guangdong, Guangxi, Guizhou and Chongqing [40]. It is a typical southern red soil area of China and has a sub-tropical monsoon climate with an average annual precipitation of 1200–1400 mm, and an annual mean temperature of about 16–19 [37,42]. Such good hydrothermal conditions create diverse ecosystems and high vegetation coverage (Figure 1 and Figure 2). The forest, shrub and cropland have the largest area, accounting for 88.95% of the total area. Forests and shrubs are the most widely distributed vegetation types, accounting for 59.6% of the total area, mainly composed of evergreen broad-leaved forest, evergreen coniferous forest, deciduous broad-leaved forest and mixed coniferous and broad-leaved forest, and they are the major providers of a large quantity of carbon sequestration. In addition, Dongting Lake Basin plays an important role in providing the vital ecosystem services (such as flood mitigation, water retention, soil retention and water purification) of the Yangtze River Basin and is also an important agricultural production area [38,39,43]. Due to severe logging and reclamation in the last century, the ecosystem in the Dongting Lake Basin has been severely degraded [40]. Since 2000, the projects of GGP and Natural Forest Conservation Program have been carried out in the Dongting Lake basin to protect and restore the ecosystems [35,40].

2.2. Data Sources

2.2.1. Spatial Data of Ecosystems

Ecosystem classification data of the years 2000, 2010 and 2020 from the China Ecosystem Assessment Project (2000-2010-2020) [22,44] were used to determine the spatial ranges of forest and shrub. The data classified the ecosystems of the Dongting Lake Basin into 7 categories (forest, shrub, grassland, wetland, cropland, urban land and others) according to the reported land-cover classification [45], with a spatial resolution of 30 m × 30 m. With the support of a land cover reference database consisting of a large number of field survey sample points, the object-oriented multi-scale segmentation and decision tree classification method were adopted to derive the national land cover dataset from the Chinese Huan-Jing-1 satellite constellation (HJ-1A/B) and the US Landsat (Land-sat OLI) data. In addition, independent data accuracy verification was carried out on the field survey sample points that were obtained by a random sampling method to ensure the objectivity and reliability of the accuracy assessment. The number of sample points involved in the provinces covered by the Dongting Lake Basin are: 4704 in Hunan, 3638 in Hubei, 2899 in Guizhou, 12687 in Guangxi, 5703 in Jiangxi, and 1276 in Chongqing. The average classification accuracy reached 94.41%, and the classification accuracy of Hunan, Hubei, Guizhou, Guangxi, Jiangxi and Chongqing reached 92.71%, 93.43%, 95.83%, 94.75%, 96.88% and 92.87%, respectively.

2.2.2. Spatial Data of Aboveground Biomass

The aboveground biomass here represents the total amount of vegetation organic matter living above the ground in a unit area. It can be used to determine the total biomass of the vegetation community, which is an important indicator to measure the vegetation ecosystem. The aboveground biomass data of forest and shrub in the years 2000, 2010 and 2020 (Figure 3) were from the China Ecosystem Assessment Project (2000-2010-2020) [22]. It was produced by the Aerospace Information Research Institute, Chinese Academy of Sciences, using the aboveground biomass estimation model of the national vegetation sub-category type [33], with a spatial resolution of 250 m × 250 m. The data were verified by 5093 sample plots of a field survey, with an average accuracy of 75%. The specific methods and processes of aboveground biomass monitoring, estimation and verification refer to the reference [33].

2.3. Methods

2.3.1. Carbon Sink

The biomass of forests and shrubs consists of aboveground and belowground parts. Aboveground biomass is derived from remote sensing data (Section 2.2.2). The belowground biomass of different types of forests and shrubs is obtained by multiplying the aboveground biomass by the ratio of belowground biomass to aboveground biomass (Table 1) [46]. The calculation method of the total biomass density (biomass per unit area) is as follows:
T B D i j m = A B D i j m × 1 + R i  
where T B D i j m is the biomass density of ecosystem I in pixel j in year m. A B D i j m is the aboveground biomass density of ecosystem I in pixel j in year m. R i is the ratio of the belowground biomass to the aboveground biomass of ecosystem i.
The total biomass of the ecosystem can be calculated as follows:
T B m = i = 1 n j = 1 l T B D i j m × A R j  
where T B m is the total biomass of the ecosystem in year m. A R j is the area of pixel j.
Carbon sink refers to the carbon that is sequestrated by terrestrial ecosystems, thereby slowing down the current rate of increase in atmospheric CO2 [28], while storage refers to the carbon remaining in terrestrial ecosystems, possibly over the long term [47,48]. Carbon storage represents not only the result of carbon sequestration [48], but also indicates the importance of restoration or the avoidance of deforestation [49]. We examined the dynamics of biomass carbon storage in Dongting Lake Basin’s forest and shrub ecosystems, and estimated the carbon sinks from the year 2000 to the year 2010 and from the year 2010 to the year 2020. The biomass carbon storage of forest and shrub was obtained with the following formula:
B C S i m = j = 1 n B C D i j m × A R j  
where B C S i m is the biomass carbon storage of ecosystem I in year m, and B C D i j m is the biomass carbon density of ecosystem I in pixel j in year m. Ecosystem I could be forest and shrub, and year m could be 2000, 2010 or 2020. The unit of B C D i j m is t C/ha. A R j is the area of pixel j. The B C D i j m is derived with the following formula:
B C D i j m = T B D i j m × C C i  
where T B D i j m (in t/ha) is the biomass density of ecosystem I in pixel j in year m. C C i is the carbon content in the biomass of ecosystem I, which is 0.5 for forest and shrub [50].
Based on an estimation of total biomass carbon storage of forest and shrub in the years 2000, 2010 and 2020, the carbon sink of forest and shrub was estimated with the following formula:
C S 2000 2010 = B C S i 2010 B C S i 2000  
C S 2010 2020 = B C S i 2020 B C S i 2010
C S 2000 2020 = B C S i 2020 B C S i 2000
where C S 2000 2010 , C S 2010 2020 and C S 2000 2020 (in t C/yr) are the quantities of the carbon sink of forest and shrub from the year 2000 to 2010, from the year 2010 to 2020 and from the year 2000 to 2020.

2.3.2. Biomass Carbon Density Levels

In order to analyze the overall status and changing trend of carbon density levels, we divided the vegetation biomass carbon density into different levels according to the relative biomass carbon density. The calculation method is as follows:
R B C D i j m = B C D i j m C C B i × 100 %  
where R B C D i j m is the relative biomass carbon density of ecosystem I in pixel j in year m. B C D i j m is the biomass carbon density of ecosystem I in pixel j in year m, and C C B i is the biomass carbon density in the top community of the ecosystem I obtained by the field survey.
According to the relative biomass carbon density, the biomass carbon density in each pixel of forest and shrub can be classified into five levels: highest, high, medium, low and lowest. The specific classification rules are shown in Table 2 [51,52].
In order to understand the spatial pattern and dynamics of forest and shrub’s biomass carbon density levels in the Dongting Lake Basin, we mapped the biomass carbon density levels of the year 2000, 2010 and 2020 and calculated the area of each level in each year. We also analyzed the change of the area in each biomass carbon density level from the year 2000 to 2010 and from the year 2010 to 2020, as well as the transition area between different levels in the two periods.

2.3.3. Carbon Sinks from Different Carbon Density Levels of the Constant Forest and Shrub

We calculated the total carbon sink and carbon sink per unit area at each initial biomass carbon density level to analyze the quantity and efficiency of carbon sink at different carbon densities over 20 years. In this part, we only analyzed the pixels that were constant forest or shrub from the year 2000 to 2020. We used the biomass carbon density of the year 2000 as the initial carbon density. We analyzed the change in carbon sink as a function of the initial carbon density in each period (2000–2010, 2010–2020, and 2000–2020) and the trends of carbon sinks at different carbon densities over time.

2.3.4. Carbon Sink from New Afforestation

In addition to changes in biomass carbon density of the constant forest and shrub, new afforestation is also an important factor in increasing carbon sink. In this section, we focus on areas that were converted from other ecosystem types to forest or shrub, and areas where forest and shrub have been altered from the year 2000 to 2020. The calculation method of carbon sink by new afforestation is expressed by the formula as follows:
C S A = C S F S I + C S F S D  
where C S A is the carbon sink that was contributed by new afforestation. C S F S I is the carbon sink that was caused by the increase in forest and shrub, and C S F S D is the carbon sink that was caused by the reduction in forest and shrub. They can be calculated by the formulas of 2.3.1., and the carbon storage for land cover types other than forest and shrub are set to zero in the calculations. We calculated the carbon sink from new afforestation from the year 2000 to 2010 and from the year 2010 to 2020.
We also calculated the contribution proportion of new afforestation to carbon sink from the year 2000 to 2010 and from the year 2010 to 2020. The calculation method is as follows:
C R A = C S A C S × 100 %  
where C R A is the contribution proportion of new afforestation to carbon sink in a certain period. C S is the total carbon sink of forest and shrub in the period. We compared the contributions and contribution proportions of new afforestation to carbon sinks in different periods and analyzed the changing trend of the contribution of new afforestation to carbon sink in the past two decades.

3. Results

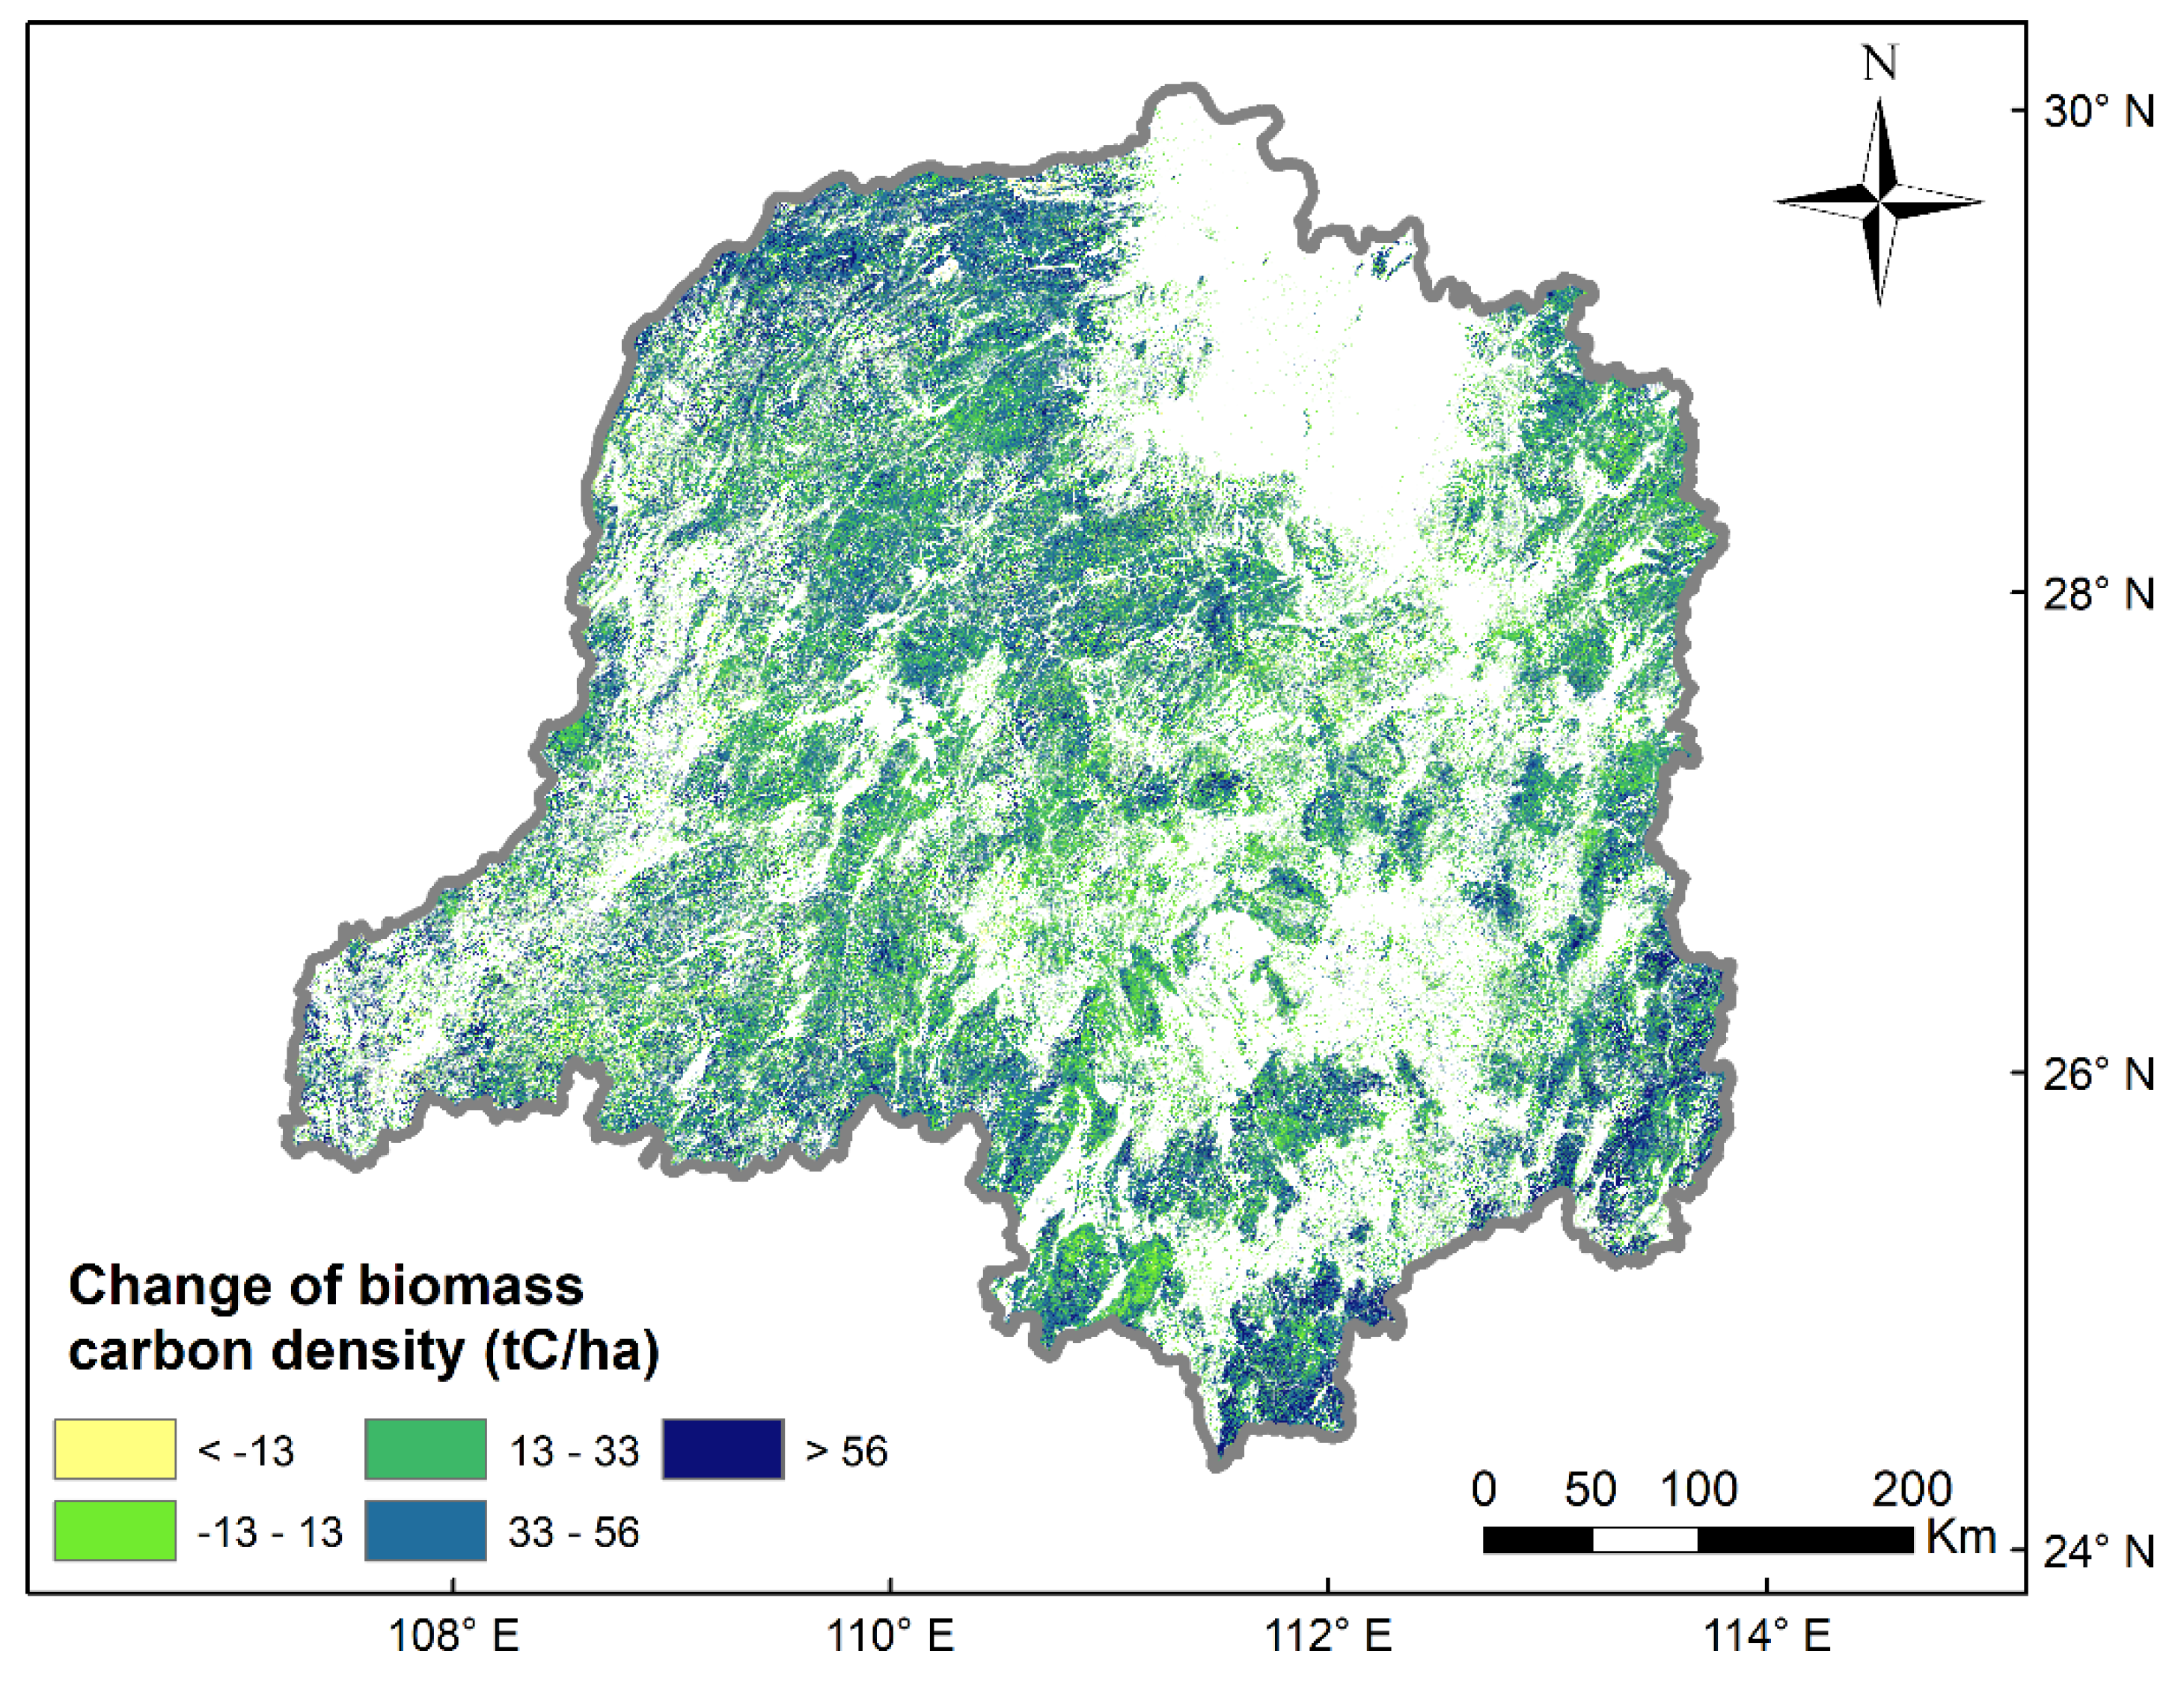
3.1. Biomass Carbon Density of Forest and Shrub

From the year 2000 to 2020, the biomass of forest and shrub in the Dongting Lake Basin increased significantly (Figure 3, Table 3). From the year 2000 to 2010, the quantity of biomass of forest and shrub increased by 18.68%. From the year 2010 to 2020, it achieved further growth at a higher rate of 94.17%. The biomass density of forest and shrub also increased significantly, increasing by 18.49% from 2000 to 2010 and by 90.04% from 2010 to 2020.
The biomass carbon density of forest and shrub in the Dongting Lake Basin was generally low. In the year 2000, there were 6.52 × 10⁴ km2 and 8.57 × 10⁴ km2 of forest and shrub with lowest and low levels of carbon density, accounting for 41.95% and 55.13% of the total forest and shrub area. The area of high and highest carbon density levels only accounted for 0.07%.
From the year 2000 to 2020, the biomass carbon density level of forest and shrub in the Dongting Lake Basin showed an overall improvement, and the improvement was more significant from 2010 to 2020 than from 2000 to 2010 (Figure 4 and Figure 5). From 2000 to 2010, the area of medium, high and highest levels of carbon density increased by 162.18%, 215.14% and 194.84%, respectively, and the area of the lowest level decreased by 16.82%. By 2020, the area of medium, high and highest carbon density levels had further increased to 3.92 times, 110.99 times and 816.92 times that of 2010, respectively, and the proportions of highest and high levels of forest and shrub had reached 14.86% and 21.52%.
Looking at the changes in the different biomass carbon density levels over time, we found that large areas of the low carbon density forest and shrub exhibited an improvement in carbon density level (Figure 6): from 2000 to 2010, 29.85% of the forest and shrub with the lowest carbon density level showed an increase in carbon density level, and 10.89% of the forest and shrub with a low carbon density level showed such an increase too. Between 2010 and 2020, the proportions became even larger: 61.04% of the forest and shrub with the lowest carbon density level showed an increase in carbon density level, and 80.42% of the low carbon density level showed such an increase too.
However, most of the forest and shrub above the medium level decreased in carbon density during the period 2000–2010 (Figure 6): 96.77% of the forest and shrub with the highest carbon density level showed a decrease in carbon density level, and 92.61% of the high level and 68.58% of the medium level also showed a decrease, which may reflect the widespread degradation or deforestation of forest in the Dongting Lake Basin from 2000 to 2010. Fortunately, this trend reversed in the second decade: 70.63% of forest and shrub with a medium level and 53.34% with a high level had increased their biomass carbon density from 2010 to 2020.

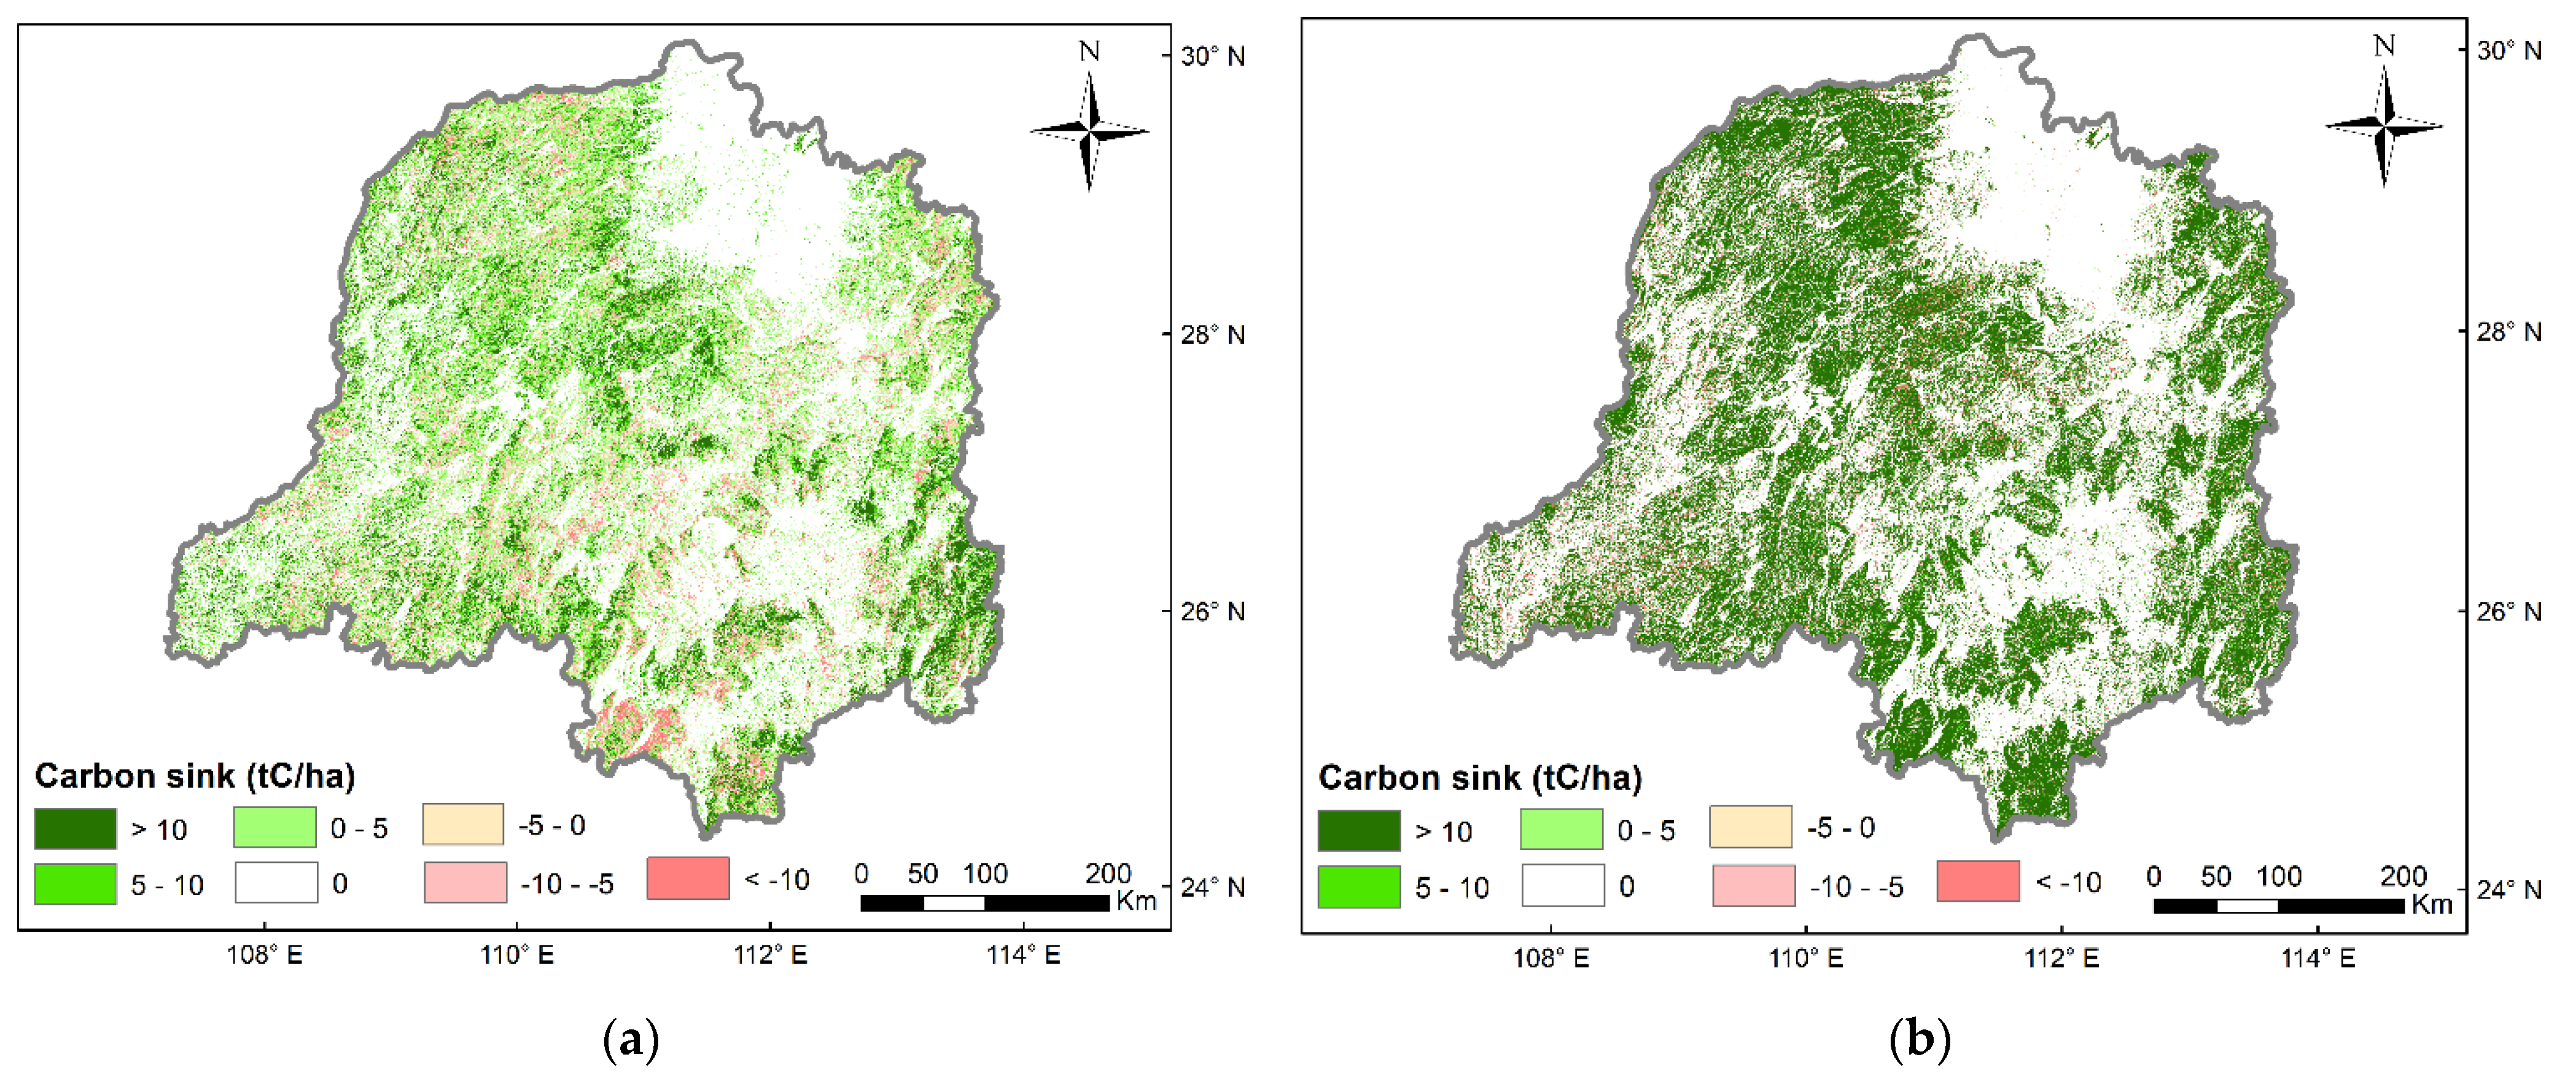
3.2. Carbon Sink of Forest and Shrub

From 2000 to 2020, the quantity of carbon sink of the forest and shrub in the Dongting Lake Basin increased significantly (Figure 7 and Figure 8). The amount of carbon sink by forest and shrub increased from 64.64 TgC in the first decade to 382.56 TgC in the second decade.

3.2.1. Carbon Sinks from Different Biomass Carbon Density Levels of the Constant Forest and Shrub

There are differences in the contributions of forest and shrub at different initial biomass carbon density levels to carbon sink, and this difference changes over time (Table 4 and Table 5). From 2000 to 2010, the forest and shrub with relatively low carbon density levels had the highest carbon sinks per unit area and carbon sinks. Although the carbon sinks per unit area of forest and shrub with high carbon density levels were negative, they had little impact on the total carbon sink due to their small area; negative carbon sink in the forest and shrub with a medium carbon density level had a greater impact on the total carbon sink. From 2010 to 2020, the carbon sink per unit area of forest and shrub with different carbon density levels all largely increased compared to the first decade; the carbon sink efficiencies of the low and lowest levels improved to 7.17 times and 5.85 times that of 2000–2010, respectively. The carbon sink efficiencies of the forest and shrub with medium and above carbon densities increased the most, while the medium level of forest and shrub became the most efficient carbon sink provider. However, due to the dominance of the low carbon density forest and shrub in the Dongting Lake Basin, low carbon density levels of forest and shrub contributed the most to the carbon sink in the two decades (Table 4 and Table 5).
As can be further seen from Figure 9, with the increase in the initial carbon density, the carbon sink per unit area increased first and then decreased. In the first decade, carbon sink reached the peak at a low level of initial carbon density and became negative at a medium level of carbon density. However, the carbon sink reached a higher maximum at higher initial carbon densities over time, and the carbon sink changed from negative in the first decade to positive in the second decade for carbon-dense forest and shrub. This showed the continued accelerated growth of low carbon density forest and the stronger carbon sinks of regrowth forest after deforestation over time. Looking at the entire two decades, low carbon density forest and shrub, which accounted for the majority of areas in the Dongting Lake Basin, not only had the highest carbon sequestration efficiency, but also had the greatest contribution to the total carbon sink. In general, the overall low carbon density of forest and shrub in the Dongting Lake Basin and the dynamics of their carbon sinks in the past two decades indicate their huge carbon sequestration potential in the future.

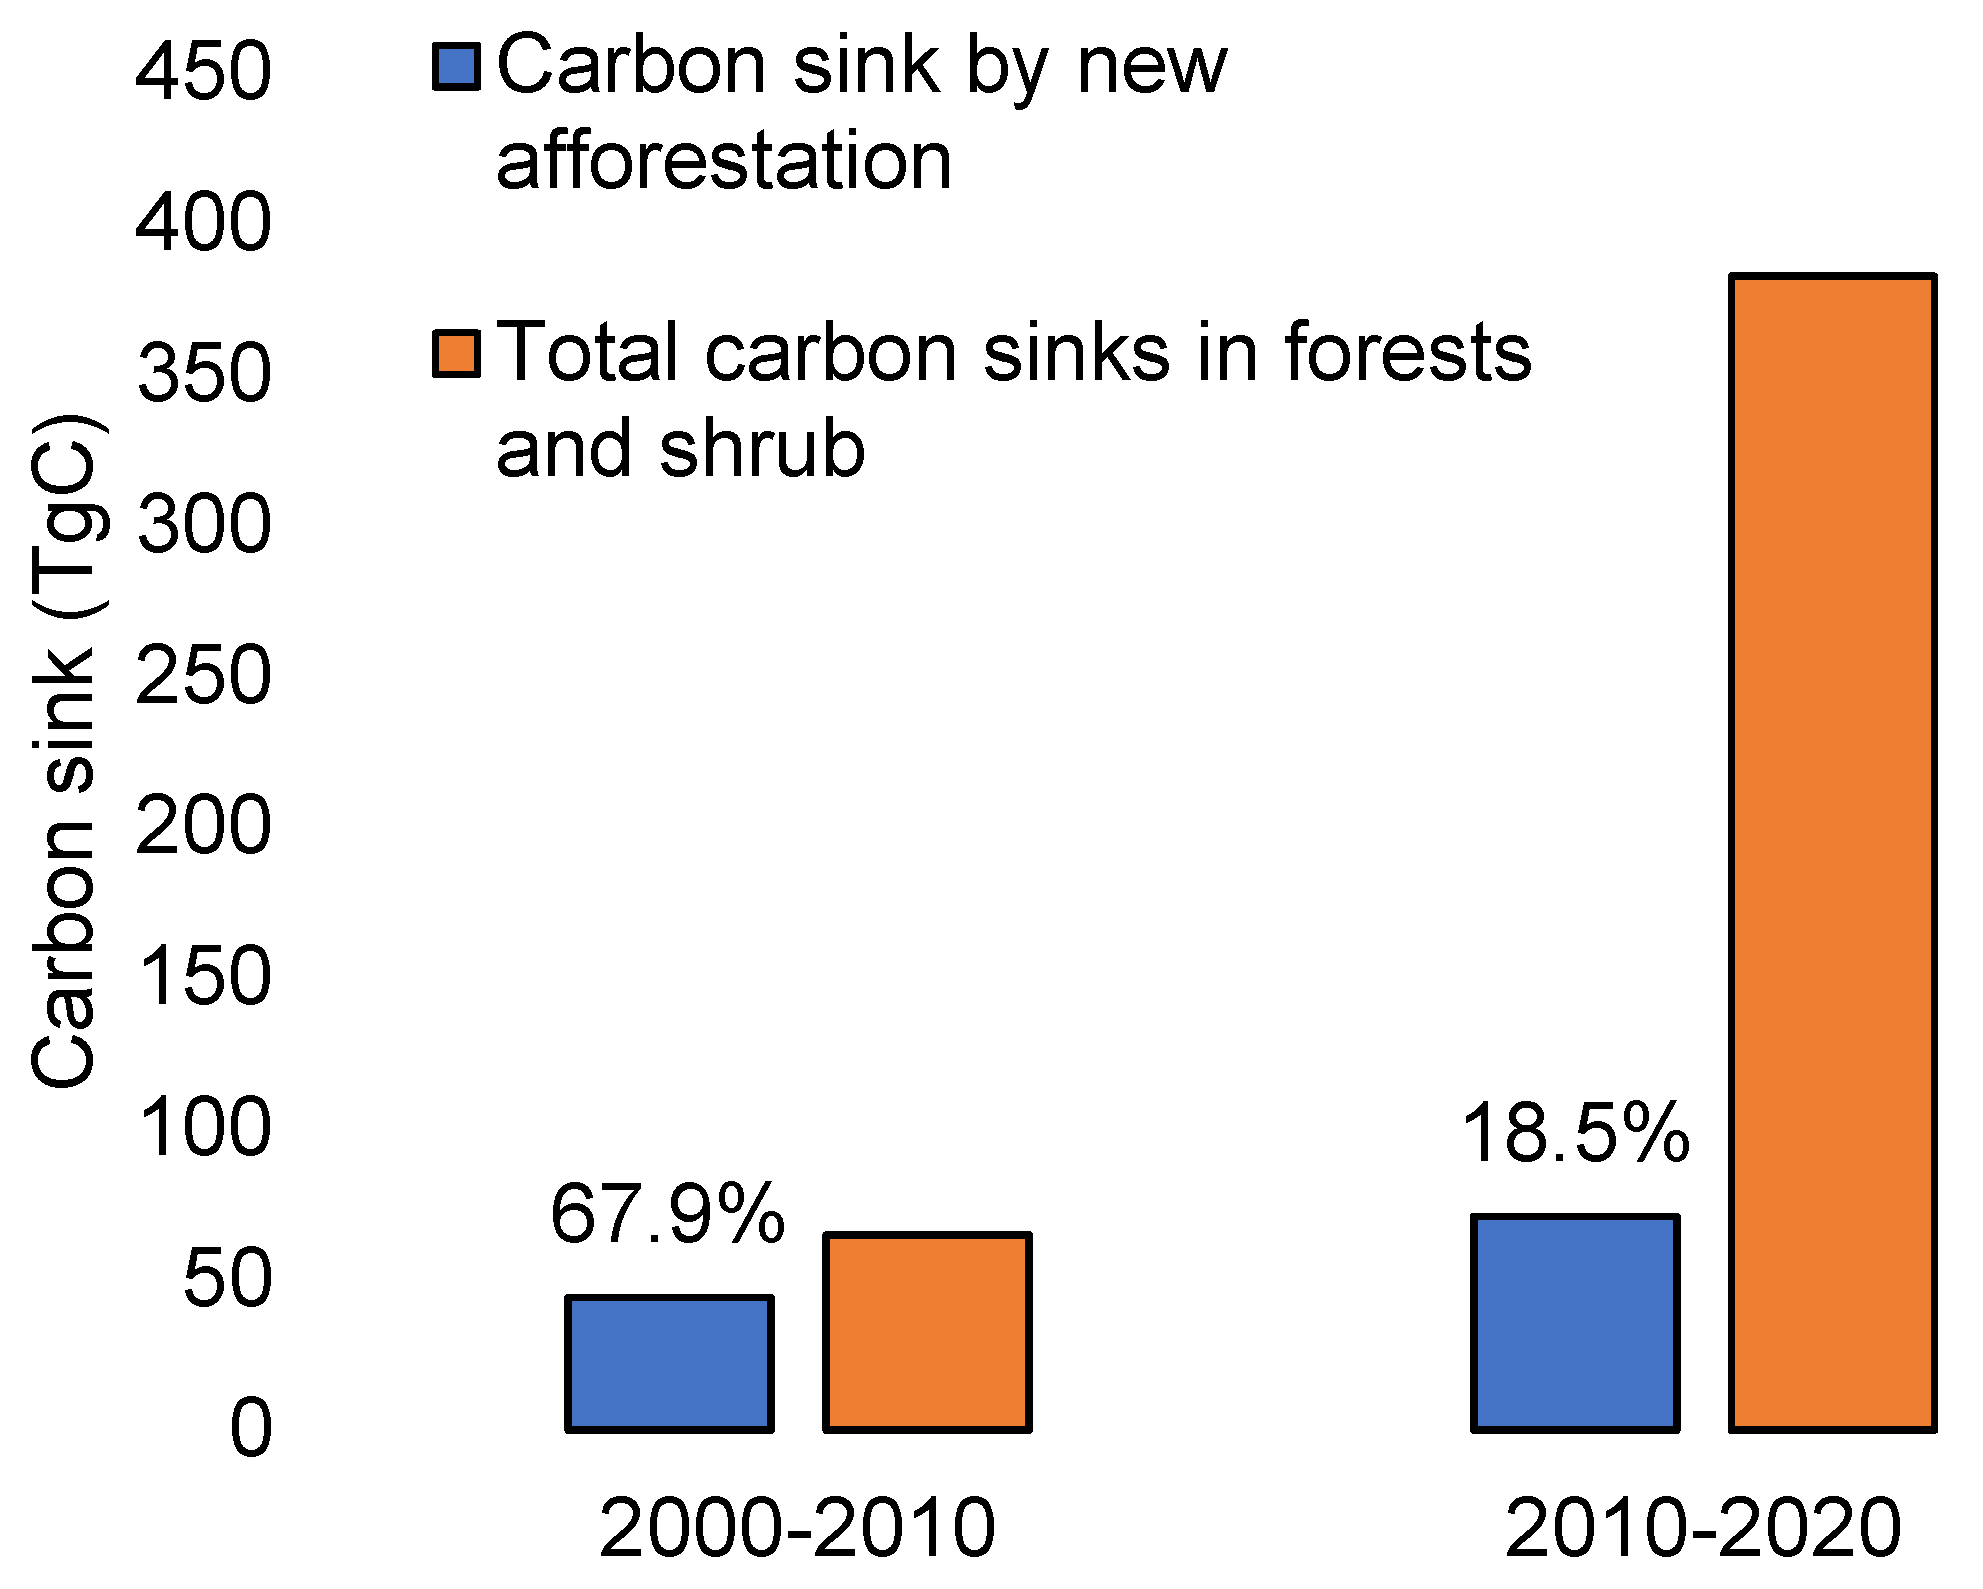
3.2.2. Carbon Sink from New Afforestation

From the year 2000 to 2020, the net increase in the area of forests and shrubs in the Dongting Lake Basin reached 977.90 km2 (Table 6). It is estimated that new afforestation contributed 43.89 TgC of carbon sink from 2000 to 2010 and 70.73 TgC of carbon sink from 2010 to 2020. Although the carbon sink of new afforestation in the second decade was 1.61 times that of the first decade, the contribution proportion of new afforestation to carbon sink changed from 67.90% in the first decade to 18.49% in the second decade (Figure 10). From 2000 to 2020, while carbon sink from ongoing new afforestation grew, the contribution proportion diminished.

4. Discussion

Terrestrial ecosystems play a critical role in the global C cycle and climate change mitigation. A deeper understanding of the regional dynamics of carbon dioxide (CO2) sequestered by forest biomass and the involved mechanisms can help to make sustainable forest management policies for climate change. In our study, forest carbon sink in the Dongting Lake Basin of China over the past 20 years was analyzed in terms of its dynamics and driving forces by remote sensing data. We revealed the characteristics of different biomass carbon density levels over time and determined how the change in carbon density levels influenced carbon sink. We also identified the contribution of new afforestation to carbon sinks and how the contribution changed over time. Our findings could have implications for future forest ecological restoration and the improvement of ecosystem management in ecologically important and fragile regions around the world.

4.1. Carbon Sink Dynamics of Forest and Shrub

Forests play a leading role in regional and global terrestrial carbon (C) cycles. Changes in forest carbon stocks are a determinant of the regional carbon budget [27], so assessment of the dynamics in C sinks/sources of forests are critical to the estimation of the regional C budget [5,6,7,8,9,10,11,12,13]. Our study result showed an overall high increase in forest and shrub biomass from 2000 to 2020 in the Dongting Lake Basin, which is similar to the conclusions of other studies from the last century and the 2010s at the global scale, national scale or in the Yangtze River Basin [2,6,7,27,35]. We also found that the quantity of carbon sink in forest and shrub increased significantly with the passage of time. The accelerated growth of biomass and rapid increase in forest aboveground carbon sink are partly due to the great water and heat conditions in the red soil region of southern China, which leads to rapid vegetation growth by climate change [28,35], but they are more likely due to the large-scale ecological restoration projects implemented in the study area [35], such as returning sloping cropland to forest, the protection of natural forest, etc. These projects effectively curb the interference of human activities, such as fuelwood logging, cropland reclamation and widespread ecosystem degradation.

4.2. Carbon Sinks Contributed by Growth at Different Carbon Densities

Changes in forest biomass carbon density are one of the main contributors to changes in carbon sinks and clarifying the status and changing trend of biomass carbon density is the basis for evaluating carbon sink dynamics [2,7,25]. Our study showed the overall low forest biomass carbon density in the Dongting Lake Basin, as other studies have shown that most of China’s forests are young or mid-aged and have low levels of biomass carbon density [7,26,53]. This reality, combined with the absence of effective forest-management and silvicultural practices, contributes to poor-quality forest stands that are marked by low productivity [53]. However, we found that the biomass carbon density level of forests and shrubs in the Dongting Lake Basin showed an overall improvement from 2000 to 2020, and the improvement was more significant from 2010 to 2020 than from 2000 to 2010. The increasing density of biomass made an important contribution to the increased C sink [2,11,54]. Other studies demonstrating a significant growth trend of forest NDVI from 2000 to 2015 in Dongting Lake Basin can also support this conclusion [40]. Specifically, we found that large areas of low carbon density forest and shrub exhibited an improvement in carbon density, which corroborated the growth of existing immature forests that were still recovering from historical agriculture or harvesting [2,11]. On the other hand, most of the forest and shrub with above-medium carbon density levels decreased in carbon density during the period 2000–2010, which may be due to widespread deforestation. Forest and shrub are particularly vulnerable to human land use, as previous studies showed that much of the temperate forests in the world have been cleared for agriculture [34]. We also found that the decreasing trend of carbon density reversed between 2010 and 2020. Forest protection, reforestation or returning cropland to forest have probably turned these forests from carbon sources to carbon sinks [34,55,56,57].
It is of scientific importance to further investigate the possible mechanisms of forest carbon dynamics under different carbon density levels [6,7,8,9,10,11,12]. Our study showed the carbon sinks from different carbon densities of forest and shrub and their dynamics. With the increase in the initial carbon density, the carbon sink per unit area of forest and shrub increased first and then decreased in a certain period in the Dongting Lake Basin. This is because mature forests have a higher carbon sequestration capacity, and the younger age-structure of forests likely contributed to lower biomass C densities and smaller C sink strength [7]. However, a higher frequency of forest harvesting and the degradation of old forests in southern China might have contributed to the reduction in mature forest carbon sink [27]. From a long-term perspective, our study showed that the carbon sink increased at each carbon density level and reached a higher maximum at higher initial carbon densities over time, and the carbon sink changed from negative in the first decade to positive in the second decade for carbon-dense forest. This represented the continued accelerated growth of young forests and the stronger carbon sinks of regrowth forests after deforestation under the influence of ecological protection, and abundant precipitation and warm temperature [2,7]. In the entire past two decades, low carbon density forest and shrub, which accounted for most areas in the Dongting Lake Basin, not only had the highest carbon sequestration efficiency, but also had the greatest contribution to the total carbon sink. Based on the dynamics of carbon sinks from different carbon densities in Dongting Lake in the past two decades, we inferred that the Dongting Lake Basin has huge carbon sequestration potential in the future. This conclusion is consistent with inference at the national scale [2,13,14,25,26,58].

4.3. Carbon Sinks Contributed by Afforestation

In addition to the increasing density of biomass, increase in areas of newly planted forests is also a primary driving force of increased carbon sink [6]. Assessment of the relative contributions of the driving factors to carbon sinks is crucial to reveal the mechanisms that control forest carbon sinks [25]. We analyzed the contributions of new afforestation from 2000 to 2020 and compared the changes in the two decades. We found that carbon sink from ongoing new afforestation grew, but the contribution proportion diminished. Contribution of forest carbon density growth to carbon sinks has already exceeded that of new afforestation in the Dongting Lake Basin. Previous studies have shown that the contribution proportion of forest areal expansion to the carbon sink in the southern China and southwestern China was 60.4% and 78.2% from 1977 to 2008, respectively [25]. Our study area was located in a transition zone between southern and southwestern of China, and our analysis result showed that the contribution proportion of new afforestation to carbon sink was 67.90% from 2000 to 2010, which is basically consistent with the result of previous studies. In the future, although afforestation will continue to play an important role in increasing the forest carbon sink in China [25], ecosystem management in areas with overall low ecosystem quality should be paid more attention to improve ecosystem quality for the purpose of realizing the huge carbon sequestration potential.
In this study, we analyzed the changes in carbon storage and carbon sinks of forest and shrub from the year 2000 to 2020, and specifically discussed the contributions of different carbon density levels and new afforestation to carbon sinks over time. Currently, most studies used forest inventory data and statistical data to analyze the carbon sinks of different forest ages and forest types at the provincial or geographical zone scale [6,13,25,26,27,58]. Instead, we used regional remote sensing data to identify pixel-scale biomass changes in the past two decades and analyzed the change mechanism of forest carbon sinks from the perspective of different biomass carbon density levels for the first time. In future studies, the differences in the carbon sequestration between natural and planted forests should be further studied. In addition, the quantitative prediction of future carbon sink trends under different forest management practices and climate change is also a topic for further research.

5. Conclusions

From 2000 to 2020, there was an overall improvement in the biomass carbon density of forest and shrub in the Dongting Lake Basin, and the carbon sink in the second decade increased significantly compared to the first decade. Low carbon density forest and shrub had the greatest contribution to the total carbon sink in the past two decades. With the increase in the initial carbon density, the carbon sink efficiency of forest and shrub increased first and then decreased, and it reached a higher maximum at higher initial carbon densities over time. The carbon sink changed from negative in the first decade to positive in the second decade for degraded or deforested forests. Carbon sink from afforestation grew from 2000 to 2020, but the contribution proportion diminished. The overall low carbon density of forest and shrub in the Dongting Lake Basin and their dynamics indicated their huge carbon sequestration potential in the future. In addition to continuously implementing forest protection and restoration projects to promote afforestation, the improvement of ecosystem quality should be paid more attention in ecosystem management to realize the huge carbon sequestration potential for areas like the Dongting Lake Basin with severely degraded but ecologically important and fragile ecosystems.

Author Contributions

Conceptualization, L.K. and Z.O.; methodology, L.K. and F.L.; formal analysis, L.K. and E.R.; data, L.K., F.L., E.R. and Z.O.; writing—original draft preparation, L.K. and E.R.; writing—review and editing, F.L. and Z.O.; funding acquisition, L.K., F.L. and Z.O. All authors have read and agreed to the published version of the manuscript.

Funding

This research was funded by the National Natural Science Foundation of China, grant number 41901257, 71874182, and the Youth Innovation Promotion Association CAS, grant number 2022040.

Conflicts of Interest

The authors declare no conflict of interest.

References

  1. Lu, F.; Hu, H.; Sun, W.; Zhu, J.; Liu, G.; Zhou, W.; Zhang, Q.; Shi, P.; Liu, X.; Wu, X.; et al. Effects of national ecological restoration projects on carbon sequestration in China from 2001 to 2010. Proc. Natl. Acad. Sci. USA 2018, 115, 4039–4044. [Google Scholar] [CrossRef] [Green Version]
  2. Pan, Y.; Birdsey, R.A.; Fang, J.; Houghton, R.; Kauppi, P.E.; Kurz, W.A.; Phillip, O.L.; Shvidenko, A.; Lewis, S.L.; Canadell, J.G.; et al. A large and persistent carbon sink in the world’s forests. Science 2011, 333, 988–993. [Google Scholar] [CrossRef] [PubMed] [Green Version]
  3. Teobaldelli, M.; Somogyi, Z.; Migliavacca, M.; Usoltsev, V.A. Generalized functions of biomass expansion factors for conifers and broadleaved by stand age, growing stock and site index. For. Ecol. Manag. 2009, 257, 1004–1013. [Google Scholar] [CrossRef]
  4. Brown, S.L.; Schroeder, P.; Kern, J.S. Spatial distribution of biomass in forests of the eastern USA. For. Ecol. Manag. 1999, 123, 81–90. [Google Scholar] [CrossRef]
  5. Watson, R.T.; Noble, I.R.; Bolin, B.; Ravindranath, N.H.; Verardo, D.J.; Dokken, D.J. Land Use, Land-Use Change and Forestry: A Special Report of the Intergovernmental Panel on Climate Change; Cambridge University Press: Cambridge, UK, 2000. [Google Scholar]
  6. Fang, J.; Chen, A.; Peng, C.; Zhao, S.; Ci, L. Changes in forest biomass carbon storage in China between 1949 and 1998. Science 2001, 292, 2320–2322. [Google Scholar] [CrossRef]
  7. Fang, J.; Guo, Z.; Hu, H.; Kato, T.; Muraoka, H.; Son, Y. Forest biomass carbon sinks in East Asia, with special reference to the relative contributions of forest expansion and forest growth. Glob. Change Biol. 2014, 20, 2019–2030. [Google Scholar] [CrossRef] [PubMed]
  8. Fang, J.; Kato, T.; Guo, Z.; Yang, Y.; Hu, H.; Shen, H.; Zhao, X.; Kishimoto-Mo, A.W.; Tang, Y.; Houghton, R.A. Evidence for environmentally enhanced forest growth. Proc. Natl. Acad. Sci. USA 2014, 111, 9527–9532. [Google Scholar] [CrossRef] [Green Version]
  9. Janssens, I.A.; Freibauer, A.; Ciais, P.; Smith, P.; Nabuurs, G.-J.; Folberth, G.; Schlamadinger, B.; Hutjes, R.W.A.; Ceulemans, R.; Schulze, E.-D.; et al. Europe’s Terrestrial Biosphere Absorbs 7 to 12% of European Anthropogenic CO2 Emissions. Science 2003, 300, 1538–1542. [Google Scholar] [CrossRef] [Green Version]
  10. Nabuurs, G.-J.; Schelhaas, M.-J.; Mohren, G.M.J.; Field, C.B. Temporal evolution of the European forest sector carbon sink from 1950 to 1999. Glob. Chang. Biol. 2003, 9, 152–160. [Google Scholar] [CrossRef]
  11. Birdsey, R.; Pregitzer, K.; Lucier, A. Forest carbon management in the United States. J. Environ. Qual. 2006, 35, 1461–1469. [Google Scholar] [CrossRef] [Green Version]
  12. McKinley, D.C.; Ryan, M.G.; Birdsey, R.A.; Giardina, C.P.; Harmon, M.E.; Heath, L.S.; Houghton, R.A.; Jackson, R.B.; Morrison, J.F.; Murray, B.C.; et al. A synthesis of current knowledge on forests and carbon storage in the United States. Ecol. Appl. 2011, 21, 1902–1924. [Google Scholar] [CrossRef] [PubMed] [Green Version]
  13. Guo, Z.; Hu, H.; Li, P.; Li, N.; Fang, J. Spatio-temporal changes in biomass carbon sinks in China’s forests from 1977 to 2008. Sci. China Life Sci. 2013, 56, 661–671. [Google Scholar] [CrossRef] [PubMed] [Green Version]
  14. Tang, X.; Zhao, X.; Bai, Y.; Tang, Z.; Wang, W.; Zhao, Y.; Wan, H.; Xie, Z.; Shi, X.; Wu, B.; et al. Carbon pools in China’s terrestrial ecosystems: New estimates based on an intensive field survey. Proc. Natl. Acad. Sci. USA 2018, 115, 4021–4026. [Google Scholar] [CrossRef] [Green Version]
  15. Xu, L.; Yu, G.; He, N.; Wang, Q.; Gao, Y.; Wen, D.; Li, S.; Niu, S.; Ge, J. Carbon storage in China’s terrestrial ecosystems: A synthesis. Sci Rep. 2018, 8, 2806. [Google Scholar] [CrossRef] [PubMed]
  16. Chinese Ministry of Forestry. Forest Resource Report of China—The 7th National Forest Resources Inventory; China Forestry Publishing House: Beijing, China, 2010.
  17. Fang, J.; Tang, Y.; Son, Y. Why are East Asian ecosystems important for carbon cycle research? Sci. China Life Sci. 2010, 53, 753–756. [Google Scholar] [CrossRef]
  18. Zhang, P.; Shao, G.; Zhao, G.; Le Master, D.C.; Parker, G.R.; Dunning Jr, J.B.; Li, Q. China’s forest policy for the 21st century. Science 2000, 288, 2135–2136. [Google Scholar] [CrossRef] [Green Version]
  19. Fang, J.; Guo, Z.; Piao, S.; Chen, A. Terrestrial vegetation carbon sinks in China, 1981–2000. Sci. China Ser. Earth Sci. 2007, 50, 1341–1350. [Google Scholar] [CrossRef]
  20. Liu, S.; Zhou, T.; Wei, L.; Shu, Y. The spatial distribution of forest carbon sinks and sources in China. Chin. Sci. Bull. 2012, 57, 1699–1707. [Google Scholar] [CrossRef] [Green Version]
  21. Bryan, B.A.; Gao, L.; Ye, Y.; Sun, X.; Connor, J.D.; Crossman, N.D.; Stafford-Smith, M.; Wu, J.; He, C.; Yu, D.; et al. China’s response to a national land-system sustainability emergency. Nature 2018, 559, 193–204. [Google Scholar] [CrossRef]
  22. Ouyang, Z.; Zheng, H.; Xiao, Y.; Polasky, S.; Liu, J.; Xu, W.; Wang, Q.; Zhang, L.; Xiao, Y.; Rao, E.; et al. Improvements in ecosystem services from investments in natural capital. Science 2016, 352, 1455–1459. [Google Scholar] [CrossRef]
  23. Liu, J.; Li, S.; Ouyang, Z.; Tam, C.; Chen, X. Ecological and socioeconomic effects of China’s policies for ecosystem services. Proc. Natl. Acad. Sci. USA 2008, 105, 9477–9482. [Google Scholar] [CrossRef] [PubMed] [Green Version]
  24. Liu, W.; Lu, F.; Luo, Y.; Bo, W.; Kong, L.; Zhang, L.; Liu, B.; Ouyang, Z.; Wang, X. Human influence on the temporal dynamics and spatial distribution of forest biomass carbon in China. Ecol. Evol. 2017, 7, 6220–6230. [Google Scholar] [CrossRef] [PubMed] [Green Version]
  25. Li, P.; Zhu, J.; Hu, H.; Guo, Z.; Pan, Y.; Birdsey, R.; Fang, J. The relative contributions of forest growth and areal expansion to forest biomass carbon. Biogeosciences 2016, 13, 375–388. [Google Scholar] [CrossRef] [Green Version]
  26. Hu, H.; Wang, S.; Guo, Z.; Xu, B.; Fang, J. The stage-classified matrix models project a significant increase in biomass carbon stocks in China’s forests between 2005 and 2050. Sci. Rep. 2015, 5, 11203. [Google Scholar] [CrossRef] [Green Version]
  27. Shi, L.; Zhao, S.; Tang, Z.; Fang, J. The changes in China’s forests: An analysis using the forest identity. PLoS ONE 2011, 6, e20778. [Google Scholar] [CrossRef]
  28. Piao, S.; Fang, J.; Ciais, P.; Peylin, P.; Huang, Y.; Sitch, S.; Wang, T. The carbon balance of terrestrial ecosystems in China. Nature 2009, 458, 1009–1013. [Google Scholar] [CrossRef]
  29. Anaya, J.A.; Chuvieco, E.; Palacios-Orueta, A. Aboveground biomass assessment in Colombia: A remote sensing approach. For. Ecol. Manag. 2009, 257, 1237–1246. [Google Scholar] [CrossRef]
  30. Ehlers, D.; Wang, C.; Coulston, J.; Zhang, Y.; Pavelsky, T.; Frankenberg, E.; Woodcock, C.; Song, C. Mapping Forest Aboveground Biomass Using Multisource Remotely Sensed Data. Remote Sens. 2022, 14, 1115. [Google Scholar] [CrossRef]
  31. Wang, X.; Liu, C.; Lv, G.; Xu, J.; Cui, G. Integrating Multi-Source Remote Sensing to Assess Forest Aboveground Biomass in the Khingan Mountains of North-Eastern China Using Machine-Learning Algorithms. Remote Sens. 2022, 14, 1039. [Google Scholar] [CrossRef]
  32. Sun, Z.; Qian, W.; Huang, Q.; Lv, H.; Yu, D.; Ou, Q.; Lu, H.; Tang, X. Use Remote Sensing and Machine Learning to Study the Changes of Broad-Leaved Forest Biomass and Their Climate Driving Forces in Nature Reserves of Northern Subtropics. Remote Sens. 2022, 14, 1066. [Google Scholar] [CrossRef]
  33. Wu, B.; Zeng, Y.; Zhao, D. Remote Sensing Monitoring Algorithms and Dynamic Change Patterns of Ecological Parameters of China; Science Press: Beijing, China, 2019; pp. 205–251. [Google Scholar]
  34. Bonan, G.B. Forests and climate change: Forcings, feedbacks, and the climate benefits of forests. Science 2008, 320, 1444–1449. [Google Scholar] [CrossRef] [PubMed] [Green Version]
  35. Kong, R.; Zhang, Z.; Zhang, F.; Tian, J.; Chang, J.; Jiang, S.; Zhu, B.; Chen, X. Increasing carbon storage in subtropical forests over the Yangtze River basin and its relations to the major ecological projects. Sci. Total Environ. 2020, 709, 136163. [Google Scholar] [CrossRef] [PubMed]
  36. Kong, L.; Zheng, H.; Ouyang, Z. Ecological protection and restoration of forest, wetland, grassland and cropland based on the perspective of ecosystem services: A case study in Dongting Lake Watershed. Acta Ecol. Sin. 2019, 39, 8903–8910. [Google Scholar]
  37. Deng, C.; Liu, J.; Liu, Y.; Li, Z.; Nie, X.; Hu, X.; Wang, L.; Zhang, Y.; Zhang, G.; Zhu, D.; et al. Spatiotemporal dislocation of urbanization and ecological construction increased the ecosystem service supply and demand imbalance. J. Environ. Manag. 2021, 288, 112478. [Google Scholar] [CrossRef]
  38. Deng, Z.; Li, Y.; Xie, Y.; Peng, C.; Chen, X.; Li, F.; Ren, Y.; Pan, B.; Zhang, C. Hydrologic and Edaphic Controls on Soil Carbon Emission in Dongting Lake Floodplain, China. J. Geophys Res. Biogeosci. 2018, 123, 3088–3097. [Google Scholar] [CrossRef]
  39. Sun, Z.; Lotz, T.; Chang, N.B. Assessing the long-term effects of land use changes on runoff patterns and food production in a large lake watershed with policy implications. J. Environ. Manag. 2017, 204, 92–101. [Google Scholar] [CrossRef]
  40. Wang, L.; Li, Z.; Wang, D.; Chen, J.; Liu, Y.; Nie, X.; Zhang, Y.; Ning, K.; Hu, X. Unbalanced social-ecological development within the Dongting Lake basin: Inspiration from evaluation of ecological restoration projects. J. Clean Prod. 2021, 315, 128161. [Google Scholar] [CrossRef]
  41. Kong, L.; Zheng, H.; Rao, E.; Xiao, Y.; Ouyang, Z.; Li, C. Evaluating indirect and direct effects of eco-restoration policy on soil conservation service in Yangtze River Basin. Sci. Total Environ. 2018, 631, 887–894. [Google Scholar] [CrossRef]
  42. Zhou, J.; Wan, R.R.; Li, B.; Dai, X. Assessing the impact of climate change and human activities on runoff in the Dongting Lake basin of China. Appl. Ecol. Environ. Res. 2019, 17, 5797–5812. [Google Scholar] [CrossRef]
  43. Kong, L.; Zheng, H.; Xiao, Y.; Ouyang, Z.; Li, C.; Zhang, J.; Huang, B. Mapping ecosystem service bundles to detect distinct types of multifunctionality within the diverse landscape of the yangtze river basin, China. Sustainability 2018, 10, 857. [Google Scholar] [CrossRef] [Green Version]
  44. Wu, B.; Qian, J.; Zeng, Y. Land Cover Atlas of the People’s Republic of China (1:1000000); China Map Publishing House: Beijing, China, 2017. [Google Scholar]
  45. Ouyang, Z.; Zhang, L.; Wu, B.; Li, X.; Xu, W.; Xiao, Y.; Zheng, H. An ecosystem classification system based on remote sensor information in China. Acta Ecol. Sin. 2015, 35, 219–226. [Google Scholar]
  46. IPCC. 2006 IPCC Guidelines for National Greenhouse Gas Inventories. Available online: https://www.ipcc-nggip.iges.or.jp/public/2006gl/vol4.html (accessed on 20 March 2022).
  47. Lewis, S.L.; Lopez-Gonzalez, G.; Sonké, B.; Affum-Baffoe, K.; Baker, T.R.; Ojo, L.O.; Phillips, O.L.; Reitsma, J.M.; White, L.; Comiskey, J.A.; et al. Increasing carbon storage in intact African tropical forests. Nature 2009, 457, 1003–1006. [Google Scholar] [CrossRef] [PubMed]
  48. Keith, H.; Mackey, B.G.; Lindenmayer, D.B. Re-evaluation of forest biomass carbon stocks and lessons from the world’s most carbon-dense forests. Proc. Natl. Acad. Sci. USA 2009, 106, 11635–11640. [Google Scholar] [CrossRef] [PubMed] [Green Version]
  49. Mandle, L.; Tallis, H.; Sotomayor, L.; Vogl, A.L. Who loses? Tracking ecosystem service redistribution from road development and mitigation in the Peruvian Amazon. Front. Ecol Environ. 2015, 13, 309–315. [Google Scholar] [CrossRef]
  50. Chen, P.; Wang, X.; Wang, L. Carbon Budget and Its Sink Promotion of Terrestrial Ecosystem in China; Science Press: Beijing, China, 2008. [Google Scholar]
  51. Fu, B. Ecosystem Changes and Effects in China; Higher Education Press: Beijing, China, 2019; p. 398. [Google Scholar]
  52. Ouyang, Z.; Xu, W.; Xiao, Y. Ecosystem Pattern, Quality, Services and Evolution in China; Science Press: Beijing, China, 2017; p. 18. [Google Scholar]
  53. Li, S.; Huang, M.; Li, S. REDD-plus and China’s contribution. In IOP Conference Series: Earth and Environmental Science; IOP Publishing Ltd. Bristol, UK, 2014; Volume 17, p. 012021. IOP Publishing Ltd.: Bristol, UK, 2014; Volume 17, p. 012021. [Google Scholar]
  54. Kauppi, P.E.; Ausubel, J.H.; Fang, J.; Mather, A.S.; Sedjo, R.A.; Waggoner, P.E. Returning forests analyzed with the forest identity. Proc. Natl. Acad. Sci. USA 2006, 103, 17574–17579. [Google Scholar] [CrossRef] [Green Version]
  55. Albani, M.; Medvigy, D.; Hurtt, G.C.; Moorcroft, P.R. The contributions of land-use change, CO2 fertilization, and climate variability to the Eastern US carbon sink. Glob. Chang. Biol. 2006, 12, 2370–2390. [Google Scholar] [CrossRef]
  56. Brown, S.L.; Sathaye, J.; Cannell, M.; Kauppi, P. Mitigation of carbon emissions to the atmosphere by forest management. Commonw. For. Rev. 1996, 75, 80–91. [Google Scholar]
  57. Hu, H.; Wang, G. Changes in forest biomass carbon storage in the South Carolina Piedmont between 1936 and 2005. For. Ecol. Manag. 2008, 255, 1400–1408. [Google Scholar] [CrossRef]
  58. Xu, B.; Guo, Z.; Piao, S.; Fang, J. Biomass carbon stocks in China’s forests between 2000 and 2050: A prediction based on forest biomass-age relationships. Sci. China Life Sci. 2010, 53, 776–783. [Google Scholar] [CrossRef]
Figure 1. Study area.
Remotesensing 14 02672 g001
Figure 2. Typical evergreen broad-leaved forest in study area. The photo was taken in Nanshan National Park in Hunan province of China (provided by Hunan Nanshan National Park Administration).
Remotesensing 14 02672 g002
Figure 3. Biomass of forest and shrub. (a) Biomass of the year 2000; (b) biomass of the year 2010; (c) biomass of the year 2020.
Remotesensing 14 02672 g003
Figure 4. Biomass carbon density change of forest and shrub.
Remotesensing 14 02672 g004
Figure 5. Biomass carbon density levels of forest and shrub. (a) Map of biomass carbon density levels of forest and shrub in the year 2000; (b) map of biomass carbon density levels of forest and shrub in the year 2010; (c) map of biomass carbon density levels of forest and shrub in the year 2020; (d) area statistics for different carbon density levels in the years of 2000, 2010 and 2020.
Remotesensing 14 02672 g005
Figure 6. Interconversion proportions of different biomass carbon density levels from 2000 to 2020. The numbers on the histogram represent the ratio of the transition area to the area of the initial carbon density level.
Remotesensing 14 02672 g006
Figure 7. Maps of carbon sinks of forest and shrub from 2000 to 2020. (a) Map of carbon sink of forest and shrub between 2000 and 2010; (b) map of carbon sink of forest and shrub between 2010 and 2020.
Remotesensing 14 02672 g007
Figure 8. Carbon sinks of forest and shrub in Dongting Lake Basin from 2000 to 2020.
Remotesensing 14 02672 g008
Figure 9. Carbon sinks contributed by different initial carbon densities from 2000 to 2020.
Remotesensing 14 02672 g009
Figure 10. Carbon sinks contributed by new afforestation from 2000 to 2020.
Remotesensing 14 02672 g010
Table 1. Ratio of belowground biomass to aboveground biomass [46].
Aboveground Biomass Density<50
t Dry Matter/ha
50–150
t Dry Matter/ha
>150
t Dry Matter/ha
Coniferous forest0.400.290.20
Broadleaf forest0.450.270.22
Coniferous and broad-leaved forest0.400.280.21
Shrub0.40
Table 2. Biomass carbon density classification rules.
Biomass Carbon Density LevelsValue of RBCD/%
HighestRBCD ≥ 85
High70 ≤ RBCD < 85
Medium50 ≤ RBCD < 70
Low25 ≤ RBCD < 50
LowestRBCD < 25
Table 3. Biomass and biomass density of forest and shrub.
YearQuantity of Biomass of Forest and Shrub (108 t Dry Matter)Average Biomass Density
(t Dry Matter/ha)
20006.9244.79
20108.2153.06
202015.86100.84
Table 4. Carbon sink per unit area from 2000 to 2020 at different carbon density levels.
Carbon Density LevelsCarbon Sink Per Unit Area (tC/ha)
2000–20102010–20202000–2020
Lowest4.1724.4028.72
Low3.5525.4829.14
Medium−6.0727.4621.48
High−18.2626.548.17
Highest−28.8322.79−6.41
Table 5. Carbon sinks from 2000 to 2020 at different carbon density levels.
Total Carbon Sink (TgC)
2000–20102010–20202000–2020
Lowest22.09100.33119.03
Low32.24210.90241.56
Medium−5.6523.6318.50
High−0.460.590.18
Highest−0.080.06−0.02
Table 6. Change area of forest and shrub from the year 2000 to 2020.
Year200020102020
Area of forest and shrub
(104 km2)
15.6415.6815.74
Net increase in forest and shrub from 2000 to 2010 (km2)367.48
Net increase in forest and shrub from 2010 to 2020 (km2) 610.42
Publisher’s Note: MDPI stays neutral with regard to jurisdictional claims in published maps and institutional affiliations.

