Abstract
In summer, westward residual flow in the Qiongzhou Strait (QS) drives a water transport through the strait into the Beibu Gulf, playing a vital role in modifying the gulf-scale circulation. By utilizing multi-source observations, realistic simulations, as well as idealized modeling, the water exchange process at the western entrance of the QS was explored from the perspective of thermal structure. High-resolution satellite sea-surface temperature images captured an interesting thermal phenomenon in the studied region, i.e., a trident-shaped warm water tongue. Validations of numerical results suggested satisfactory model performance in reproducing the trident-shaped warm water tongue. Modeling results together with cruise observations indicates extremely weak stratification in the studied region, which is a result of local intense tidal mixing. The cold upwelling water developed at the eastern side of the strait arrived at the western entrance by the westward residual flow, and then encountered and communicated with the well-mixed warm gulf water there. The alternatively deep/shallow topography (sea trough/ridge) triggers spatial variability in tidal current intensity: stronger currents over the deep area with weaker flow above the shallow region leads to alternatively warm/cold thermal distribution in the cross-isobath direction. Further investigation demonstrates that, through modifying the circulation and regulating the intensity of upwelling on the eastern side of the QS, wind also makes a significant contribution to the thermal distribution at the western entrance of the QS.
1. Introduction
A strait is usually a narrow water channel that separates two land areas but connects two bodies of water. A significant percentage of straits are both economically and strategically important, e.g., the Taiwan Strait, the Hormuz Strait, and the Gibraltar Strait. Straits are the key regions where direct energy and substance exchanges between two water bodies occur; therefore, strait hydrodynamics has attracted unprecedented attention from interdisciplinary researchers [1,2,3,4,5,6,7,8,9,10,11,12].
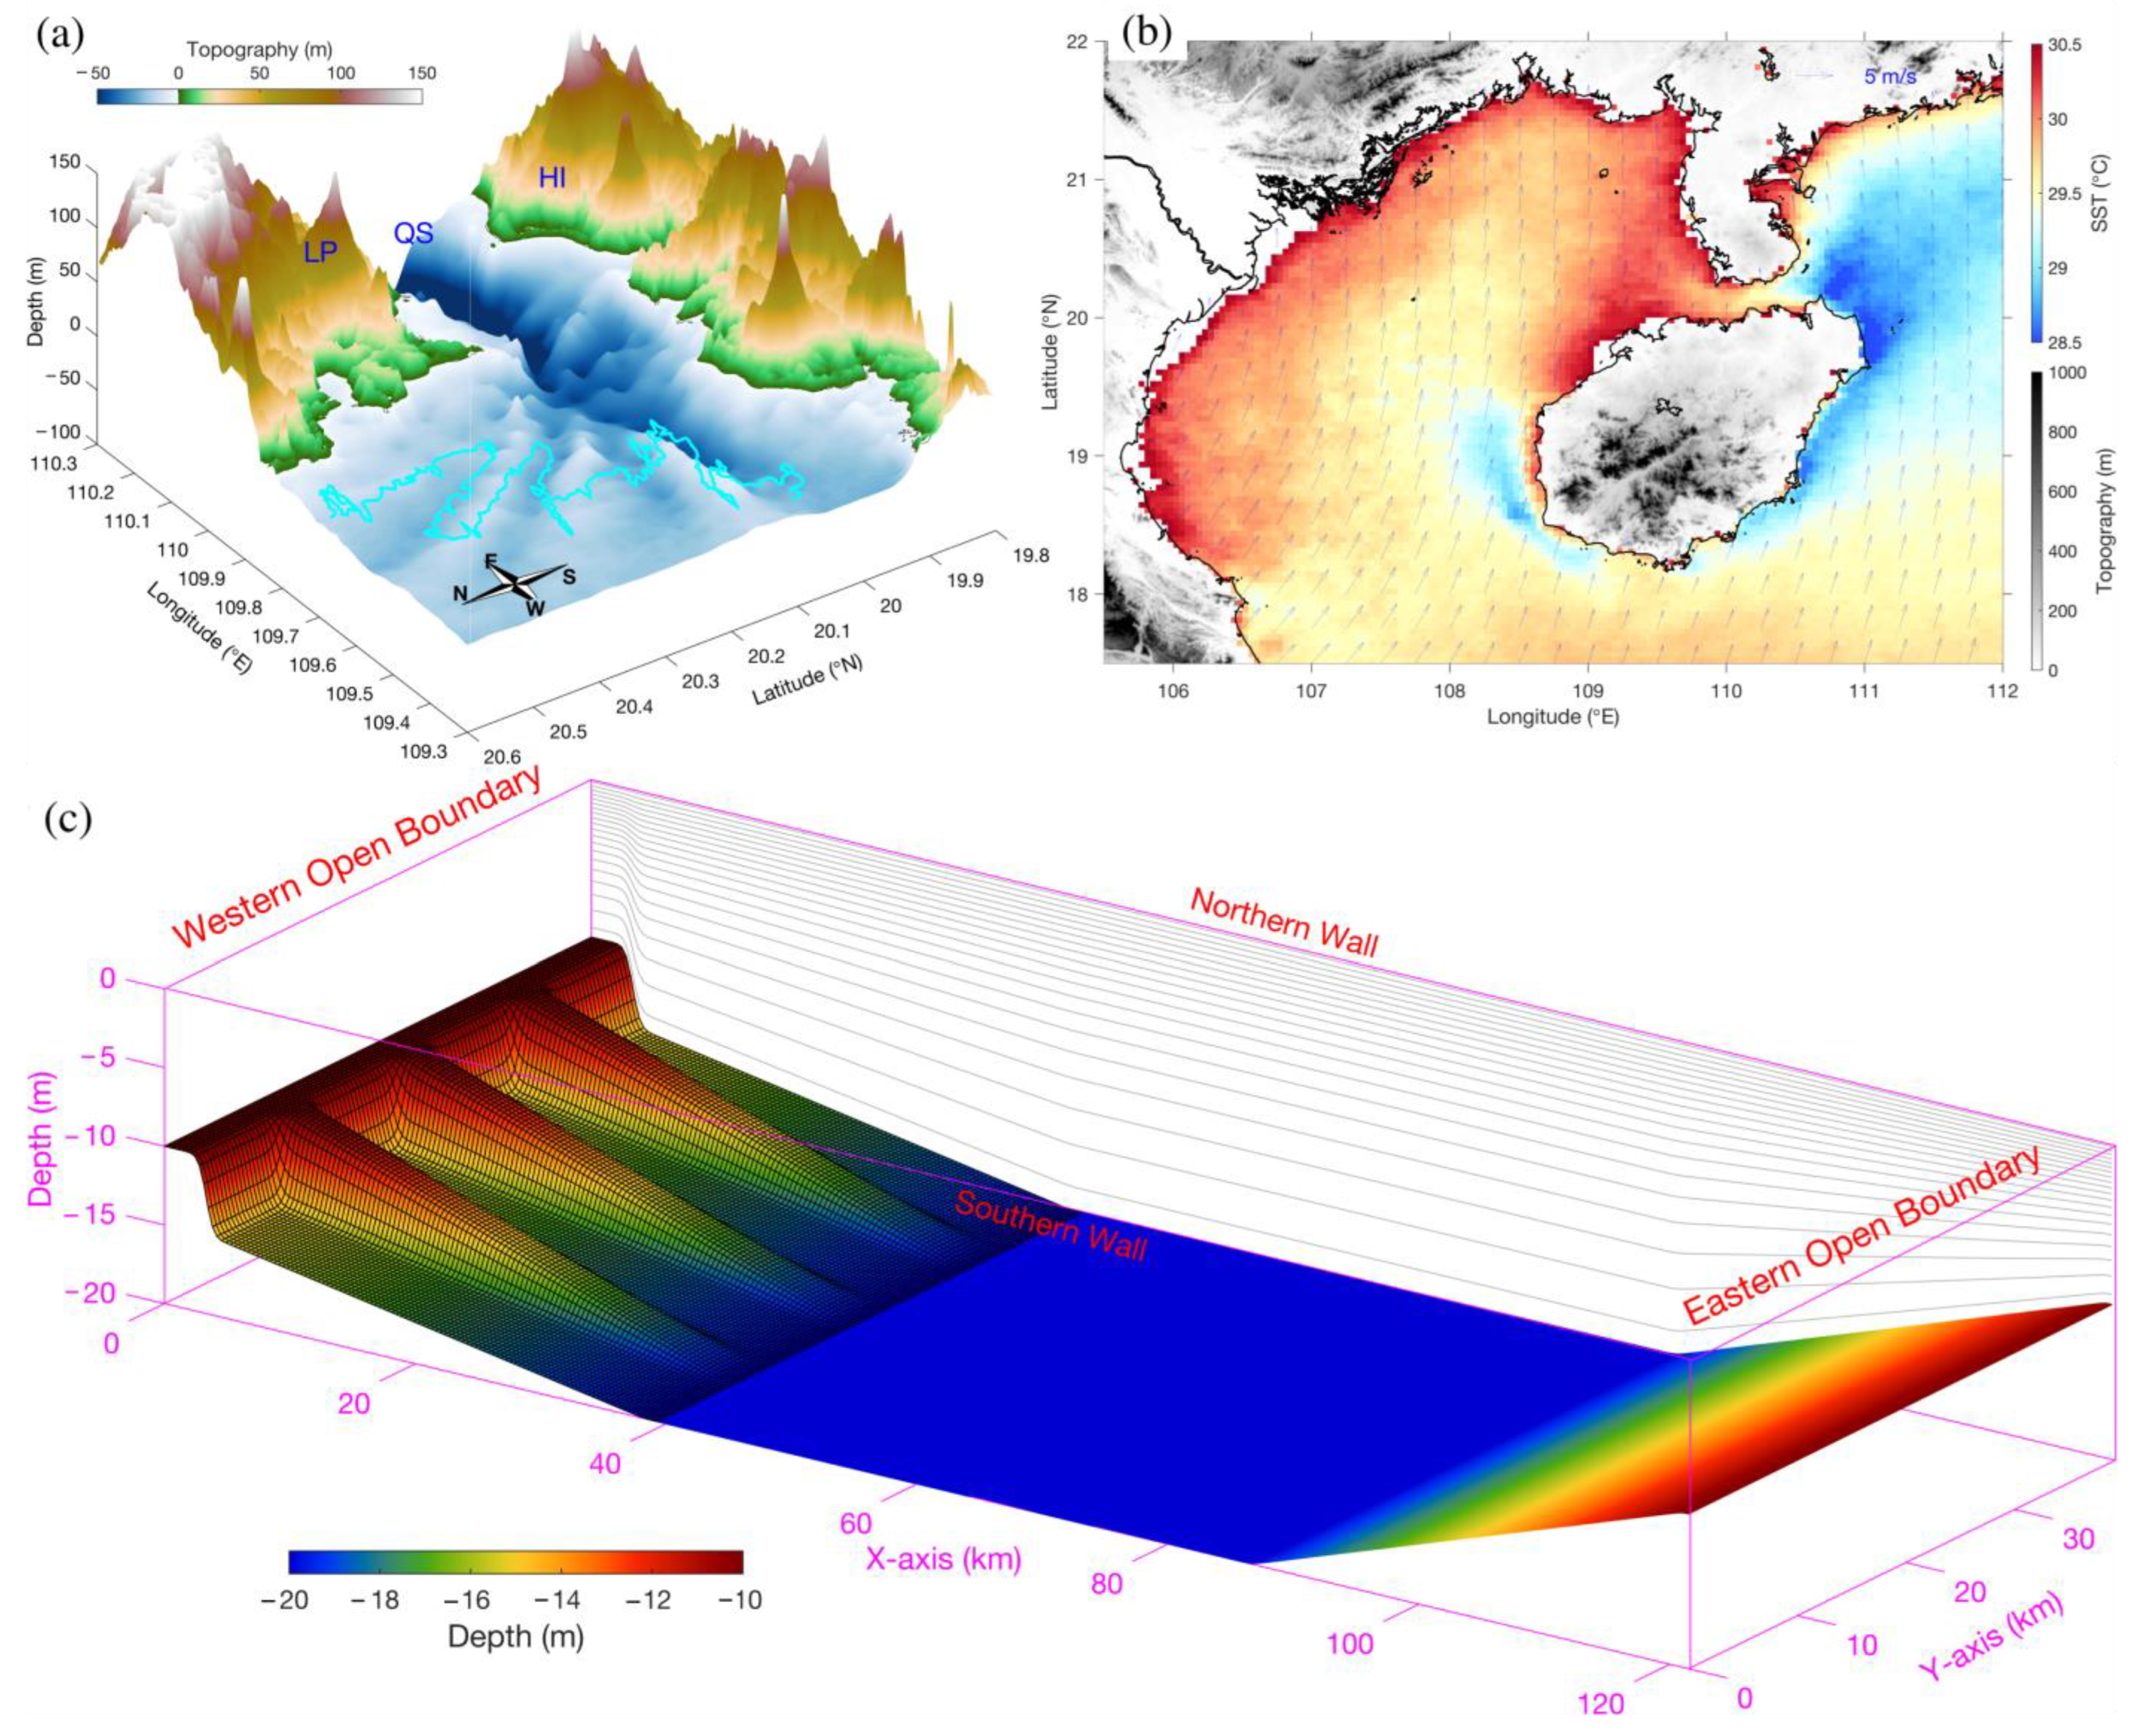
Located in the northwest of the South China Sea, the Qiongzhou Strait (QS) is a busy shipping lane between the Leizhou Peninsula and the Hainan Island (Figure 1). The averaged length, width, and water depth of the strait are 70 km, 30 km, and 44 m, respectively. Compared with two entrances, the bathymetry in the central strait is much deeper, where the depth can reach up to 120 m. As the only direct passage linking the northern South China Sea with the Beibu Gulf, water exchange through the QS plays a key role in modulating the hydrodynamics of either side [13,14,15,16].
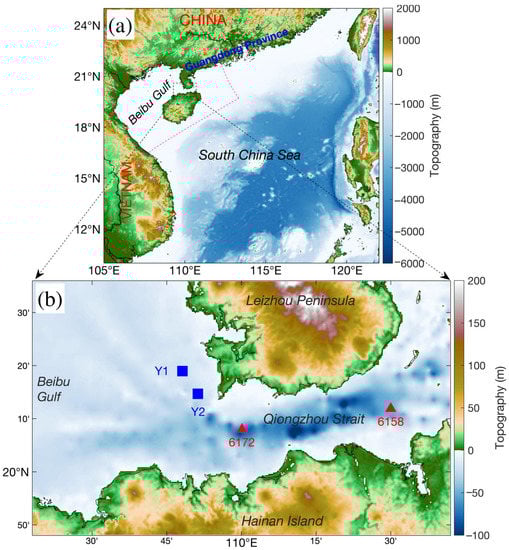
Figure 1.
(a) Topography of the study region and its adjacent seas (source: General Bathymetric Chart of the Oceans provided by the British Oceanographic Data Centre at https://www.bodc.ac.uk/, accessed on 27 August 2019), purple-dashed box marks off the modeling domain. (b) Magnified view of the topography of Qiongzhou Strait, where blue squares display the positions of two 25 h current and thermohaline observing stations while red triangles show the locations of two 25 h current observing spots.
The tidal system in the South China Sea is mainly driven by tidal energy from the West Pacific through the Luzon Strait [17]. After entering the South China Sea, both diurnal and semi-diurnal tidal waves propagate toward the southwest, the northern branch of tidal waves passes by the Guangdong coastal seas and reaches the east entrance of the QS directly. Meanwhile, tidal waves approache the southern mouth of the Beibu Gulf and further propagate into the inner bay, thereby arriving at the west entrance of the QS. Diurnal tidal waves are dominant at the western entrance of the QS while semi-diurnal ones are stronger at the eastern side; both can propagate into the strait and thus trigger nonlinear interaction after their encounter. The amplitude of diurnal tide increases westward with a value of 25 cm at the eastern entrance of the QS, but with a value of 70 cm at the western side. Conversely, semi-diurnal tides increase eastward with an amplitude of 20 cm on the west and 40 cm on the east. Together with tidal rectification over the complicated topography, nonlinear interaction between diurnal and semi-diurnal constituents plays a direct role in modifying the residual current and, consequently, the water exchange through the strait [18].
Early understanding of the residual current in the QS is based primarily on the wind-driven seasonal circulation in the South China Sea. A westward residual current occurs under the winter north wind, while the eastward residual flow is expected in summer by the prevailing south wind [19]. However, by analyzing the current meter and tide gauge data observed in the QS during 1963–1999 (37 years), Shi et al. [18] demonstrated that westward residual current persists throughout the entire year. Meanwhile, they estimate a 0.2–0.4 Sv (1 Sv = 1 × 10⁶ m3/s) transport in winter while 0.1–0.2 Sv in summer. Later, similar findings were reported based on drifting bottle records [20], hydrographic calculation [21], current mooring data [22], numerical simulation [23], and synchronous shipboard current observation [24].
Given the prevailing southwest monsoon, summertime circulation in the Beibu Gulf was traditionally considered to be anticyclonic. Such a view was challenged by increasing observations; however, no reasonable explanation was raised. By conducting a set of numerical experiments and theoretical analysis, Wu et al. [13] concluded that the westward water with high potential vorticity through the QS into the gulf is the major driving factor for the summertime gulf-scale cyclonic circulation. This finding is confirmed by subsequent observational and numerical investigations from Ding et al. [14] and Gao et al. [25]. Aside from the inflow from the QS, they proposed that wind-driven circulation also contributes to the cyclonic gyre in the gulf.
To date, good understandings of the water exchange through the QS, including the residual current, its physical mechanism, its temporal variation, and its effect on the circulation in the Beibu Gulf, have already been acquired. However, we still have poor knowledge of the thermohaline structure of the water discharged through the QS into the Beibu Gulf. Inspired by high-resolution satellite-retrieved sea surface temperature (SST) images, we explored the summertime water exchange at the western entrance of the QS from the perspective of thermal characteristics with multi-source observations and numerical simulations. The main goal of this work is to elucidate the thermal feature associated with water exchange at the western entrance of the QS, thereby obtaining further insight into the interplay between the QS and the Beibu Gulf.
The remaining parts of this paper are organized as follows: Section 2 introduces the data and method employed in this work; Section 3 illustrates an interesting SST structure at the western entrance of the QS captured by satellite images, model validation, and vertical thermal structure and spatiotemporal evolvement of the studied waters; Section 4 discusses the controlling factors of summertime thermal feature associated with water exchange in the research area; and finally, a brief conclusion is presented in Section 5.
2. Materials and Methods
2.1. Remote-Sensed SST
A satellite-observed SST is a powerful material in studying the ocean environment, which has been widely used in exploring marine heat waves [26,27,28,29], marine ecosystem [30,31], ocean front [32,33], mesoscale eddy [34,35], typhoon [36], and many other vital processes. In this work, we employed the Level-2 SST products observed by the Visible and Infrared Imager/Radiometer Suite (VIIRS) and the Moderate Resolution Imaging Spectroradiometer (MODIS) on 31 July 2014, both data are available on http://oceancolor.gsfc.nasa.gov/ (accessed on 16 January 2020). The VIIRS and MODIS Level-2 SST images characterize high spatial resolution, which are and , respectively. High-resolution SST data is powerful in capturing and analyzing the detailed thermal structure of the studied region. Satellites Aqua and Terra are both equipped with MODIS instruments, i.e., MODIS-A and MODIS-T SST, both of which are employed in this study. The SST data with low retrieval quality flags are deprecated for a reliable analysis. To map the climatological SST structure of the studied region, the MODIS Level-3 monthly-averaged SST data were also utilized.
2.2. Satellite-Observed and Reanalyzed Winds
The wind vectors measured by the Advanced Scatterometer (ASCAT) together with the WindSat from 30 July to 1 August 2014, were utilized to better understand the dynamic background of the studied region. ASCAT is a C-band scatterometer, which provides a double swath of observations (each about 500 km wide and separated by a gap of about 360 km). The WindSat is a polarimetric radiometer: in addition to the wind vector, it can also observe sea surface temperature, soil moisture, ice and snow characteristics, water vapor, cloud liquid water, and rain rate. The ASCAT and WindSat wind vectors, with a resolution, can be acquired from the Remote Sensing System (http://www.remss.com/, accessed on 19 February 2020). Meanwhile, reanalyzed wind data provided by National Centers for Environmental Prediction (NCEP) for June–August 1998–2018 was used to map the wind rose in the studied area.
2.3. Cruise Observations
Sea cruise observations to obtain in-situ data in the western entrance area of the QS were conducted from 7–9 September 2021, and two sampling stations (Y1 and Y2) are displayed in Figure 1b. A Sea-Bird SBE 37-SMP CTD (Conductivity-Temperature-Depth) was deployed to measure the temperature, salinity, and depth, meanwhile, a JFE INFINITY-EM AEM-USB electromagnetic current meter was utilized to gain synchronous information of the current. The observations at both stations lasted for 25 h, moreover, instruments were dragged up and dropped down hourly to obtain the physical parameters at the surface, middle, and bottom layers. It should be noted that due to the intense current, the obliquity of the rope tying the instruments was large at some moments, even after adding heavy sinkers, and thus the actual depths of the three layers kept changing. Nevertheless, these in situ data provide convincing information regarding water exchange in the studied area. For examining the reliability of the numerical model, current profiles acquired at two 25 h stations (6158 and 6172, Figure 1b) during the China General Oceanographic Survey in February 1959 were also utilized.
2.4. Numerical Modeling
In addition to multi-source observations, realistic simulations and idealized modeling based on Regional Ocean Modeling System (ROMS) were also used to explore the water exchange process in the studied region. The ROMS is an advanced split-explicit, free-surface, and terrain-following modeling system [37], which is shared by a large user group around the world with applications ranging from entire ocean basins to coastal sub-regions.
For the realistic simulations, a curvilinear orthogonal grid with local refinement in the QS was constructed (purple-dashed box in Figure 1a), meanwhile, a 20-level stretched terrain-following coordinate was applied. Tidal harmonic constants of M2, S2, N2, K2, K1, O1, P1, Q1, Mf, and Mm tidal constituents interpolated from TPXO7 data [38] were adopted as tidal forcing. Both initial and boundary conditions were derived from the HYbrid Coordinate Ocean Model (HYCOM) product. Over the sea surface, heat and freshwater fluxes were provided on the basis of the Comprehensive Ocean-Atmosphere Dataset (COADS05) [39].
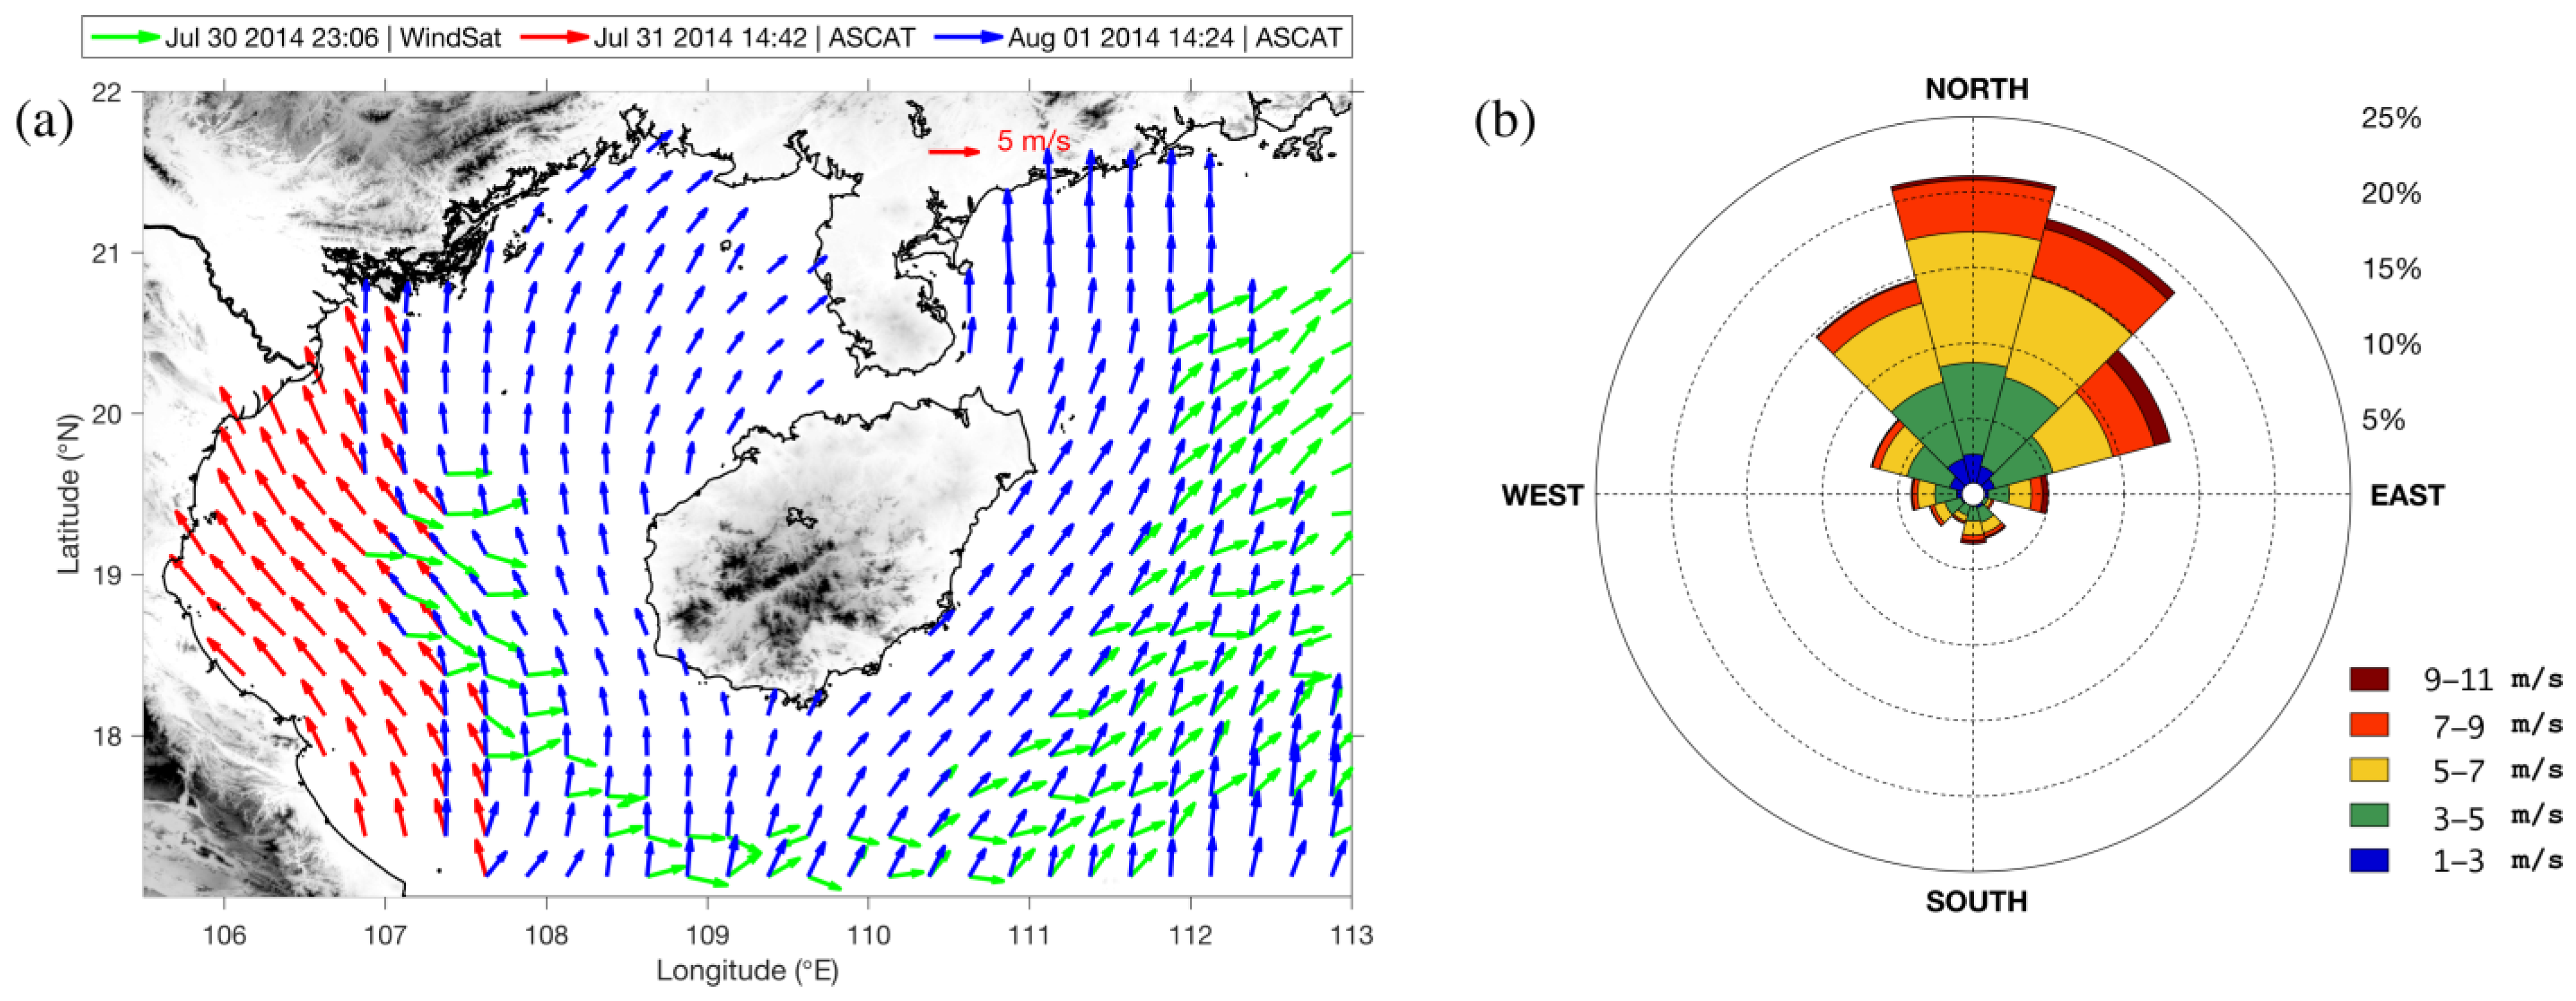
In agreement with the synoptic wind pattern shown in Figure 2a, wind rose (Figure 2b) also suggests that southwest, south, and southeast winds are dominant over the northwestern South China Sea during summer. To examine the roles of different winds, three numerical cases forced by spatially uniform winds with direction of 45°, 0°, and 315° were conducted, which were named EXP_D45, EXP_D0, and EXP_D315, correspondingly. Meanwhile, the wind strength was set to an average value: 0.035 N/m2 for these three cases. For EXP_D45, EXP_D0, and EXP_D315, depth of the model was interpolated from the General Bathymetric Chart of the Oceans (GEBCO_2019), a high-resolution bathymetric data set at 15 arc-second intervals provided by the British Oceanographic Data Centre (https://www.bodc.ac.uk/, accessed on 27 August 2019). To clarify the effect of topography, a case named EXP_TOPO, of which the water depth was derived from the Earth topography five-minute grid (ETOPO5), was designed. As a low-resolution bathymetric product, ETOPO5 poorly maps the local topography, and all configurations except the depth of EXP_D45 and EXP_TOPO are the same.
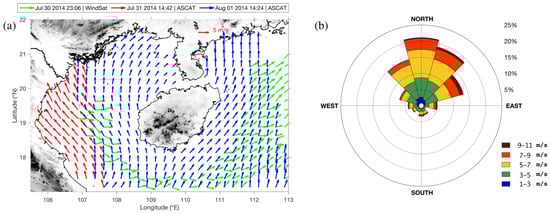
Figure 2.
(a) Wind vectors observed by WindSat and ASCAT-A from 30 July to 1 August 2014. (b) The wind rose in the studied area based on the NCEP reanalyzed wind data for June–August 1998–2018. Note: wind direction follows oceanological convention.
Further, a barotropic tidal experiment named EXP_BT was conducted using the same computational grid and tidal forcing as EXP_D45. EXP_BT initialized from a static state and no stratification was considered. The hourly output of EXP_BT was validated against the 25 h current observations at stations 6158 and 6172, besides, it was also processed to obtain tidal harmonic constants. A summary of the above experiments is presented in Table 1. For the idealized modeling, the key configurations were based on a series of foreshadowing analyses, which will be introduced in Section 4.1.

Table 1.
Configurations of realistic numerical experiments.
2.5. T_Tide Matlab Toolbox
The T_Tide Matlab toolbox [40] was utilized to process the time series of tidal currents simulated by the ROMS model and acquire the tidal harmonic constants. Through doing so, the tidal current pattern in the western entrance area of the strait at any given time could be efficiently hindcasted.
3. Results
3.1. Trident-Shaped SST Tongue
Figure 3a,b show the SST over the northwestern South China Sea captured by VIIRS and MODIS-A at 18:12 UTC and 18:50 UTC on 31 July 2014, respectively. As Figure 3 reveals, three independent upwellings developed off the northeast, southeast, and west shores of Hainan Island in summer. From 30 July to 1 August 2014, the northwestern South China Sea was mainly dominated by southerly winds (Figure 2a). The cooperation between wind-induced offshore Ekman transport and the shoreline is the primary driving force in the development of upwelling off the southeast coast of Hainan Island [41,42,43,44,45,46]. In addition to the wind, topography-current interaction and strong tidal mixing are reported to play a vital role in the development of upwelling off the northeast shore of Hainan Island [15,16,46]. The prevailing southerly wind exerts an inhibiting effect on the upwelling off the west coast of Hainan Island, whose growth is basically driven by the pressure gradient force triggered by the local tidal-mixing front [47,48,49].
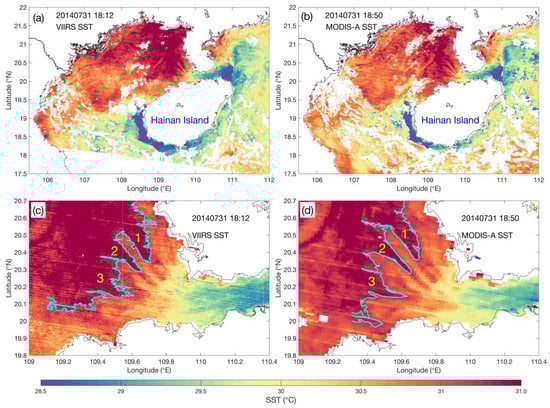
Figure 3.
Level-2 SST observations from VIIRS (a) and MODIS-A (b) at 18:12 UTC and 18:50 UTC on 31 July 2014, respectively. (c,d) are magnified views of (a,b) over the western entrance area of QS, respectively. Cyan contours display the isotherms, marking off warm water tongues’ peripheries. Note: “1”, “2”, and “3” are used to mark off three branches of the observed trident-shaped warm water tongue, respectively.
The cold core of the upwelling off the northeast coast of Hainan Island is located in the eastern entrance area of the QS; therefore, under the joint influence of westward residual flow and the strong westward tidal current, the cold upwelling water is transported deep into the inner strait and arrives at the Beibu Gulf (Figure 3a,b). To further explore how the cold upwelling water influences the water exchange between the QS and the Beibu Gulf, magnified views of Figure 3a,b over the western entrance area of the QS are presented in Figure 3c,d, respectively. Due to strong tidal mixing [50], well-mixed warm water occupies the sea adjacent to the western entrance of the QS, which will certainly encounter the cold water originating from the east at the western entrance. The time interval between VIIRS and MODIS-A observations was 38 min. Minor SST differences are found between the two images and both images map an interesting SST structure: the warm water tongue characterized by a sharp trident shape in the western entrance area of the QS (Figure 3c,d). This is the first report of the trident-shaped SST tongue in the research area, and such a phenomenon indicates that water exchange at the western entrance of the strait, particularly its thermal feature, is worth further investigation. Next, the ROMS model was used to uncover the physical mechanism of the trident-shaped warm tongue and elucidate the thermal feature during water exchange between the QS and the gulf.
3.2. Validation of Model Results
Before employing the simulated results for further analyses, it is necessary to validate the modeling performance, particularly the ability in mapping the tidal current and the SST structure.
3.2.1. Tidal Current
Owing to the constricting effect of the narrow strait, the tidal current in the QS is rather strong, and the maximum possible tidal current velocity could exceed 2.4 m/s in most areas of the strait [51]. Besides, the westward residual flow in the QS is a result of tidal rectification over varying bathymetry [14,18]. Thus, validation of the simulated tidal flow is a critical work before discussing the thermal feature of the water exchange.
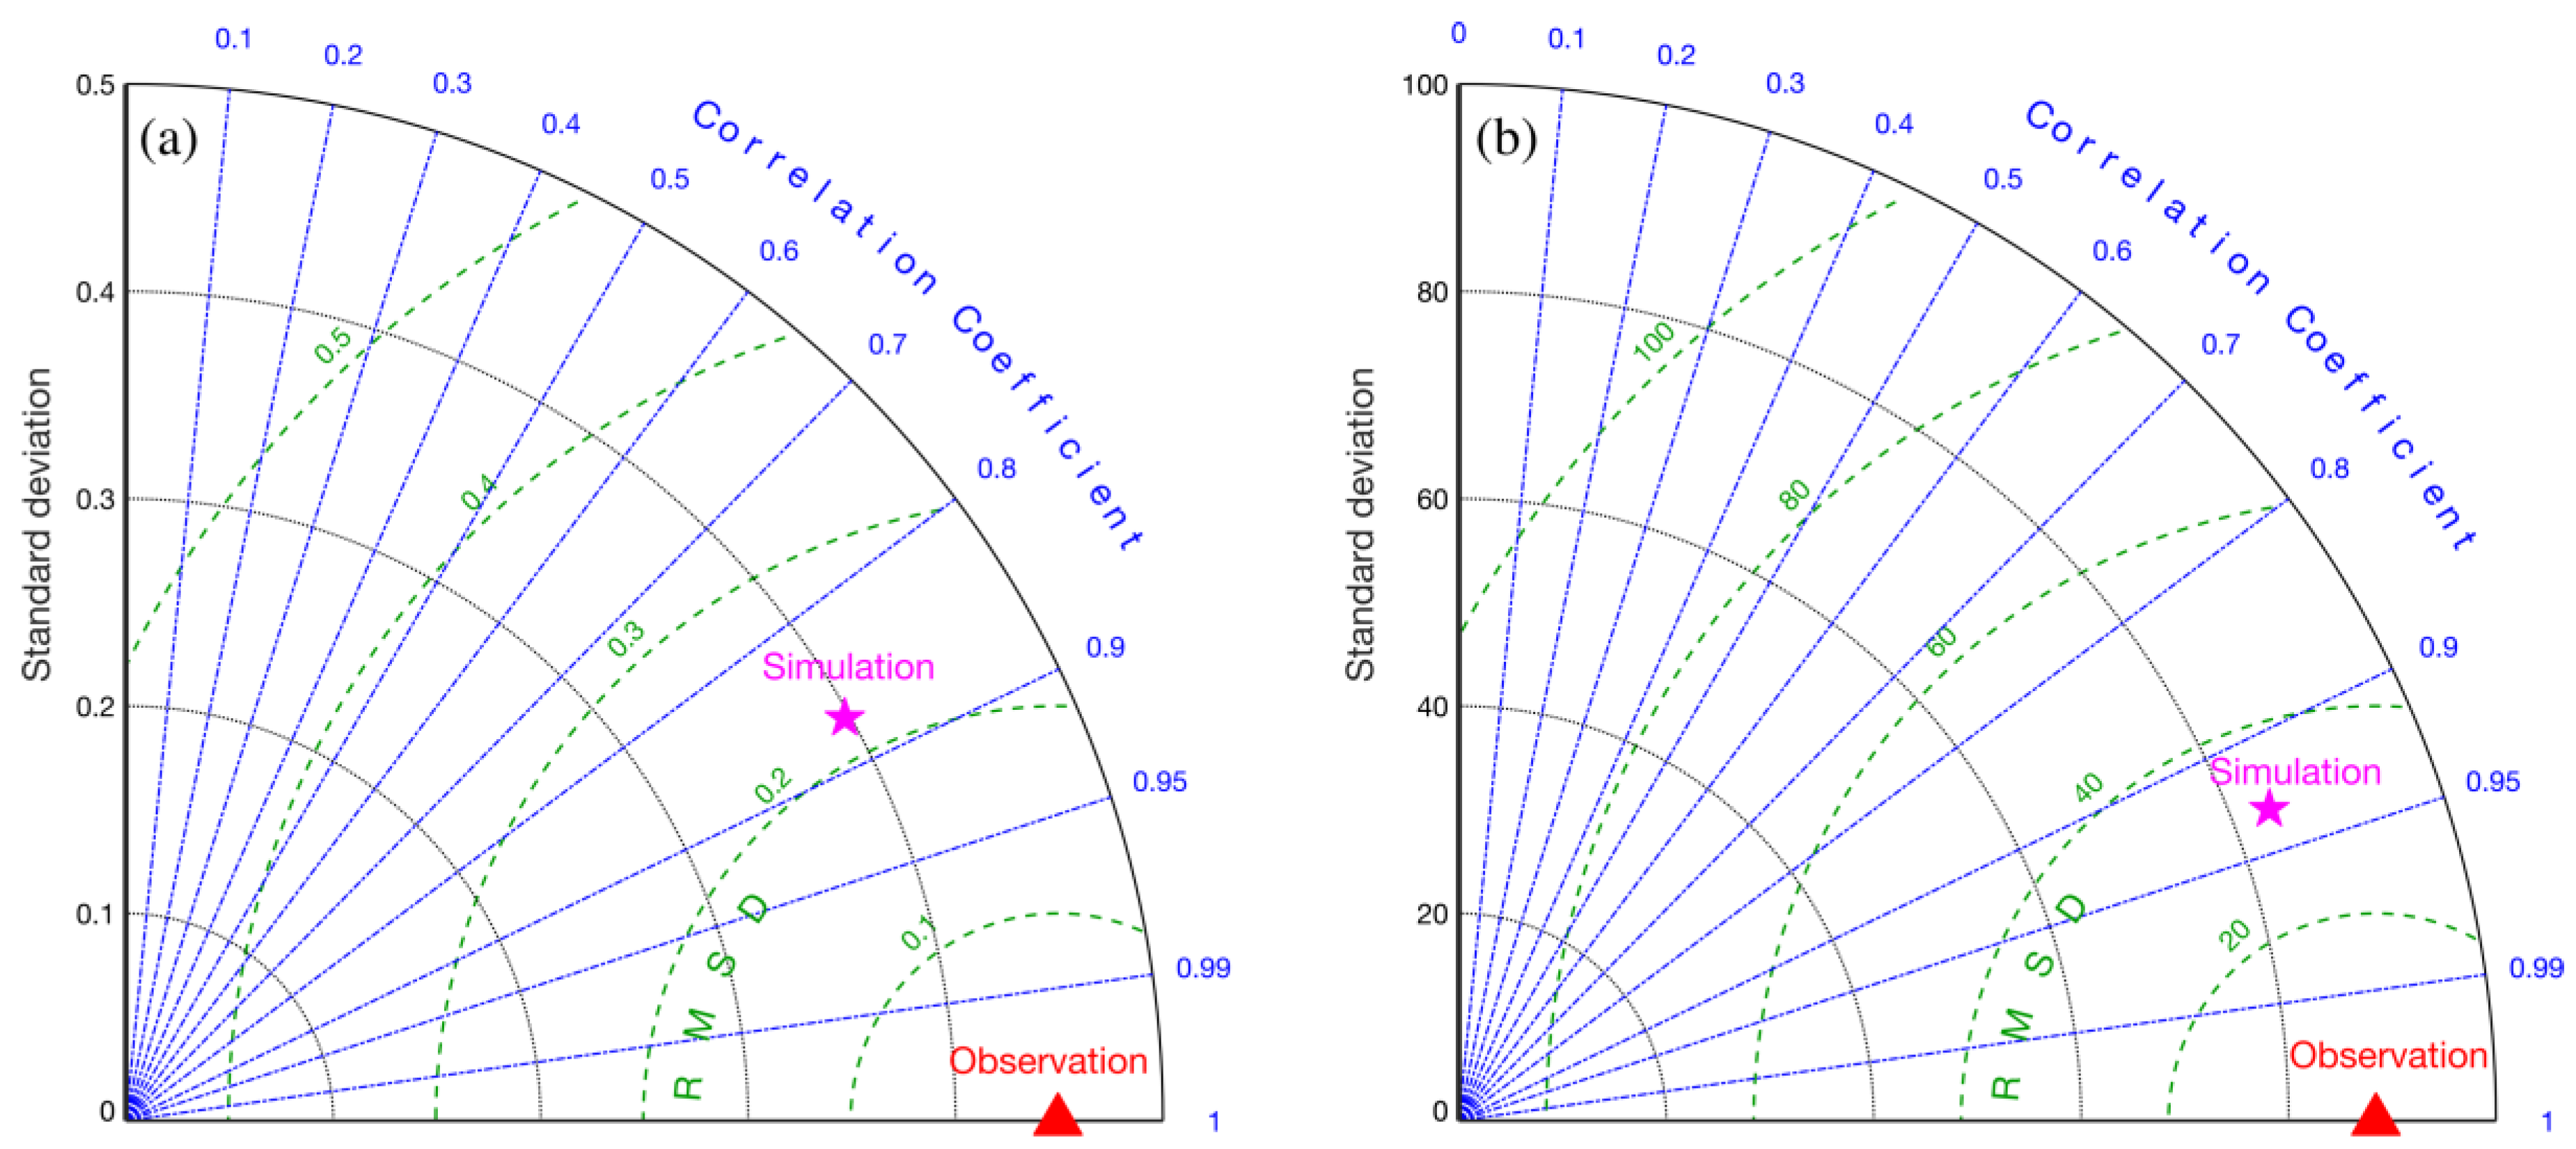
Using the current measured at stations 6172 and 6158, a robust statistical assessment of the model’s hindcast skill is displayed in the form of a Taylor diagram [52]. The correlation coefficients, centred root mean square differences, and normalized standard deviations between observed and simulated current magnitude are shown in Figure 4a, while a comparison of the current direction is presented in Figure 4b. The correlation coefficients, centred root mean square differences, and normalized standard deviations for current magnitude (direction) are 0.87 (0.93), 0.22 (31.77), and 0.40 (83.72), respectively. The differences between observed and modeled current may be caused by the absence of wind forcing and stratification. Nevertheless, Figure 4 suggests the model can reasonably simulate the tidal current in the QS.
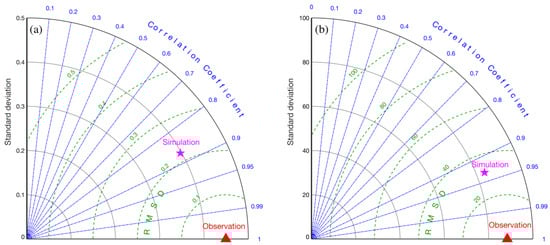
Figure 4.
Taylor diagrams for the validation of current magnitude (a) and direction (b). Note: the radial distance from the origin is proportional to the standard deviation of a pattern; the centered root-mean-square difference between the modeled and observed field is proportional to their distance apart (in the same units as the standard deviation); while the correlation between the two fields is given by the azimuthal position of the modeled field.
3.2.2. SST Structure
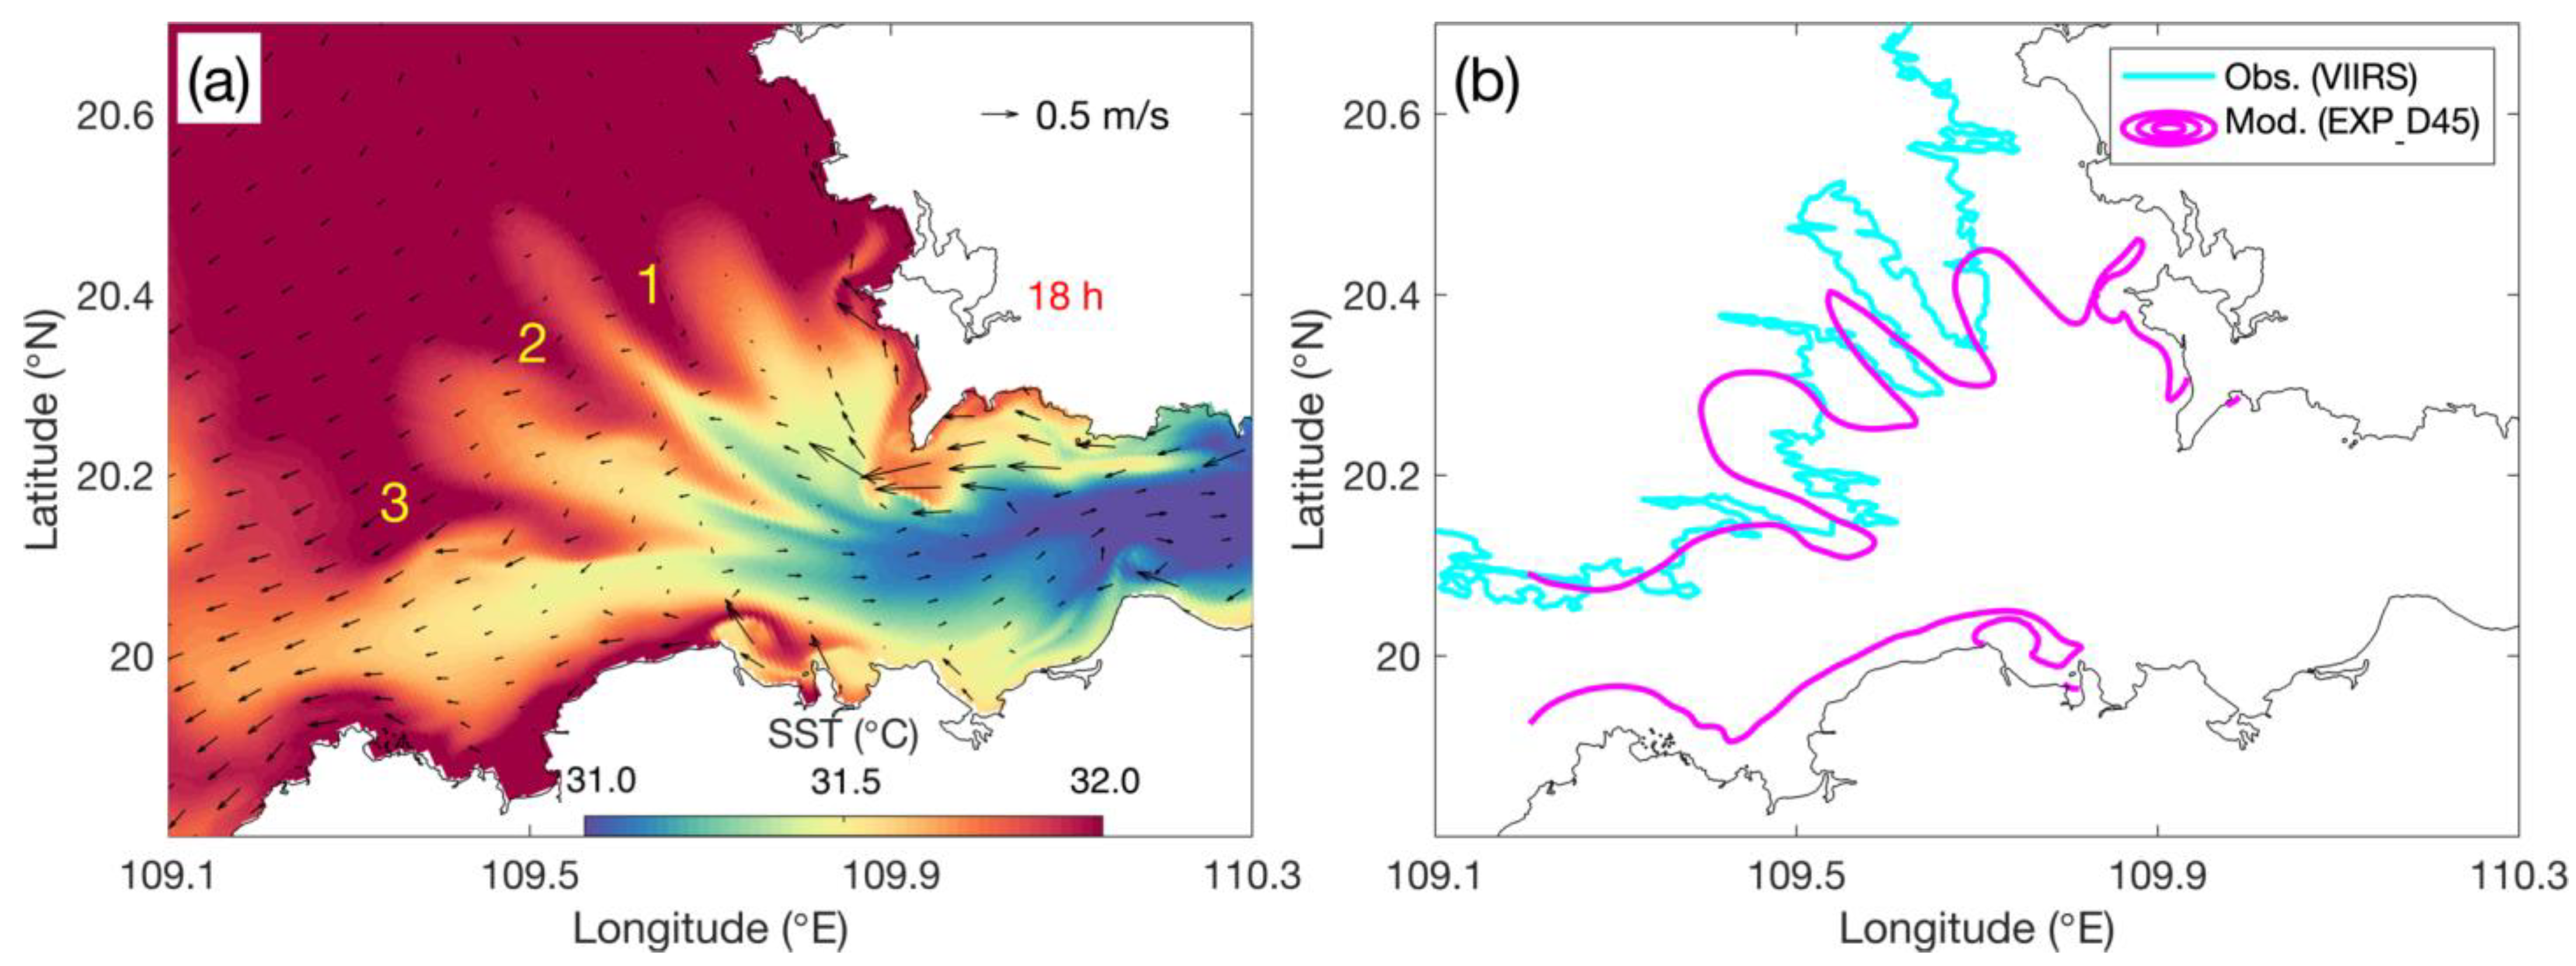
Based on EXP_D45, a snapshot of the SST field superposed by the surface current vectors is shown in Figure 5a, and at this moment, the tidal current was experiencing a transition from eastward to westward. As displayed in Figure 5a, a trident-shaped warm water tongue is successfully reproduced by the model. Taking the periphery of the warm tongue measured by VIIRS (Figure 3c) as a reference, Figure 5b makes a direct comparison of the observed and modeled warm water tongue structure, which further suggests a fairly good consistency. We noticed that significant discrepancies lie in the intensity and location of the warm tongue, which will be explained in the discussion part. The reasonable performance of the model is qualified for exploring the physical mechanisms controlling the water exchange in the studied area.

Figure 5.
(a) SST field superposed by surface current vectors modeled by EXP_D45. (b) Direct comparison between the EXP_D45 modeled (purple contours) and VIIRS observed (Cyan contours) peripheries of warm water tongues. Note: “1”, “2”, and “3” are used to mark off three branches of the simulated trident-shaped warm water tongue, respectively.
3.3. Vertical Thermal Structure
Two representative sections, in which one crosses the convex (from west to east) warm water tongue (section AB, Figure 6a) while another passes through the adjacent concave part (section AC, Figure 6a), were selected to show the vertical thermal structure of the western entrance area of the QS. Figure 6a,c (Figure 6b,d) display the u velocity field, isotherms, and u-w velocity vectors along sections AB and AC under westward (eastward) tidal currents, respectively. As revealed, relative warmer or colder water alternatively occupies the western entrance of the QS under the periodically eastward or westward tidal current. However, during this process, one feature remains unchanged: perpendicularly distributed isotherms suggest no (or extremely weak) stratification in the studied area. So, is this a real phenomenon?
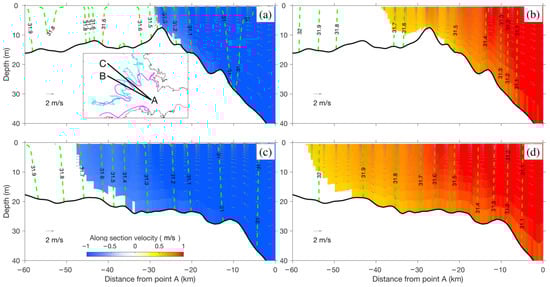
Figure 6.
The u velocity field (i.e., along-section velocity component, blue-orange contour), isotherms (green lines), and u-w velocity vectors (i.e., along-section and vertical velocity vectors, gray arrows) along section AB under westward (a) and eastward (b) tidal current. (c,d) The same as (a,b), but for section AC, respectively. Note that westward (eastward) current under 0.7 (0.5) m/s is blanked. Sections AB and AC are shown in embedded axes in (a), data in this figure are based on EXP_D45.
Observations of water temperature and current from a sea cruise conducted in the late summer of 2021 enables us to gain further understanding, and the continuous 25 h information of water temperature and current direction at stations Y1 and Y2 are mapped in Figure 7a,b, respectively. Again, just as what was revealed by the model result, a minor temperature difference over the entire water column provides convincing evidence of a rather weak stratification in the west entrance of the strait. Based on the time series of the current direction, the westward tidal current persisted longer than the eastward tidal current at both stations. However, the intensity of the eastward tidal current is much stronger than that of the westward tidal current, which could be inferred from the shallower submergence depth of the instrument under the eastward current. Moreover, at the end of the eastward (westward) tidal current the warm (cold) water signal is the strongest, indicating a vital role of horizontal advection in the thermal exchange. However, why is the water temperature vertically distributed in this way?
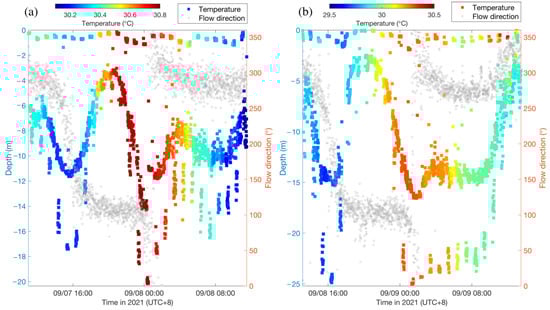
Figure 7.
Cruise Observations of water temperature and current direction at stations Y1 (a) and Y2 (b) in the late summer of 2021, respectively.
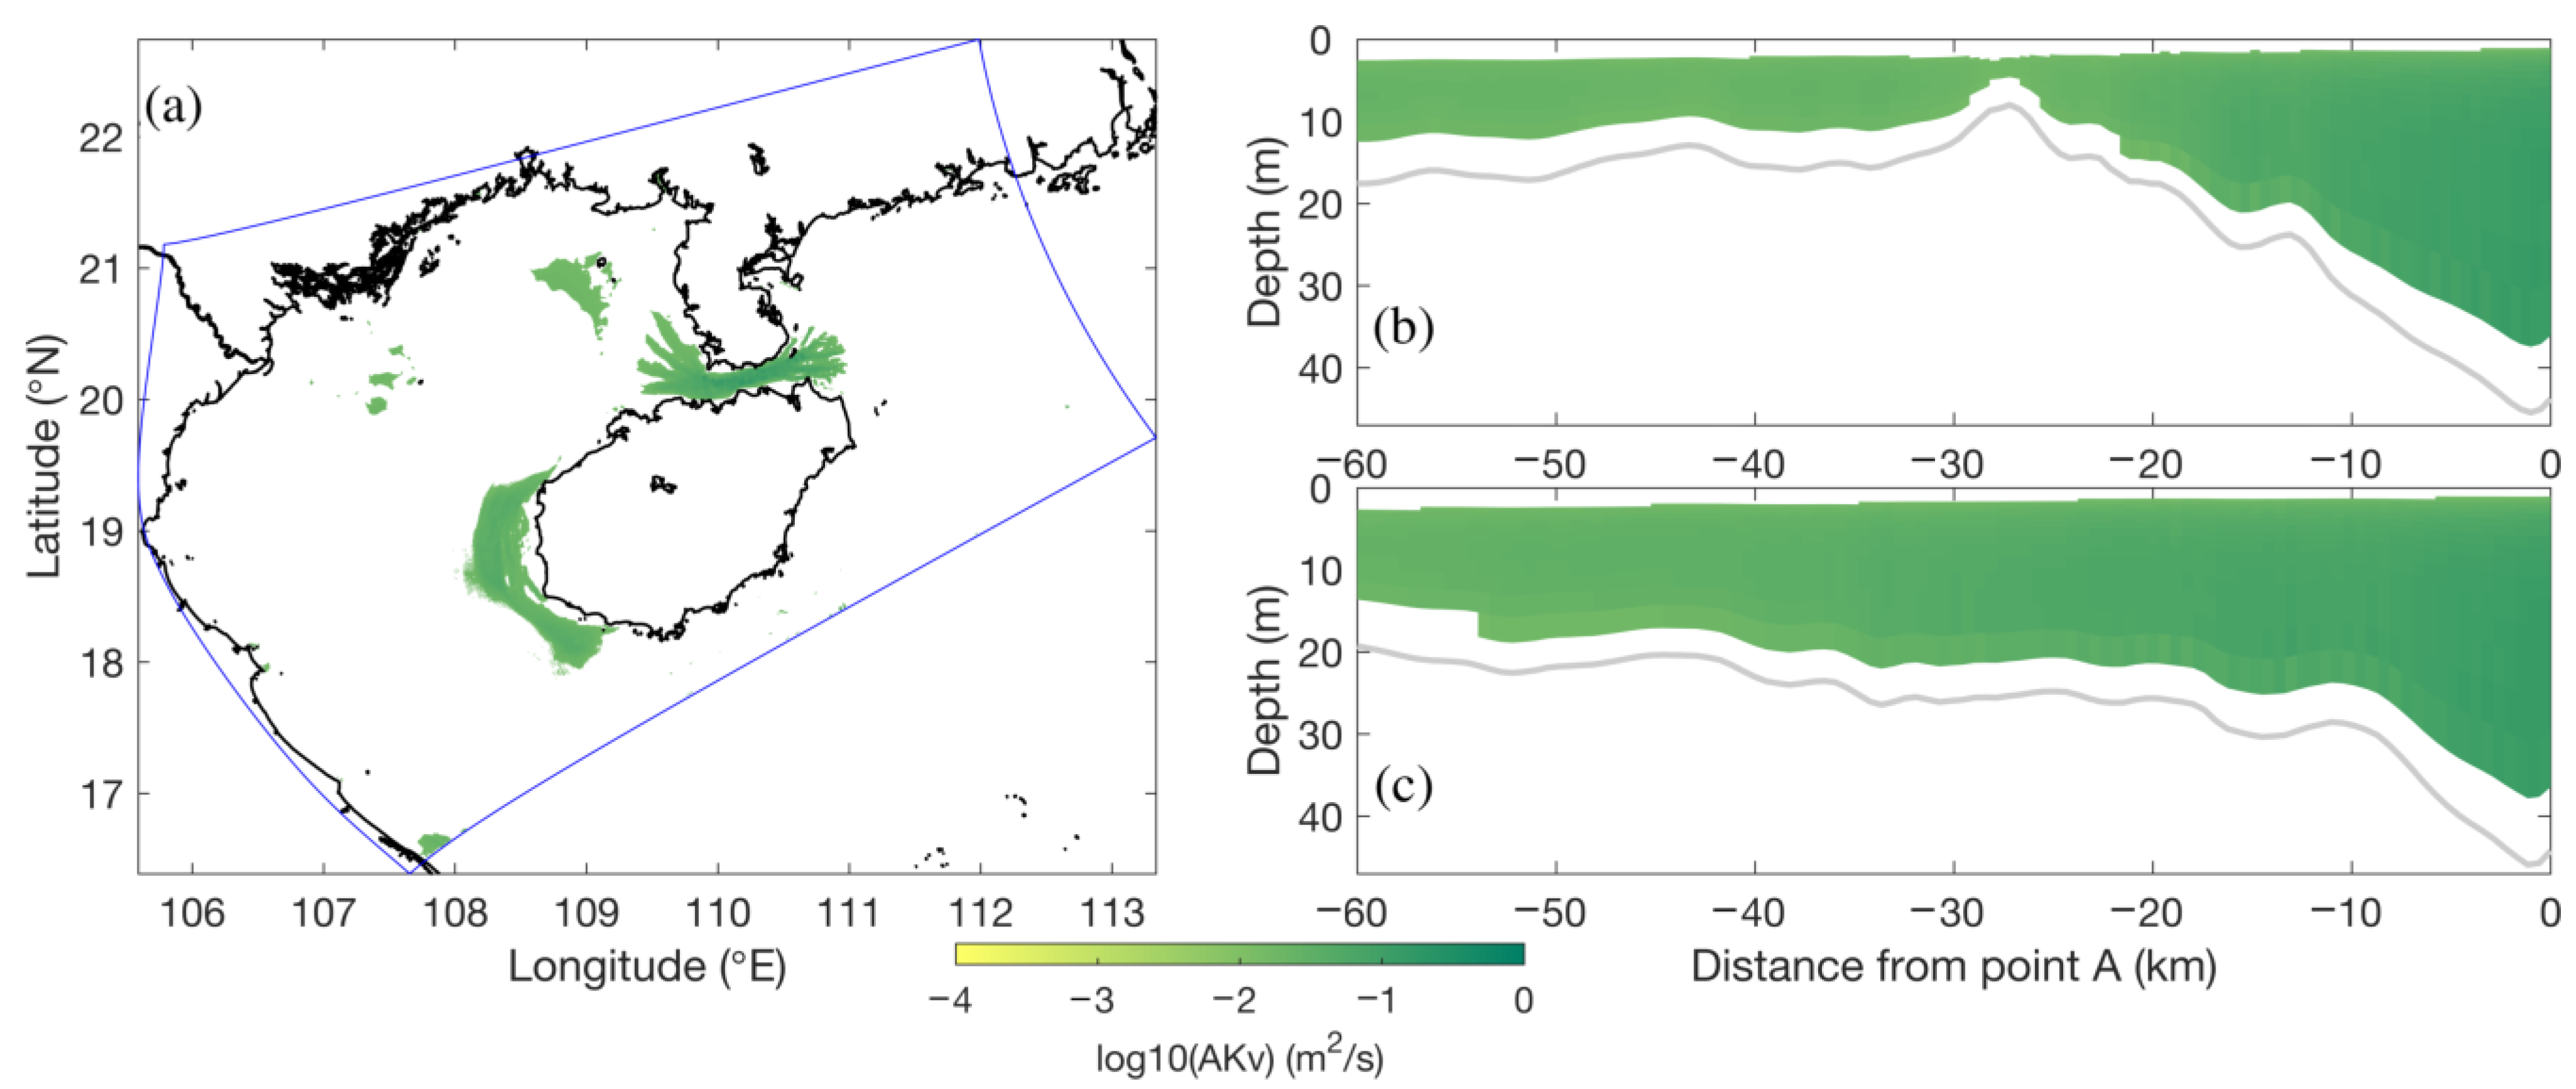
In summer, due to the local intense tidal current, strong tidal-mixing fronts will be established at two entrances of the QS and off the west coast of Hainan Island [50]. Figure 8a shows the depth-mean vertical diffusivity over the northwestern South China Sea. Only diffusivity which is stronger than 1 × 10−1.5 m2/s is mapped, which reveals good consistency with the former investigation. Further, vertical diffusivity along sections AB and AC are presented in Figure 8b,c, respectively, again suggesting a strong mixing background. Thus, in the western entrance area of the QS, strong vertical mixing certainly makes the whole water column well-mixed.

Figure 8.
(a) Depth-averaged vertical diffusivity over the northwestern South China Sea. (b,c) show the vertical diffusivity along sections AB and AC, respectively. Note that diffusivity lower than 1 × 10−1.5 m2/s is blanked, and data originates from EXP_D45.
3.4. Spatiotemporal Variation
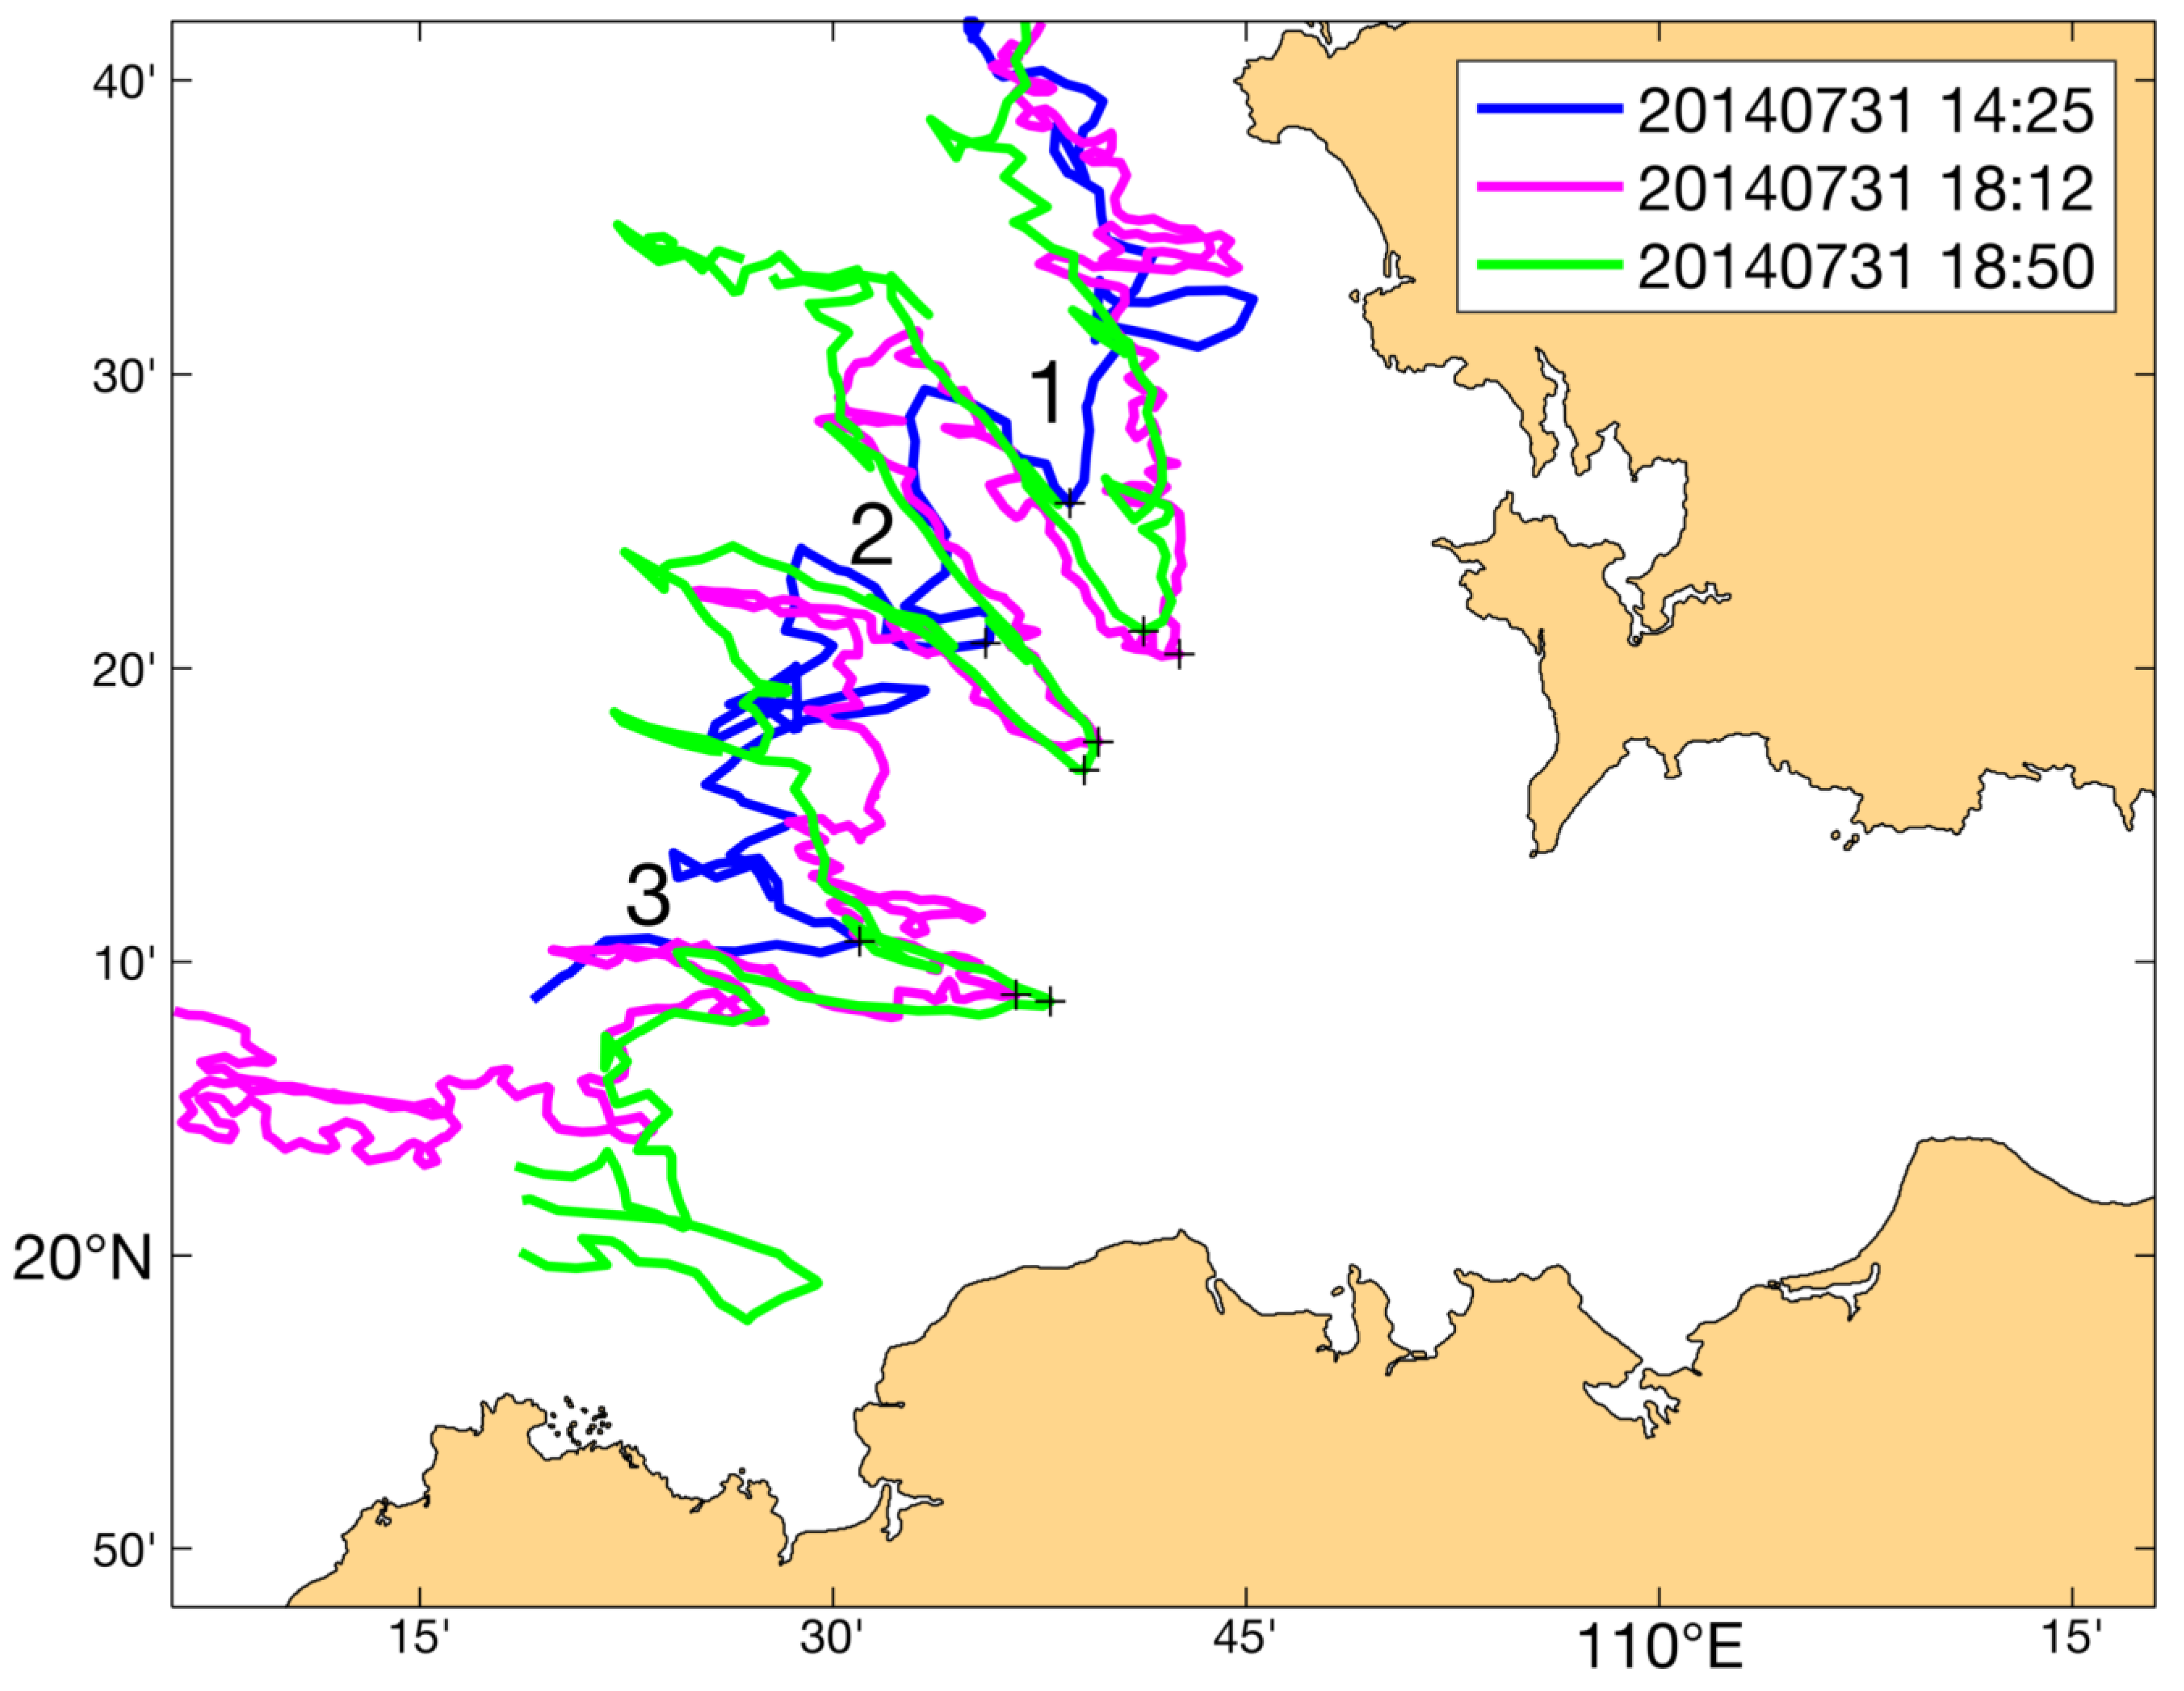
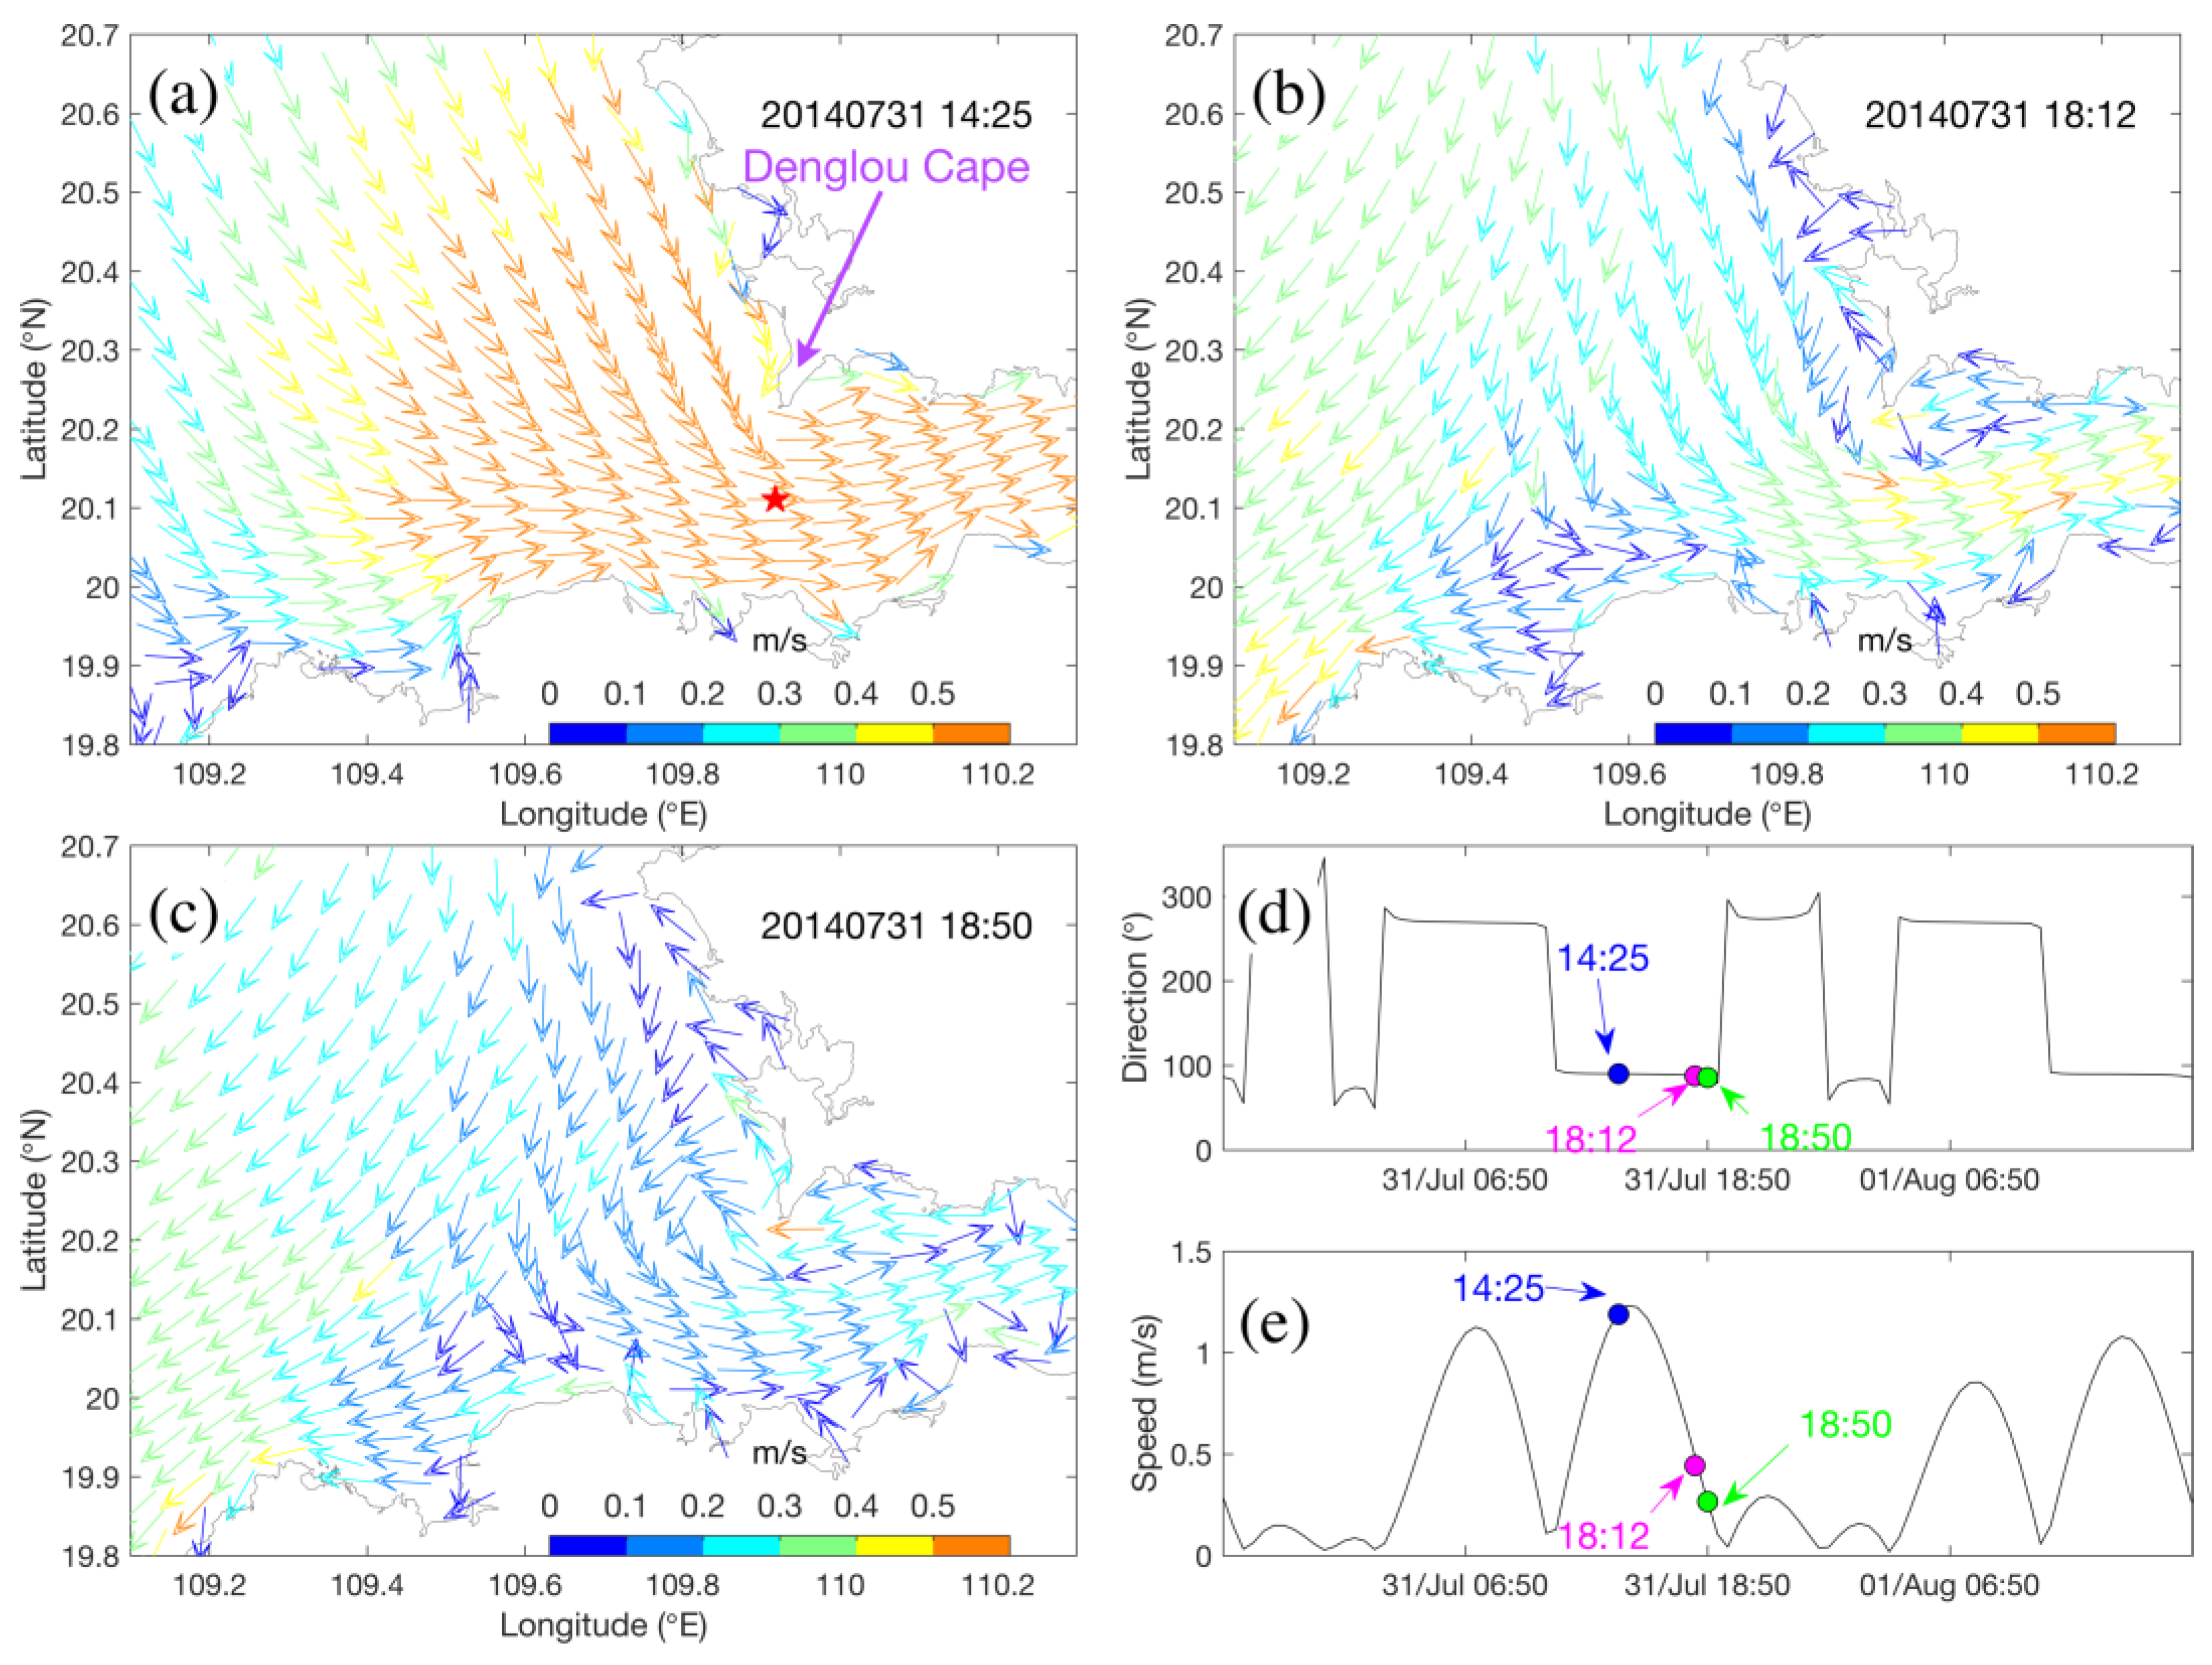
In this part, the spatiotemporal variation of the trident-shaped warm tongue is discussed. The peripheries ( isotherm) of warm water tongue observed by MODIS-T, VIIRS, and MODIS-A on 31 July 14:25, 18:12, and 18:50, 2014 are overlapped together in Figure 9. As time went on, the warm water tongue became sharper and intruded deeper toward the inner QS. During this process, the first (marked with “1”) and second (marked with “2”) branches of the trident-shaped warm tongue significantly moved toward the southeast, while the third one (marked with “3”) generally marched eastward. Based on the time interval between adjacent SST observations and the corresponding change in the location of the warm tongue vertex (black “+” in Figure 9), the moving speed of each branch could be roughly estimated, and detailed results are listed in Table 2. Overall, the trident-shaped warm tongue was propagating at a speed of ~0.7 m/s, with the third branch moving much faster at 0.76 m/s. Due to the small time gap (38 min) between the VIIRS and MODIS-A measurements, the resolution of SST images is insufficient to resolve the propagation of warm tongue and the results are not shown.
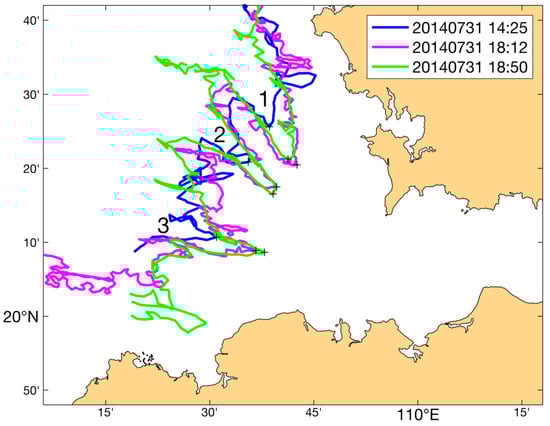
Figure 9.
The peripheries (31.2 °C isotherm) of warm water tongue observed by MODIS-T (blue contours), VIIRS (purple contours), and MODIS-A (green contours) on 31 July 14:25, 18:12, and 18:50, 2014.
Table 2.
Statistics of the movement of trident-shaped warm water tongue.
The movement of the warm water tongue is mainly dominated by the current. We obtained the tidal current harmonics by conducting tidal harmonic analysis on the half-hourly 30-day time series of the barotropic tidal currents simulated by EXP_BT. Based on these tidal current harmonics, the tidal current fields accompanying the MODIS-T, VIIRS, and MODIS-A SST observations shown in Figure 9 were efficiently hindcasted and displayed in Figure 10a–c, respectively. Meanwhile, the time series of tidal current direction and magnitude at a representative point (red star in Figure 10a) are shown in Figure 10d,e in turn. During the observing period, eastward tidal current dominated the middle area of the western entrance, but in areas farther north, the tidal current mainly pointed toward the southeast owing to the constraint of the coastline, which well explained different propagating directions of different warm tongue branches (Figure 9). The observing times of VIIRS and MODIS-A were located near the end of the eastward tidal current phase, when the current is weak (~0.3 m/s). Coupled with the short time interval, it is easy to understand why peripheries of the warm tongue mapped by VIIRS and MODIS-A almost overlapped with each other. In addition, Figure 10a–c reveals that the tidal current phase in the seas adjacent to the Denglou Cape (Figure 10a) is in advance of that in the other area, thereby taking the lead in pushing warm water back to the gulf, and this answers why the first branch of the trident-shaped warm tongue moved slightly westward while the other two still marched toward east during 18:12 to 18:50 31 July 2014 (Figure 9).
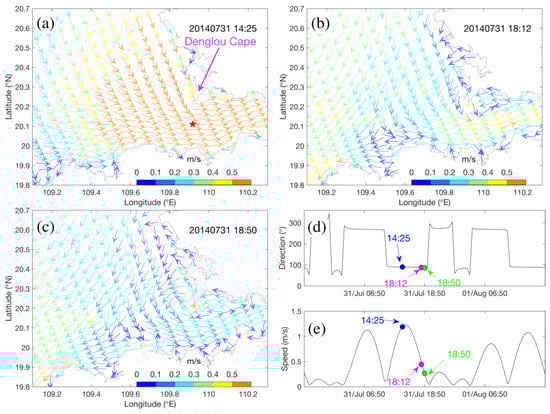
Figure 10.
(a–c) Tidal current fields accompanying those events shown in Figure 9, respectively. Time series of tidal current direction (d) and magnitude (e) at a representative point (red star in (a)), three observing times are marked off with dots in different colors.
Further, a continuous spatiotemporal evolution of the warm water tongue is presented using the model result (EXP_D45). Given the bell-shaped western entrance, a curved section name DE (Figure 11a) is chosen to show the thermal structure. Time series of section-averaged current vectors, section depth, and time variation of SST along section DE are respectively displayed in Figure 11b–d. Meanwhile, gray-dashed lines are used to mark off the topographic high and low points.
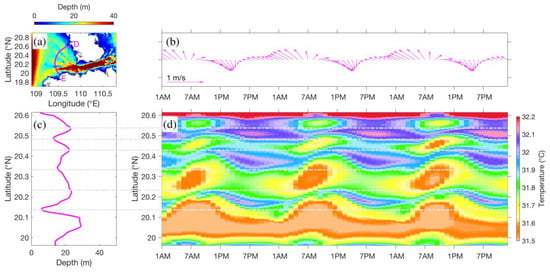
Figure 11.
(a) Curved section DE (purple line) superposed on the water depth. (b) Time series of section-averaged current vectors. (c) Water depth along section DE. (d) SST time series along section DE.
At the beginning of the eastward tidal current, warm water first appeared in the topographic low (sea trough) areas. As the current turns southeastward, the warm water propagates, following the current, and occupies the southern-adjacent topographic high (sea ridge) region. The southeastward movement of the warm water reaches its peak near the end of the eastward tidal current phase, which matches well with the information shown in Figure 7. As the westward tidal current phase begins, the warm water signal starts to disappear and is replaced by a cold-water signal above sea troughs, the cold water keeps moving northwestward and even arrives at the northern adjacent sea ridge. At the end of the westward tidal current phase, the cold water shows its strongest signal and then decays as a new cycle begins. In the meridional direction, the SST characterizes an alternatively warm and cold pattern, i.e., a trident-shaped warm water tongue. Next, using idealized numerical modeling, we explain how a trident-shaped warm water tongue develops, and why it evolves in such a way as shown in Figure 7 and Figure 11.
4. Discussion
4.1. Mechanism of Trident-Shaped Warm Tongue
Using the ROMS, an idealized numerical investigation was conducted to clarify the intrinsic physical mechanism of the trident-shaped warm tongue. Figure 11d is a strong indicator that the evolution of thermal structure is closely linked with local topography. Besides, the result (not shown) of EXP_ETOPO (this case poorly resolves the actual bathymetry) could not reproduce the trident-shaped warm water tongue. Hence, we examined the local topography in a three-dimensional view with the periphery of the warm tongue (sensed by VIIRS) superposed on it (Figure 12a). The bathymetry in the west entrance area of the strait characterizes a quasi-alternative deep-shallow pattern, and the distribution of the sea troughs are in good consistency with the trident-shaped warm water tongue. Moreover, as Figure 3a,b indicate, cold upwelling water at the eastern entrance of the QS and well-mixed warm water at the western side were the fundamental backgrounds of thermal exchange through the QS. However, these snapshots of instantaneous SST distribution may face uncertainty. Thus, the climatological summer SST and wind over the northwestern South China Sea were further examined (Figure 12b), which is in good support of the information revealed in Figure 3a,b.

Figure 12.
(a) Three-dimensional view of the topography over the western entrance area of the QS. Cyan contours are the same as that in Figure 3c (isotherm). (b) Climatological summer SST and wind around Hainan Island, the SST is derived from MODIS monthly-mean SST data and averaged over June–August 2000–2014, the wind is based on the ERA-Interim 3 h wind product and averaged over June–August 1979–2014. (c) The grid design of the idealized numerical experiments.
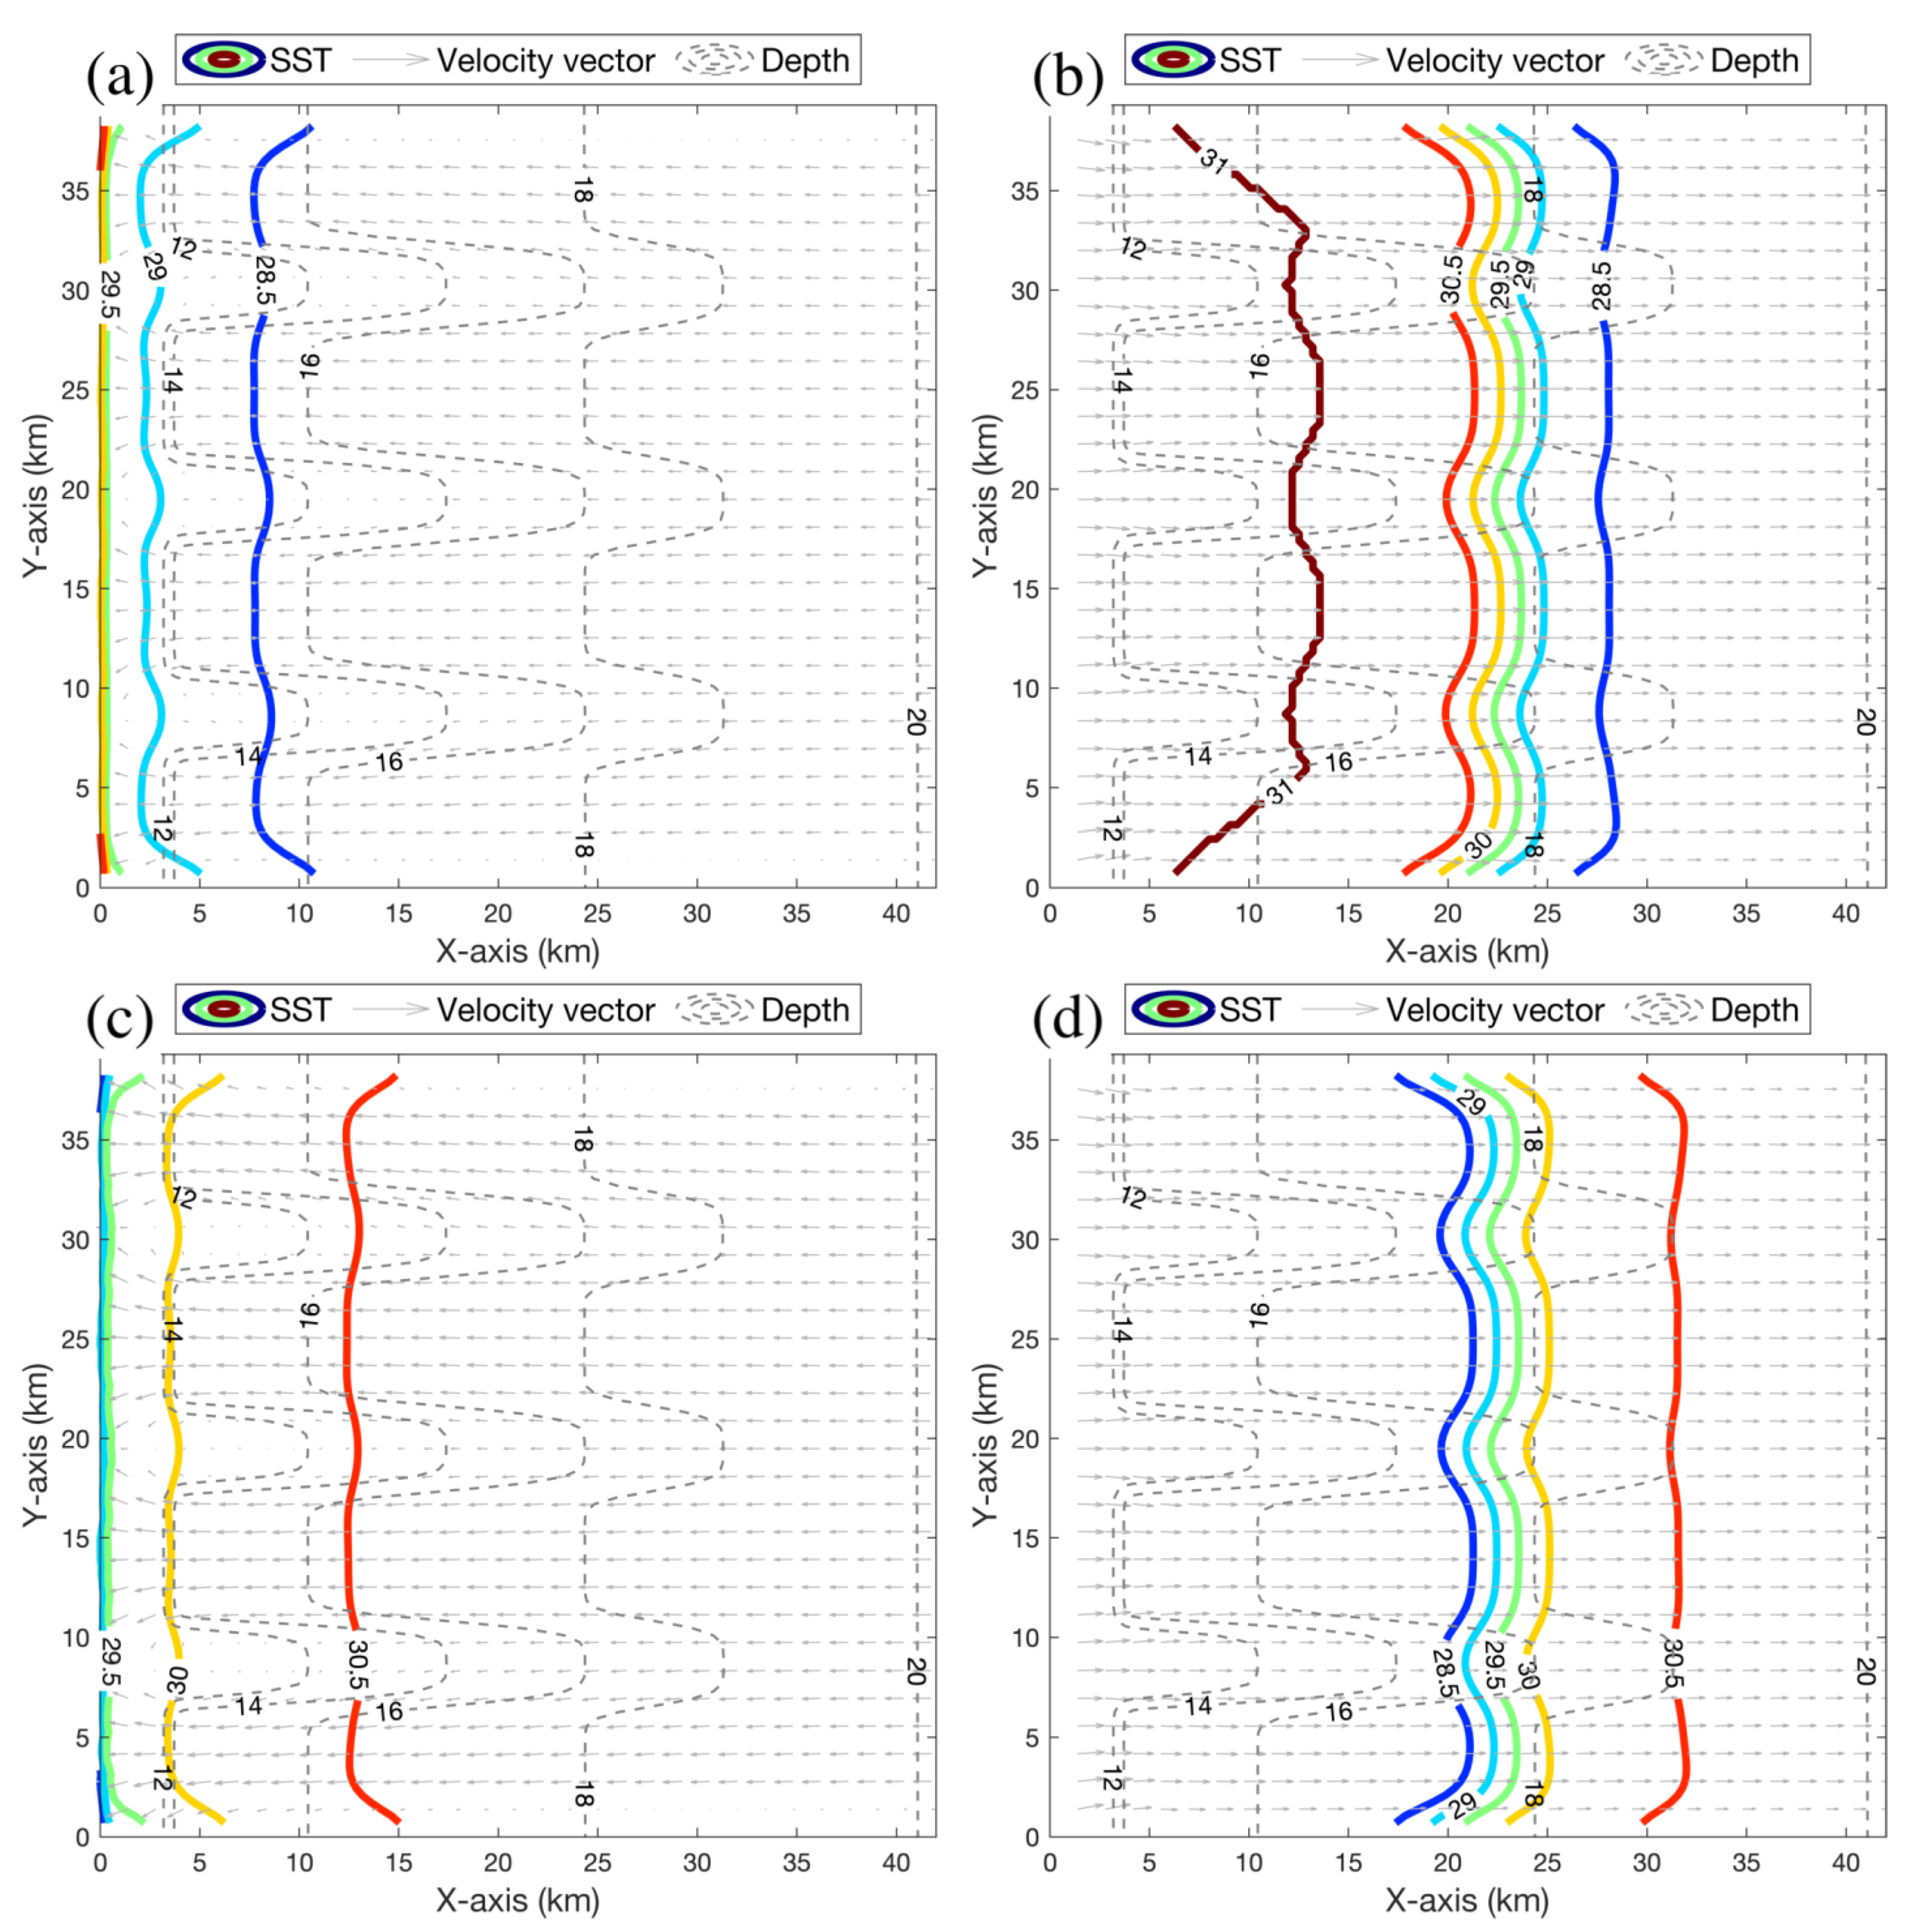
Taking the key topographic features of the QS into consideration, we first designed a cuboid modeling grid, of which the length and width are consistent with that of the QS (Figure 12c). The eastern and western boundaries of the modeling domain are open, while the remaining ones are closed. The most vital design of the grid lies in the alternatively deep-shallow water depth near the western boundary. Then, based on the above analyses, vertically homogeneous 31 °C water was added to the western boundary and 28 °C water was added to the eastern side. To reflect the periodic tidal current in the strait, a 1.5 m/s periodic reciprocating current (flow in the east-west direction) with the same phase was used to force both open boundaries. In addition to the periodic reciprocating current, a westward 0.1 m/s current was also added to the eastern boundary to account for the summertime residual flow [18,23]. The idealized model was initialized from a non-motion state, with homogeneous 29.5 °C water filling the whole modeling domain. The salinity was kept constant during the entire simulation, meanwhile all other external forcings (e.g., wind stress, heat fluxes, freshwater fluxes, tides) were all excluded to focus on exploring the dynamical mechanism. With the above configurations, an idealized experiment named EXP_ID1 was conducted. Lastly, one more idealized experiment named EXP_ID2 was designed to discuss the role of a reversed thermal background. In EXP_ID2, 28 °C and 31 °C water was added to the western and eastern boundaries, respectively, and all other configurations were exactly the same as EXP_ID1. A summary of configurations of two idealized numerical experiments can be found in Table 3.
Table 3.
Key configurations of idealized numerical experiments.
After the model achieved a quasi-steady state, SST distribution together with current vectors and water depth at the end of the westward and eastward current simulated by EXP_ID1 are shown in Figure 13a,b, respectively. Regardless of the current direction, a faster current always flows over deep-sea troughs rather than shallow sea ridges, which is due to the stronger bottom friction over shallower ridges. As a result, the eastward current carries the western warm water toward the east with faster propagation over sea troughs, and thereby the alternatively warm–cold thermal pattern develops (Figure 13b). Under the westward current, a similar situation still occurred, but with colder water traveling farther west over deep troughs. In Figure 6, sections AB and AC cross two adjacent sea ridges and sea trough, respectively. By blanking westward (eastward) current under 0.7 (0.5) m/s, it is clear that the current along section AC is always stronger than that along section AB, which may be one of the reasons for the further eastward intrusion of warm water along section AC (Figure 6a). Note that thermal exchange at the western entrance of the QS is not only regulated by a topography-modulated current, which will be discussed later.
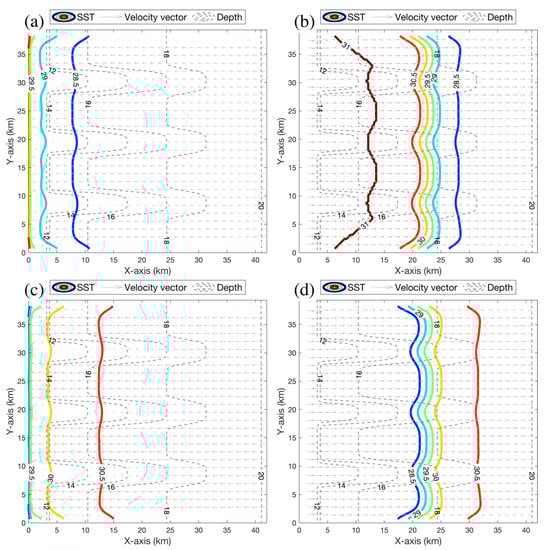
Figure 13.
SST distribution (colored contours) at the end of westward (a) and eastward (b) current simulated by EXP_ID1. (c,d) are the same as (a,b), respectively, but show results of EXP_ID2. Gray vectors display the surface current, while dashed-gray lines show the water depth.
EXP_ID2, assuming a cold background on the western side and a warm background on the eastern side (opposite against reality), was conducted and the results are displayed in Figure 13c,d. Despite the actual values of isotherms, EXP_ID2 produces a very similar isotherm structure as EXP_ID1, which further confirms the vital role of a topography-modulated current in the formation of alternatively warm–cold thermal distribution over the western entrance of the strait.
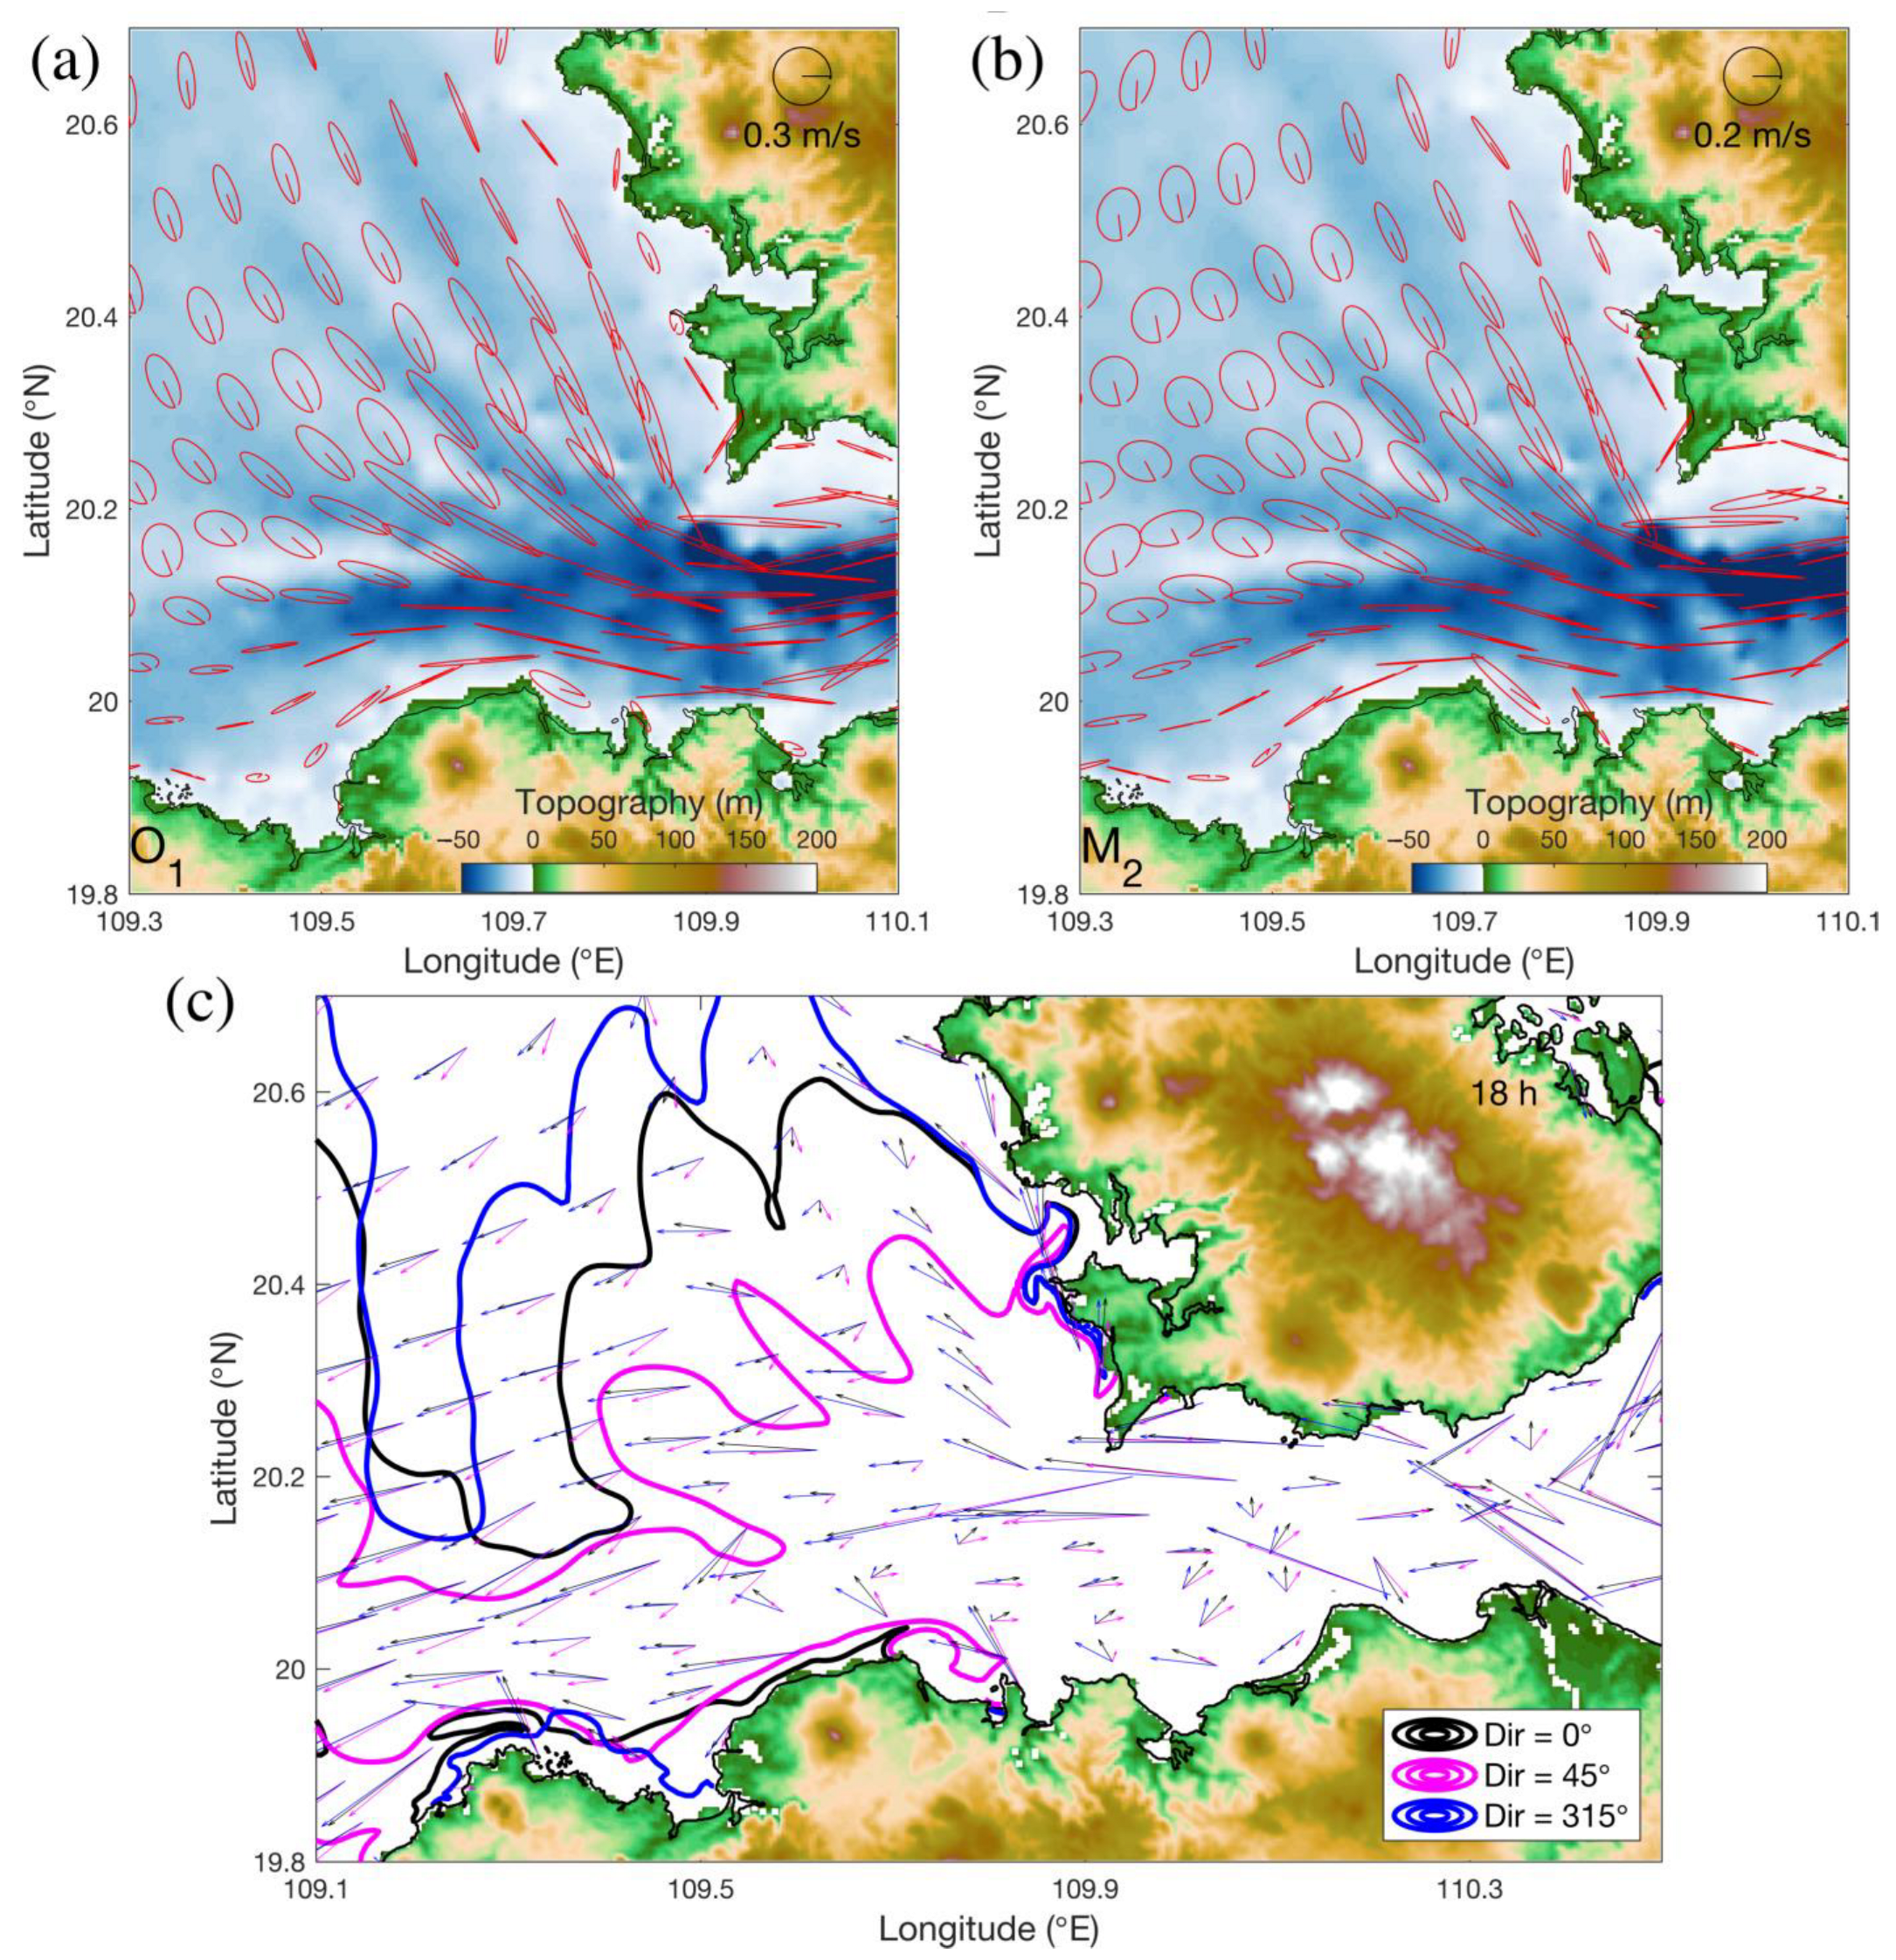
In EXP_ID1, movement of the warm or cold water tongue never crosses the isobaths, but it is totally different in the realistic case of EXP_D45 (Figure 11c,d). This is easy to understand by checking the distribution of tidal current ellipses over the studied region. As suggested by Figure 14a,b, inclinations of both diurnal and semi-diurnal surface tidal ellipses are mainly parallel to the nearby shoreline and sea trough/ridge (i.e., parallel to isobaths), meanwhile, small eccentricities of tidal ellipses are found in the western adjacent sea of the QS, which indicates a relatively strong current along minor-axis and thereby certainly promotes the cross-isobath transport.
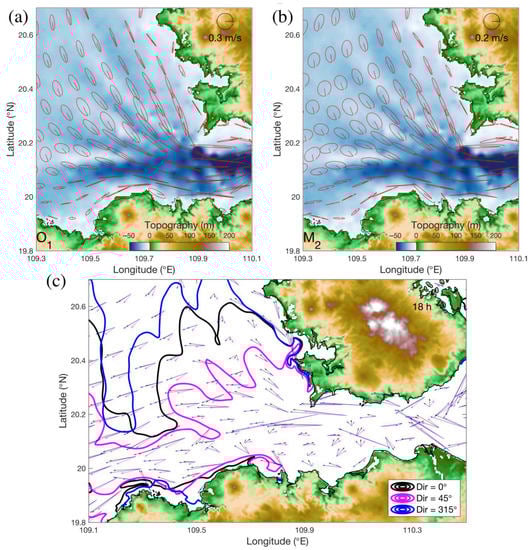
Figure 14.
Distribution of diurnal (a) and semi-diurnal (b) surface tidal current ellipses in the studied region. The O1 and M2 tidal current constituents are selected as representatives of diurnal and semi-diurnal components, respectively. (c) Comparisons of SST distribution (31.45 °C isotherm) and surface current vectors modeled by EXP_D45 (in purple), EXP_D0 (in black), and EXP_D315 (in blue).
4.2. Role of Various Winds
The above discussions clarify the fundamental contribution of a topography-modulated current in modulating the thermal distribution in the study area. Furthermore, the role of different wind is examined. Comparisons of SST structure (31.45 °C isotherm) and surface current vectors modeled by EXP_D45, EXP_D0, and EXP_D315 are displayed in Figure 14c. Under the forcing of winds in directions of 45°, 0°, and 315°, the location and shape of 31.45 °C isotherms show remarkable differences. Figure 14c indicates a significant difference in current vectors: on one hand, the various winds will induce different locally wind-driven currents; on the other hand, the large-scale background circulation in the modeling domain will be adjusted due to changes in wind, and the adjustment is passed to the studied region through strait-open sea-gulf interaction.
Another vital point lies in the high selectivity of upwelling off the northeast coast of Hainan Island to the wind: Lin et al. [46] and Bai et al. [16] explored the statistical relationship between this upwelling and the wind, both suggesting that the intensity of upwelling under southeast (315°), south (0°), and southwest (45°) wind successively decreases. Results of EXP_D45, EXP_D0, and EXP_D315 agree well with previous studies, i.e., that 315° and 0° winds induce a much colder and a colder background, respectively, at the eastern entrance of the QS compared with 45° wind. Therefore, warm water was pushed furthest west in EXP_D315, followed by EXP_D0, and then EXP_D45, successively.
5. Conclusions
In summer, the westward tidal residual current triggered by tidal rectification over the complicated topography in the QS competes against the eastward wind-driven current, resulting in a westward residual flow. The westward residual flow drives a water transport through the QS into the Beibu Gulf and thereby plays a vital role in the gulf-scale circulation. However, we still have limited knowledge of water properties during the exchange process. To improve this, multi-source observations, realistic simulations, as well as idealized modeling, were employed to elucidate the thermal feature associated with water exchange at the western entrance of the QS. Major new findings are as follows:
- (1)
- cold upwelling water at the eastern side of the QS and well-mixed warm water on the western side establish a fundamental background of thermal exchange in the studied area.
- (2)
- water temperature characterizes remarkable horizontal variation but presents minor vertical difference at the western entrance of the QS, i.e., the thermal structure could be approximately treated as a two-dimensional problem there.
- (3)
- tidal current modulated by the alternative sea trough/ridge dominates the communication of two different water bodies, leading to alternatively warm/cold thermal distribution at the western entrance of the QS.
- (4)
- wind contributes significantly to the thermal property by modifying the circulation and modulating the intensity of upwelling at the eastern side of the QS.
Under the seasonal westward residual flow and the synoptic intense tidal current, the cold, saline, and nutrient-rich upwelling water from the eastern side of the QS keeps communicating with the gulf water at the western entrance area of the QS, which certainly plays a key role in the marine ecosystem, physiochemical environment, bottom deposit, and even the regional weather there. To fully understand the water exchange through the QS, the 25 h observations at stations Y1 and Y2 are insufficient and longer-term measurements with high a spatial resolution are proposed. Particularly, upwelling that develops at the eastern side of the QS should be further investigated using modern current meters that measure the vertical component of the current.
Previous studies have shown the importance of topography in modulating the hydrodynamic environment in many straits and their adjacent seas, e.g., the Gibraltar Strait [1,2,3,4], the Luzon Strait [5,6,7], and the Yucatan Channel [8,9]. There are tens of straits in the world and many of them play a vital role in the marine environment, economy, and strategy. The work conducted here provides a certain reference for other similar strait systems that characterize complicated topography, dominated by a strong tidal current.
Author Contributions
Conceptualization, P.B. and B.L.; methodology, H.Z. and J.W.; software, P.B.; validation, B.L., H.Z. and P.L.; formal analysis, P.B. and J.W.; investigation, P.B., J.Y. and T.Z.; resources, H.Z.; data curation, H.Z. and B.L.; writing—original draft preparation, P.B., J.W., J.Y. and H.Z.; writing—review and editing, B.L. and H.Z.; visualization, P.B.; supervision, J.W. and T.Z.; project administration, B.L. and H.Z.; funding acquisition, P.B. All authors have read and agreed to the published version of the manuscript.
Funding
This research was funded by National Natural Science Foundation of China, grant numbers 42106017, 42076162, and 41976200; the GuangDong Basic and Applied Basic Research Foundation, grant number 2020A1515110516; the Special Fund for Technology Development of Zhanjiang City, grant number 2020A01008; and the Scientific Research Foundation for Advanced Talents of Zhejiang Ocean University, grant number 11105093522.
Data Availability Statement
The data employed in this study can be acquired by contacting the corresponding author acelibo@zjou.edu.cn (B.L.).
Acknowledgments
The authors appreciate the helpful discussions with members of the Marine Process and Equipment Group from Ocean University of China. The numerical simulation was conducted on the HPC of Beijing Super Cloud Computing Center.
Conflicts of Interest
The authors declare no conflict of interest.
References
- Bruno, M.; Alonso, J.J.; Cózar, A.; Vidal, J.; Ruiz-Canavate, A.; Echevarrıa, F.; Ruiz, J. The boiling-water phenomena at Camarinal Sill, the strait of Gibraltar. Deep Sea Res. Part II Top. Stud. Oceanogr. 2002, 49, 4097–4113. [Google Scholar] [CrossRef]
- Baschek, B.; Send, U.; Lafuente, J.G.; Candela, J. Transport estimates in the strait of gibraltar with a tidal inverse model. J. Geophys. Res. Atmos. 2001, 106, 31033–31044. [Google Scholar] [CrossRef] [Green Version]
- Lafuente, J.G.; Vargas, J.M.; Plaza, F.; Sarhan, T.; Candela, J.; Bascheck, B. Tide at the eastern section of the Strait of Gibraltar. J. Geophys. Res. Ocean. 2000, 105, 14197–14213. [Google Scholar] [CrossRef] [Green Version]
- Sánchez Garrido, J.C.; García Lafuente, J.; Criado Aldeanueva, F.; Baquerizo, A.; Sannino, G. Time-spatial variability observed in velocity of propagation of the internal bore in the Strait of Gibraltar. J. Geophys. Res. Ocean. 2008, 113, C7. [Google Scholar] [CrossRef] [Green Version]
- Zhao, Z. Southward internal tides in the northeastern South China Sea. J. Geophys. Res. Ocean. 2020, 125, e2020JC016554. [Google Scholar] [CrossRef]
- Qu, T.; Girton, J.B.; Whitehead, J.A. Deepwater overflow through Luzon strait. J. Geophys. Res. Ocean. 2006, 111, C1. [Google Scholar] [CrossRef] [Green Version]
- Zhao, W.; Zhou, C.; Tian, J.; Yang, Q.; Wang, B.; Xie, L.; Qu, T. Deep water circulation in the Luzon Strait. J. Geophys. Res. Ocean. 2014, 119, 790–804. [Google Scholar] [CrossRef]
- Molinari, R.L.; Morrison, J. The separation of the Yucatan Current from the Campeche Bank and the intrusion of the Loop Current into the Gulf of Mexico. J. Geophys. Res. Ocean. 1988, 93, 10645–10654. [Google Scholar] [CrossRef]
- Ochoa, J.; Sheinbaum, J.; Badan, A.; Candela, J.; Wilson, D. Geostrophy via potential vorticity inversion in the Yucatan Channel. J. Mar. Res. 2001, 59, 725–747. [Google Scholar] [CrossRef]
- Zhuk, V.R.; Kubryakov, A.A. Effect of the East Siberian Current on Water Exchange in the Bering Strait Based on Satellite Altimetry Measurements. Oceanology 2021, 61, 791–802. [Google Scholar] [CrossRef]
- Zavialov, I.; Osadchiev, A.; Sedakov, R.; Barnier, B.; Molines, J.M.; Belokopytov, V. Water exchange between the Sea of Azov and the Black Sea through the Kerch Strait. Ocean Sci. 2020, 16, 15–30. [Google Scholar] [CrossRef] [Green Version]
- Vasou, P.; Vervatis, V.; Krokos, G.; Hoteit, I.; Sofianos, S. Variability of water exchanges through the Strait of Hormuz. Ocean Dyn. 2020, 70, 1053–1065. [Google Scholar] [CrossRef]
- Wu, D.; Wang, Y.; Lin, X.; Yang, J. On the mechanism of the cyclonic circulation in the Gulf of Tonkin in the summer. J. Geophys. Res. Ocean. 2008, 113, C09029. [Google Scholar] [CrossRef] [Green Version]
- Ding, Y.; Chen, C.; Beardsley, R.C.; Bao, X.; Shi, M.; Zhang, Y.; Viet, N.T. Observational and model studies of the circulation in the Gulf of Tonkin, South China Sea. J. Geophys. Res. Ocean. 2013, 118, 6495–6510. [Google Scholar] [CrossRef] [Green Version]
- Bai, P.; Gu, Y.; Li, P.; Wu, K. Modelling the upwelling off the east Hainan Island coast in summer 2010. Chin. J. Oceanol. Limnol. 2016, 34, 1358–1373. [Google Scholar] [CrossRef]
- Bai, P.; Yang, J.; Xie, L.; Zhang, S.; Ling, Z. Effect of topography on the cold water region in the east entrance area of Qiongzhou Strait. Estuar. Coast. Shelf Sci. 2020, 242, 106820. [Google Scholar] [CrossRef]
- Zu, T.; Gan, J.; Erofeeva, S.Y. Numerical study of the tide and tidal dynamics in the South China Sea. Deep Sea Res. Part I Oceanogr. Res. Pap. 2008, 55, 137–154. [Google Scholar] [CrossRef]
- Shi, M.; Chen, C.; Xu, Q.; Lin, H.; Liu, G.; Wang, H.; Yan, J. The role of Qiongzhou Strait in the seasonal variation of the South China Sea circulation. J. Phys. Oceanogr. 2002, 32, 103–121. [Google Scholar] [CrossRef] [Green Version]
- Yu, M.G.; Liu, J.F. The system and pattern of the South China Sea circulation. Mar. Forecast. 1993, 10, 13–17. (In Chinese) [Google Scholar]
- Bao, X.W.; Hou, Y.J.; Chen, C.S.; Chen, F.; Shi, M.C. Analysis of characteristics and mechanism of current system on the west coast of Guangdong of China in summer. Acta Oceanol. Sin. 2005, 24, 1–9. [Google Scholar]
- Yang, S.Y.; Chen, B.; Li, P.L. A study of the characteristics of water transport from the South China Sea into Beibu bay via the Qiongzhou Strait in summer in terms of temperature and salinity data. Trans. Oceanol. Limnol. 2006, 1, 1–7, (In Chinese with English Abstract). [Google Scholar] [CrossRef]
- Yan, C.; Chen, B.; Yang, S.; Yan, J. The Transportation volume of water through the Qiongzhou Strait in winter season. Trans. Oceanol. Limnol. 2008, 1, 1–9, (In Chinese with English Abstract). [Google Scholar] [CrossRef]
- Chen, C.; Li, P.; Shi, M.; Zuo, J.; Chen, M.; Sun, H. Numerical study of the tides and residual currents in the Qiongzhou Strait. Chin. J. Oceanol. Limnol. 2009, 27, 931–942. [Google Scholar] [CrossRef]
- Zhu, X.H.; Ma, Y.L.; Guo, X.; Fan, X.; Long, Y.; Yuan, Y.; Huang, D. Tidal and residual currents in the Qiongzhou Strait estimated from shipboard ADCP data using a modified tidal harmonic analysis method. J. Geophys. Res. Ocean. 2014, 119, 8039–8060. [Google Scholar] [CrossRef]
- Gao, J.; Chen, B.; Shi, M. Summer circulation structure and formation mechanism in the Beibu Gulf. Sci. China Earth Sci. 2015, 58, 286–299. [Google Scholar] [CrossRef]
- Golubeva, E.; Kraineva, M.; Platov, G.; Iakshina, D.; Tarkhanova, M. Marine Heatwaves in Siberian Arctic Seas and Adjacent Region. Remote Sens. 2021, 13, 4436. [Google Scholar] [CrossRef]
- Kuroda, H.; Setou, T. Extensive Marine Heatwaves at the Sea Surface in the Northwestern Pacific Ocean in Summer 2021. Remote Sens. 2021, 13, 3989. [Google Scholar] [CrossRef]
- Sims, L.D.; Subrahmanyam, B.; Trott, C.B. Ocean–Atmosphere Variability in the Northwest Atlantic Ocean during Active Marine Heatwave Years. Remote Sens. 2022, 14, 2913. [Google Scholar] [CrossRef]
- Mohamed, B.; Ibrahim, O.; Nagy, H. Sea Surface Temperature Variability and Marine Heatwaves in the Black Sea. Remote Sens. 2022, 14, 2383. [Google Scholar] [CrossRef]
- Liu, B.; Guan, L.; Chen, H. Detecting 2020 Coral Bleaching Event in the Northwest Hainan Island Using CoralTemp SST and Sentinel-2B MSI Imagery. Remote Sens. 2021, 13, 4948. [Google Scholar] [CrossRef]
- Pan, Y.; Ding, D.; Li, G.; Liu, X.; Liang, J.; Wang, X.; Liu, S.; Shi, J. Potential Temporal and Spatial Trends of Oceanographic Conditions with the Bloom of Ulva Prolifera in the West of the Southern Yellow Sea. Remote Sens. 2021, 13, 4406. [Google Scholar] [CrossRef]
- Olaya, F.C.; Durazo, R.; Oerder, V.; Pallàs-Sanz, E.; Bento, J.P. Ocean Front Detection with Glider and Satellite-Derived SST Data in the Southern California Current System. Remote Sens. 2021, 13, 5032. [Google Scholar] [CrossRef]
- Wang, Z.; Chen, G.; Han, Y.; Ma, C.; Lv, M. Southwestern Atlantic Ocean Fronts Detected from Satellite-Derived SST and Chlorophyll. Remote Sens. 2021, 13, 4402. [Google Scholar] [CrossRef]
- Zhu, Y.; Li, Y.; Wang, F.; Lv, M. Weak Mesoscale Variability in the Optimum Interpolation Sea Surface Temperature (OISST)-AVHRR-Only Version 2 Data before 2007. Remote Sens. 2022, 14, 409. [Google Scholar] [CrossRef]
- Li, J.; Zhang, H.; Liu, S.; Wang, X.; Sun, L. The Response and Feedback of Ocean Mesoscale Eddies to Four Sequential Typhoons in 2014 Based on Multiple Satellite Observations and Argo Floats. Remote Sens. 2021, 13, 3805. [Google Scholar] [CrossRef]
- Qiao, M.; Cao, A.; Song, J.; Pan, Y.; He, H. Enhanced Turbulent Mixing in the Upper Ocean Induced by Super Typhoon Goni (2015). Remote Sens. 2022, 14, 2300. [Google Scholar] [CrossRef]
- Shchepetkin, A.F.; McWilliams, J.C. The regional oceanic modeling system (ROMS): A split-explicit, free-surface, topography-following-coordinate oceanic model. Ocean Model. 2005, 9, 347–404. [Google Scholar] [CrossRef]
- Egbert, G.D.; Erofeeva, S.Y. Efficient inverse modeling of barotropic ocean tides. J. Atmos. Ocean Technol. 2002, 19, 183–204. [Google Scholar] [CrossRef] [Green Version]
- da Silva, A.M.; Young, C.C.; Levitus, S. Atlas of surface marine data 1994, Vol. 1: Algorithms and procedures. Noaa Atlas Nesdis 1994, 6, 20910–23282. [Google Scholar]
- Pawlowicz, R.; Beardsley, B.; Lentz, S. Classical tidal harmonic analysis including error estimates in MATLAB using T_TIDE. Comput. Geosci. 2002, 28, 929–937. [Google Scholar] [CrossRef]
- Su, J.; Pohlmann, T. Wind and topography influence on an upwelling system at the eastern Hainan coast. J. Geophys. Res. Ocean. 2009, 114, C06017. [Google Scholar] [CrossRef] [Green Version]
- Jing, Z.Y.; Qi, Y.Q.; Hua, Z.L.; Zhang, H. Numerical study on the summer upwelling system in the northern continental shelf of the South China Sea. Cont. Shelf Res. 2009, 29, 467–478. [Google Scholar] [CrossRef] [Green Version]
- Li, Y.; Peng, S.; Yang, W.; Wang, D. Numerical simulation of the structure and variation of upwelling off the east coast of Hainan Island using QuikSCAT winds. Chin. J. Oceanol. Limnol. 2012, 30, 1068–1081. [Google Scholar] [CrossRef]
- Su, J.; Xu, M.; Pohlmann, T.; Xu, D.; Wang, D. A western boundary upwelling system response to recent climate variation (1960–2006). Cont. Shelf Res. 2013, 57, 3–9. [Google Scholar] [CrossRef]
- Wang, D.; Yang, Y.; Wang, J.; Bai, X. A modeling study of the effects of river runoff, tides, and surface wind-wave mixing on the Eastern and Western Hainan upwelling systems of the South China Sea, China. Ocean Dyn. 2015, 65, 1143–1164. [Google Scholar] [CrossRef]
- Lin, P.; Hu, J.; Zheng, Q.; Sun, Z.; Zhu, J. Observation of summertime upwelling off the eastern and northeastern coasts of Hainan Island, China. Ocean Dyn. 2016, 66, 387–399. [Google Scholar] [CrossRef]
- Lü, X.; Qiao, F.; Wang, G.; Xia, C.; Yuan, Y. Upwelling off the west coast of Hainan Island in summer: Its detection and mechanisms. Geophys. Res. Lett. 2008, 35, L02604. [Google Scholar] [CrossRef]
- Bai, P.; Yang, J.L.; Zhang, S.W.; Xie, L.L.; Wu, J.S. Upwelling off the west coast of Hainan Island: Sensitivity to wave-mixing. Acta Oceanol. Sin. 2019, 38, 11–19. [Google Scholar] [CrossRef]
- Bai, P.; Ling, Z.; Zhang, S.; Xie, L.; Yang, J. Fast-changing upwelling off the west coast of Hainan Island. Ocean Model. 2020, 148, 101589. [Google Scholar] [CrossRef]
- Hu, J.Y.; Kawamura, H.; Tang, D.L. Tidal front around the Hainan Island, northwest of the South China Sea. J. Geophys. Res. Ocean. 2003, 108, 3342. [Google Scholar] [CrossRef]
- Wu, H.; Yu, H.; Ding, J.; Yuan, D. Modeling assessment of tidal current energy in the Qiongzhou Strait, China. Acta Oceanol. Sin. 2016, 35, 21–29. [Google Scholar] [CrossRef]
- Taylor, K.E. Summarizing multiple aspects of model performance in a single diagram. J. Geophys. Res. Atmos. 2001, 106, 7183–7192. [Google Scholar] [CrossRef]


Publisher’s Note: MDPI stays neutral with regard to jurisdictional claims in published maps and institutional affiliations. |
© 2022 by the authors. Licensee MDPI, Basel, Switzerland. This article is an open access article distributed under the terms and conditions of the Creative Commons Attribution (CC BY) license (https://creativecommons.org/licenses/by/4.0/).