Article

An Advanced Framework for Multi-Scale Forest Structural Parameter Estimations Based on UAS-LiDAR and Sentinel-2 Satellite Imagery in Forest Plantations of Northern China

Co-Innovation Center for Sustainable Forestry in Southern China, Nanjing Forestry University, Nanjing 210037, China
*
Author to whom correspondence should be addressed.
Remote Sens. 2022, 14(13), 3023; https://doi.org/10.3390/rs14133023
Submission received: 31 March 2022 / Revised: 15 June 2022 / Accepted: 21 June 2022 / Published: 23 June 2022
(This article belongs to the Section Forest Remote Sensing)

Abstract

:
Regarded as a marked category of global forests, forest plantations not only have great significance for the development of the global economy, but also contribute ecological and social benefits. The accurate acquisition of the multi-scale (from individual tree to landscape level) and near-real-time information of structural parameters in plantations is the premise of decision-making in sustainable management for the whole forest farm, and it is also the basis for the evaluation of forest productivity in stands. The development and synergetic applications of multi-source and multi-platform remote sensing technology provide a technical basis for the highly accurate estimation of multi-scale forest structural parameters. In this study, we developed an advanced framework for estimating these parameters of forest plantations in multiple scales (individual tree, plot and landscape levels) based on the Unmanned Aircraft System Light Detection and Ranging (UAS-LiDAR) transects and wall-to-wall Sentinel-2 imagery, combined with the sample plot data in a typical forest farm plantation (mainly Larch, Chinese pine) of Northern China. The position and height of individual trees within the plots were extracted by the LiDAR-based point cloud segmentation (PCS) algorithm, and then different approaches to the extrapolation of forest structural parameters from the plot to landscape level were assessed. The results demonstrate that, firstly, the individual tree height obtained by PCS was of relatively high accuracy (rRMSE = 1.5–3.3%); secondly, the accuracy of the forest structure parameters of the sample plot scale estimated by UAS-LiDAR is rRMSE = 4.4–10.6%; and thirdly, the accuracy of the two-stage upscaling approach by UAS-LiDAR transects as an intermediate stage (rRMSE = 14.5–20.2%) performed better than the direct usage of Sentinel-2 data (rRMSE = 22.9–27.3%). This study demonstrated an advanced framework for creating datasets of multi-scale forest structural parameters in a forest plantation, and proved that the synergetic usage of UAS-LiDAR transects and full coverage medium-resolution satellite imagery can provide a high-precision and low-cost technical basis for the multi-level estimation of forest structural parameters.

Graphical Abstract

1. Introduction

As a vital component in terrestrial ecosystems, forests play a key role in maintaining the global ecological environment, mitigating climate change, and balancing carbon cycling and biodiversity [1,2,3]. Forest plantations not only have great value in enhancing ecological benefits, but also contribute to the growth of social and economic benefits [4,5]. With the rapid development of the world population and economy, global demand for timber and forest products, as well as carbon sequestration, is growing, and the importance of forest plantations is becoming increasingly prominent [6,7]. China has the largest area of forest plantations in the world, with an existing area of approximately 6.93 × 10⁷ ha. The rapid and accurate acquisition of the multi-scale structural parameters of forest plantations can not only quantify forest carbon reserves (at the landscape level) and evaluate forest productivity (at the stand level, summarized from the plot level), but also provide precise datasets for precision silviculture (requiring information at the individual tree level) [8,9]. However, previous studies of the frameworks for the estimation of forest structural parameters in different scales have either had a high cost (usually labor-intensive and requiring a large number of field samples) or low accuracy and precision (difficult to be implemented in at the tree level while covering the whole site wall-to-wall) [10,11].
With the rapid development of modern remote sensing technology, the synergistic usage of multi-platform and multi-source remote sensing data have emerged in forest structural parameter monitoring [12,13,14]. Passive remote sensing data (e.g., multi-spectral images), which estimate forest structural parameters by extracting the vegetation index, spectral reflectance or texture information, etc., are used as independent variables to build predictive models. For example, satellite or manned airborne multi-spectral images can be used to estimate the distribution of forest structural parameters on a relatively large landscape because of the high efficiency of data acquisition and the use of vegetation-sensitive bands such as near-infrared and red edge [15,16]. However, the cost of manned airborne multi-spectral image acquisition is often high, the capture of optical images is often affected by weather and light conditions, and the reflection signals of vegetation tend to be “saturated” in areas of high-density forests (with high biomass and coverage rate), resulting in large uncertainties in estimating forest structural parameters [17]. Methods of active remote sensing such as Light Detection and Ranging (LiDAR) transmit energy to the object surface, and then receive and analyze return signals for the position or backscatter energy (e.g., intensity) of the object. LiDAR can accurately obtain high-precision vertical structural information of the land surface and forest canopy [18,19,20]. Compared with optical imagery, LiDAR data have significant advantages in acquiring forest 3D structural information in multiple scales by the physical mechanism of “touching” the objects with laser beams [21,22]. Previous studies demonstrated that airborne LiDAR can obtain highly accurate forest structural parameters, but the flight cost for manned airborne LiDAR is usually high when performing wall-to-wall acquisition for individual tree information within landscapes [23,24].
In recent years, unmanned aircraft system (UAS) LiDAR systems have shown unique advantages in forest resources monitoring due to their low cost, and highly efficient acquisition of high point density [25,26,27,28], making it a “sharp” piece of equipment for detecting the location of individual trees and obtaining detailed structural information [29]. At the individual tree level, UAS-LiDAR point clouds can be used to segment individual tree positions and obtain their height [30,31,32]. Additionally, at the plot level, UAS-LiDAR data have also been used in studies for estimating forest structural parameters. Most of these studies used the point cloud metrics extracted from UAS-LiDAR data (common metrics of height quantiles, canopy variation coefficient of height, vegetation coverage in a variety of height, etc.) and field data to build prediction models to estimate forest structural parameters. For example, Jaakkola et al., Wallace et al. and Liu et al. [25,33,34] accurately obtained forest structural parameters, such as tree height, basal area, volume and biomass, etc., at the plot level.
However, due to the limitation of UAS flight endurance and data acquisition efficiency, it is difficult to retrieve forest structural information in large areas (e.g., for the whole forest farm at the landscape level) at low cost solely using the UAS-LiDAR system. To benefit from multi-source remote sensing data by the combination of full-coverage images (e.g., multi-spectral satellite imagery) and fine-resolution remote sensing data (e.g., LiDAR transects)) in order to retrieve full-coverage forest structural parameters in a large area (with low cost and high precision) is of great importance [35,36]. Frazier et al. [37] estimated the biomass of northern natural forests in Canada using airborne LiDAR and Landsat data. Firstly, the regression model was constructed by LiDAR metrics and field data; then, the Landsat images from 1984 to 2012 were selected, and 11 groups of metrics extracted. Then, the forest biomass estimated by LiDAR and these variables were used to estimate the biomass of the whole forest in this area by the random forest algorithm (R2 = 0.63, RRMSE = 44%). Zald et al. [38] combined airborne LiDAR with Landsat data, mapped the forest structural parameters in Saskatchewan Province, Canada, and then estimated the forest coverage and aboveground biomass recovery after the fire. Firstly, a regression model was constructed by LiDAR metrics and 201 points of field data used to estimate the forest structural parameters of LiDAR data coverage, and then three groups of metrics were extracted: spectral indices, change metrics and topography in Landsat images from 1984 to 2012. Finally, the structural parameters of the whole forest in this area (R2 = 0.42–0.69) were estimated by using the random forest and k-NN models. Chi et al. [39] estimated the forest biomass in Changbai Mountain Area of China by using GLAS large spot and Landsat images. Firstly, the metrics of GLAS waveform data and ground-measured biomass were extracted, and the biomass in all GLAS spots was estimated by stepwise regression modeling. Then, the vegetation indices of Landsat data and the forest biomass estimated by DEM and GLAS data were extracted for random forest modeling, and finally the forest biomass of the whole Changbai Mountain area was estimated (R2 = 0.72, RMSE = 25.24 t/ha). Matasci et al. [40] estimated the distribution of structural parameters (stand canopy density, average tree height, volume and aboveground biomass, etc.) of the Canadian boreal forest with an accuracy of R2 = 0.49–0.61 by using airborne LiDAR data and Landsat data. Shen et al. [41] estimated the annual change in forest aboveground biomass in Guangdong Province using GLAS, ALOS PALSAR and Landsat data. The overall distribution of aboveground biomass in Guangdong Province from 1986 to 2016 was mapped (adjR2 = 0.86, RMSE = 11.35 t/ha).
Since the species composition and structure of the plantation are relatively homogenous, and the stem density and crown overlap rate are also different across different growth stages, the effectiveness of the LiDAR point cloud segmentation algorithm in the extraction of individual trees in the forest plantation in specific temperate forests needs to be further evaluated. Previous studies commonly used manned airborne LiDAR (which usually need to design a flight for covering the whole forest farm, and the implementation and maintenance costs of the airborne LiDAR system are high) or spaceborne LiDAR (which is sensitive to the effects of foot-print spatial distribution, terrain and ground auxiliary data, etc.) as the intermediate stage of sampling, as well as full-coverage satellite optical images for extrapolation from plot to landscape scale. However, there are few studies on the use of UAS-LiDAR data (its acquisition cost is usually low, and the design and acquisition time of flight are flexible with a high point cloud density). Meanwhile, most previous studies used Landsat images as the extrapolation optical data; the usage of Sentinel data (with the strength of including the red edge band and finer spatial resolution), which can also be freely accessible, has not yet been compared.
In order to fill the research gaps, we developed an advanced framework for estimating these parameters of forest plantations at multiple scales (individual tree, plot and landscape levels) based on the UAS-LiDAR transects and wall-to-wall Sentinel-2 multispectral satellite imagery, combined with the sample plot data in a typical forest farm (Wangyedian Experimental Forest, WEF) plantation (mainly Larch, Chinese pine) in Northern China. The specific objectives were: (1) to extract the forest structural parameters of individual trees for typical plantation species (Larch and Chinese pine) in the study area by using UAS-LiDAR data and validate the results by field measurements; and (2) to create a two-stage upscaling approach by UAS-LiDAR transects and Sentinel-2 imagery and assess different approaches for extrapolating forest structural parameters from plot to landscape level. The framework was then integrated for creating datasets of multi-scale forest structural parameters in a forest farm by the synergetic use of UAS-LiDAR transects and full-coverage medium-resolution satellite imagery with relatively low cost and high accuracy.

2. Materials and Methods

This study can be divided into three parts: at the individual tree level, the PCS algorithm was used to segment individual trees and extract individual tree heights; at the sample plot level, UAS-LiDAR transect data were used to estimate forest parameters; and at the landscape level, three approaches were used to estimate forest structural parameters. The three approaches at the landscape level are as follows: approach 1, the direct estimation of forest structural parameters at the landscape level by using Sentinel-2 data and field data; approach 2, the estimation of forest structural parameters at the plot level, LiDAR transect and landscape level by using UAS-LiDAR data, Sentinel-2 data and field data; and approach 3, the LiDAR metrics layer at the landscape level, was constructed by UAS-LiDAR data and Sentinel-2 data, and then the forest structural parameters were estimated by combining these data with field data. Finally, the estimation accuracy of forest structural parameters at the landscape level was compared and assessed by using three upscaling approaches. Please see details in Figure 1.

2.1. Study Area

The study area is located in WEF, Chifeng City, Inner Mongolia Autonomous Region, northern China (41°341′20″–41°48′40″N, 118°7′20″–118°28′30″E). The area of WEF is approximately 551 square kilometers, with an altitude of 500–1890 m. It has a temperate continental monsoon climate, being cold and dry in winter, and warm and rainy in summer, and the annual average temperature is 3.5–7 °C. The forest farm is dominated by forest plantations, and the main tree species are Larix principis-rupprechtii Mayr and Pinus tabuliformis Carr. The total storage volume is approximately 1.41 × 10⁶ m3, and annual volume growth is approximately 4.8 × 10⁴ m3 [42]. The study area, sample plot distribution, and UAS-LiDAR transects are shown in Figure 2.

2.2. Field Data

The fieldwork was conducted from 8–18 September 2019. A total of 76 square sample plots with a side length of 25 m were selected according to the forest resources survey data at the early stage and the previous remote sensing data. The coordinates of the center point and corner point of the sample plot were obtained by GPS real-time kinematic (RTK), and the absolute control error was within 1 cm. The individual trees with a DBH greater than 5 cm were measured, and the DBH, tree height, under-branch height, and crown width (east–west direction) of individual trees were obtained. The individual tree position of 19 sample plots was measured by POSTEX® forest locator and Sanding® total station. Then, the biomass and volume at the sample plot level were calculated according to the biomass equation and tree volume table (Formula (1)–(4)) of Larch and Chinese pine (Table 1). We checked the location information of individual trees and the structural parameter values of each tree in the sample plot survey table, and removed or re-measured the outliers to avoid affecting the estimated results at the individual tree and plot levels:
AGB = 0.08 × D2.0961H0.4514
AGB = 1.6053 × (D2H) 0.5694
V = 0.000067770402 × D1.8118141H0.9804529
V = 0.000066492455 × D1.8655617H0.93768879
In the above formulas, Formulas (1) and (2) are the biomass calculation equations, and Formulas (3) and (4) are the volume calculation equations of Larch and Chinese pine, respectively.

2.3. UAS-LiDAR Data Acquisition and Pre-Processing

In this study, the multi rotor UAS-LiDAR system was used for data acquisition, and the measurement of time of flight was conducted simultaneously with the ground survey (17–21 September). According to the distribution of sample plots, 19 “herringbone” UAS-LiDAR sampling strips were designed by the stratified typical stand sampling method. The multi-rotor UAS platform was ROC-06, and the LiDAR sensor was Rigel® VUX-1L. The parameters of UAS and LiDAR sensor are shown in Table 2.
On the basis of obtaining the raw data, the 3D coordinate information of the point cloud was solved by combining the IMU data, time data and GPS data of the ground base station. Among them, the ground base station was set up on the precise point of known coordinates (RTK was used to obtain coordinates, and the coordinate system was WGS84), and the accuracy of the obtained LiDAR point cloud was less than 0.2 cm. While obtaining the original point clouds of UAS-LiDAR, the noise points were removed by the method based on distance. This method calculates the average distance D from the point to its neighbors, and then calculates the maximum distance MaxD of non-noise points according to the median MeanD, standard deviation S and multiple of standard deviation K (MaxD = mean D + S × K). For each point, if MeanD is greater than MaxD, it is treated as noise removal. The algorithm only needs to set the number of neighborhood points and the multiples of standard deviation. After that, the ground points and vegetation points were classified by the progressive TIN (triangulated irregular network) encryption–filtering algorithm [43]. Finally, the normalized LiDAR point cloud data were generated by the ground points [44,45].

2.4. The Metrics Derived from UAS-LiDAR Data

The normalized UAS-LiDAR point clouds were clipped according to the corner points of the sample plots to obtain the highly matched LiDAR point cloud data of the sample plots. Then, the LiDAR point cloud metrics at the sample plot level were calculated. Based on previous studies, 8 height metrics (height quantiles, mean height of point clouds and variation of height, etc.) and 5 density metrics were calculated in this study. The calculations of UAS-LiDAR metrics are shown in Table 3. The UAS-LiDAR point cloud data of sample plots were detected, and the outliers were recalculated by checking the distribution of the point clouds and the value of the height quantiles, in order to avoid any impact on the results at the sample plot and landscape levels.

2.5. Sentinel-2 Data Acquisition and Pre-Processing

Sentinel-2A Level 1C data with cloud cover less than 5% in the period of fieldwork (collection time: 10 September 2019) were selected in this study. Sentinel-2A is a high-resolution multispectral imaging satellite launched by the European Space Agency (ESA). It carries a multispectral imager (MSI) and its revisit period is only 5 days. It can provide images of vegetation, soil and water cover, inland waterways and coastal areas, etc. Sentinel-2 data are one of the few types of satellite data with three bands in the red edge range, which is very effective for monitoring vegetation health information [46]. The “Sen2cor” module of snap tool was used to perform atmospheric correction on the downloaded data, and the surface reflectance data of 11 bands were outputted. There are three spatial resolutions for the 11 bands: the spatial resolution of band 1, band 9, and band 10 is 60 m; the spatial resolution of band 2, band 3, band 4, and band 8 is 10 m; and the spatial resolution of the 4 red edge bands (band 5, band 6, band 7, and band 8a) is 20 m. In order to keep the resolution of the band consistent with the spatial resolution of the sample plot, the images of each band are resampled to 25 m, and finally the data of 11 bands are synthesized into multi-spectral images.

2.6. Vegetation Indices Derived from Sentinel-2 Data

Based on previous studies, 14 kinds of vegetation indices calculated from the resampled multi-spectral images were used as the independent variables of the estimation model in this study. Among them, there are 10 vegetation indices related to red edge band. The vegetation indices and their calculation formula are shown in Table 4.

2.7. Individual Tree Crown Segmentation and Tree Height Extracted

We used the point cloud segmentation (PCS) algorithm [30] to segment individual trees in this study. This algorithm is based on normalized point cloud data, and on the principle of regional growth combined with threshold determination. This method takes full advantage of the phenomenon that trees are separated by a certain distance, especially tree tops. The algorithm first takes the highest point in the normalized point cloud as the starting point and takes it as the vertex of the first tree, and then judges the distance between the surrounding points from the vertex and expands the region to segment the first tree. Finally, it conducts continuous iterations until all trees are segmented. On this basis, we extracted the tree height information of each individual tree corresponding to the field data.
In this study, the confusion matrix F-score was used to verify the accuracy of individual tree segmentation results in 19 sample plots. The calculation formula of the F-score is as follows:
r = N T N T + N O
p = N T N T + N C
F = 2 ( r × p ) r + p
where r represents the detection rate of individual trees, p represents the detection accuracy of individual trees, and F represents the overall accuracy. NT is the number of individual trees that have been segmented and matched with the field data, NO is the number of trees that are missing segmentation but exist in the field data, and NC is the number of trees that have been segmented but do not exist in the field data [61].

2.8. Estimation of Forest Structural Parameters by Random Forest

In this study, a machine learning algorithm was used to process field, UAS-LiDAR and Sentinel-2 data to estimate the parameters of typical planted forest farms in North China from the sample plot level to the forest farm level. Compared with the traditional linear regression model, the machine learning algorithm has certain advantages in model estimation [62,63]. The random forest algorithm is an algorithm that integrates multiple trees through the idea of integrated learning, for which the basic unit is the decision tree. The training set used for each tree is sampled from the total training set, and so there may be duplicate samples in the sampled training sets [64]. Assuming that the number of input samples is n, the number of samples sampled is also n; this means that the input samples of each tree are not all samples during training, so it is relatively difficult to over fit [65]. The increase in mean squared error (IncNSE) was used to evaluate the importance of predictive variables, by randomly assigning a value to each predictive variable; if the predictive variable is more important, the model prediction error will increase after its value is randomly replaced. In view of the above advantages, the random forest model has been applied to studies using remote sensing data to predict the spatial distribution of forest parameters [34,66,67]. In order to avoid over-fitting, the three variables with the highest importance were selected to be remodeled based on the results of variable importance sorting.

2.9. Forest Structural Parameters Upscaling Estimation Approaches

In this study, 3 approaches were used to estimate the forest structural parameters at the landscape level. Approach 1 only used the field data and the vegetation index extracted from Sentinel-2 data to construct a random forest model to generate the landscape-level forest structural parameter distribution, so as to realize the upscale extrapolation estimation of the forest structural parameters. The other two approaches used UAS-LiDAR data as the intermediate medium. Previous studies have shown that UAS-LiDAR has unique advantages in estimating forest structural parameters [68]. In approach 2, the random forest model was constructed by using the measured forest parameters and the metrics extracted by UAS-LiDAR to generate the distribution of forest structural parameters in discrete areas. In order to increase the number of samples and improve the estimation accuracy of the model, 100–800 sample plots (8 groups in total, and the distance between two random sample plots not being less than 50 m) are randomly generated according to the gradient of 100 sample plots in the sampling area of UAS-LiDAR. The random plots were realized by ArcGIS 10.5 software, using the “create random points” function. The random forest model was constructed by using the forest parameter distribution products of these sample plots and the vegetation indices extracted from Sentinel-2 data, and then the sensitivity analysis was carried out. Finally, the model with the highest accuracy was used to generate the forest parameter distribution at the landscape level. Additionally, in Approach 3, the random forest model was constructed by metrics extracted from UAS-LiDAR and the vegetation indexes extracted from Sentinel-2 at the plot level, and then the distribution of UAS-LiDAR metrics was generated at the landscape level. Finally, based on field data and the landscape-level UAS-LiDAR metrics, a model was built to generate the forest structural parameter distribution at the landscape level.

2.10. Model Accuracy Evaluation

We used 10-fold cross-validation to test the accuracy of the random forest model in this study, and the experiment was carried out for a total of 10 times, 9 of which were used as training data, and 1 was used as test data. The average value of the 10 tests was used to evaluate the accuracy of the model [69]. Correlation coefficient (R2), root mean square error (RMSE) and relative root mean square error (rRMSE) were used as accuracy evaluation indexes of the model. Among them, R2 reflects the correlation between independent variables and dependent variables. RMSE reflects the standard error between the measured value and the predicted value, and has a good relationship with the value of the evaluation object. The rRMSE is the ratio of RMSE to the average predicted value and reflects the overall prediction accuracy of the model [70,71]. The formulas of the 3 indexes are as follows (8)–(10):
R 2 = 1 i = 1 n ( x i x ^ i ) 2 i = 1 n ( x i x ¯ i ) 2
RMSE = 1 n i = 1 n ( x i x ¯ i ) 2
rRMSE = RMSE x ¯ × 100 %
In the above formula, xi is the measured forest structural parameter value of the ith sample plot, x ¯ is the average value of the measured forest structural parameters on the ground, x ^ represents the forest structural parameter predicted by the model, and N represents the number of sample plots.

3. Results

Table 5 shows the accuracy of the individual tree segmentation of Larch (P1–P9) and Chinese pine, respectively. From the overall accuracy, it can be seen that the individual tree segmentation accuracy of both species was high (F = 0.77–0.97). By comparing the accuracy of segmentation in different steam density plots, with the increase in steam density, the overall segmentation accuracy decreased (Larch sample plots: △F = 0.18; Chinese pine sample plots: △F = 0.13), and vice versa. In this study, the overall accuracy of segmentation in Chinese pine sample plots was better than that in Larch sample plots.
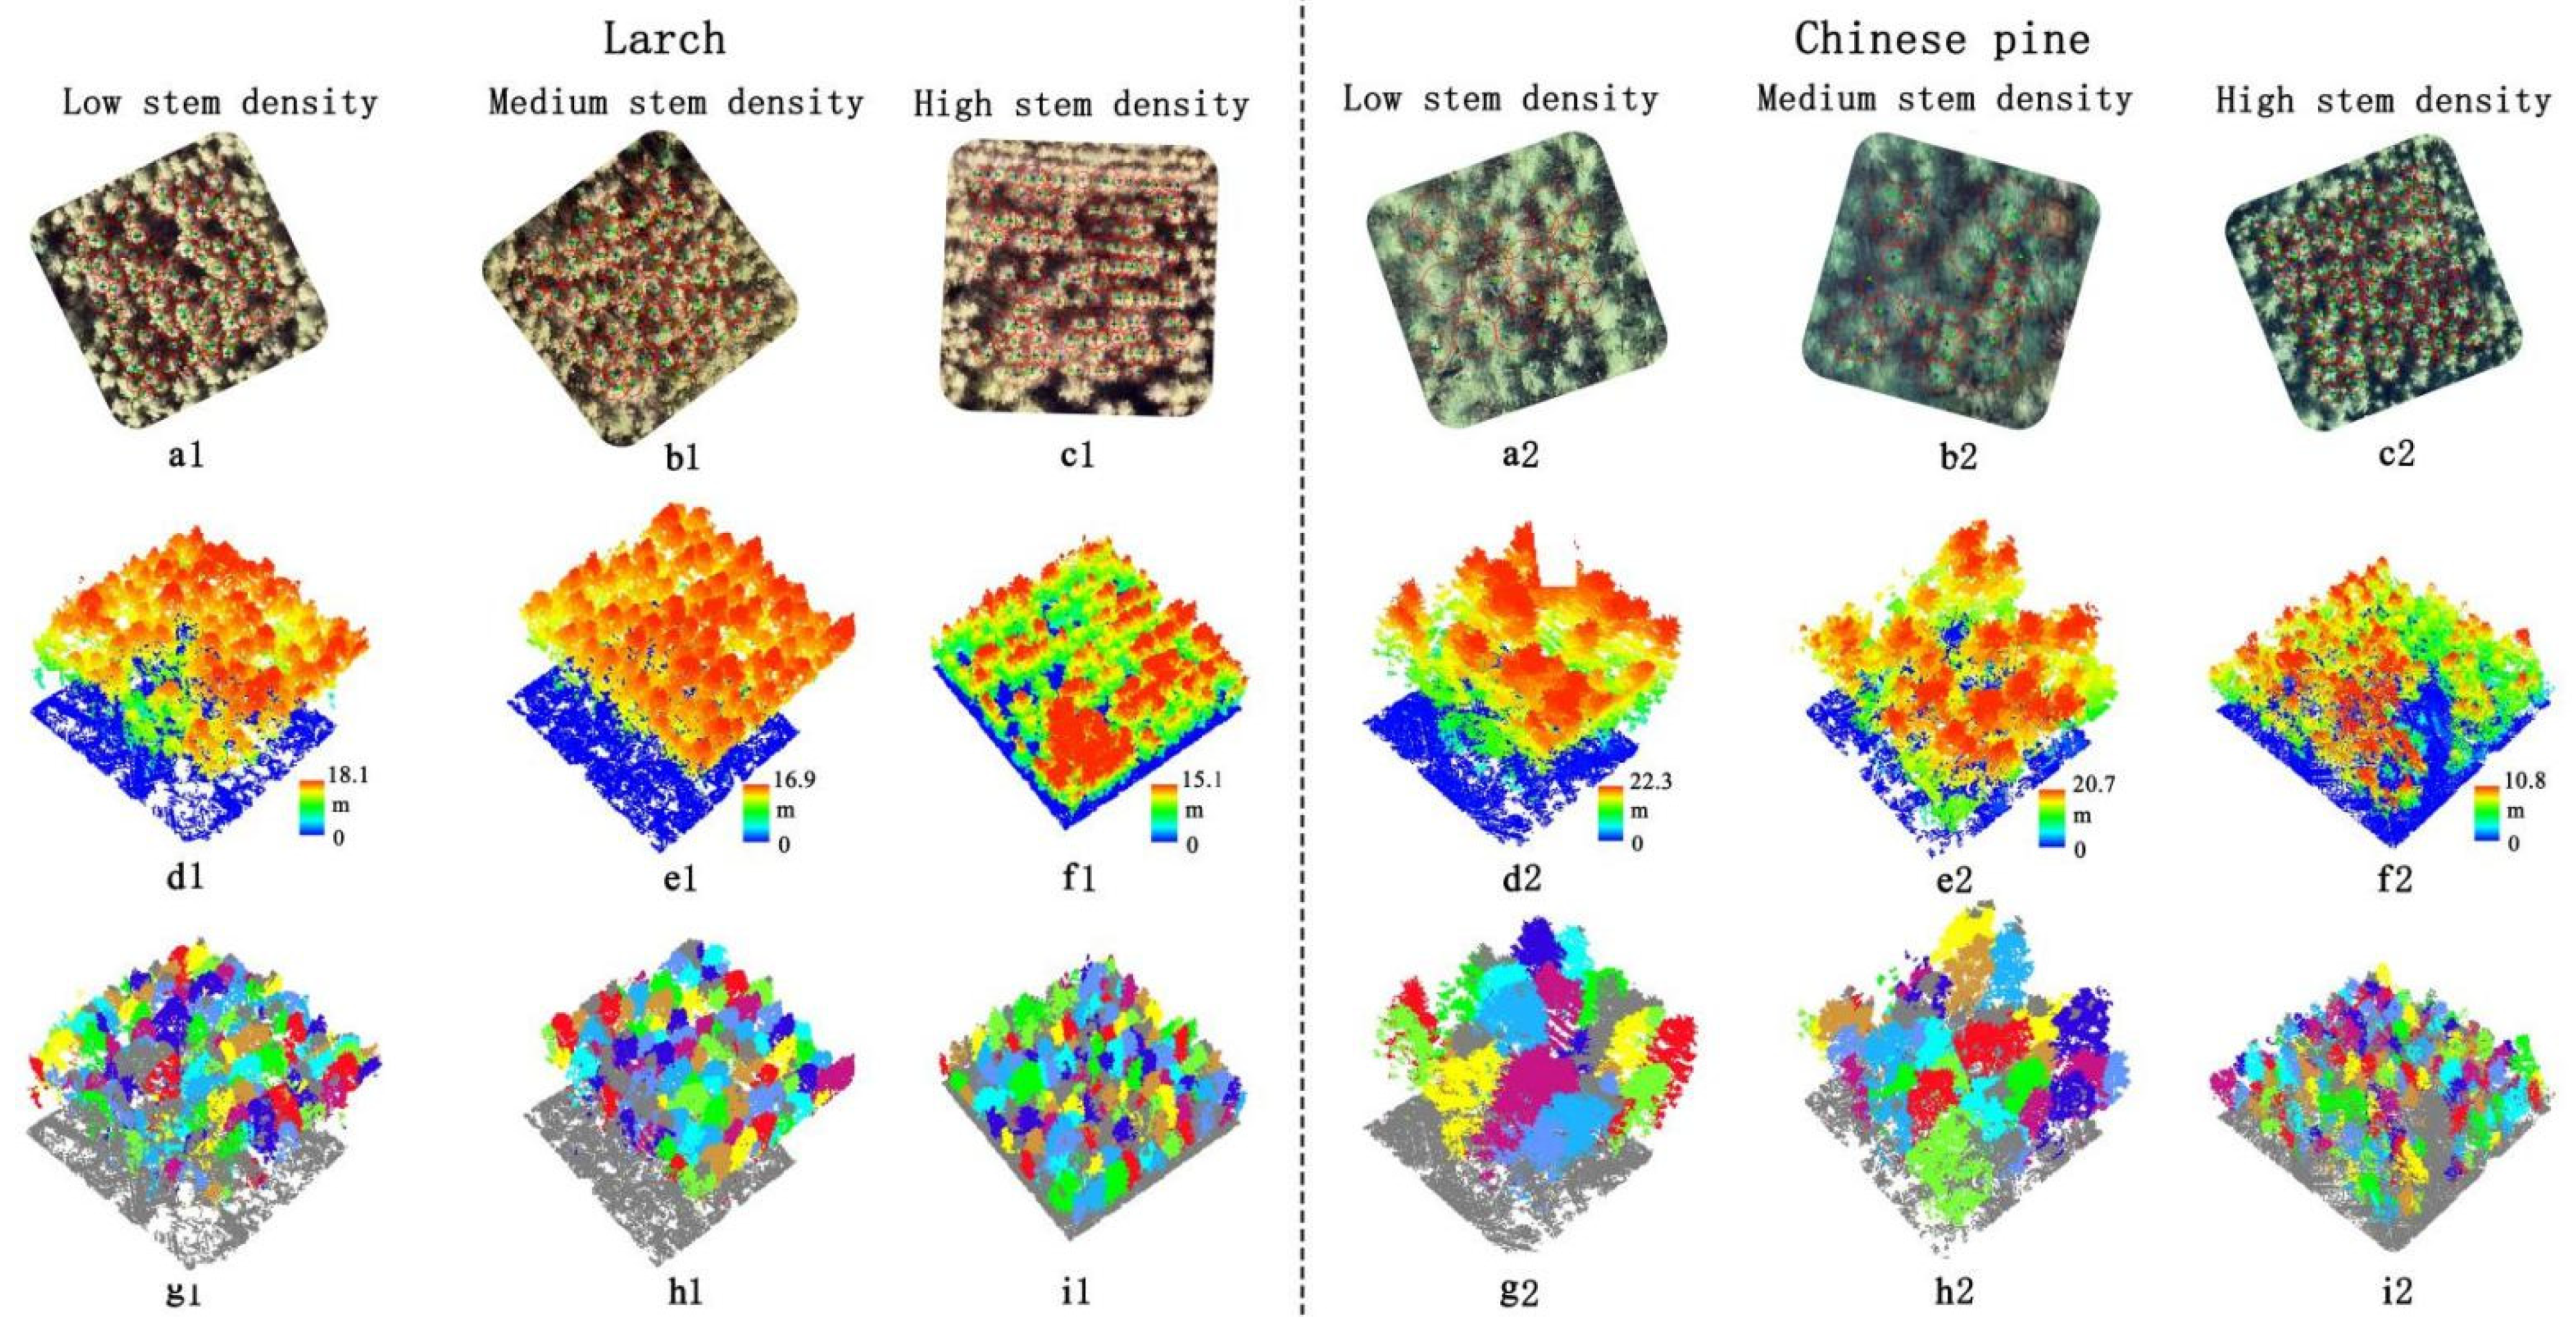
Figure 3 shows the results of individual tree segmentation in typical sample plots of Larch and Chinese pine. By comparing the segmentation results of two tree species with different stem density, we found that the omission segmentation became more common with the increase in stem density. The main reason for this finding may be that, in the sample plots with high stem density, there are many overlapping areas between individual trees, which causes the low trees to be covered by the surrounding tall trees, and the algorithm mistakenly identifies multiple individual trees as one individual tree. However, in the plots with low stem density, there was a phenomenon of over-segmentation. The main reason was that the plots with low stem density were mostly mature forests with a large growth range of lateral branches, which was mistakenly identified as an independent individual tree by the algorithm. In this study, the over-segmentation phenomenon of Chinese pine sample plots was more than that of Larch sample plots.
The accuracy of individual tree height extracted by the PCS algorithm in Larch sample plots and Chinese pine sample plots is shown in Figure 4. The accuracies of tree height extracted by individual tree segmentation in 12 typical sample plots are all high (R2 = 0.91–0.97; rRMSE = 1.5–3.3%). Similar to the regular pattern of individual tree segmentation, the estimation accuracy was higher in plots of low stem density and lower plots of high stem density. Comparing the individual tree height extraction accuracy of the two tree species, there was little difference between them, which showed that the individual tree height extraction of Larch and Chinese pine by PCS algorithm has high universality.
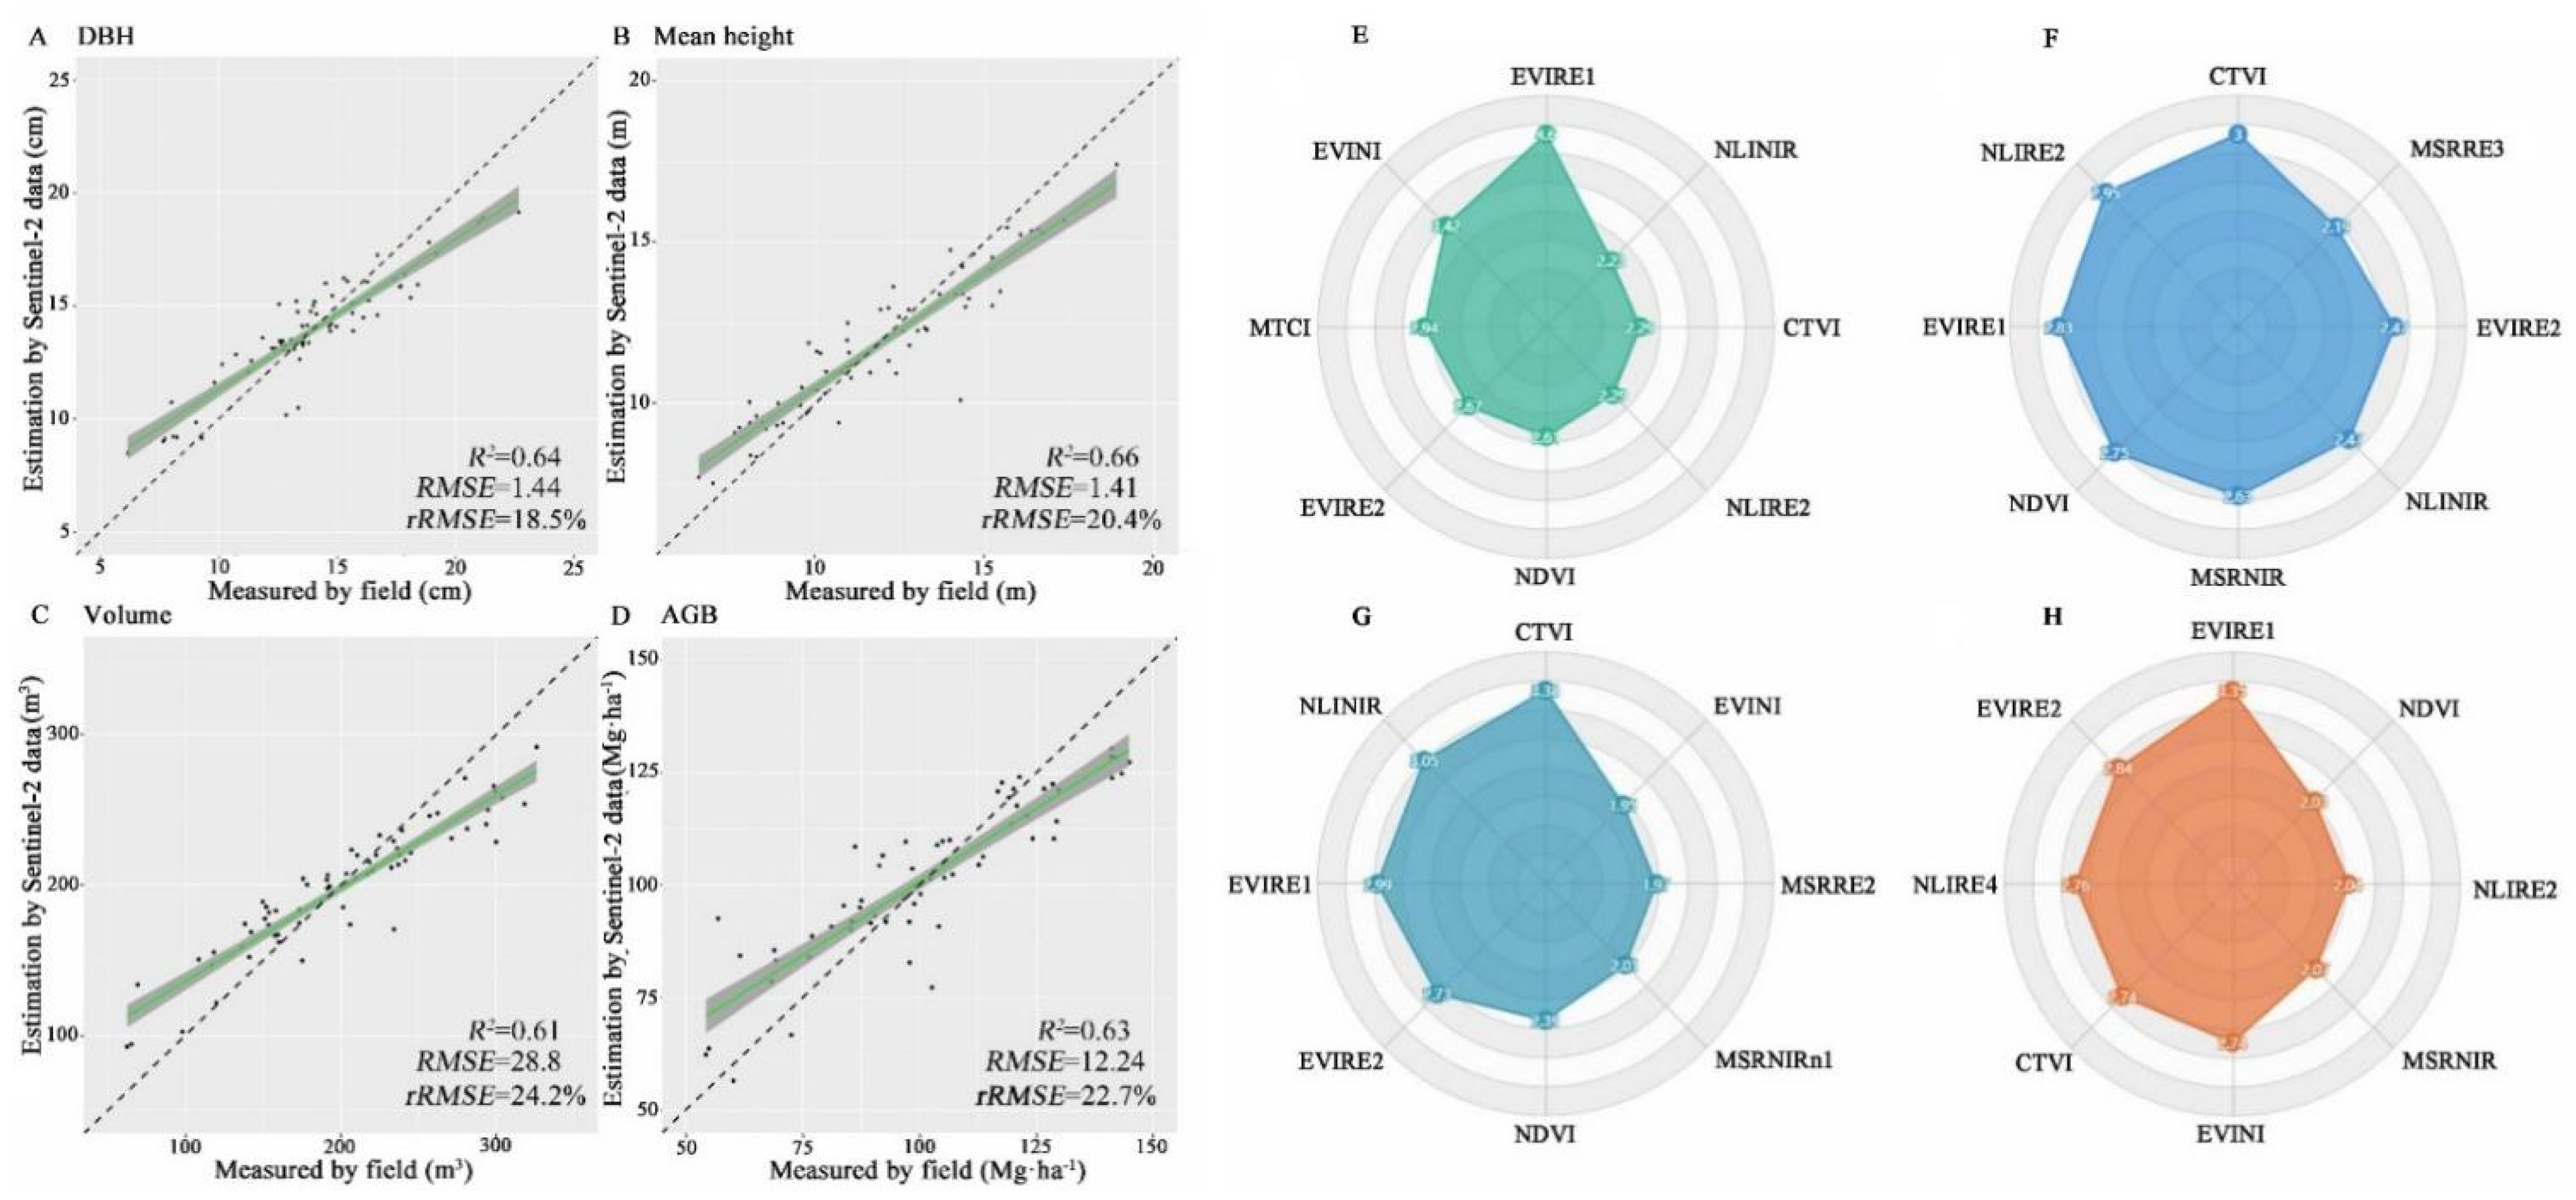
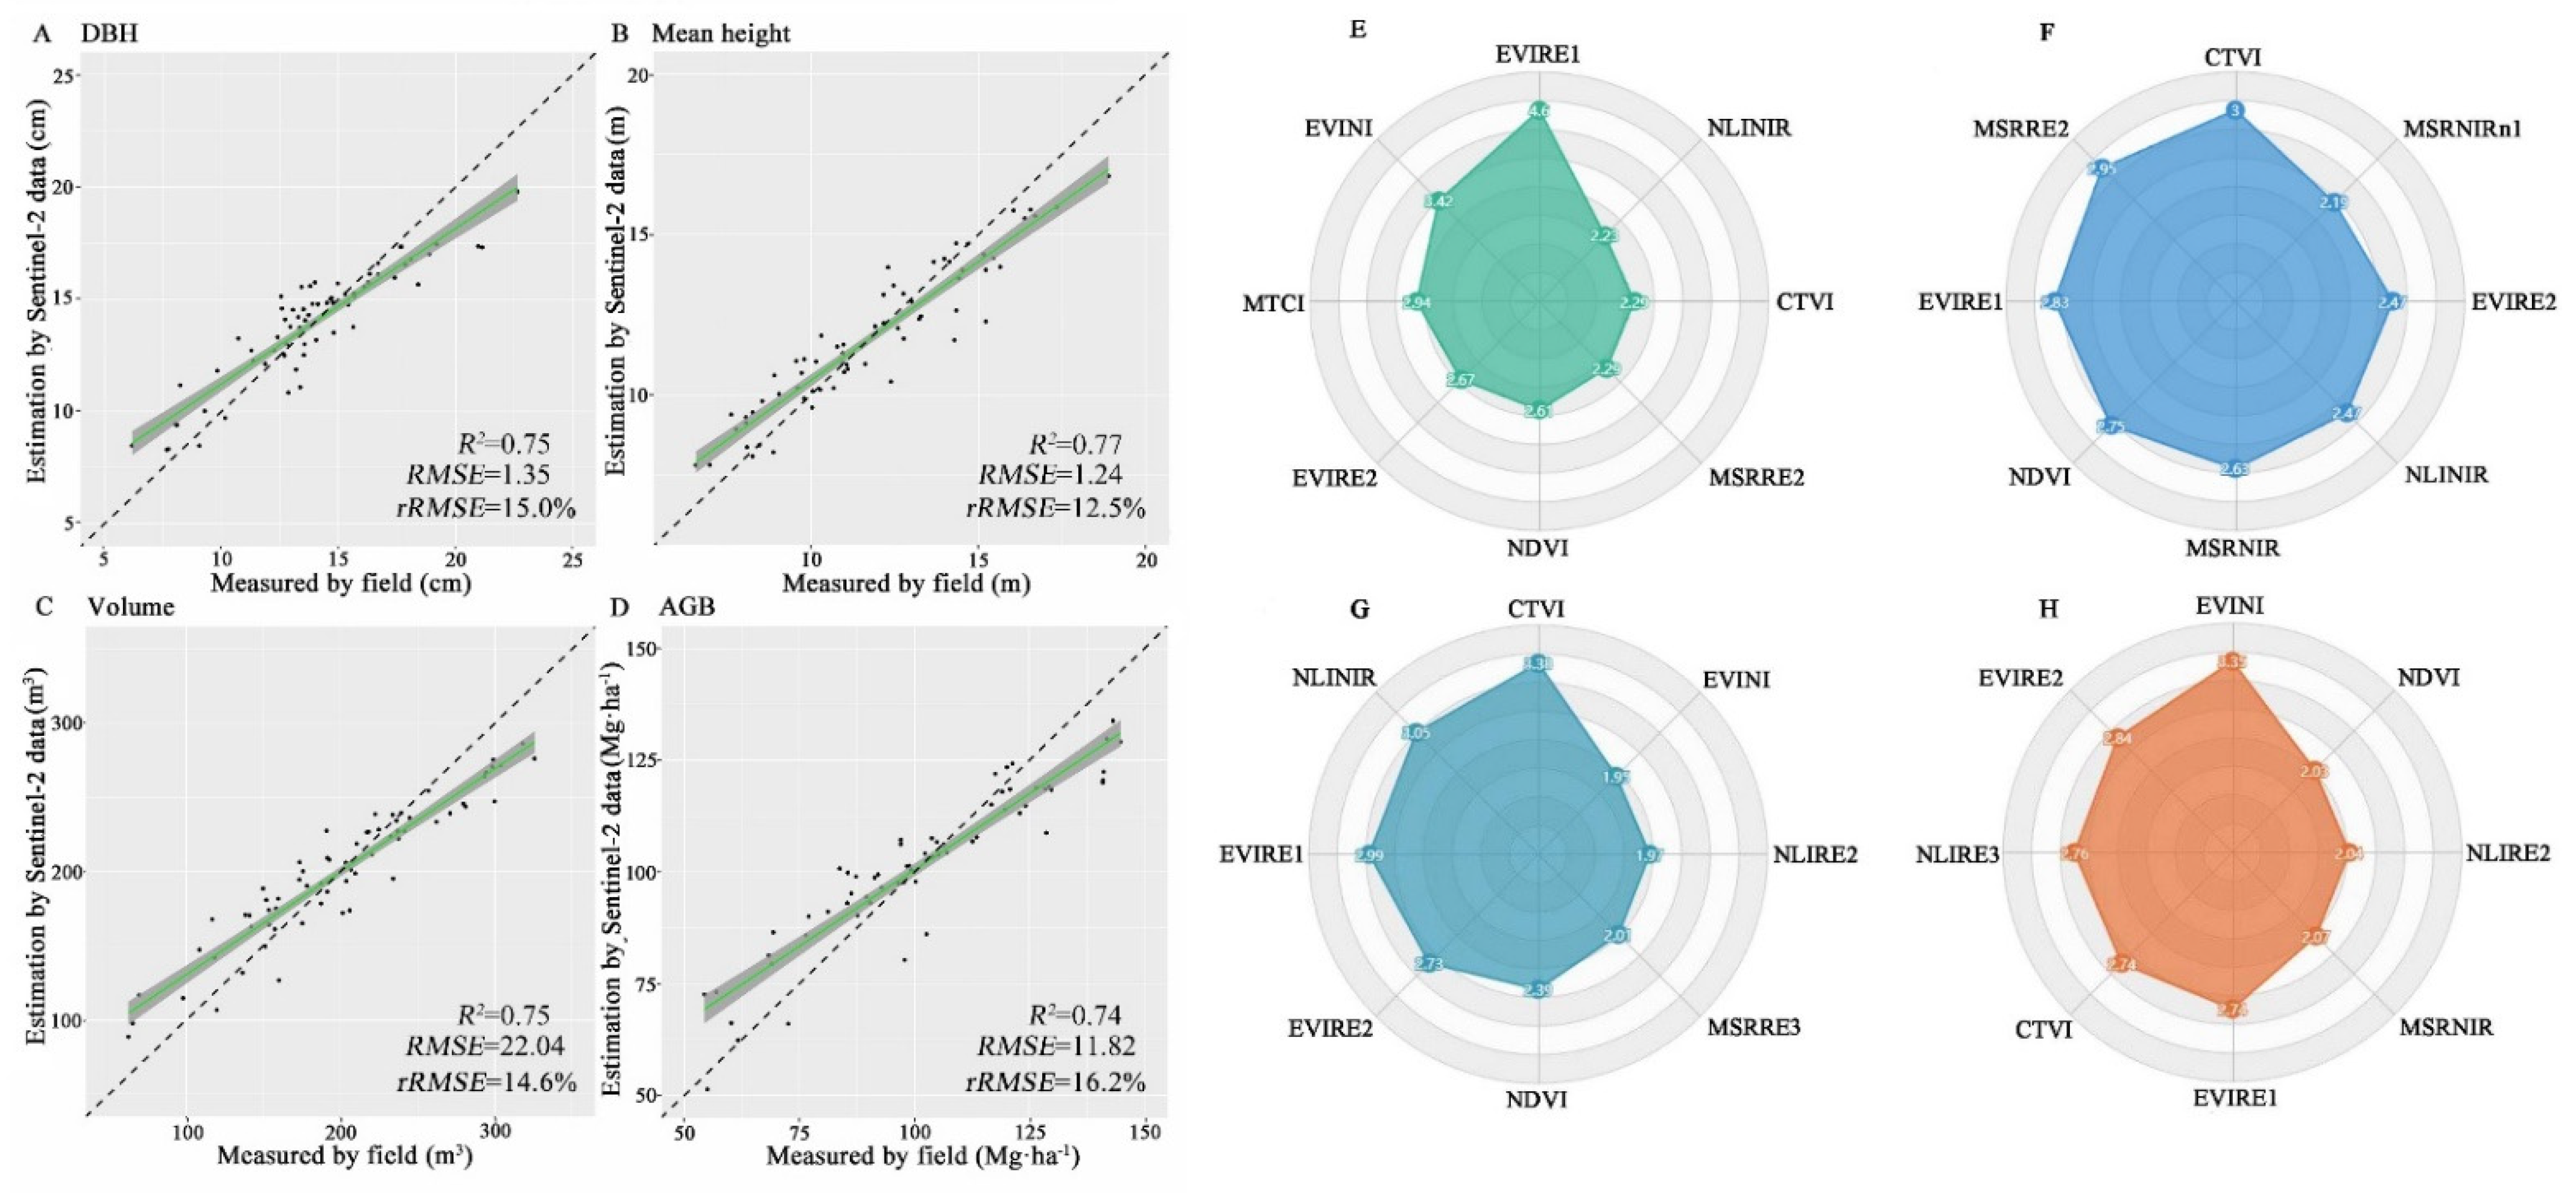
The scatter plots and variable importance ranking of forest parameters estimated at the landscape level by approach 1 are shown in Figure 5. It can be seen from Figure 5A–D that the estimation accuracy of average DBH is the highest (R2 = 0.64, rRMSE = 18.5%), followed by the estimation accuracy of average tree height (R2 = 0.66, rRMSE = 20.4%) and aboveground biomass (R2 = 0.63, rRMSE = 22.7%), which are higher than the estimation accuracy of volume (R2 = 0.61, rRMSE = 24.2%). Figure 5E–H show the importance ranking of vegetation indices extracted from Sentinel-2 data in random forest modeling with DBH, average tree height, volume and aboveground biomass, respectively, in which CTVI and the importance of other vegetation indices (NLIRE2, EVIRE1, and EVIRE2, etc.) calculated from the red edge band in building the model are also significant. An interesting phenomenon was found by observing the distribution of scatter plots: although the correlation between measured values and predicted values was not high, the standard deviation between them was small. This may indicate that the multispectral satellite imagery is not sensitive to the forest structural parameters while the forest stem density is too low or high.
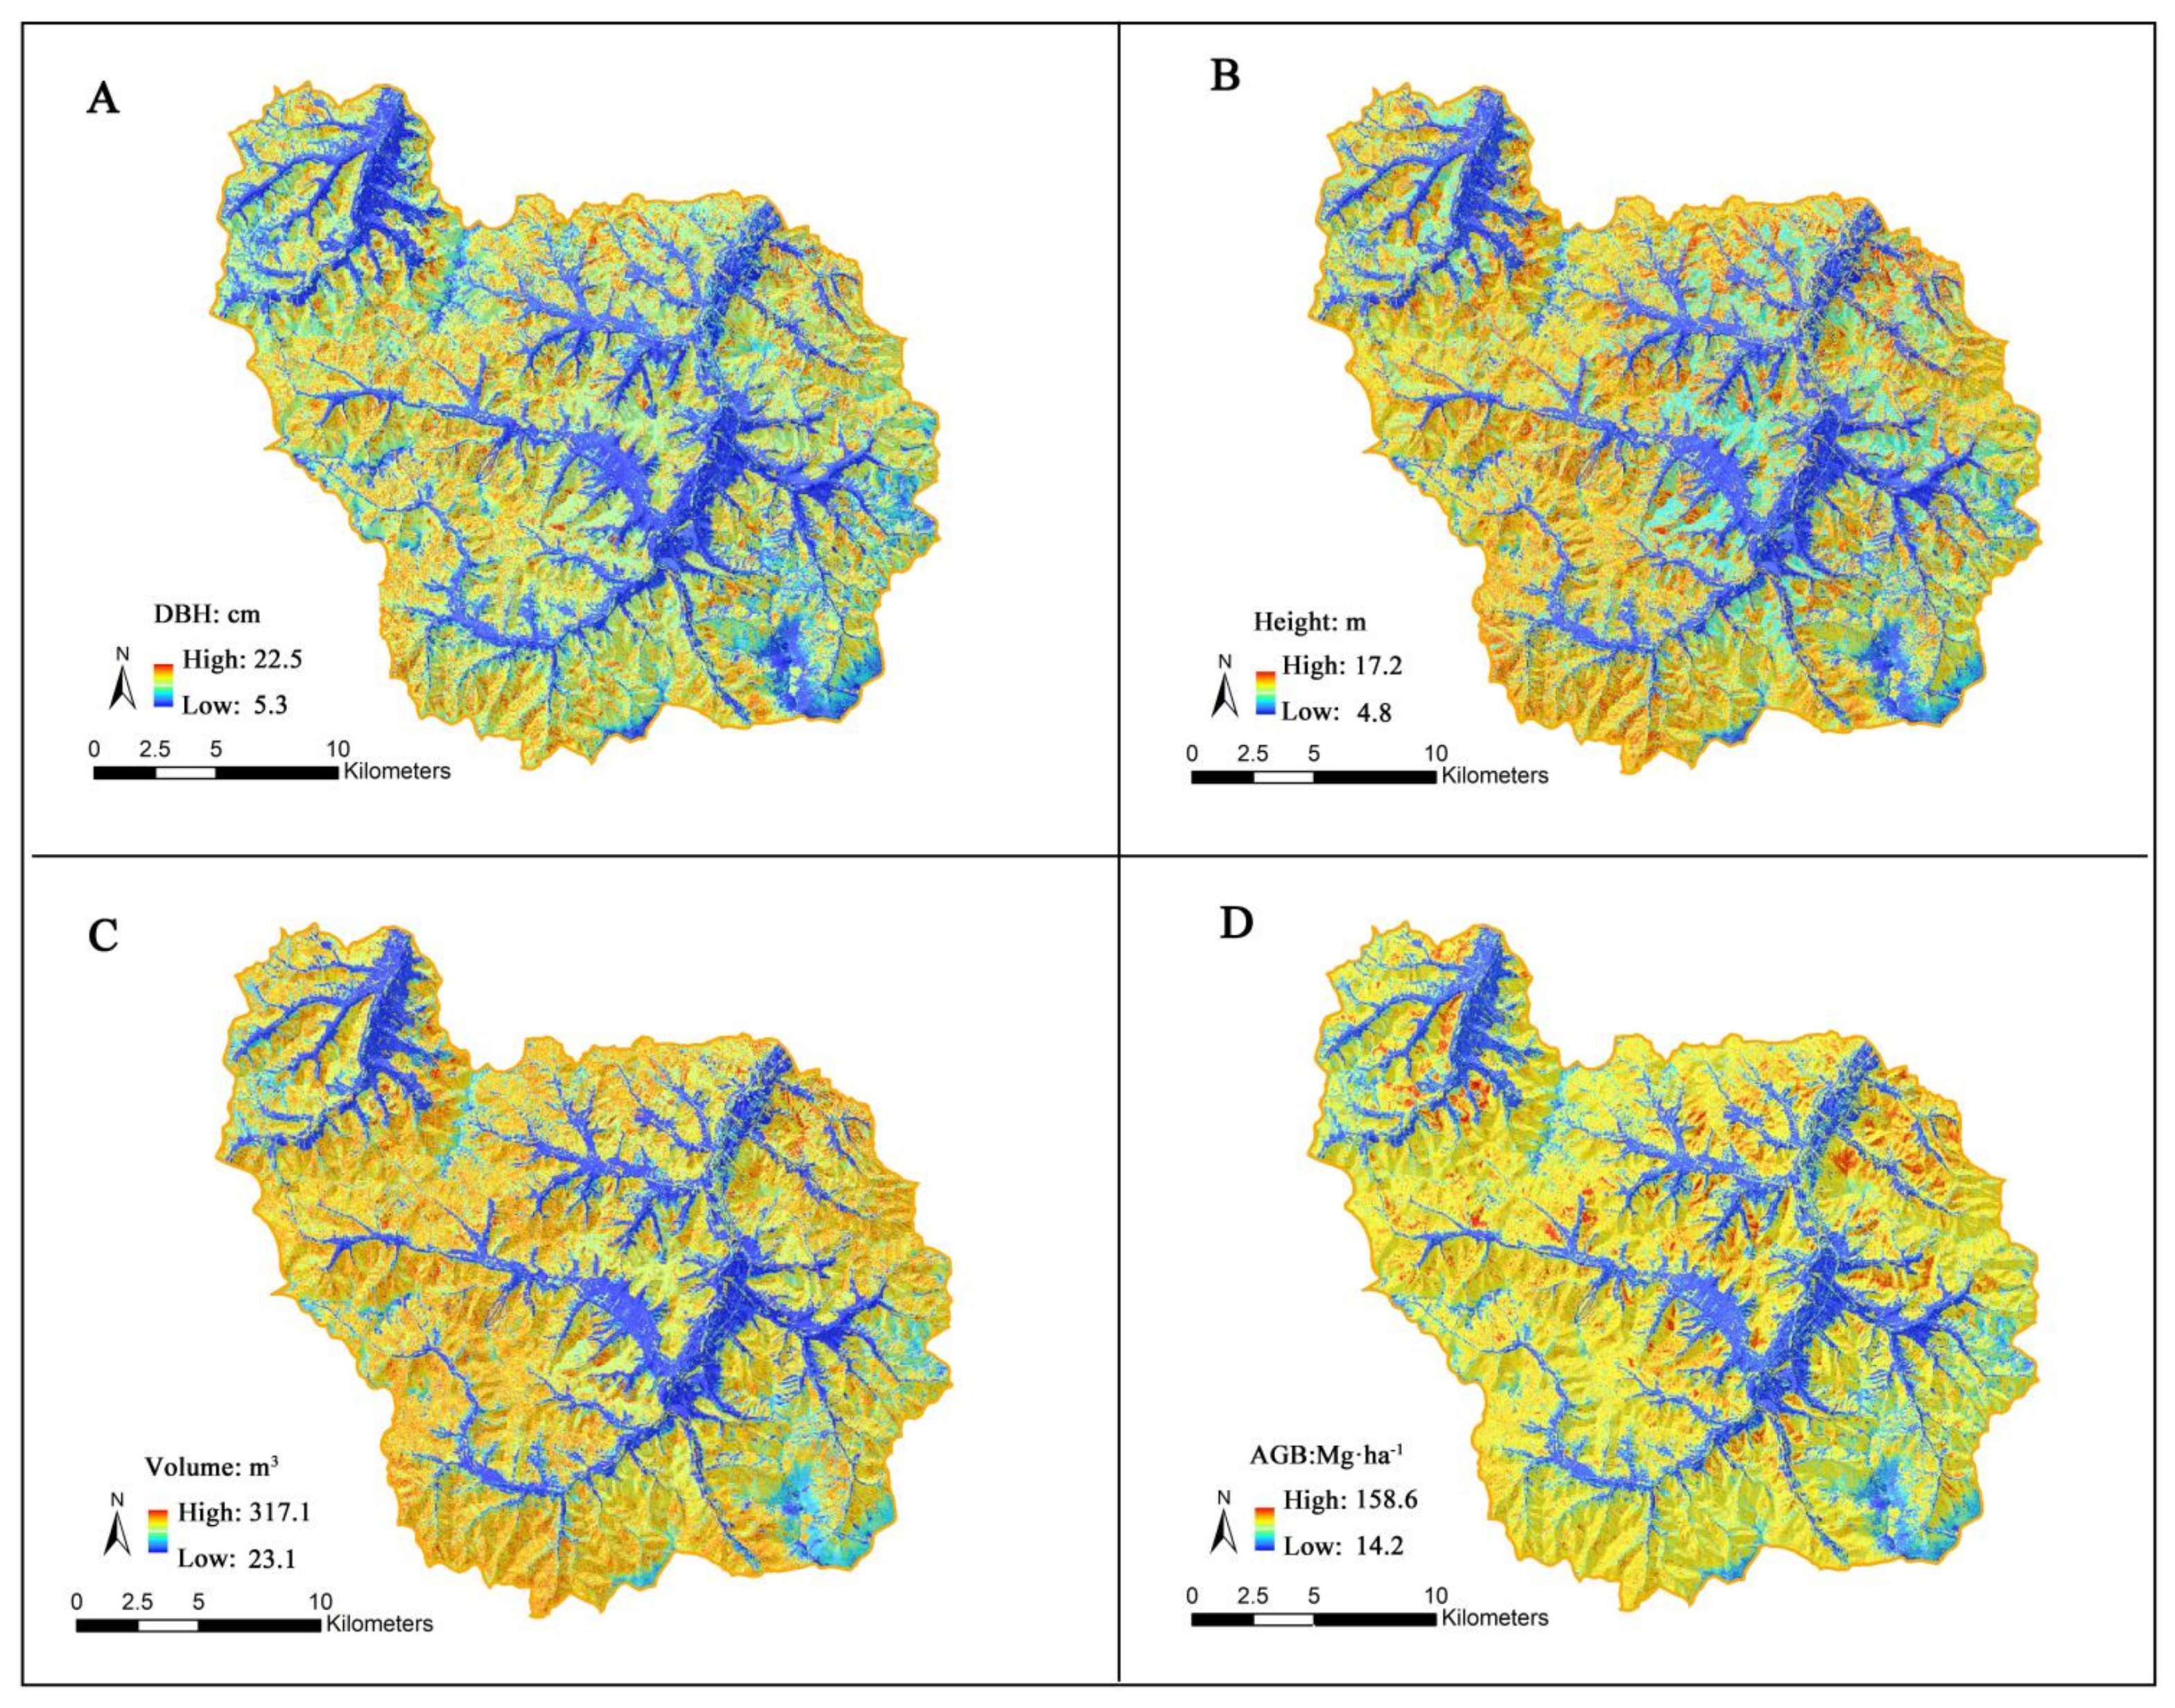
The distribution of forest structural parameters at the level of the forest farm estimated by approach 1 is shown in Figure 6. According to Figure 6A–D, the DBH estimation range was 5.3–22.5 cm, the average tree height estimation range was 4.8–17.2 m, the volume estimation range was 23.1–317.1 m3, and the aboveground biomass estimation range was 14.2–158.6 Mg·ha−1. By comparing the distribution trends of the four forest structural parameters, the values of the other three structural parameters were also high in the area with high average tree height, which showed that the overall distribution trend was in line with the growth of the forest.
Table 6 shows the sensitivity analysis results of random sample plots extracted from UAS-LiDAR transect data. The results show that there was little difference in the estimation accuracy of the eight groups of random plots, but with the increase in the number of plots, the estimation accuracy of four forest structural parameters tended to become higher.
Figure 7A1–H1 provides the scatterplots of forest structure parameters estimated by UAS-LiDAR at the sample plot level and the importance ranking of selected metrics (stage 1 of approach 2). It can be seen from A1–D1 that the accuracy of forest structural parameters estimated by UAS-LiDAR data is high (rRMSE s ≤ 10.6%). By comparing this figure with Figure 5, it is found that the estimation accuracy based on UAS-LiDAR data is better than that of Sentinel-2 data. E1–H1 show the importance ranking of the metrics extracted by UAS-LiDAR data participating in the random forest modeling of DBH, average tree height, volume, and aboveground biomass. The contribution of height quantiles to the model is high. Among them, height metrics such as h95 and h75 rank first in the importance ranking of the estimation of four forest structural parameters, which shows that the upper percentile of LiDAR data has a direct correlation with forest structural parameters.
In the area where the UAS-LiDAR was used to estimate the forest structure parameters, the random forest model was established combined with the vegetation indices extracted from Sentinel-2 data to realize the forest parameter estimation at the landscape level (stage 2 of approach 2). By comparing the eight groups of sensitivity analysis results, it was found that the estimation accuracy of forest structural parameters was the highest when the number of random sample plots was set to 600 (Table 6). Figure 7A2–D2 show the scatterplots of forest structural parameters at the landscape level estimated by stage 2 of approach 2 within 600 random sample plots, and the importance ranking of variables. As can be seen from Figure 7A2–D2, the accuracy of four forest structural parameters estimated by approach 2 was better than that of approach 1. Among them, the estimation accuracy of average tree height was the highest (rRMSE = 11.3%), followed by DBH (rRMSE = 12.7%) and aboveground biomass (rRMSE = 14.9%). Figure 7E2–H2 show the importance ranking of vegetation indices extracted from Sentinel-2 data in the random forest modeling of DBH, average tree height, volume, and aboveground biomass. The contribution value of the vegetation indices generated by EVIRE1 and other red edge bands in these forest structural parameter estimation models was high, which reflected the certain advantages of the red edge band in monitoring forest parameters.
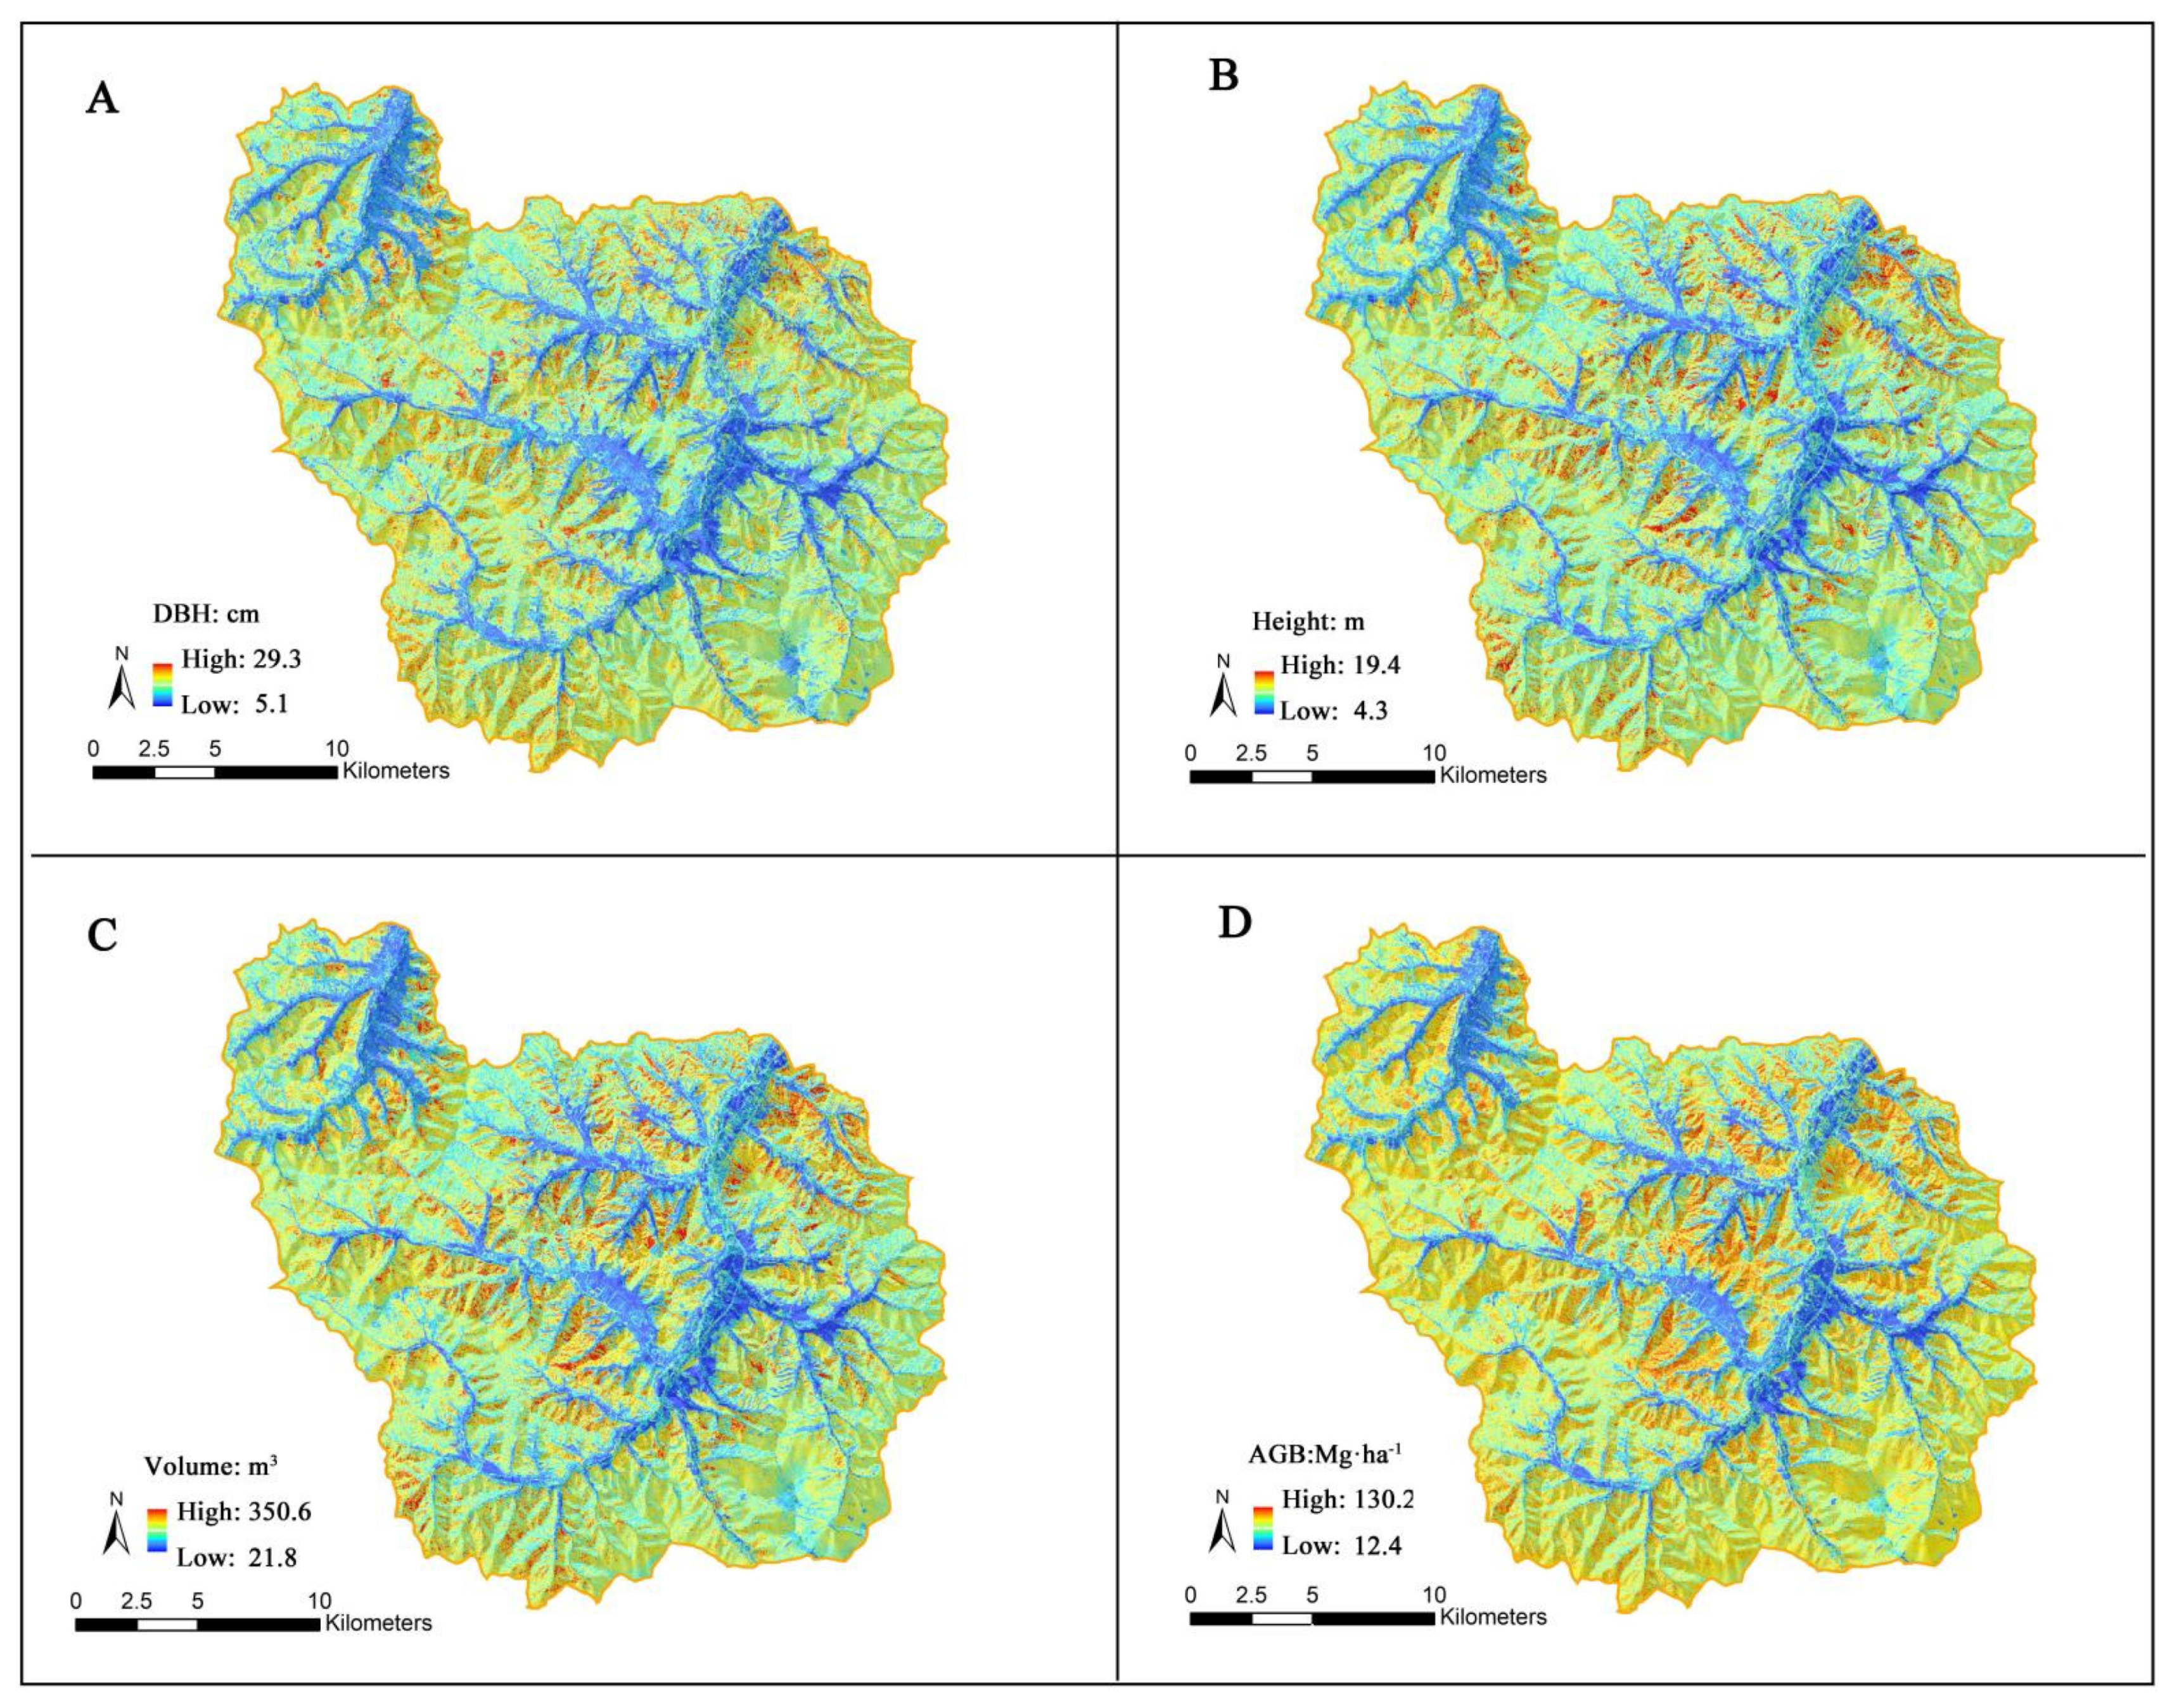
Figure 8 shows the distribution of forest parameters at the level of the forest farm estimated by approach 2. Figure 8A–D show the DBH, average tree height, volume and aboveground biomass, respectively. Among them, the DBH estimation range was 5.1–29.3 cm, the average tree height estimation range was 4.3–19.4 m, the volume estimation range was 21.8–350.6 m3, and the aboveground biomass estimation range was 12.4–130.2 Mg·ha−1. By comparing the threshold range of the products generated by approach 1, the threshold range of the products generated by approach 2 is closer to the measured range of sample plots.
The scatterplots and variable importance ranking of forest parameters estimated at the level of the forest farm by approach 3 are shown in Figure 9. Similar to the results obtained by the previous two approaches, the estimation accuracy of four forest structural parameters was higher than 87%. Among them, the estimation accuracy of tree height was the highest (R2 = 0.77, rRMSE = 12.5%), followed by the estimation accuracy of above volume (R2 = 0.75, rRMSE = 14.6%), which was slightly higher than the estimation accuracy of ground biomass and DBH. Figure 9 E–H show the importance ranking of vegetation indices extracted from Sentinel-2 data in the random forest modeling of DBH, average tree height, volume, and aboveground biomass. Among them, EVIRE1, EVIRE2, and NLIRE2, which were extracted by the red edge band, were shown to still be important features for estimating forest structural parameters. Similar to the results of the first two approaches, CTVI and EVINI were also important metrics of estimating forest structural parameters at the forest farm level.
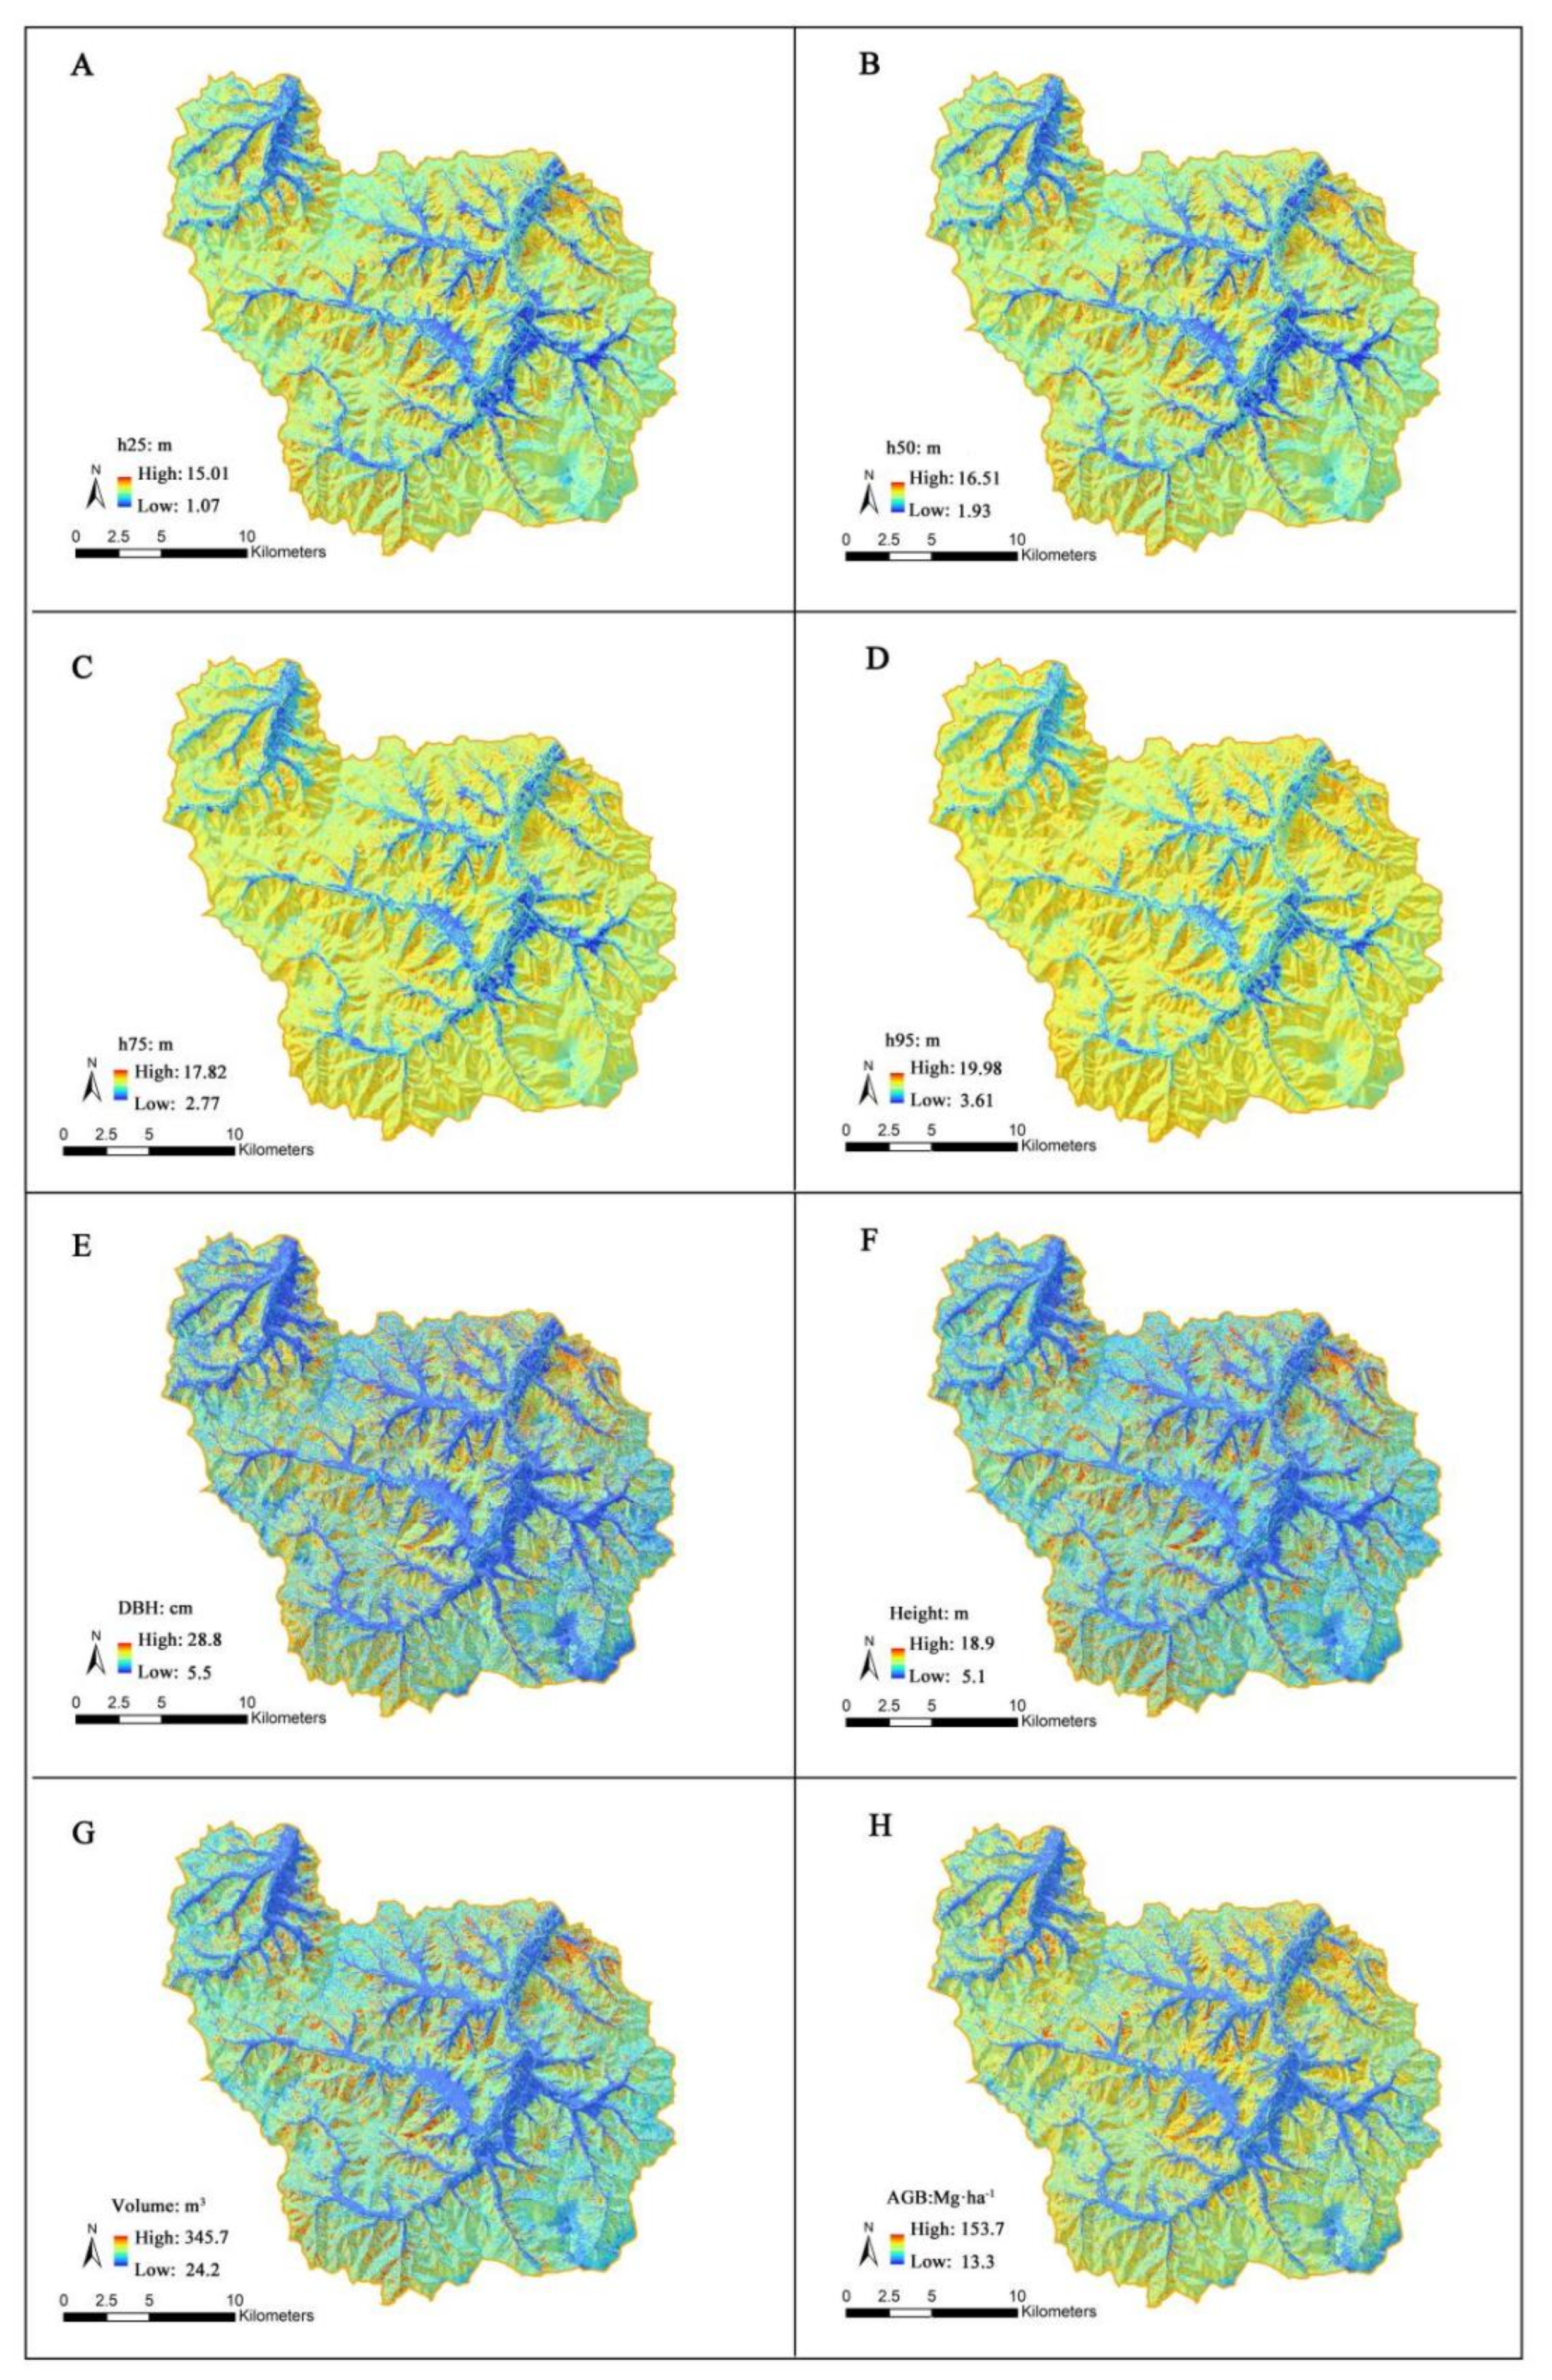
Figure 10 shows the distribution of UAS-LiDAR metrics at the forest farm level constructed by combining the metrics extracted from UAS-LiDAR data with the vegetation indices extracted from Sentinel-2 data, and the distribution map of forest parameters at the landscape level estimated by approach 2 (A-D are h25, h50, h75, and h95 UAS-LiDAR metrics, respectively, and E-H are DBH, average tree height, volume and aboveground biomass, respectively). By comparing the distribution of six UAS-LiDAR metrics, it was found that the distribution trend of the four height metrics was relatively close, and the h95 metric can reflect the overall horizontal distribution of forest tree height in the forest farm to a certain extent. The estimation range of DBH was 5.5–28.8 cm, the estimation range of average tree height was 5.1–18.9 m, the estimation range of volume was 24.3–345.7 m3, and the estimation range of aboveground biomass was 13.3–153.7 Mg·ha−1. Combined with the distribution of forest structure parameters produced by the three upscaling approaches, it was found that the overall distribution situation is similar. However, in the threshold range of tree height, the phenomenon of underestimation by approach 1 is more obvious, which may be due to the saturation of spectral information in at great heights.
By comparing the cross-validation accuracy of the three upscaling approaches to estimate forest structural parameters at the landscape level (Table 7), it was found that the accuracy of two upscale approaches using UAS-LiDAR data as the intermediate medium in approach 2 (R2 = 0.73–0.78, rRMSE = 14.5–19.6%) and approach 3 (R2 = 0.70–0.77, rRMSE = 17.1–20.2%) was better than that achieved when directly using Sentinel-2 data (approach 1) (R2 = 0.60–0.64, rRMSE = 24.9–34.9%). By comparing approach 2 and approach 3, it was found that approach 2 was better than approach 3 in estimating tree height, DBH and aboveground biomass. In the estimation of volume, the accuracy of approach 3 was better than that of approach 2. However, the results of the four forest structural parameters exhibited little difference (△R2 ≤ 0.03, △rRMSE ≤ 2.7%), which showed that the two approaches of introducing UAS-LiDAR transacts were reliable in estimating the forest structural parameters at the landscape level.

4. Discussion

4.1. Estimation of Forest Structural Parameters by UAS-LiDAR

Comparing the accuracy of three approaches to estimate forest structural parameters, the accuracy of using UAS-LiDAR data is better than that of directly using Sentinel-2 data, a result that is in agreement with previous findings [72,73]. This is because the traditional satellite data are limited by weak penetration and signal saturation [74,75], and their estimation accuracy often cannot meet the production demand. By comparing the scatter plots of forest structural parameter estimation in Figure 6 and Figure 7, it can be found that, when using approach 1 to estimate the high-value area of forest structural parameters, the predicted value is significantly lower than the measured value (light radiation saturation often occurs when estimating the structural parameters of mature forest), while the scatter plot slope of forest structural parameters estimated by UAS-LiDAR data is close to a 1:1 line. Meanwhile, with the development of UAS-LiDAR system technology, compared with spaceborne LiDAR and airborne LiDAR, UAS-LiDAR has a lower cost, higher point cloud density, simple operation, and flexible route design, and is not easily affected by clouds and bad weather. It can quickly acquire data in a small range [34,76,77]. Similar to the previous research results, in this study, UAS-LiDAR was used to estimate the four forest structural parameters at the sample plot level with an accuracy of rRMSE = 4.4%-10.6%, which showed that UAS-LiDAR data can quickly and accurately estimate the forest structural parameters at the sample plot level [28,78,79].

4.2. Estimation of Forest Structural Parameters by UAS-LiDAR Combined with Multi-Spectral Imageries

Although the penetration of satellite image data is limited, they have a short information acquisition cycle and low cost, and have certain advantages in estimating the structural parameters of continuous forest at the regional level [80]. Therefore, based on the accuracy advantage of LiDAR data and the level advantage of satellite image data in estimating forest structural parameters, we can combine these two datasets to estimate forest structural parameters with high accuracy.
Pflugmacher et al. [81] estimated the aboveground biomass of coniferous mixed forest in eastern Oregon by using airborne LiDAR data and Landsat data and carried out distribution mapping. The final result was R2 = 0.82, RMSE = 30.3 t/ha. These results are slightly lower than those of the aboveground biomass estimation accuracy of this study (R2 = 0.90, rRMSE = 11.6%), which is mainly because the research object is coniferous mixed forest, and the internal structural of the forest is relatively complex. On the other hand, airborne LiDAR data were used in the above study, and the point density was not less than 8 pts/m3, which is far lower than that of this study (not less than 25 pts/m3). Bolton et al. estimated the forest structural parameters of approximately 350,000 hectares of timber forest in western Canada using airborne LiDAR data and long-time Landsat data [82]. The estimation accuracy of tree height was R2 = 0.55, rRMSE = 16.4%, the accuracy of basal area was R2 = 0.65, rRMSE = 23.3%, and the accuracy of volume was R2 = 0.57, rRMSE = 34.1%. The research results show that the forest parameters estimated by spatially discrete airborne LiDAR can be expanded regionally through Landsat data, and the forest parameters with a regional continuous distribution can be obtained. In this study, the estimation accuracy of the three forest structural parameters was higher, especially the aboveground biomass. On the one hand, the research was based on a forest structural parameter distribution with 20 × 20 m resolution generated by airborne LiDAR data (the mapping resolution of this study is 10 m × 10 m). On the other hand, the Sentinel-2 data contained three bands in the range of red edge; the spectral reflectance curve of plants usually rises rapidly in the red edge band (center wavelength: 0.68–0.78 μm), and this slope is highly correlated with chlorophyll content per unit area [83]. It can be seen from the sequence of metrics by importance in Figure 6, Figure 7 and Figure 8 that vegetation indexes calculated by the red edge band, such as EVIRE1, EVIRE2, and NLIRE2, contribute greatly to the model, showing a strong correlation between red edge vegetation indices and forest structural parameters [56,84,85]. Wang et al. [86] also used UAS-LiDAR strip data and Sentinel-2 data to estimate the aboveground biomass of mangroves in the northeast of Hainan Island, China. The research results show that the extrapolation estimation of the aboveground biomass of mangroves can be well realized by using these two data, and the final results were accurate (R2 = 0.62, RMSE = 50.36 t/ha). Compared with the results of the above study, the R2 of estimating aboveground biomass in this study is higher. In addition to the complex internal structural of mangroves and the presence of many tree species, the geographical factors in the study area limit the sampling range of UAS-LiDAR strip data, resulting in weak representativeness of sampling. Based on the previous field work, and comprehensively considering the tree species, tree age distribution and topographic factors, this study conducted a typical stand sampling design for the UAS-LiDAR strip, which can more accurately describe the overall distribution of forest structural parameters within the forest farm [87,88,89].
Although the accuracy of two upscale approaches using UAS-LiDAR data as the intermediate medium in approach 2 (R2 = 0.73–0.78, rRMSE = 14.5–19.6%) and approach 3 (R2 = 0.70–0.77, rRMSE = 17.1–20.2%) was better than that achieved when directly using Sentinel-2 data (approach 1) (R2 = 0.60–0.64, rRMSE = 24.9–34.9%), the cost of approach 1 is lower in terms of data acquisition and calculation. Additionally, approach 1 can be used to quickly obtain forest structure parameters at the landscape level when the forest farm does not have a sufficient budget. By comparing the estimation accuracy of approach 2 and approach 3, it was found that approach 2 was better than approach 3 in estimating tree height, DBH, and aboveground biomass. In the estimation of volume, the accuracy of approach 3 was better than that of approach 2. The two approaches have their own advantages in estimating forest structural parameters at the landscape level, and the estimation accuracy of approach 2 was slightly higher. However, approach 3 can obtain the UAS-LiDAR metrics at the landscape level, which is convenient for calculating other forest structural parameters by using LiDAR metrics, such as leaf area index [90] and canopy cover [72].

4.3. Sample Amplification Using UAS-LiDAR Data

In recent years, the metrics extracted from UAS-LiDAR point cloud data have been proved to be highly correlated with many kinds of forest structural parameters (tree height, DBH, volume, aboveground biomass and leaf area index, etc.), and have been used by a large number of research institutions and manufacturers to quickly obtain forest structural information [29,91]. However, using UAS or airborne LiDAR data still has a high cost when used for large-area full-coverage data collection. Therefore, determining how to obtain forest structural parameters with low cost and high precision has become a focus of current research. Andersen et al. and Stahl et al. took the strip flight mode of the LiDAR system as a model-based sampling design from a statistical point of view [92,93]. When using this method, random sampling is required within the LiDAR data range, so there is no need to provide field data, and the cost of manual fieldwork is reduced (especially for remote and complex sample plots), but this method cannot provide unbiased estimations [94]. Based on previous studies, this study first used UAS-LiDAR data and field data to model and estimate the distribution of forest structural parameters in the UAS-LiDAR sampling area, so as to avoid unbiased estimation. At the same time, in order to explore the number of UAS-LiDAR sample plots with the highest accuracy for the upscale extrapolation of forest structural parameters (approach 2), 100–800 sample plots (increasing according by a gradient of 100; spatial resolution is the same as the ground sample plots) were selected in the UAS-LiDAR sampling area according to the method of random sampling (Table 6). Between 100 and 600 sample plots, the estimation accuracy increases greatly with an increase in the number of samples, indicating that the number of samples is an important factor affecting the estimation accuracy, a finding similar to that of Wang et al. [86]. Between 600 and 800 plots, the accuracy does not change significantly with the increase in the number of samples, which may indicate that the strongest estimation ability can be found when the sample size reaches a certain number [95].

5. Conclusions

Rapid and accurate acquisition of multi-scale forest structural parameters of plantation from individual tree level to landscape level can provide data support for sustainable forest management, which plays an important role in precise silviculture. In this study, the multi-level (from individual tree level to sample plot level to landscape level) forest structural parameters of Larch and Chinese pine in WEF in North China were estimated by using UAS-LiDAR transects data and full coverage sentinel-2 multispectral satellite data. At the individual tree level, a PCS algorithm was used to extract the individual tree position and tree height information by UAS-LiDAR data. At the sample plot level and landscape level, three approaches were developed and used to estimate forest structural parameters from sample plot level and landscape level by UAS-LiDAR transects data and Sentinel-2 data. The results showed that PCS algorithm can accurately extract the individual tree position (F = 0.77–0.97) and individual tree height information (rRMSE = 1.5–3.3%), when estimating the forest structural parameters at the sample plot and forest farm level, after introducing the UAS-LiDAR transects data as the intermediate data (approach 2 and approach 3), the estimation accuracy (R2 = 0.70–0.78, rRMSE = 14.5–20.2%) was obviously better than that directly through Sentinel-2 data (approach 1) (R2 = 0.60–0.64, rRMSE = 22.9–27.3%). This study showed that the datasets of multi-scale plantation structural parameters in a forest farm can be created by UAS-LiDAR transects data and full coverage Sentinel-2 data. It also provided a technical method and data support for forests plantation resource monitoring and management.

Author Contributions

Writing—Original Draft Preparation, X.W.; Conceptualization, L.C. and X.W.; Methodology, X.W. and L.C.; Software, X.W. and X.S.; Validation, X.W. and X.S.; Formal Analysis, X.W. and X.S.; Investigation, X.W. and Z.Z.; Resources, L.C. and F.C.; Writing—Review and Editing, X.W., X.S. and L.C.; Visualization, X.W. and Z.Z.; Supervision, F.C. and G.S.; Funding Acquisition, L.C. All authors have read and agreed to the published version of the manuscript.

Funding

This research was funded by the National Key Research and Development Program (2017YFD0600904), the National Natural Science Foundation of China (31922055), and the Priority Academic Program Development of Jiangsu Higher Education Institutions (PAPD).

Acknowledgments

The authors gratefully acknowledge the foresters in Wangyedian Experimental Forest for their assistance with data collection. Special thanks to Qingwang Liu (Associate researcher from the Institute of Forest Resource Information Techniques, CAF) for leading the UAS campaign and Wenchen Li (Vice-director of the Wangyedian Experimental Forest) for sharing his rich knowledge of the local forests. We also would like to thank the graduate students from the project of the National Key Research and Development Program for helping in fieldwork and providing suggestions for improving the research.

Conflicts of Interest

The authors declare no conflict of interest.

References

  1. Pan, Y.; Birdsey, R.A.; Phillips, O.L.; Jackson, R.B. The Structure, Distribution, and Biomass of the World’ s Forests. Annu. Rev. Ecol. Evol. Syst. 2013, 44, 593–622. [Google Scholar] [CrossRef] [Green Version]
  2. Volkov, I.; Banavar, J.R.; Maritan, A.; Hubbell, S.P.; Clark, J.S.; Mclachlan, J.S. The stability of forest. Nature 2004, 427, 696. [Google Scholar] [CrossRef] [PubMed]
  3. Mountain, R.; Collins, F.; Collins, F.; Square, N.; Southwest, P.; Hole, W.; Sciences, E.; Region, N.; Biology, E. A synthesis of current knowledge on forests and carbon storage in the United States. ISSUES Ecol. 2011, 21, 1902–1924. [Google Scholar]
  4. Carnus, J.-M.; Parrotta, J.A.; Brockerhoff, E.G.; Arbez, M.; Jactel, H.; Kremer, A.; Lamb, D.; O’Hara, K.; Walters, B. Planted forests and biodiversity. J. For. 2006, 104, 65–77. [Google Scholar] [CrossRef]
  5. Rodríguez-suárez, J.A.; Soto, B.; Perez, R.; Diaz-fierros, F. Influence of Eucalyptus globulus plantation growth on water table levels and low flows in a small catchment. J. Hydrol. 2011, 396, 321–326. [Google Scholar] [CrossRef]
  6. Fagan, M.E.; Morton, D.C.; Cook, B.D.; Masek, J.; Zhao, F.; Nelson, R.F.; Huang, C. Mapping pine plantations in the southeastern U.S. using structural, spectral, and temporal remote sensing data. Remote Sens. Environ. 2018, 216, 415–426. [Google Scholar] [CrossRef]
  7. Li, H.; Bo, H.; Wang, J.; Shao, H.; Huang, S. Separation of supercoiled from open circular forms of plasmid DNA, and biological activity detection. Cytotechnology 2011, 63, 7–12. [Google Scholar] [CrossRef] [Green Version]
  8. Avtar, R.; Suzuki, R.; Sawada, H. Natural forest biomass estimation based on plantation information using PALSAR data. PLoS ONE 2014, 9, e86121. [Google Scholar] [CrossRef]
  9. Dabi, H.; Bordoloi, R.; Das, B.; Paul, A.; Tripathi, O.P.; Mishra, B.P. Biomass, carbon stock and soil physicochemical properties in plantation of East Siang district, Arunachal Pradesh, India. Environ. Chall. 2021, 4, 100191. [Google Scholar] [CrossRef]
  10. Wulder, M.A.; Skakun, R.S.; Kurz, W.A.; White, J.C. Estimating time since forest harvest using segmented Landsat ETM+ imagery. Remote Sens. Environ. 2004, 93, 179–187. [Google Scholar] [CrossRef]
  11. Cao, L.; Coops, N.C.; Innes, J.L.; Sheppard, S.R.J.; Fu, L.; Ruan, H.; She, G. Estimation of forest biomass dynamics in subtropical forests using multi-temporal airborne LiDAR data. Remote Sens. Environ. 2016, 178, 158–171. [Google Scholar] [CrossRef]
  12. Lefsky, M.; Cohen, W.; Parker, G.; Harding, D. Lidar Remote Sensing for Ecosystem Studies. Bioscience 2002, 52, 19–30. [Google Scholar] [CrossRef]
  13. Lisein, J.; Pierrot-Deseilligny, M.; Bonnet, S.; Lejeune, P. A photogrammetric workflow for the creation of a forest canopy height model from small unmanned aerial system imagery. Forests 2013, 4, 922–944. [Google Scholar] [CrossRef] [Green Version]
  14. Dandois, J.P.; Ellis, E.C. High spatial resolution three-dimensional mapping of vegetation spectral dynamics using computer vision. Remote Sens. Environ. 2013, 136, 259–276. [Google Scholar] [CrossRef] [Green Version]
  15. Li, L.; Guo, Q.; Tao, S.; Kelly, M.; Xu, G. Lidar with multi-temporal MODIS provide a means to upscale predictions of forest biomass. ISPRS J. Photogramm. Remote Sens. 2015, 102, 198–208. [Google Scholar] [CrossRef]
  16. Gleason, C.; Im, J. A review of remote sensing of forest biomass and biofuel: Options for small-area applications. GIScience Remote Sens. 2011, 48, 141–170. [Google Scholar] [CrossRef]
  17. Lu, D. The potential and challenge of remote sensing-based biomass estimation. Int. J. Remote Sens. 2006, 27, 1297–1328. [Google Scholar] [CrossRef]
  18. Hyyppä, J.; Hyyppä, H.; Leckie, D.; Gougeon, F.; Yu, X.; Maltamo, M. Review of methods of small-footprint airborne laser scanning for extracting forest inventory data in boreal forests. Int. J. Remote Sens. 2008, 29, 1339–1366. [Google Scholar] [CrossRef]
  19. Hall, S.A.; Burke, I.C.; Box, D.O.; Kaufmann, M.R.; Stoker, J.M. Estimating stand structure using discrete-return lidar: An example from low density, fire prone ponderosa pine forests. For. Ecol. Manag. 2005, 208, 189–209. [Google Scholar] [CrossRef]
  20. Andersen, H.; Mcgaughey, R.J.; Reutebuch, S.E. Estimating forest canopy fuel parameters using LIDAR data. Remote Sens. Environ. 2005, 94, 441–449. [Google Scholar] [CrossRef]
  21. Dandois, J.P.; Ellis, E.C. Remote Sensing of Vegetation Structure Using Computer Vision. Remote Sens. 2010, 2, 1157–1176. [Google Scholar] [CrossRef] [Green Version]
  22. Breidenbach, J.; Næsset, E.; Lien, V.; Gobakken, T.; Solberg, S. Prediction of species specific forest inventory attributes using a nonparametric semi-individual tree crown approach based on fused airborne laser scanning and multispectral data. Remote Sens. Environ. 2010, 114, 911–924. [Google Scholar] [CrossRef]
  23. Ferraz, A.; Bretar, F.; Jacquemoud, S.; Gonçalves, G.; Pereira, L.; Tomé, M.; Soares, P. 3-D mapping of a multi-layered Mediterranean forest using ALS data. Remote Sens. Environ. 2012, 121, 210–223. [Google Scholar] [CrossRef]
  24. White, J.C.; Coops, N.C.; Wulder, M.A.; Vastaranta, M.; Hilker, T.; Tompalski, P. Remote Sensing Technologies for Enhancing Forest Inventories: A Review. Can. J. Remote Sens. 2016, 42, 619–641. [Google Scholar] [CrossRef] [Green Version]
  25. Jaakkola, A.; Hyyppä, J.; Kukko, A.; Yu, X.; Kaartinen, H.; Lehtomäki, M.; Lin, Y. A low-cost multi-sensoral mobile mapping system and its feasibility for tree measurements. ISPRS J. Photogramm. Remote Sens. 2010, 65, 514–522. [Google Scholar] [CrossRef]
  26. Zahawi, R.A.; Dandois, J.P.; Holl, K.D.; Nadwodny, D.; Reid, J.L.; Ellis, E.C. Using lightweight unmanned aerial vehicles to monitor tropical forest recovery. Biol. Conserv. 2015, 186, 287–295. [Google Scholar] [CrossRef] [Green Version]
  27. Nagai, M.; Witayangkurn, A.; Shrestha, A.; Chinnachodteeranun, R.; Honda, K.; Shibasaki, R. UAV-based sesor web moitorig system. Int. J. Navig. Obs. 2009, 2, 785–789. [Google Scholar]
  28. Torresan, C.; Berton, A.; Carotenuto, F.; Di Gennaro, S.F.; Gioli, B.; Matese, A.; Miglietta, F.; Vagnoli, C.; Zaldei, A.; Wallace, L. Forestry applications of UAVs in Europe: A review. Int. J. Remote Sens. 2017, 38, 2427–2447. [Google Scholar] [CrossRef]
  29. Liu, Q.; Li, S.; Li, Z.; Fu, L.; Hu, K. Review on the Applications of UAV-Based LiDAR and Photogrammetry in Forestry. Sci. Silvae Sin. 2017, 53, 134–148. [Google Scholar] [CrossRef]
  30. Li, W.; Guo, Q.; Jakubowski, M.K.; Kelly, M. A New Method for Segmenting Individual Trees from the Lidar Point Cloud. Photogramm. Eng. Remote Sens. 2012, 78, 75–84. [Google Scholar] [CrossRef] [Green Version]
  31. Tao, S.; Guo, Q.; Li, L.; Xue, B.; Kelly, M.; Li, W.; Xu, G.; Su, Y. Airborne Lidar-derived volume metrics for aboveground biomass estimation: A comparative assessment for conifer stands. Agric. For. Meteorol. 2014, 198–199, 24–32. [Google Scholar] [CrossRef]
  32. Wu, X.; Shen, X.; Cao, L.; Wang, G.; Cao, F. Assessment of individual tree detection and canopy cover estimation using unmanned aerial vehicle based light detection and ranging (UAV-LiDAR) data in planted forests. Remote Sens. 2019, 11, 908. [Google Scholar] [CrossRef] [Green Version]
  33. Wallace, L.; Musk, R.; Lucieer, A. An assessment of the repeatability of automatic forest inventory metrics derived from UAV-borne laser scanning data. IEEE Trans. Geosci. Remote Sens. 2014, 52, 7160–7169. [Google Scholar] [CrossRef]
  34. Liu, K.; Shen, X.; Cao, L.; Wang, G.; Cao, F. ISPRS Journal of Photogrammetry and Remote Sensing Estimating forest structural attributes using UAV-LiDAR data in Ginkgo plantations. ISPRS J. Photogramm. Remote Sens. 2018, 146, 465–482. [Google Scholar] [CrossRef]
  35. Dempewolf, J.; Nagol, J.; Hein, S.; Thiel, C.; Zimmermann, R. Measurement of within-season tree height growth in a mixed forest stand using UAV imagery. Forests 2017, 8, 231. [Google Scholar] [CrossRef] [Green Version]
  36. Goldbergs, G.; Maier, S.W.; Levick, S.R.; Edwards, A. Efficiency of individual tree detection approaches based on light-weight and low-cost UAS imagery in Australian Savannas. Remote Sens. 2018, 10, 161. [Google Scholar] [CrossRef] [Green Version]
  37. Frazier, R.J.; Coops, N.C.; Wulder, M.A.; Kennedy, R. ISPRS Journal of Photogrammetry and Remote Sensing Characterization of aboveground biomass in an unmanaged boreal forest using Landsat temporal segmentation metrics. ISPRS J. Photogramm. Remote Sens. 2014, 92, 137–146. [Google Scholar] [CrossRef]
  38. Zald, H.S.J.; Wulder, M.A.; White, J.C.; Hilker, T.; Hermosilla, T.; Hobart, G.W.; Coops, N.C. Remote Sensing of Environment Integrating Landsat pixel composites and change metrics with lidar plots to predictively map forest structure and aboveground biomass in. Remote Sens. Environ. 2016, 176, 188–201. [Google Scholar] [CrossRef] [Green Version]
  39. Chi, H.; Sun, G.; Huang, J.; Li, R.; Ren, X.; Ni, W. Estimation of Forest Aboveground Biomass in Changbai Mountain Region Using ICESat/GLAS and Landsat/TM Data. Remote Sens. 2017, 9, 707. [Google Scholar] [CrossRef] [Green Version]
  40. Matasci, G.; Hermosilla, T.; Wulder, M.A.; White, J.C.; Coops, N.C.; Hobart, G.W.; Zald, H.S.J. Large-area mapping of Canadian boreal forest cover, height, biomass and other structural attributes using Landsat composites and lidar plots. Remote Sens. Environ. 2018, 209, 90–106. [Google Scholar] [CrossRef]
  41. Shen, W.; Li, M.; Huang, C.; Tao, X.; Wei, A. Agricultural and Forest Meteorology Annual forest aboveground biomass changes mapped using ICESat/GLAS measurements, historical inventory data, and time-series optical and radar imagery for Guangdong province, China. Agric. For. Meteorol. 2018, 259, 23–38. [Google Scholar] [CrossRef] [Green Version]
  42. Liu, Z.; Lin, H.; Long, J.; Li, X. Study on volume estimation model of Wangyedian forest farm based on GF-2. J. Cent. South Univ. For. Technol. 2020, 3, 79–84,118. [Google Scholar] [CrossRef]
  43. Zhao, X.; Guo, Q.; Su, Y.; Xue, B. Improved progressive TIN densification filtering algorithm for airborne LiDAR data in forested areas. ISPRS J. Photogramm. Remote Sens. 2016, 117, 79–91. [Google Scholar] [CrossRef] [Green Version]
  44. Véga, C.; Durrieu, S.; Morel, J.; Allouis, T. A sequential iterative dual-filter for Lidar terrain modeling optimized for complex forested environments. Comput. Geosci. 2012, 44, 31–41. [Google Scholar] [CrossRef]
  45. Meng, X.; Wang, L.; Silván-Cárdenas, J.L.; Currit, N. A multi-directional ground filtering algorithm for airborne LIDAR. ISPRS J. Photogramm. Remote Sens. 2009, 64, 117–124. [Google Scholar] [CrossRef] [Green Version]
  46. Mura, M.; Bottalico, F.; Giannetti, F.; Bertani, R.; Giannini, R.; Mancini, M.; Orlandini, S.; Travaglini, D.; Chirici, G. Exploiting the capabilities of the Sentinel-2 multi spectral instrument for predicting growing stock volume in forest ecosystems. Int. J. Appl. Earth Obs. Geoinf. 2018, 66, 126–134. [Google Scholar] [CrossRef]
  47. Valderrama-Landeros, L.; Flores-de-Santiago, F.; Kovacs, J.M.; Flores-Verdugo, F. An assessment of commonly employed satellite-based remote sensors for mapping mangrove species in Mexico using an NDVI-based classification scheme. Environ. Monit. Assess. 2018, 190, 23. [Google Scholar] [CrossRef]
  48. Dash, J.; Curran, P.J. The MERIS terrestrial chlorophyll index. Int. J. Remote Sens. 2004, 25, 5403–5413. [Google Scholar] [CrossRef]
  49. Wang, X.; Xie, S.; Zhang, X.; Chen, C.; Guo, H.; Du, J.; Duan, Z. A robust Multi-Band Water Index (MBWI) for automated extraction of surface water from Landsat 8 OLI imagery. Int. J. Appl. Earth Obs. Geoinf. 2018, 68, 73–91. [Google Scholar] [CrossRef]
  50. Naito, H.; Ogawa, S.; Valencia, M.O.; Mohri, H.; Urano, Y.; Hosoi, F.; Shimizu, Y.; Chavez, A.L.; Ishitani, M.; Selvaraj, M.G.; et al. Estimating rice yield related traits and quantitative trait loci analysis under different nitrogen treatments using a simple tower-based field phenotyping system with modified single-lens reflex cameras. ISPRS J. Photogramm. Remote Sens. 2017, 125, 50–62. [Google Scholar] [CrossRef]
  51. Reyes-Trujillo, A.; Daza-Torres, M.C.; Galindez-Jamioy, C.A.; Rosero-García, E.E.; Muñoz-Arboleda, F.; Solarte-Rodriguez, E. Estimating canopy nitrogen concentration of sugarcane crop using in situ spectroscopy. Heliyon 2021, 7, E06566. [Google Scholar] [CrossRef] [PubMed]
  52. Dang, A.T.N.; Nandy, S.; Srinet, R.; Luong, N.V.; Ghosh, S.; Senthil Kumar, A. Forest aboveground biomass estimation using machine learning regression algorithm in Yok Don National Park, Vietnam. Ecol. Inform. 2019, 50, 24–32. [Google Scholar] [CrossRef]
  53. Kowalski, K.; Senf, C.; Hostert, P.; Pflugmacher, D. Characterizing spring phenology of temperate broadleaf forests using Landsat and Sentinel-2 time series. Int. J. Appl. Earth Obs. Geoinf. 2020, 92, 102172. [Google Scholar] [CrossRef]
  54. Chen, J.M. Evaluation of vegetation indices and a modified simple ratio for boreal applications. Can. J. Remote Sens. 1996, 22, 229–242. [Google Scholar] [CrossRef]
  55. Hornero, A.; Hernández-Clemente, R.; North, P.R.J.; Beck, P.S.A.; Boscia, D.; Navas-Cortes, J.A.; Zarco-Tejada, P.J. Monitoring the incidence of Xylella fastidiosa infection in olive orchards using ground-based evaluations, airborne imaging spectroscopy and Sentinel-2 time series through 3-D radiative transfer modelling. Remote Sens. Environ. 2020, 236, 111480. [Google Scholar] [CrossRef]
  56. Fernández-Manso, A.; Fernández-Manso, O.; Quintano, C. SENTINEL-2A red-edge spectral indices suitability for discriminating burn severity. Int. J. Appl. Earth Obs. Geoinf. 2016, 50, 170–175. [Google Scholar] [CrossRef]
  57. Wu, C.; Niu, Z.; Tang, Q.; Huang, W. Estimating chlorophyll content from hyperspectral vegetation indices: Modeling and validation. Agric. For. Meteorol. 2008, 148, 1230–1241. [Google Scholar] [CrossRef]
  58. Dong, T.; Liu, J.; Qian, B.; He, L.; Liu, J.; Wang, R.; Jing, Q.; Champagne, C.; McNairn, H.; Powers, J.; et al. Estimating crop biomass using leaf area index derived from Landsat 8 and Sentinel-2 data. ISPRS J. Photogramm. Remote Sens. 2020, 168, 236–250. [Google Scholar] [CrossRef]
  59. Chrysafis, I.; Mallinis, G.; Tsakiri, M.; Patias, P. Evaluation of single-date and multi-seasonal spatial and spectral information of Sentinel-2 imagery to assess growing stock volume of a Mediterranean forest. Int. J. Appl. Earth Obs. Geoinf. 2019, 77, 1–14. [Google Scholar] [CrossRef]
  60. Chrysafis, I.; Mallinis, G.; Siachalou, S.; Patias, P. Assessing the relationships between growing stock volume and sentinel-2 imagery in a mediterranean forest ecosystem. Remote Sens. Lett. 2017, 8, 508–517. [Google Scholar] [CrossRef]
  61. Goutte, C.; Gaussier, E. A Probabilistic Interpretation of Precision, Recall and F-Score, with Implication for Evaluation. Int. J. Radiat. Biol. Relat. Stud. Phys. Chem. Med. 2005, 3408, 345–359. [Google Scholar] [CrossRef]
  62. de Oliveira, M.F.; dos Santos, A.F.; Kazama, E.H.; de Souza Rolim, G.; da Silva, R.P. Determination of application volume for coffee plantations using artificial neural networks and remote sensing. Comput. Electron. Agric. 2021, 184, 106096. [Google Scholar] [CrossRef]
  63. Gibson, R.; Danaher, T.; Hehir, W.; Collins, L. A remote sensing approach to mapping fire severity in south-eastern Australia using sentinel 2 and random forest. Remote Sens. Environ. 2020, 240, 111702. [Google Scholar] [CrossRef]
  64. Breiman, L. Random forests. Mach. Learn. 2001, 45, 5–32. [Google Scholar] [CrossRef] [Green Version]
  65. Pham, L.T.H.; Brabyn, L. Monitoring mangrove biomass change in Vietnam using SPOT images and an object-based approach combined with machine learning algorithms. ISPRS J. Photogramm. Remote Sens. 2017, 128, 86–97. [Google Scholar] [CrossRef]
  66. Baccini, A.; Goetz, S.J.; Walker, W.S.; Laporte, N.T.; Sun, M.; Sulla-Menashe, D.; Hackler, J.; Beck, P.S.A.; Dubayah, R.; Friedl, M.A.; et al. Estimated carbon dioxide emissions from tropical deforestation improved by carbon-density maps. Nat. Clim. Chang. 2012, 2, 182–185. [Google Scholar] [CrossRef]
  67. Zhu, Z.; Woodcock, C.E. Remote Sensing of Environment Continuous change detection and classi fi cation of land cover using all available Landsat data. Remote Sens. Environ. 2014, 144, 152–171. [Google Scholar] [CrossRef] [Green Version]
  68. Ma, Q.; Su, Y.; Guo, Q. Comparison of Canopy Cover Estimations From. IEEE J. Sel. Top. Appl. Earth Obs. Remote Sens. 2017, 10, 4225–4236. [Google Scholar] [CrossRef]
  69. Carreiras, J.M.B.; Melo, J.B.; Vasconcelos, M.J. Estimating the Above-Ground Biomass in Miombo Savanna Woodlands (Mozambique, East Africa) Using L-Band Synthetic Aperture Radar Data. Remote Sens. 2013, 5, 1524–1548. [Google Scholar] [CrossRef] [Green Version]
  70. Draper, C.; Reichle, R.; de Jeu, R.; Naeimi, V.; Parinussa, R.; Wagner, W. Estimating root mean square errors in remotely sensed soil moisture over continental scale domains. Remote Sens. Environ. 2013, 137, 288–298. [Google Scholar] [CrossRef] [Green Version]
  71. He, X.; Lei, X.D.; Dong, L.H. How large is the difference in large-scale forest biomass estimations based on new climate-modified stand biomass models? Ecol. Indic. 2021, 126, 107569. [Google Scholar] [CrossRef]
  72. Coops, N.C.; Tompalski, P.; Goodbody, T.R.H.; Queinnec, M.; Luther, J.E.; Bolton, D.K.; White, J.C.; Wulder, M.A.; van Lier, O.R.; Hermosilla, T. Modelling lidar-derived estimates of forest attributes over space and time: A review of approaches and future trends. Remote Sens. Environ. 2021, 260, 112477. [Google Scholar] [CrossRef]
  73. Pajares, G. Overview and Current Status of Remote Sensing Applications Based on Unmanned Aerial Vehicles (UAVs). Photogramm. Eng. Remote Sens. 2015, 81, 281–330. [Google Scholar] [CrossRef] [Green Version]
  74. Lu, D.; Chen, Q.; Wang, G.; Moran, E.; Batistella, M.; Zhang, M.; Vaglio Laurin, G.; Saah, D. Aboveground Forest Biomass Estimation with Landsat and LiDAR Data and Uncertainty Analysis of the Estimates. Int. J. For. Res. 2012, 2012, 1–16. [Google Scholar] [CrossRef]
  75. Nichol, J.E.; Sarker, M.L.R. Improved biomass estimation using the texture parameters of two high-resolution optical sensors. IEEE Trans. Geosci. Remote Sens. 2011, 49, 930–948. [Google Scholar] [CrossRef] [Green Version]
  76. Goodbody, T.R.H.; Coops, N.C.; Marshall, P.L.; Tompalski, P.; Crawford, P. Unmanned aerial systems for precision forest inventory purposes: A review and case study. For. Chron. 2017, 93, 71–81. [Google Scholar] [CrossRef] [Green Version]
  77. Colomina, I.; Molina, P. Unmanned aerial systems for photogrammetry and remote sensing: A review. ISPRS J. Photogramm. Remote Sens. 2014, 92, 79–97. [Google Scholar] [CrossRef] [Green Version]
  78. Wallace, L.O.; Lucieer, A.; Watson, C.S. Assessing the Feasibility of Uav-Based Lidar for High Resolution Forest Change Detection. In Proceedings of the International Archives of the Photogrammetry, Remote Sensing and Spatial Information Sciences, Volume XXXIX-B7, 2012 XXII ISPRS Congress, Melbourne, Australia, 25 August–1 September 2012; pp. 499–504. [Google Scholar] [CrossRef] [Green Version]
  79. Corte, A.P.D.; Souza, D.V.; Rex, F.E.; Sanquetta, C.R.; Mohan, M.; Silva, C.A.; Zambrano, A.M.A.; Prata, G.; Alves de Almeida, D.R.; Trautenmüller, J.W.; et al. Forest inventory with high-density UAV-Lidar: Machine learning approaches for predicting individual tree attributes. Comput. Electron. Agric. 2020, 179, 105815. [Google Scholar] [CrossRef]
  80. Wang, D.; Song, Q.; Liao, X.; Ye, H.; Shao, Q.; Fan, J.; Cong, N.; Xin, X.; Yue, H.; Zhang, H. Integrating satellite and unmanned aircraft system (UAS) imagery to model livestock population dynamics in the Longbao Wetland National Nature Reserve, China. Sci. Total Environ. 2020, 746, 140327. [Google Scholar] [CrossRef]
  81. Pflugmacher, D.; Cohen, W.B.; Kennedy, R.E.; Yang, Z. Using Landsat-derived disturbance and recovery history and lidar to map forest biomass dynamics. Remote Sens. Environ. 2014, 151, 124–137. [Google Scholar] [CrossRef]
  82. Bolton, D.K.; White, J.C.; Wulder, M.A.; Coops, N.C. Updating stand-level forest inventories using airborne laser scanning and Landsat time series data. Int. J. Appl. Earth Obs. Geoinf. 2018, 66, 174–183. [Google Scholar] [CrossRef]
  83. Horler, D.N.H.; Dockray, M.; Barber, J. The red edge of plant leaf reflectance. Remote Sens. 1983, 4, 273–288. [Google Scholar] [CrossRef]
  84. Adamczyk, J.; Osberger, A. Red-edge vegetation indices for detecting and assessing disturbances in Norway spruce dominated mountain forests. Int. J. Appl. Earth Obs. Geoinf. 2015, 37, 90–99. [Google Scholar] [CrossRef]
  85. Dong, T.; Liu, J.; Shang, J.; Qian, B.; Ma, B.; Kovacs, J.M.; Walters, D.; Jiao, X.; Geng, X.; Shi, Y. Assessment of red-edge vegetation indices for crop leaf area index estimation. Remote Sens. Environ. 2019, 222, 133–143. [Google Scholar] [CrossRef]
  86. Wang, D.; Wan, B.; Liu, J.; Su, Y.; Guo, Q.; Qiu, P.; Wu, X. Estimating aboveground biomass of the mangrove forests on northeast Hainan Island in China using an upscaling method from field plots, UAV-LiDAR data and Sentinel-2 imagery. Int. J. Appl. Earth Obs. Geoinf. 2020, 85, 101986. [Google Scholar] [CrossRef]
  87. Stevens, D.L. Variable density grid-based sampling designs for continuous spatial populations. Environmetrics 1997, 8, 167–195. [Google Scholar] [CrossRef]
  88. Teich, M.; Bebi, P. Evaluating the benefit of avalanche protection forest with GIS-based risk analyses—A case study in Switzerland. For. Ecol. Manag. 2009, 257, 1910–1919. [Google Scholar] [CrossRef]
  89. Theobald, D.M.; Stevens, D.L.; White, D.; Urquhart, N.S.; Olsen, A.R.; Norman, J.B. Using GIS to generate spatially balanced random survey designs for natural resource applications. Environ. Manag. 2007, 40, 134–146. [Google Scholar] [CrossRef]
  90. Pearse, G.D.; Morgenroth, J.; Watt, M.S.; Dash, J.P. Optimising prediction of forest leaf area index from discrete airborne lidar. Remote Sens. Environ. 2017, 200, 220–239. [Google Scholar] [CrossRef]
  91. Lin, Y.; Hyyppä, J.; Jaakkola, A. Mini-UAV-borne LIDAR for fine-scale mapping. IEEE Geosci. Remote Sens. Lett. 2011, 8, 426–430. [Google Scholar] [CrossRef]
  92. Andersen, H.; Strunk, J.; Temesgen, H. Sampling Tool for Estimating Forest Biomass Interior Alaska. West. J. Appl. For. 2011, 26, 157–164. [Google Scholar] [CrossRef] [Green Version]
  93. Ståhl, G.; Holm, S.; Gregoire, T.G.; Gobakken, T.; Næsset, E.; Nelson, R. Model-based inference for biomass estimation in a LiDAR sample survey in Hedmark county, Norway. Can. J. For. Res. 2011, 41, 96–107. [Google Scholar] [CrossRef] [Green Version]
  94. Andersen, H.E.; Strunk, J.; Temesgen, H.; Atwood, D.; Winterberger, K. Using multilevel remote sensing and ground data to estimate forest biomass resources in remote regions: A case study in the boreal forests of interior Alaska. Can. J. Remote Sens. 2012, 37, 596–611. [Google Scholar] [CrossRef]
  95. Xie, B.; Cao, C.; Xu, M.; Bashir, B.; Singh, R.P.; Huang, Z.; Lin, X. Regional forest volume estimation by expanding LiDAR samples using multi-sensor satellite data. Remote Sens. 2020, 12, 360. [Google Scholar] [CrossRef] [Green Version]
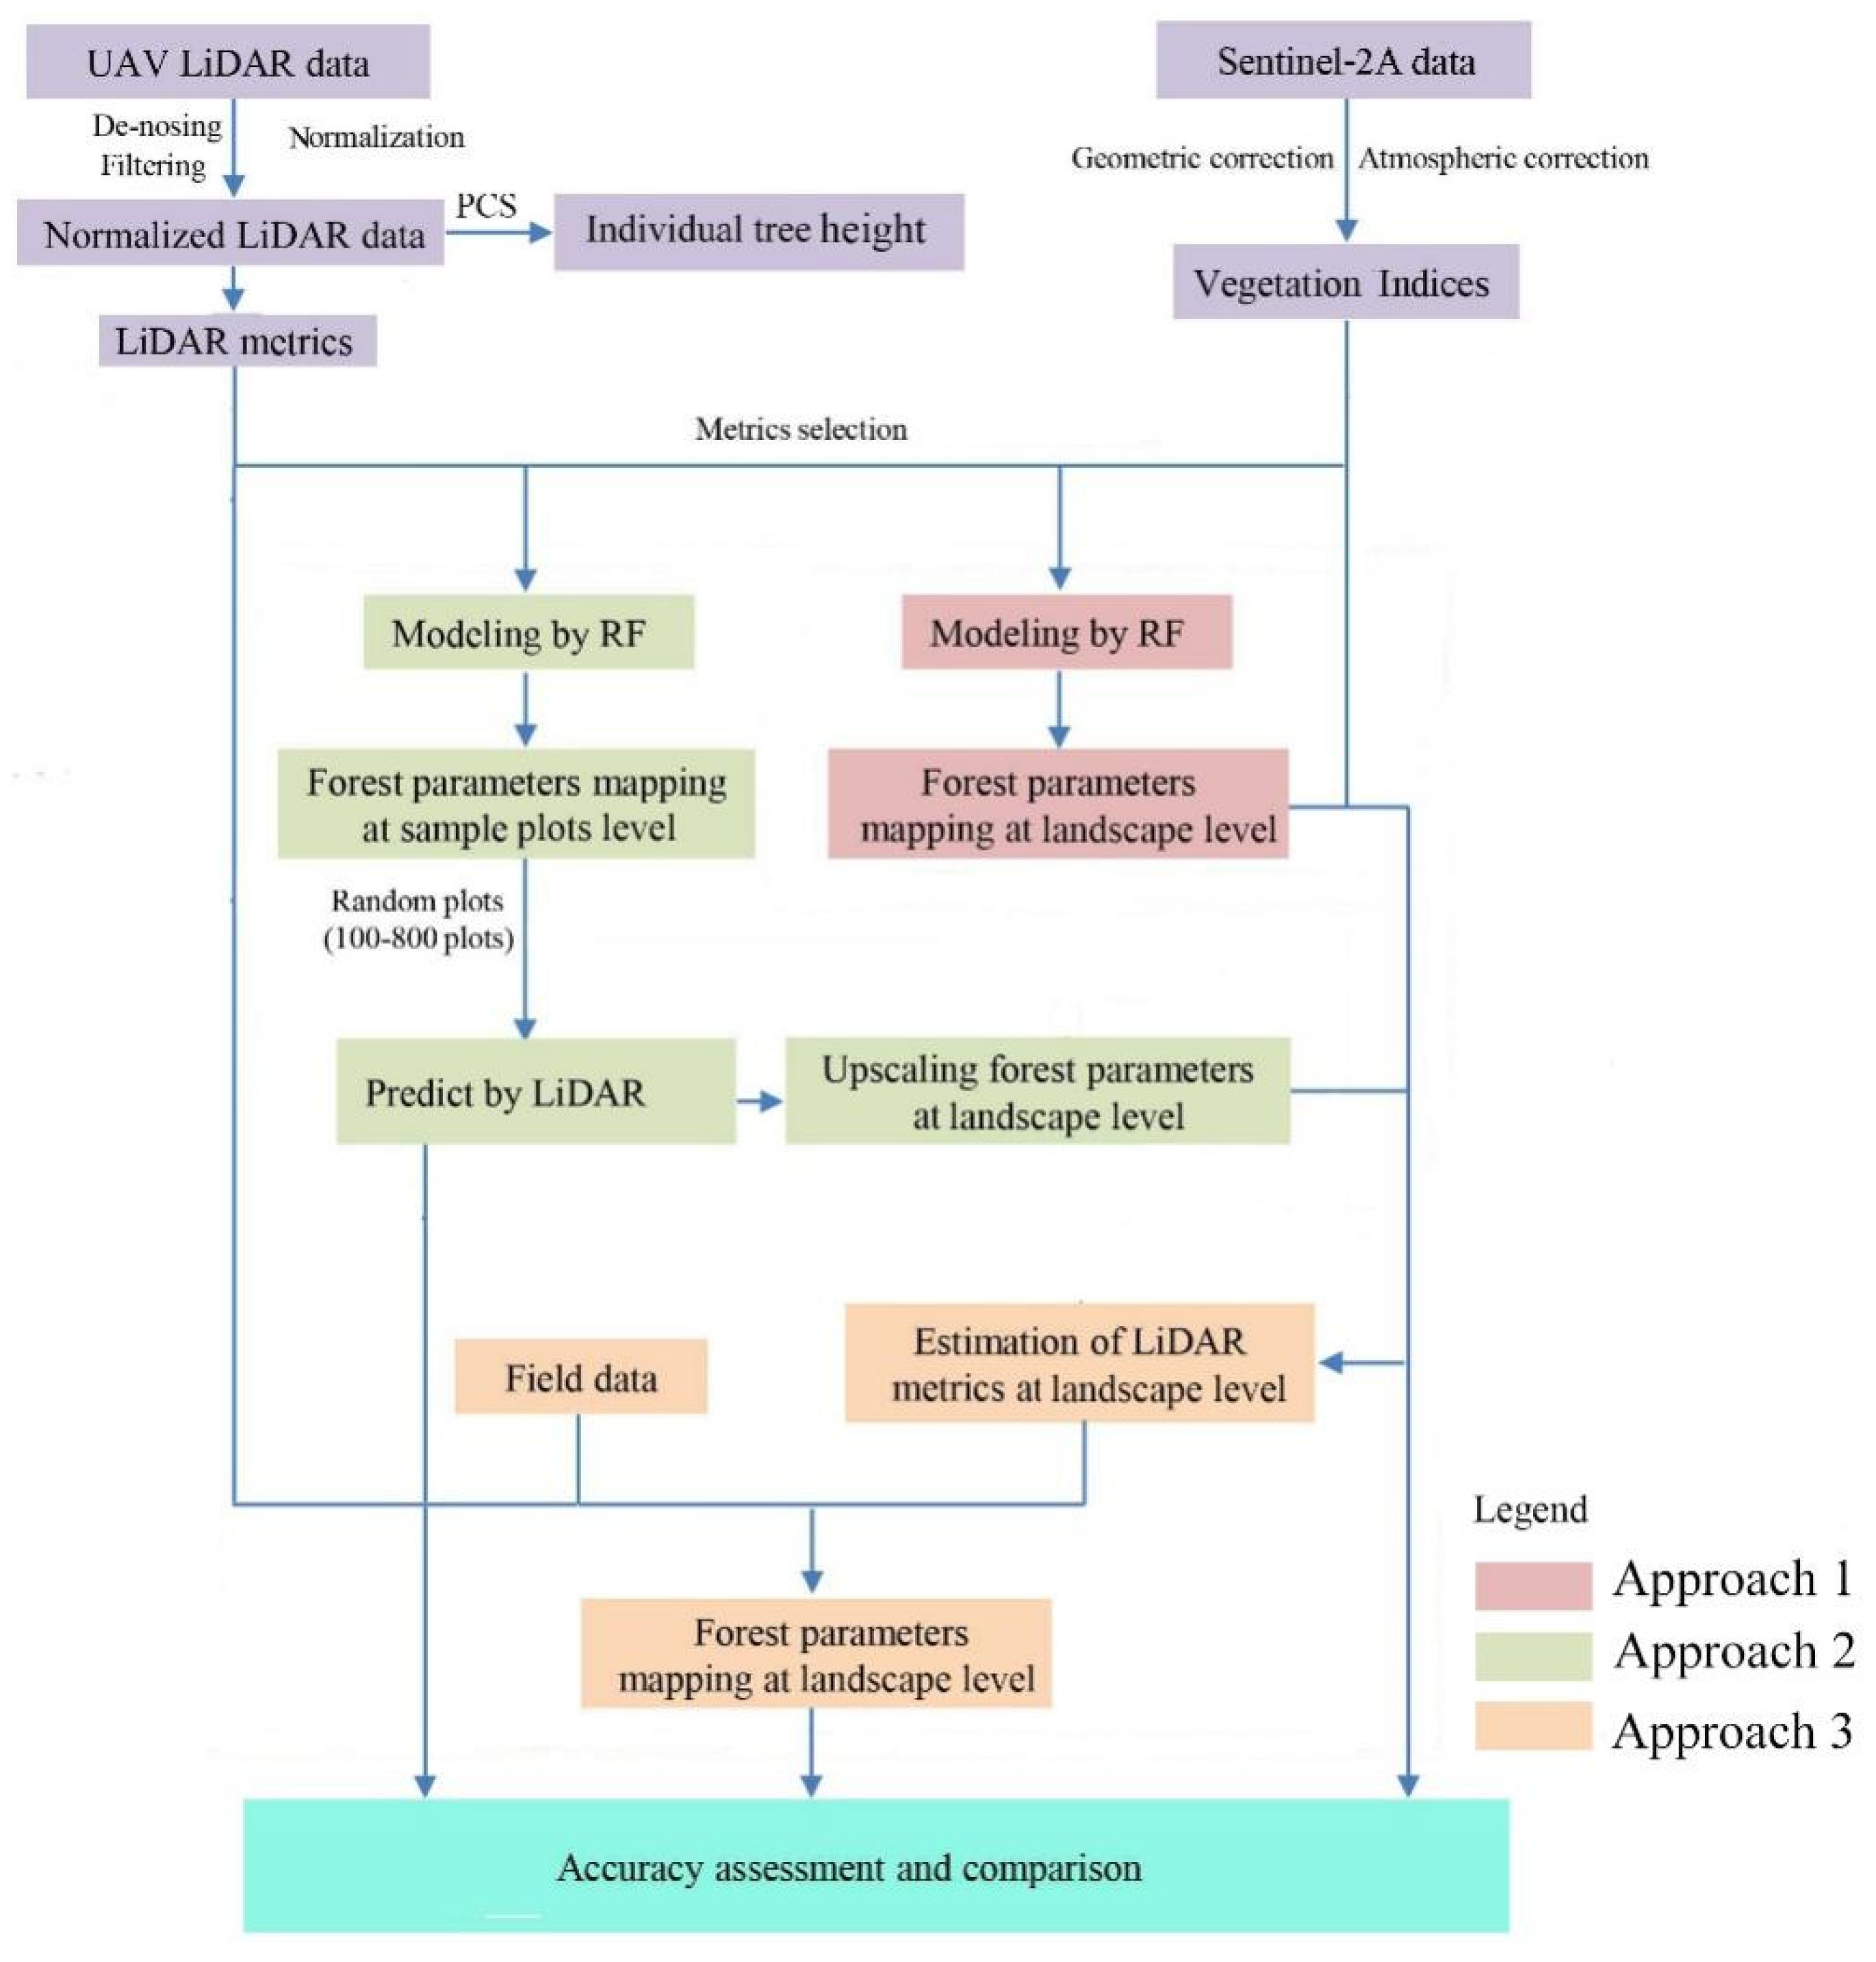
Figure 1. The workflow of this study. The approaches of forest structural parameter estimations in multi-scales (from individual tree level to landscape level) were assessed by using field data, UAS-LiDAR transects and Sentinel-2A imagery.
Remotesensing 14 03023 g001
Figure 2. Overview of study area and distribution of sample plots, the triangle areas are the UAS LiDAR sampling area (total 19 sample areas), the green dots are Larch plots and the orange dots are Chinese pine plots (A); Digital Aircraft photogrammetry of a sample area (one of 19 sample areas) (B); The digital elevation model (DEM) generated by LiDAR data of a sample area (one of 19 sample areas) (C).
Remotesensing 14 03023 g002
Figure 3. Individual tree segmentation results by PCS algorithm in typical sample plots. (a1c1,a2c2) are the vertical view of individual tree segmentation, the red boundary represents the edge of individual tree crown. (d1f1,d2f2) are the point clouds of sample plots. (g1i1,g2i2) are the three-dimensional view of individual tree segmentation results, the individual tree is rendered in different colors.
Remotesensing 14 03023 g003
Figure 4. The tree height comparison scatter plot between typical sample plots of Larch and Chinese pine extracted by the PCS algorithm ((a1f1) are Larch sample plots and (a2f2) are Chinese pine sample plots).
Remotesensing 14 03023 g004
Figure 5. The scatterplots of forest structural parameters predicted by approach 1 and the importance ranking of the variables for forest structural parameters estimation by approach 1 (76 plots). (A,E) are DBH; (B,F) are height; (C,G) are volume; (D,H) are AGB. Note: the detail of approach 1; see Figure 1.
Remotesensing 14 03023 g005
Figure 6. Wall-to-wall map of forest structural parameters distribution in landscape level by approach 1. (A) is DBH; (B) is tree height; (C) is volume; and (D) is AGB. Note: the detail of approach 1; see Figure 2.
Remotesensing 14 03023 g006
Figure 7. The scatterplots of forest structural parameters predicted by approach 2 and the importance ranking of variables for forest structural parameters estimation by approach 2. (A1H1) are stage 1, and (A2H2) are stage 2. (A,E) are DBH; (B,F) are height; (C,G) are volume; (D,H) are AGB. Note: the detail of approach 2; see Figure 1.
Remotesensing 14 03023 g007
Figure 8. Wall-to-wall map of forest structural parameters distribution at landscape level by approach 2. (A) is DBH; (B) is tree height; (C) is volume; and (D) is AGB. Note: the detail of approach 2; see Figure 2.
Remotesensing 14 03023 g008
Figure 9. The scatterplots of forest structural parameters predicted by approach 3 and the importance ranking of variables for forest structural parameters estimation by approach 3 (76 plots). (A,E) are DBH; (B,F) are height; (C,G) are volume; (D,H) are AGB. Note: the detail of approach 3; see Figure 1.
Remotesensing 14 03023 g009
Figure 10. Wall-to-wall map of UAS-LiDAR metrics distribution predicted by Sentinel-2 vegetation indices ((A) is h25; (B) is h50; (C) is h75; and (D) is h95. Note: the detail of UAS-LiDAR metrics; see Table 2) and up-scaling forest structural parameters distribution by approach 3 in landscape level ((E) is DBH; (F) is tree height; (G) is volume; and (H) is AGB. Note: the detail of approach 3; see Figure 2).
Remotesensing 14 03023 g010
Table 1. Summary of forest parameters measured by fieldwork within the plots.
Tree SpeciesTree Height
(m)
DBH
(cm)
Volume
(m3·ha−1)
AGB
(Mg·ha−1)
Larch5.9–20.36.2–29.262.5–375.028.8–157.1
Chinese pine7.8–19.69.8–31.2108.6–372.477.0–169.8
Table 2. The specification of UAS-LiDAR system.
ParametersValue
Weight (kg)15.5
Flight height (m)60
Maximum flight speed (m/s)10
Cruising radius (km)2
LiDAR typeRigel VUX-1
Scanning angle (°)±60°
Point density (pts/m3)≥25
Wavelength (nm)1055
Scanning frequency (Hz)10–200
Measurement range (m)3–920
The resolution of scanning angle (°)0.001
Table 3. The description of metrics derived from UAS-LiDAR data.
MetricsDescription
h25, h50, h75, h95The percentiles of the canopy height distributions by first echo (25th, 50th, 75th, and 95th)
hmeanThe mean height of all points after normalization
hcvThe coefficient of variation of height of all points after normalized (the ratio of the standard deviation to the mean)
hskewness, hkurtosisThe skewness and kurtosis of the heights of all points by first echo
d1, d3, d5, d7, d9The proportion of points above the quantiles (10th, 30th, 50th, 70th, and 90th) to total number of points
Table 4. Summary of vegetation indices based on available bands of Sentinel-2 data.
Vegetation IndicesFormulaReference
Normalized Difference Vegetation Index
(NDVI)
(B7 − B4)/(B7 + B4)[47]
MERIS Terrestrial Chlorophyll Index
(MTCI)
(B6 − B5)/(B5 − B4)[48]
Water Index
(WI)
B8a/B9[49]
Corrected Transformed Vegetation Index
(CTVI)
( NDVI + 0.5 ) / abs ( NDVI + 0.5 ) abs ( NDVI + 0.5 ) [50]
Enhanced Vegetation Index Red Edge 1(B5)
(EVIRE1)
2.5 × (B5 − B4)/(1 + B5 + 6 × B4 − 7.5 × B2)[51]
Enhanced Vegetation Index Red Edge 2(B6)
(EVIRE2)
2.5 × (B6 − B4)/(1 + B6 + 6 × B4 − 7.5 × B2)[52]
Nir infrared Enhanced Vegetation Index
(EVINI)
2.5 × (B8 − B4)/(1 + B8 + 6 × B4 − 7.5 × B2)[53]
Modified Simple Ratio Nir infrared
(MSRNIR)
( B 8 / B 4 1 ) / B 8 B 4 + 1 [54]
Modified Simple Ratio Red Edge 3(B7)
(MSRRE3)
( B 7 / B 4 1 ) / B 7 B 4 + 1 [55]
Modified Simple Ratio Red Edge 4 (B8a)
(MSRRE4)
( B 8 a / B 4 1 ) / B   8 a B 4 + 1 [56]
Nonlinear Index Red Edge 1(B5)
(NLIRE1)
(B52 − B4)/(B52 + B4)[57]
Nonlinear Index Red Edge 2(B6)
(NLIRE2)
(B62 − B4)/(B62 + B4)[58]
Nonlinear Index Near infrared
(NLINIR)
(B82 − B4)/(B82 + B4)[59]
Nonlinear Index Red Edge 4(B8a)
(NLIRE4)
(B8a2 − B4)/(B8a2 + B4)[60]
Table 5. The accuracy assessments of individual tree segmentation algorithms in Larch and Chinese pine sample plots.
Sample PlotsThe Number of Individual TreeAccurate SegmentationOver SegmentationOmission Segmentationrpf
P13029210.97 0.94 0.95
P28879690.90 0.93 0.91
P390806100.89 0.93 0.91
P495789170.82 0.90 0.86
P513010212280.78 0.89 0.84
P613510413310.77 0.89 0.83
P714010717330.76 0.86 0.81
P815812523330.79 0.84 0.82
P917813334450.740.800.77
P102019010.95 1.00 0.97
P112927220.93 0.93 0.93
P128680560.93 0.94 0.94
P1394848100.89 0.91 0.90
P1497858120.88 0.91 0.89
P151089311150.86 0.89 0.88
P16109948150.83 0.90 0.86
P1714012514150.82 0.88 0.85
P1814612915170.84 0.88 0.86
P1915113114200.81 0.88 0.84
Table 6. The sensitivity analysis of estimation of forest parameters at forest farm scale using different number of sample plots extracted from UAS-LiDAR data.
Plot NumberAccuracyTree Height
(m)
DBH
(cm)
Volume
(m3·ha−1)
AGB
(Mg·ha−1)
100R20.760.730.720.71
rRMSE12.5%15.6%17.2%17.9%
200R20.750.740.720.71
rRMSE12.3%15.1%16.6%18.0%
300R20.770.760.730.73
rRMSE12.7%14.8%16.5%16.2%
400R20.780.770.740.72
rRMSE11.9%14.1%15.8%16.4%
500R20.800.770.750.74
rRMSE11.5%13.6%15.1%15.2%
600R20.800.780.750.76
rRMSE11.3%12.7%15.2%14.9%
700R20.810.780.750.77
rRMSE11.2%13.1%15.1%15.1%
800R20.810.790.760.76
rRMSE11.0%12.5%15.2%15.2%
Table 7. Cross-validation results of three approaches for estimating forest structure parameters at landscape scale.
ApproachesAccuracy IndicatorTree Height
(m)
DBH
(cm)
Volume
(m3·ha−1)
AGB
(Mg·ha−1)
Approach 1R20.640.610.600.62
rRMSE24.1%22.9%27.3%25.9%
Approach 2R20.780.750.730.73
rRMSE14.5%16.1%18.8%19.6%
Approach 3R20.770.730.720.70
rRMSE17.2%18.5%17.1%20.2%
Note: the details of approach 1, approach 2 and approach 3; see Figure 1.
Publisher’s Note: MDPI stays neutral with regard to jurisdictional claims in published maps and institutional affiliations.