
Monitoring Regional-Scale Surface Deformation of the Continuous Permafrost in the Qinghai–Tibet Plateau with Time-Series InSAR Analysis


 , ,
, ,
Abstract
:
1. Introduction
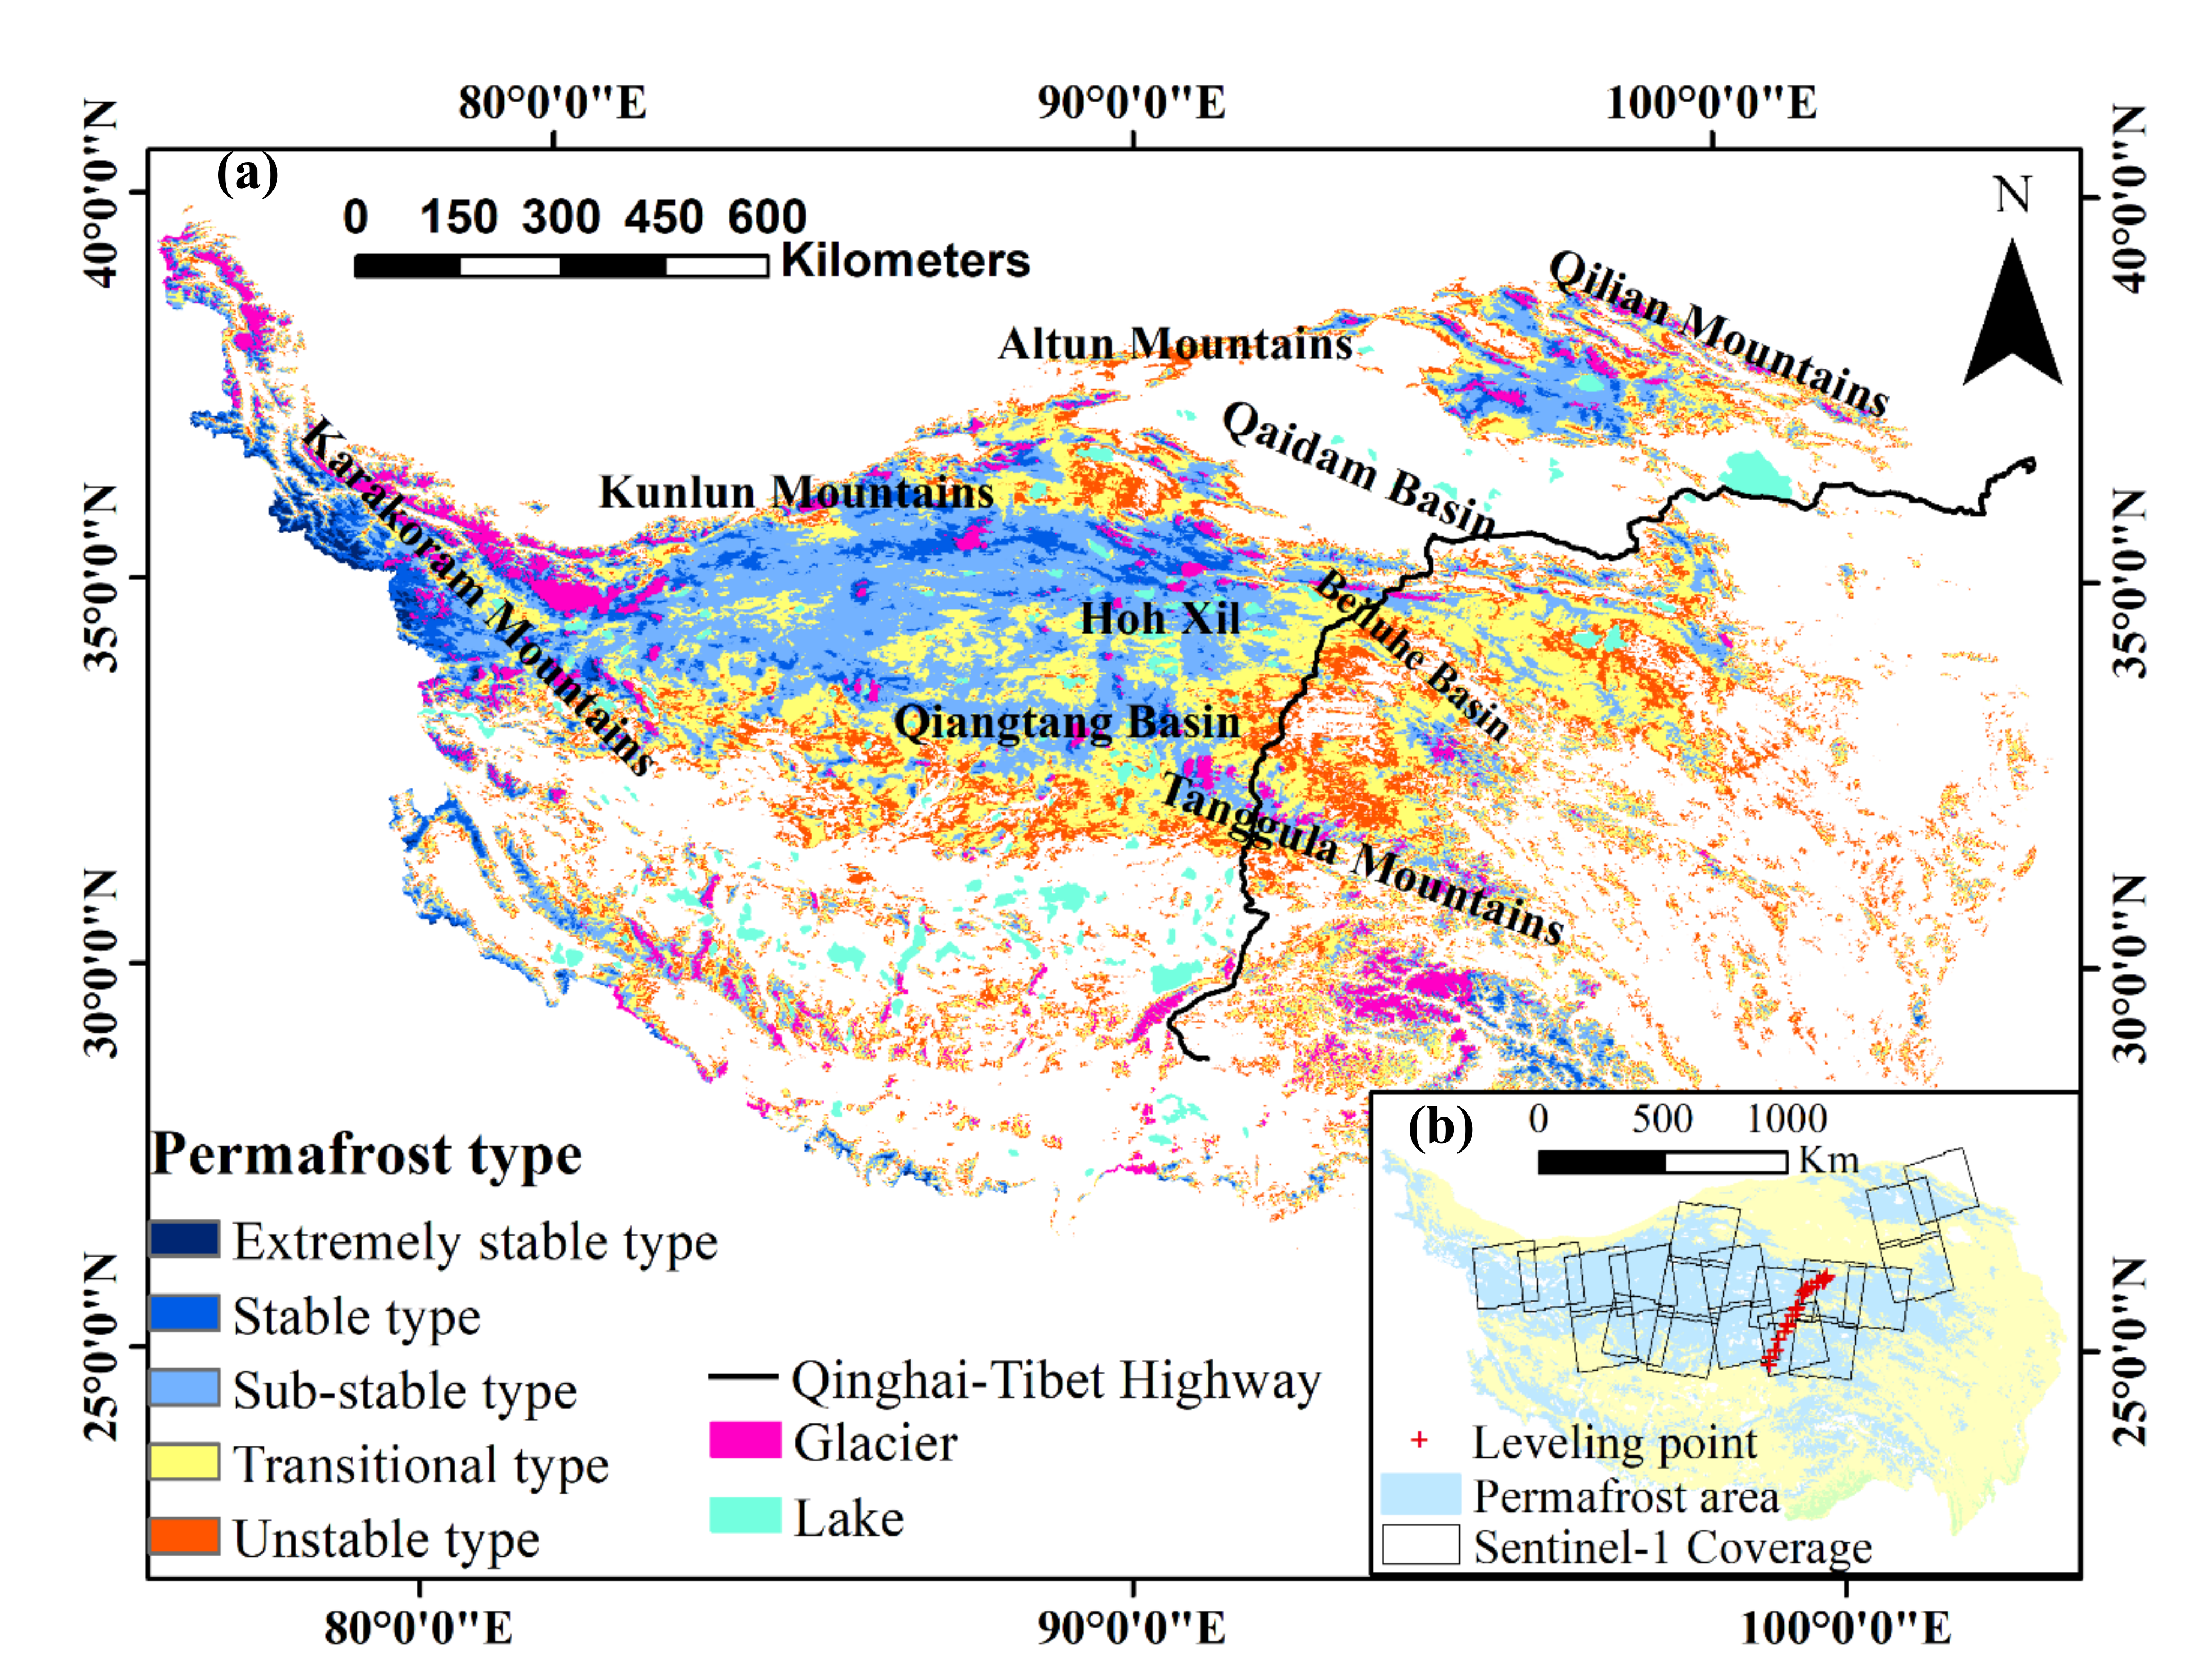
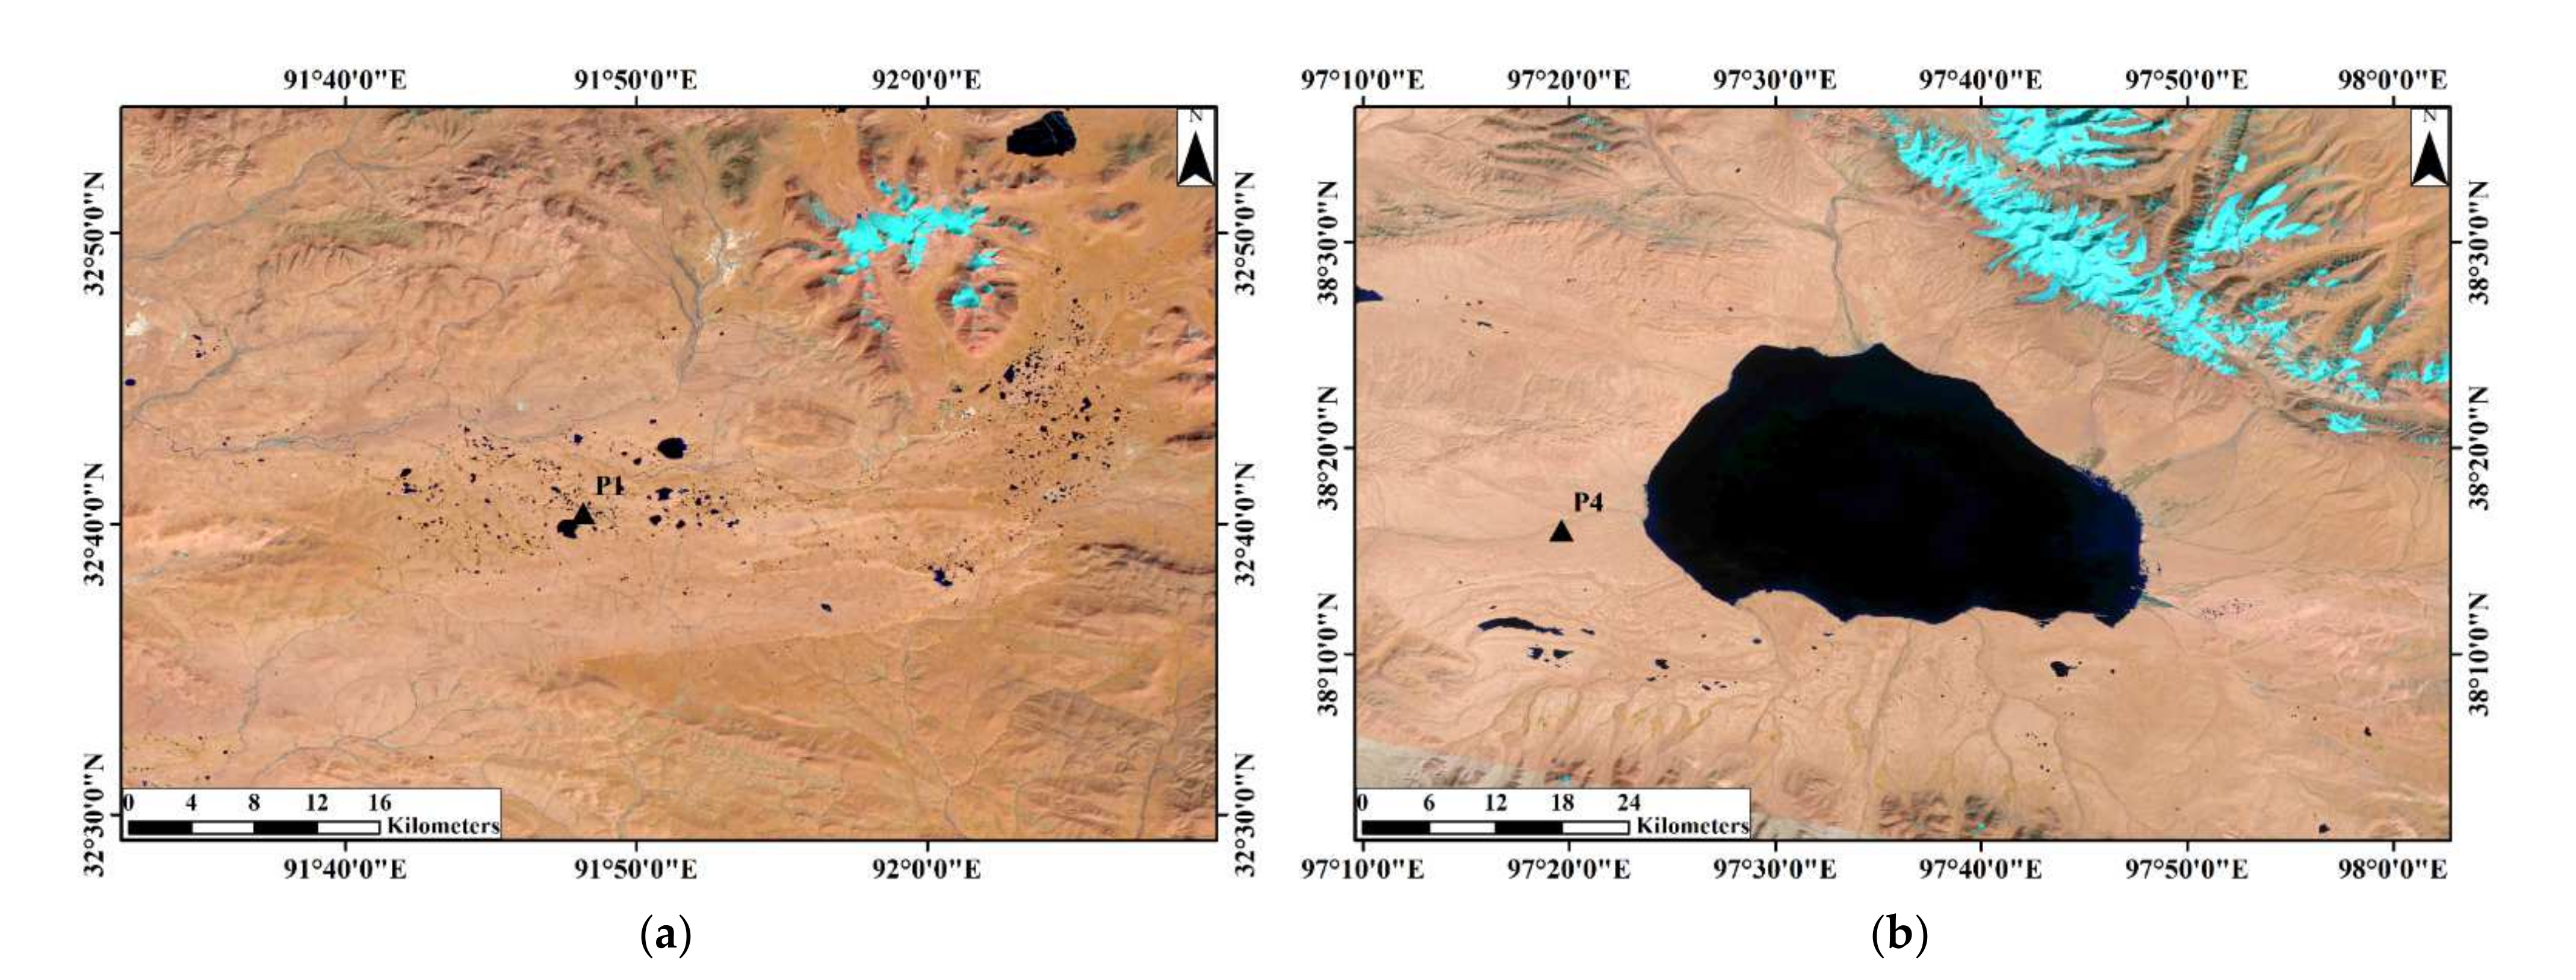
2. Study Area
3. Datasets and Methods
3.1. SAR Data
3.2. Leveling Data
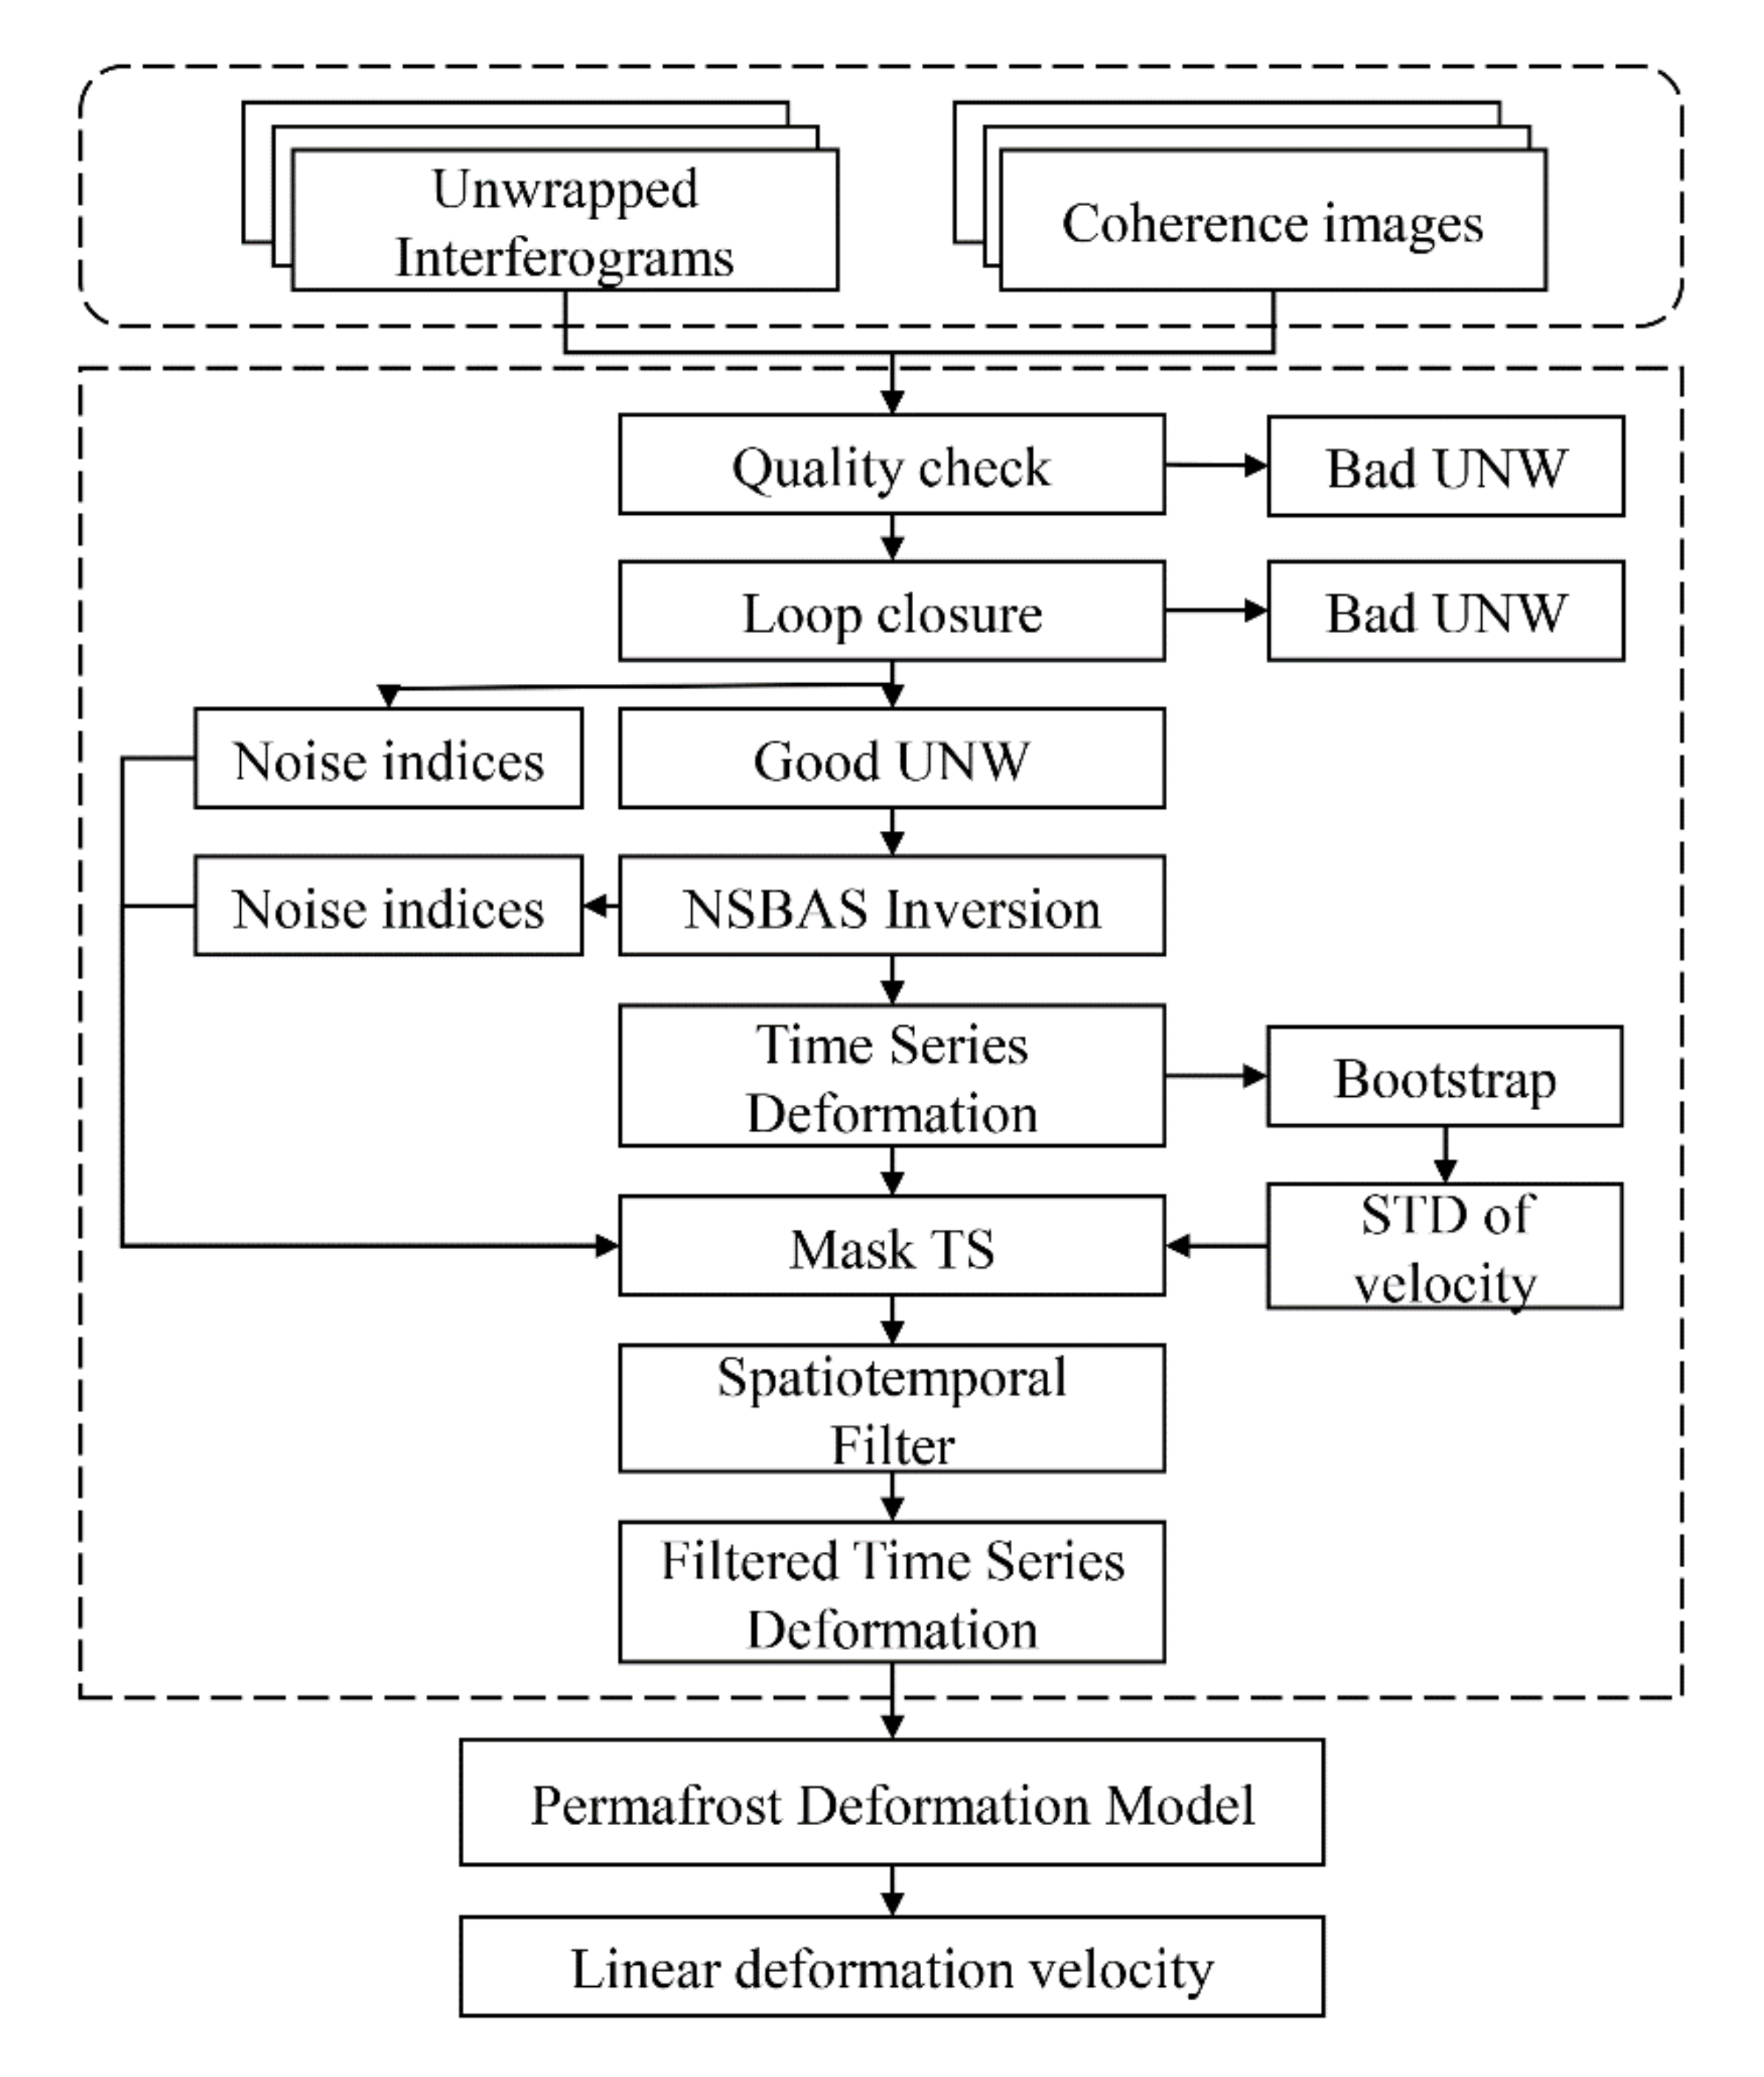
3.3. Time-Series InSAR Processing
4. Results
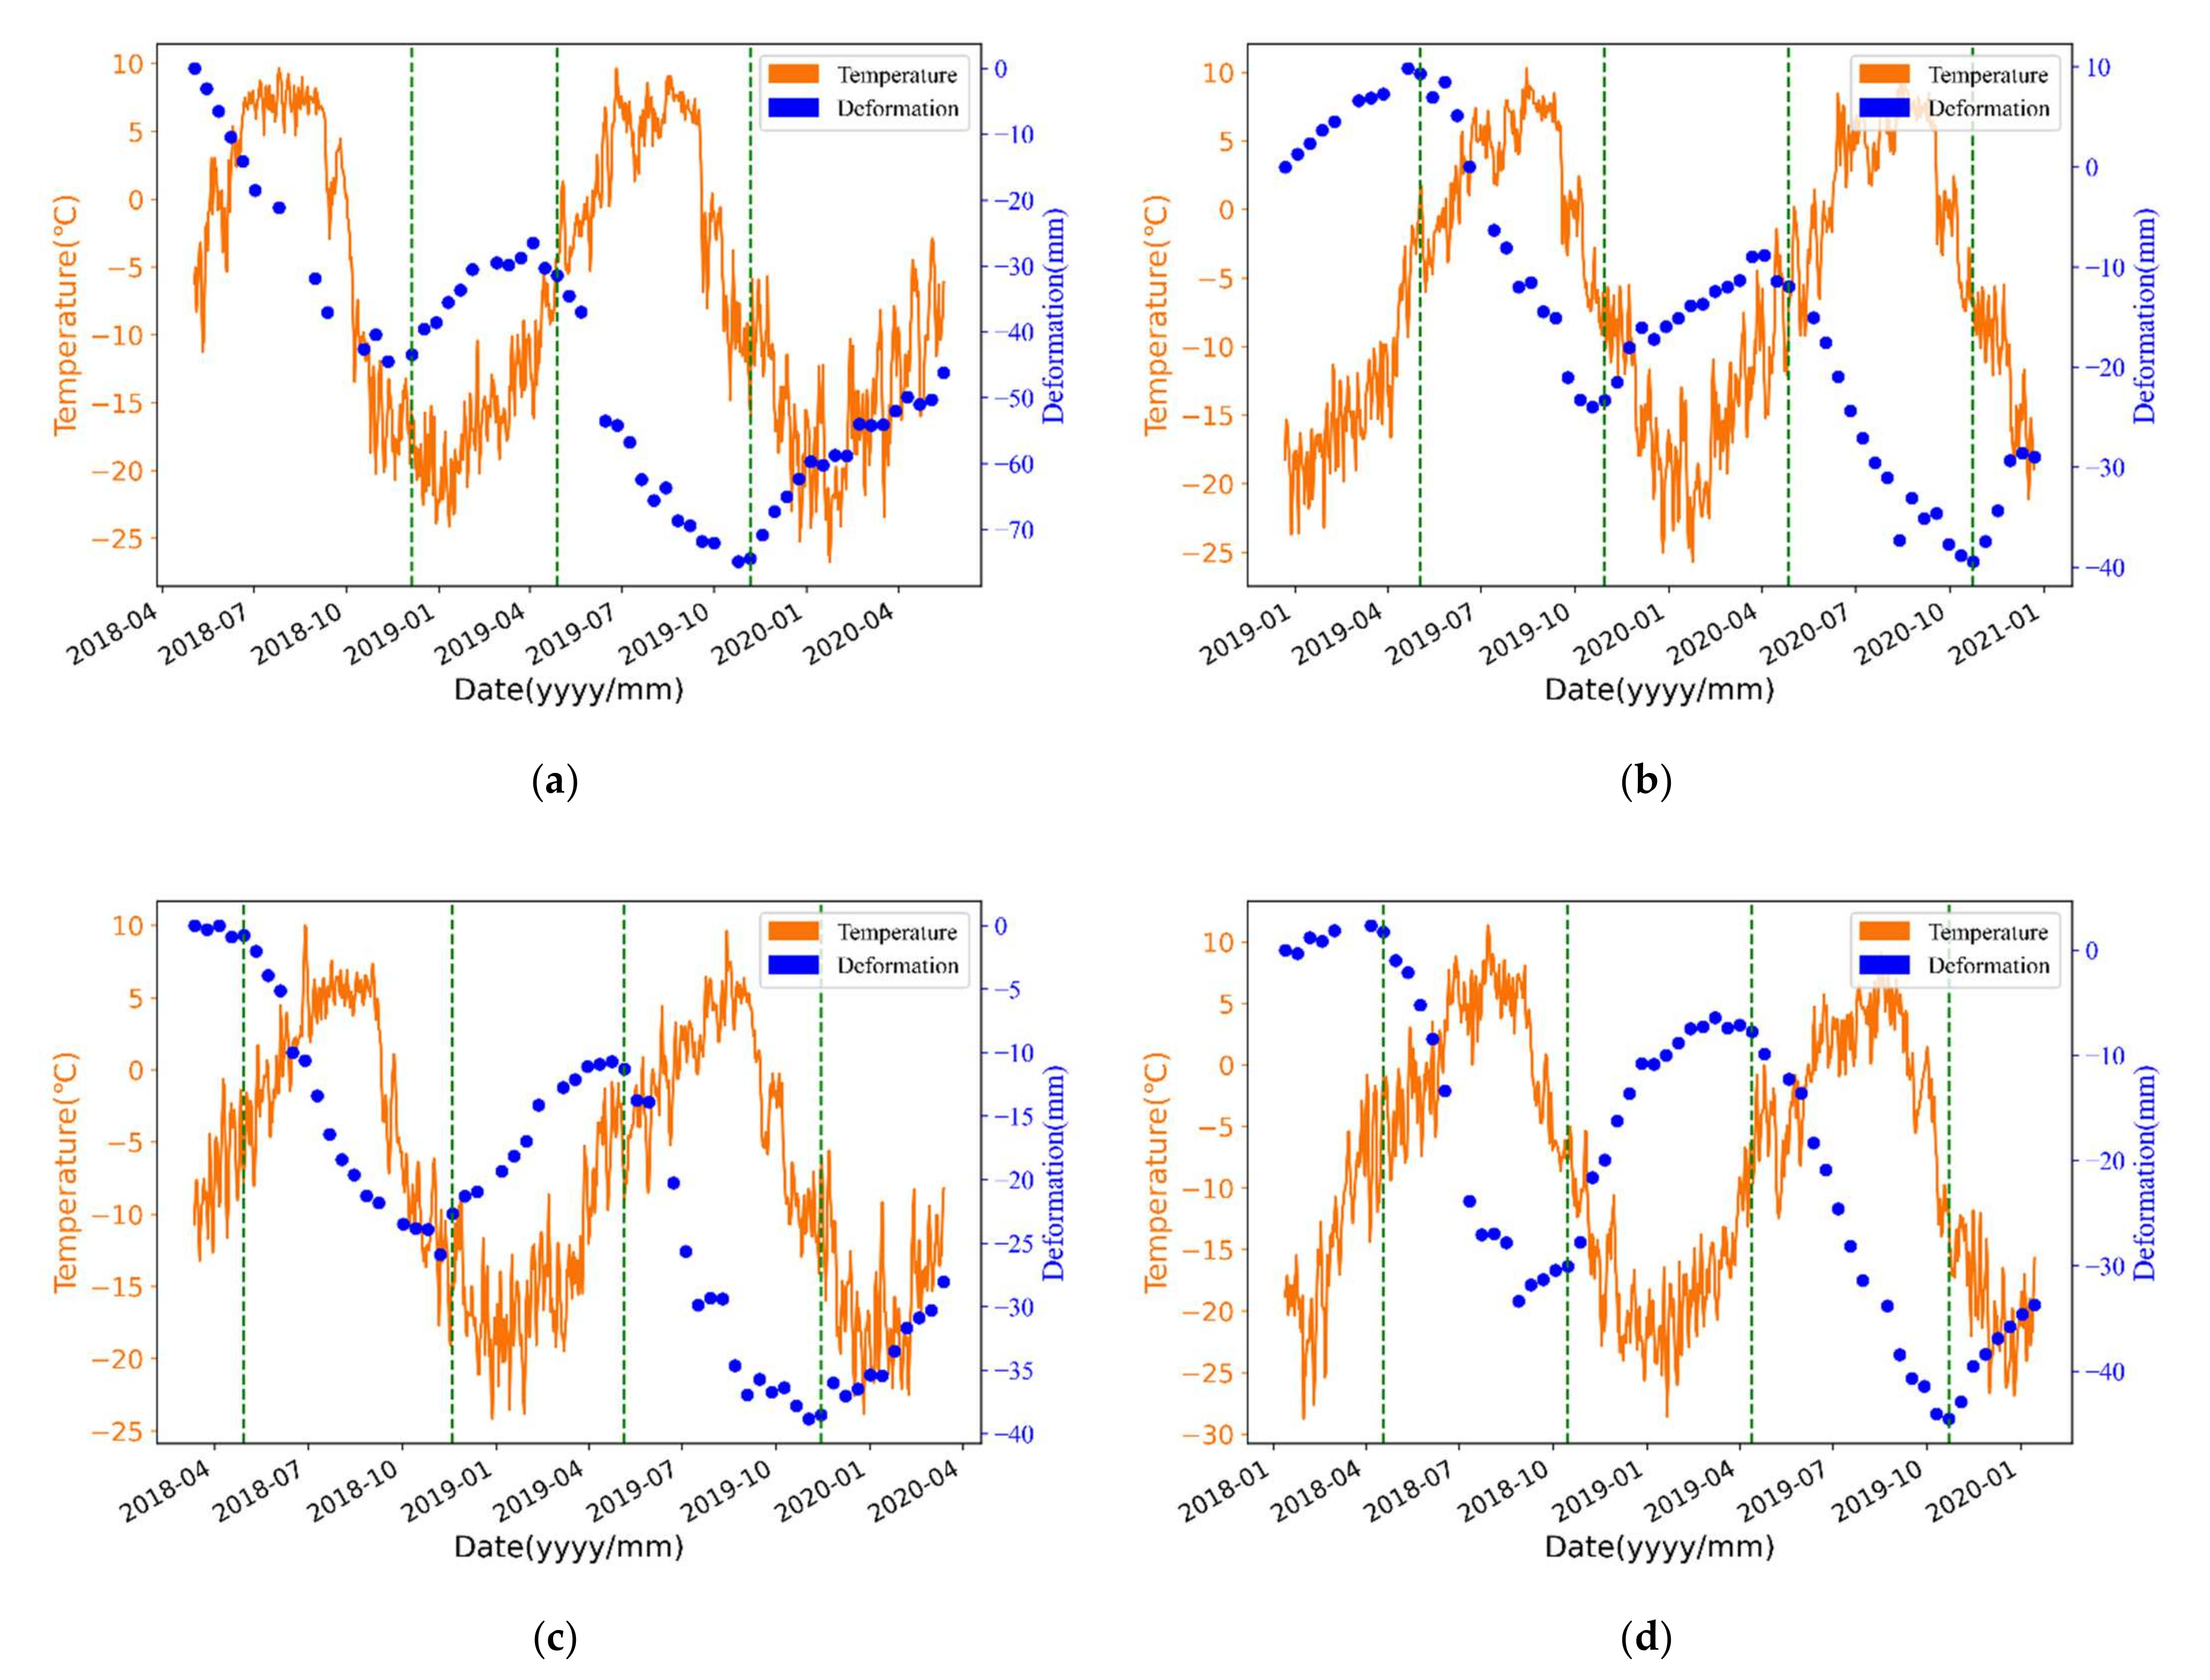
4.1. InSAR Permafrost Deformation
4.2. Result Verification
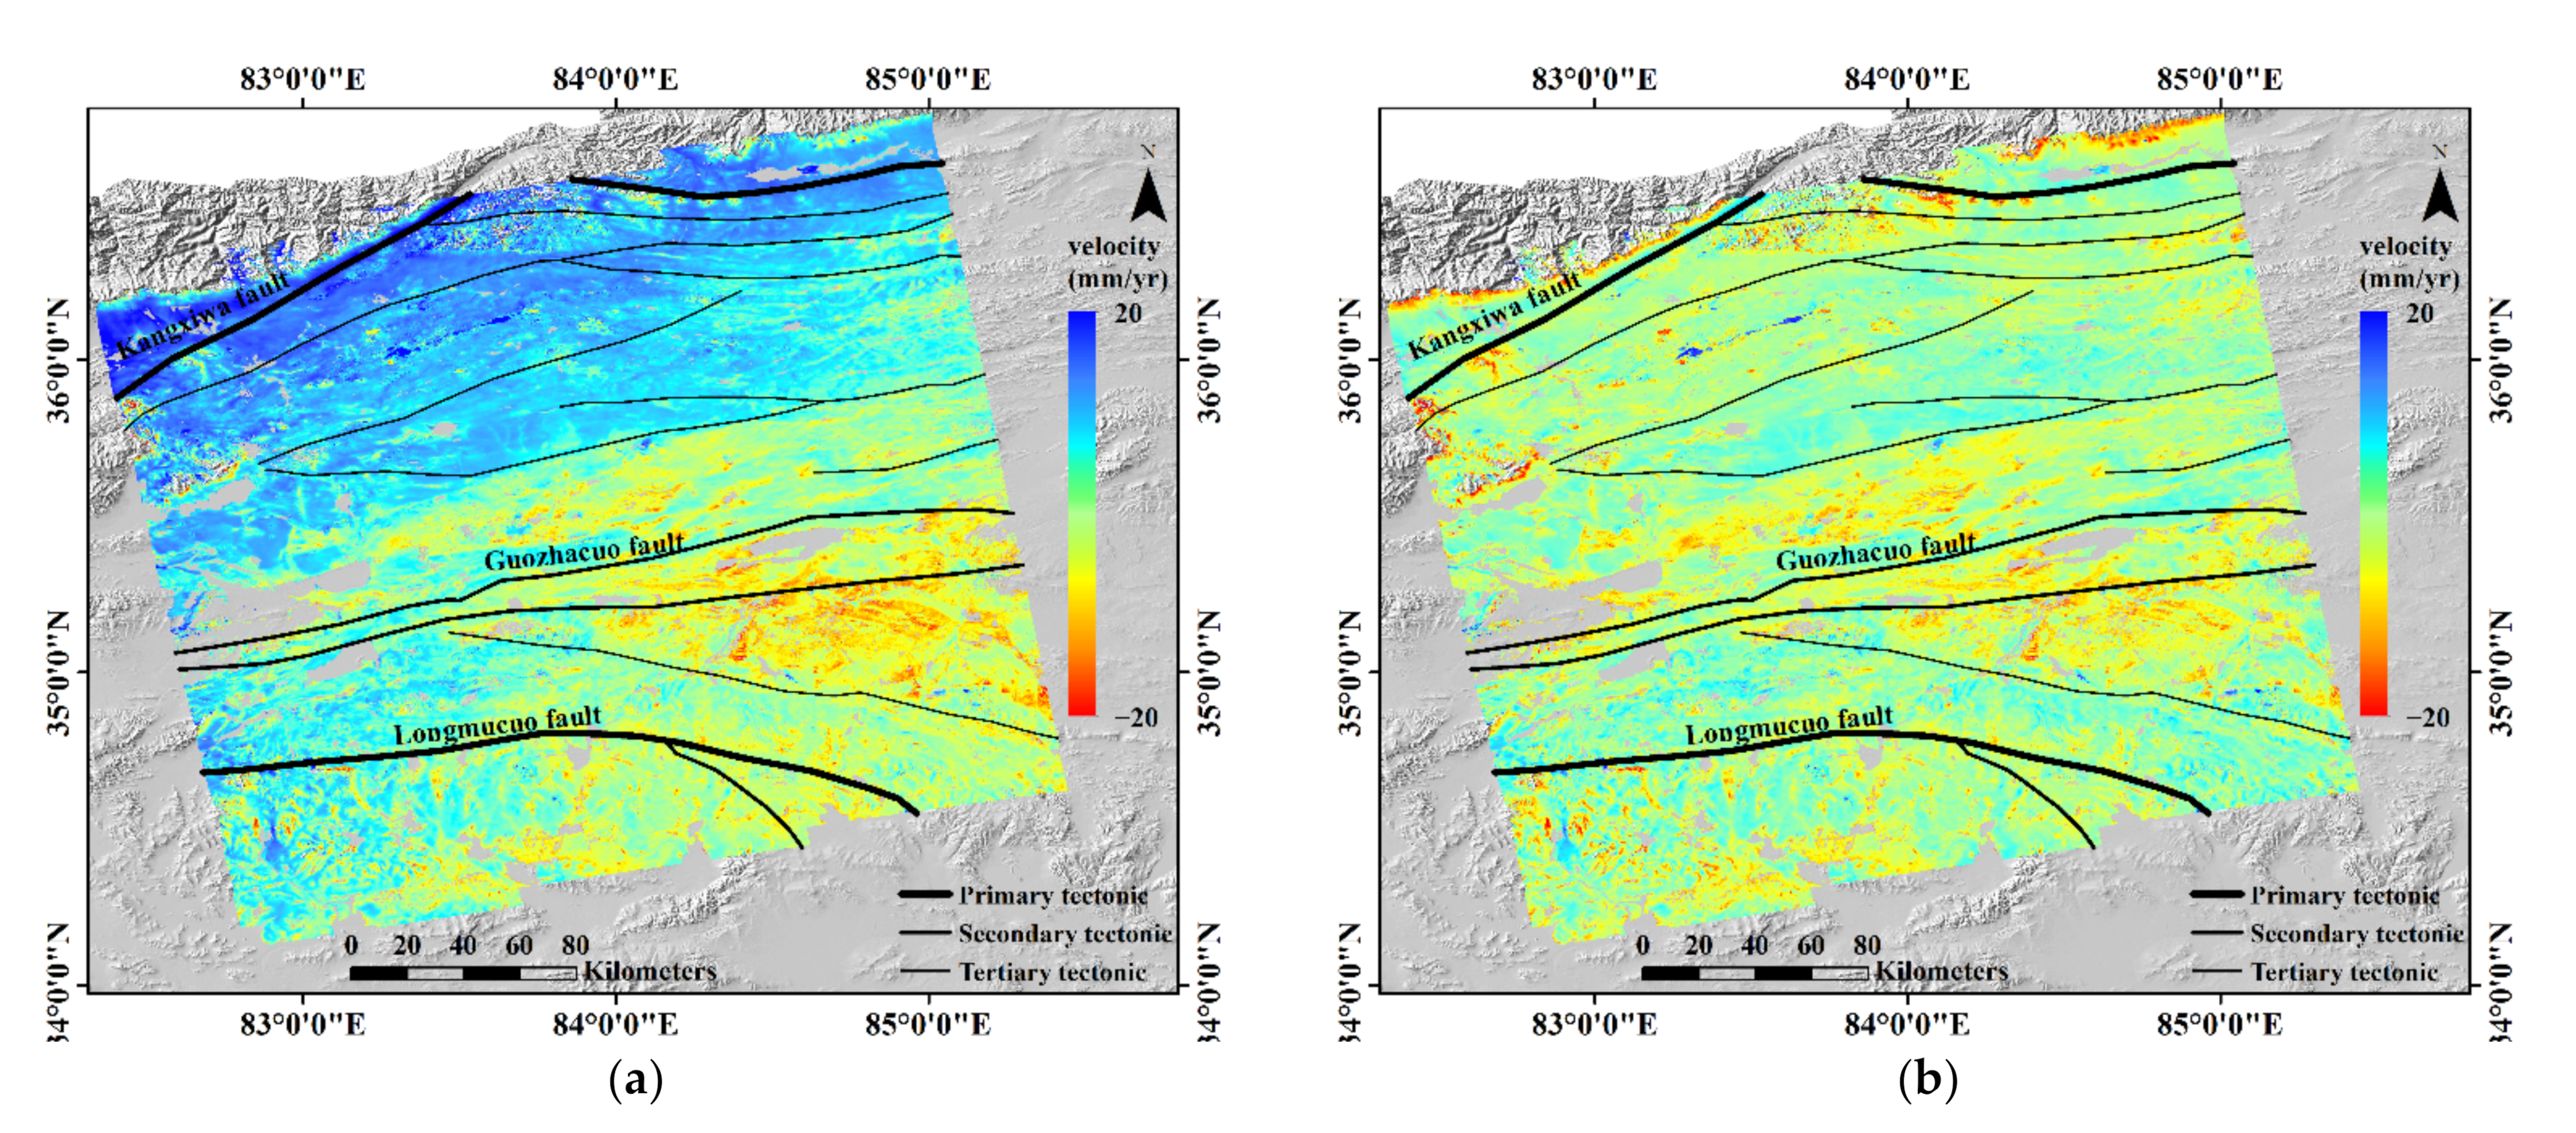
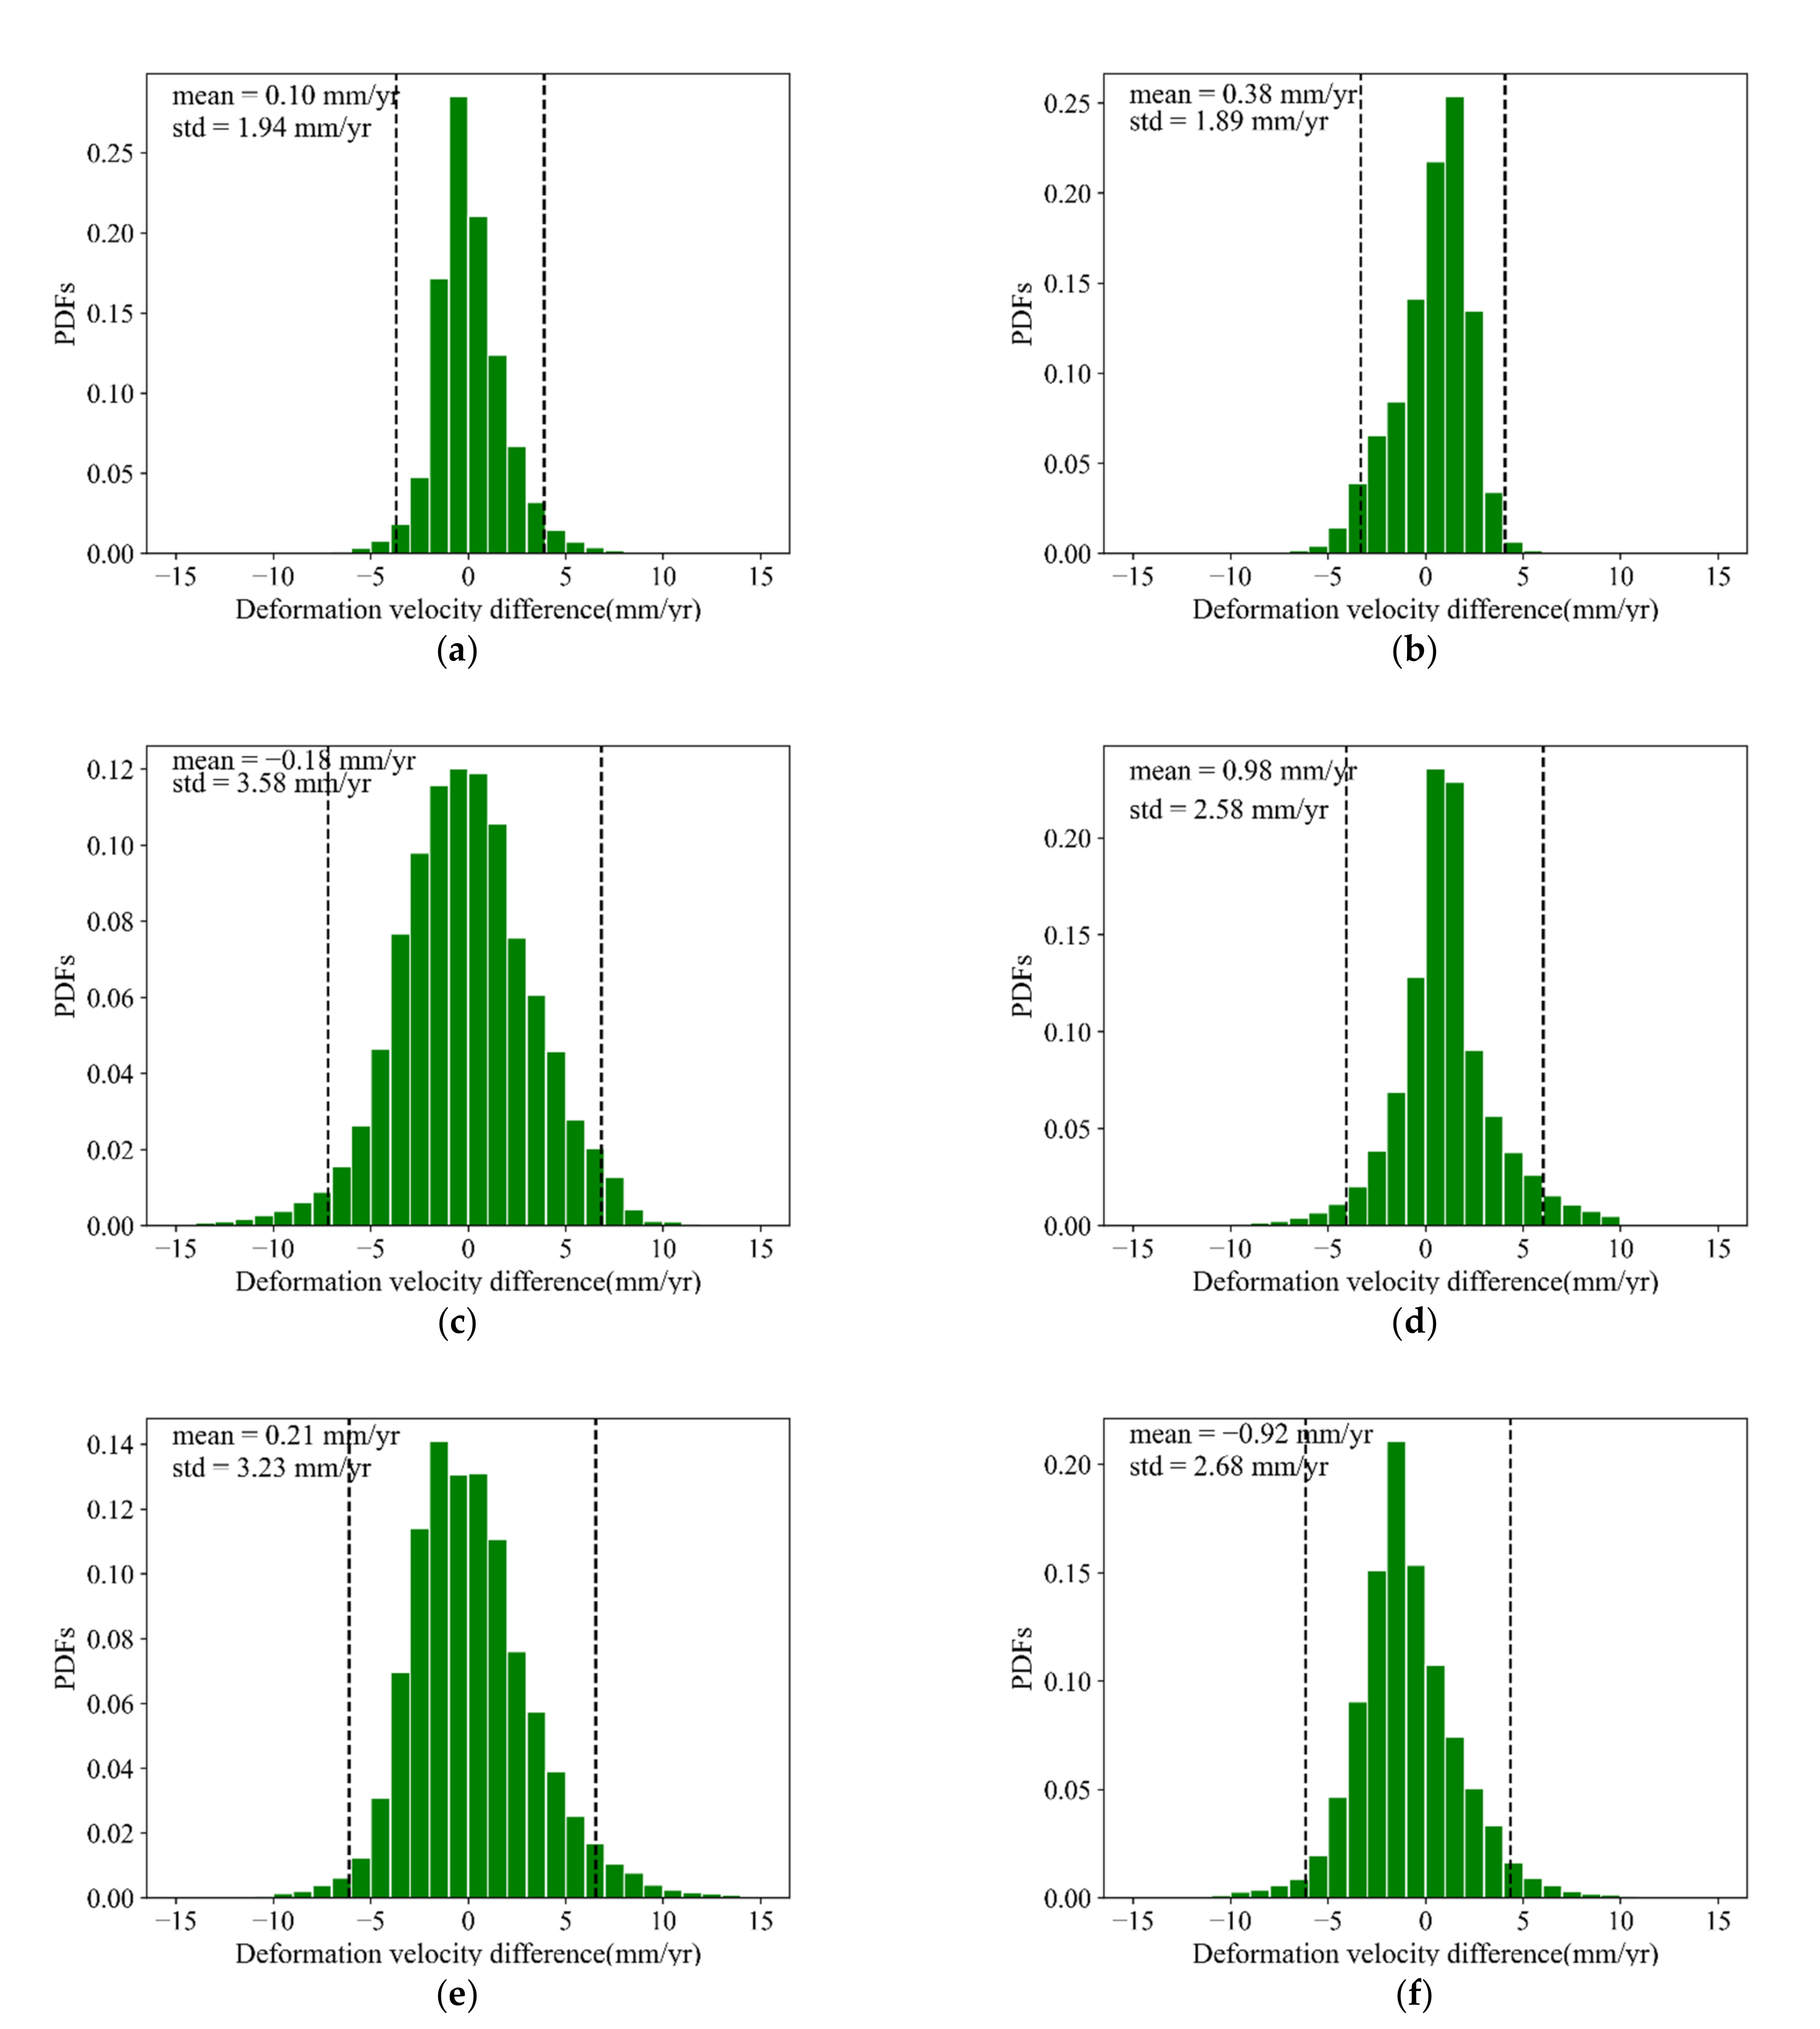
4.2.1. Intercomparison of Overlapping Area Results
4.2.2. InSAR Results vs. Leveling Measurements
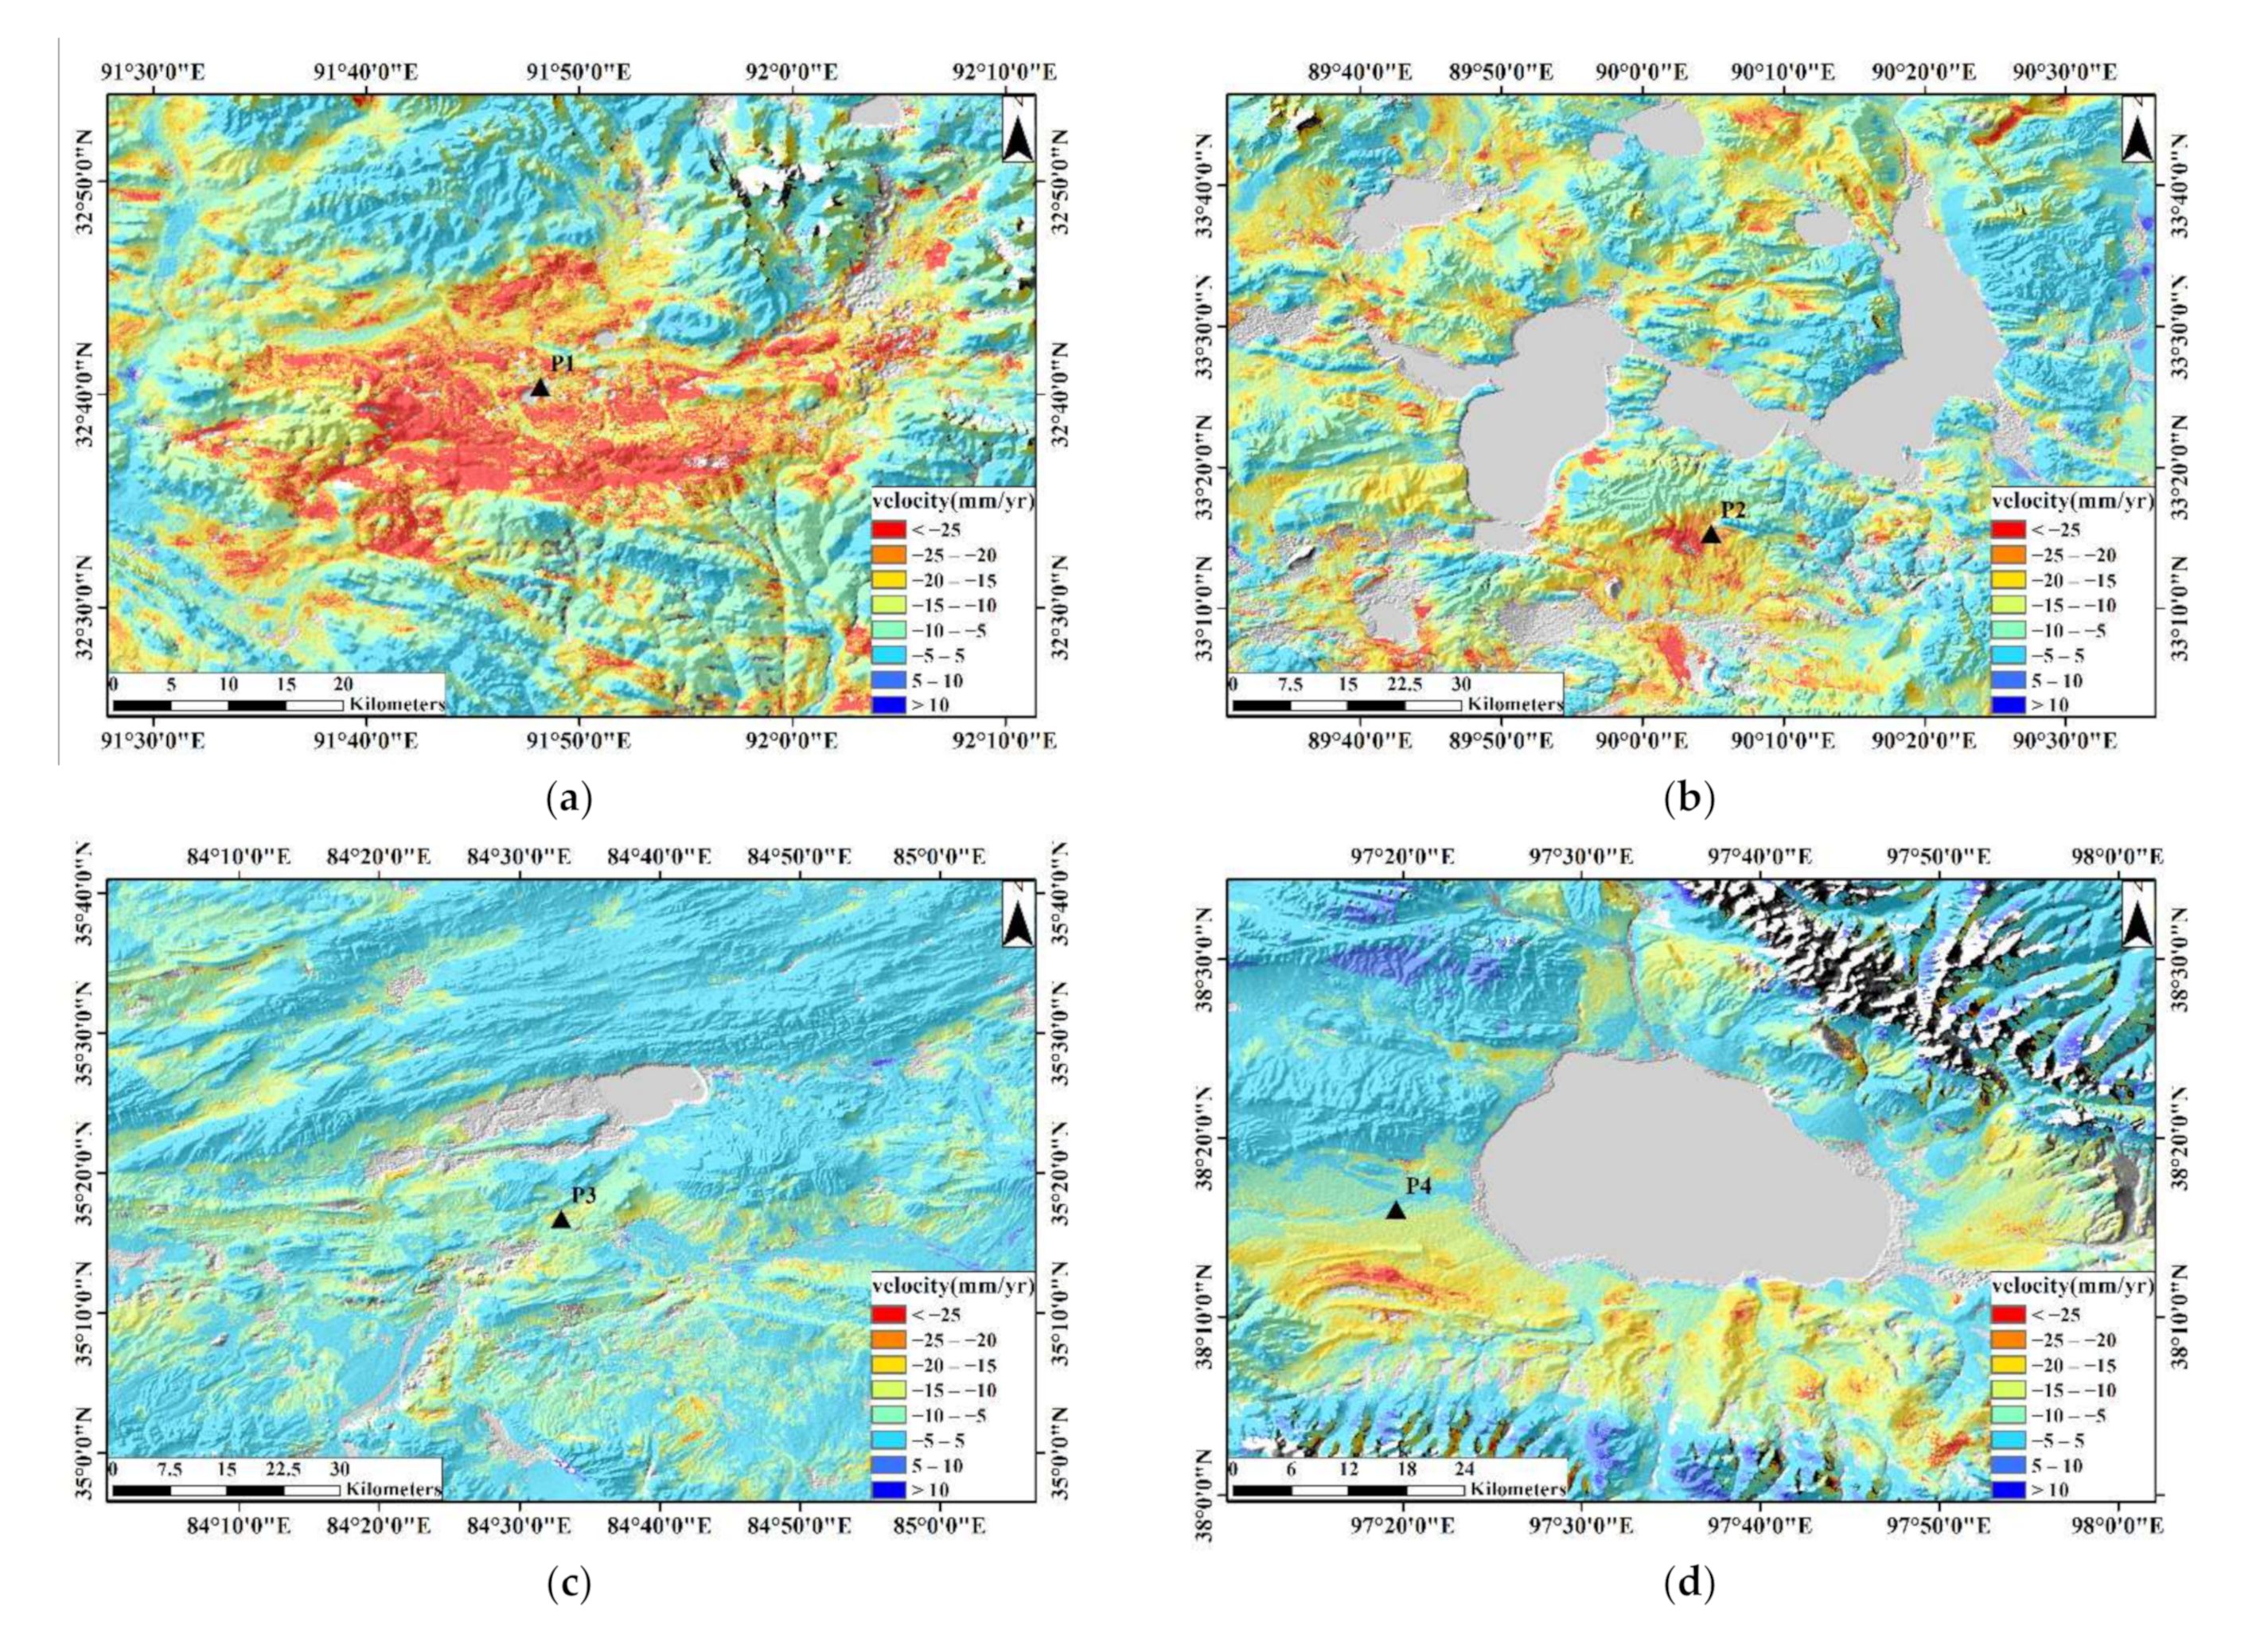
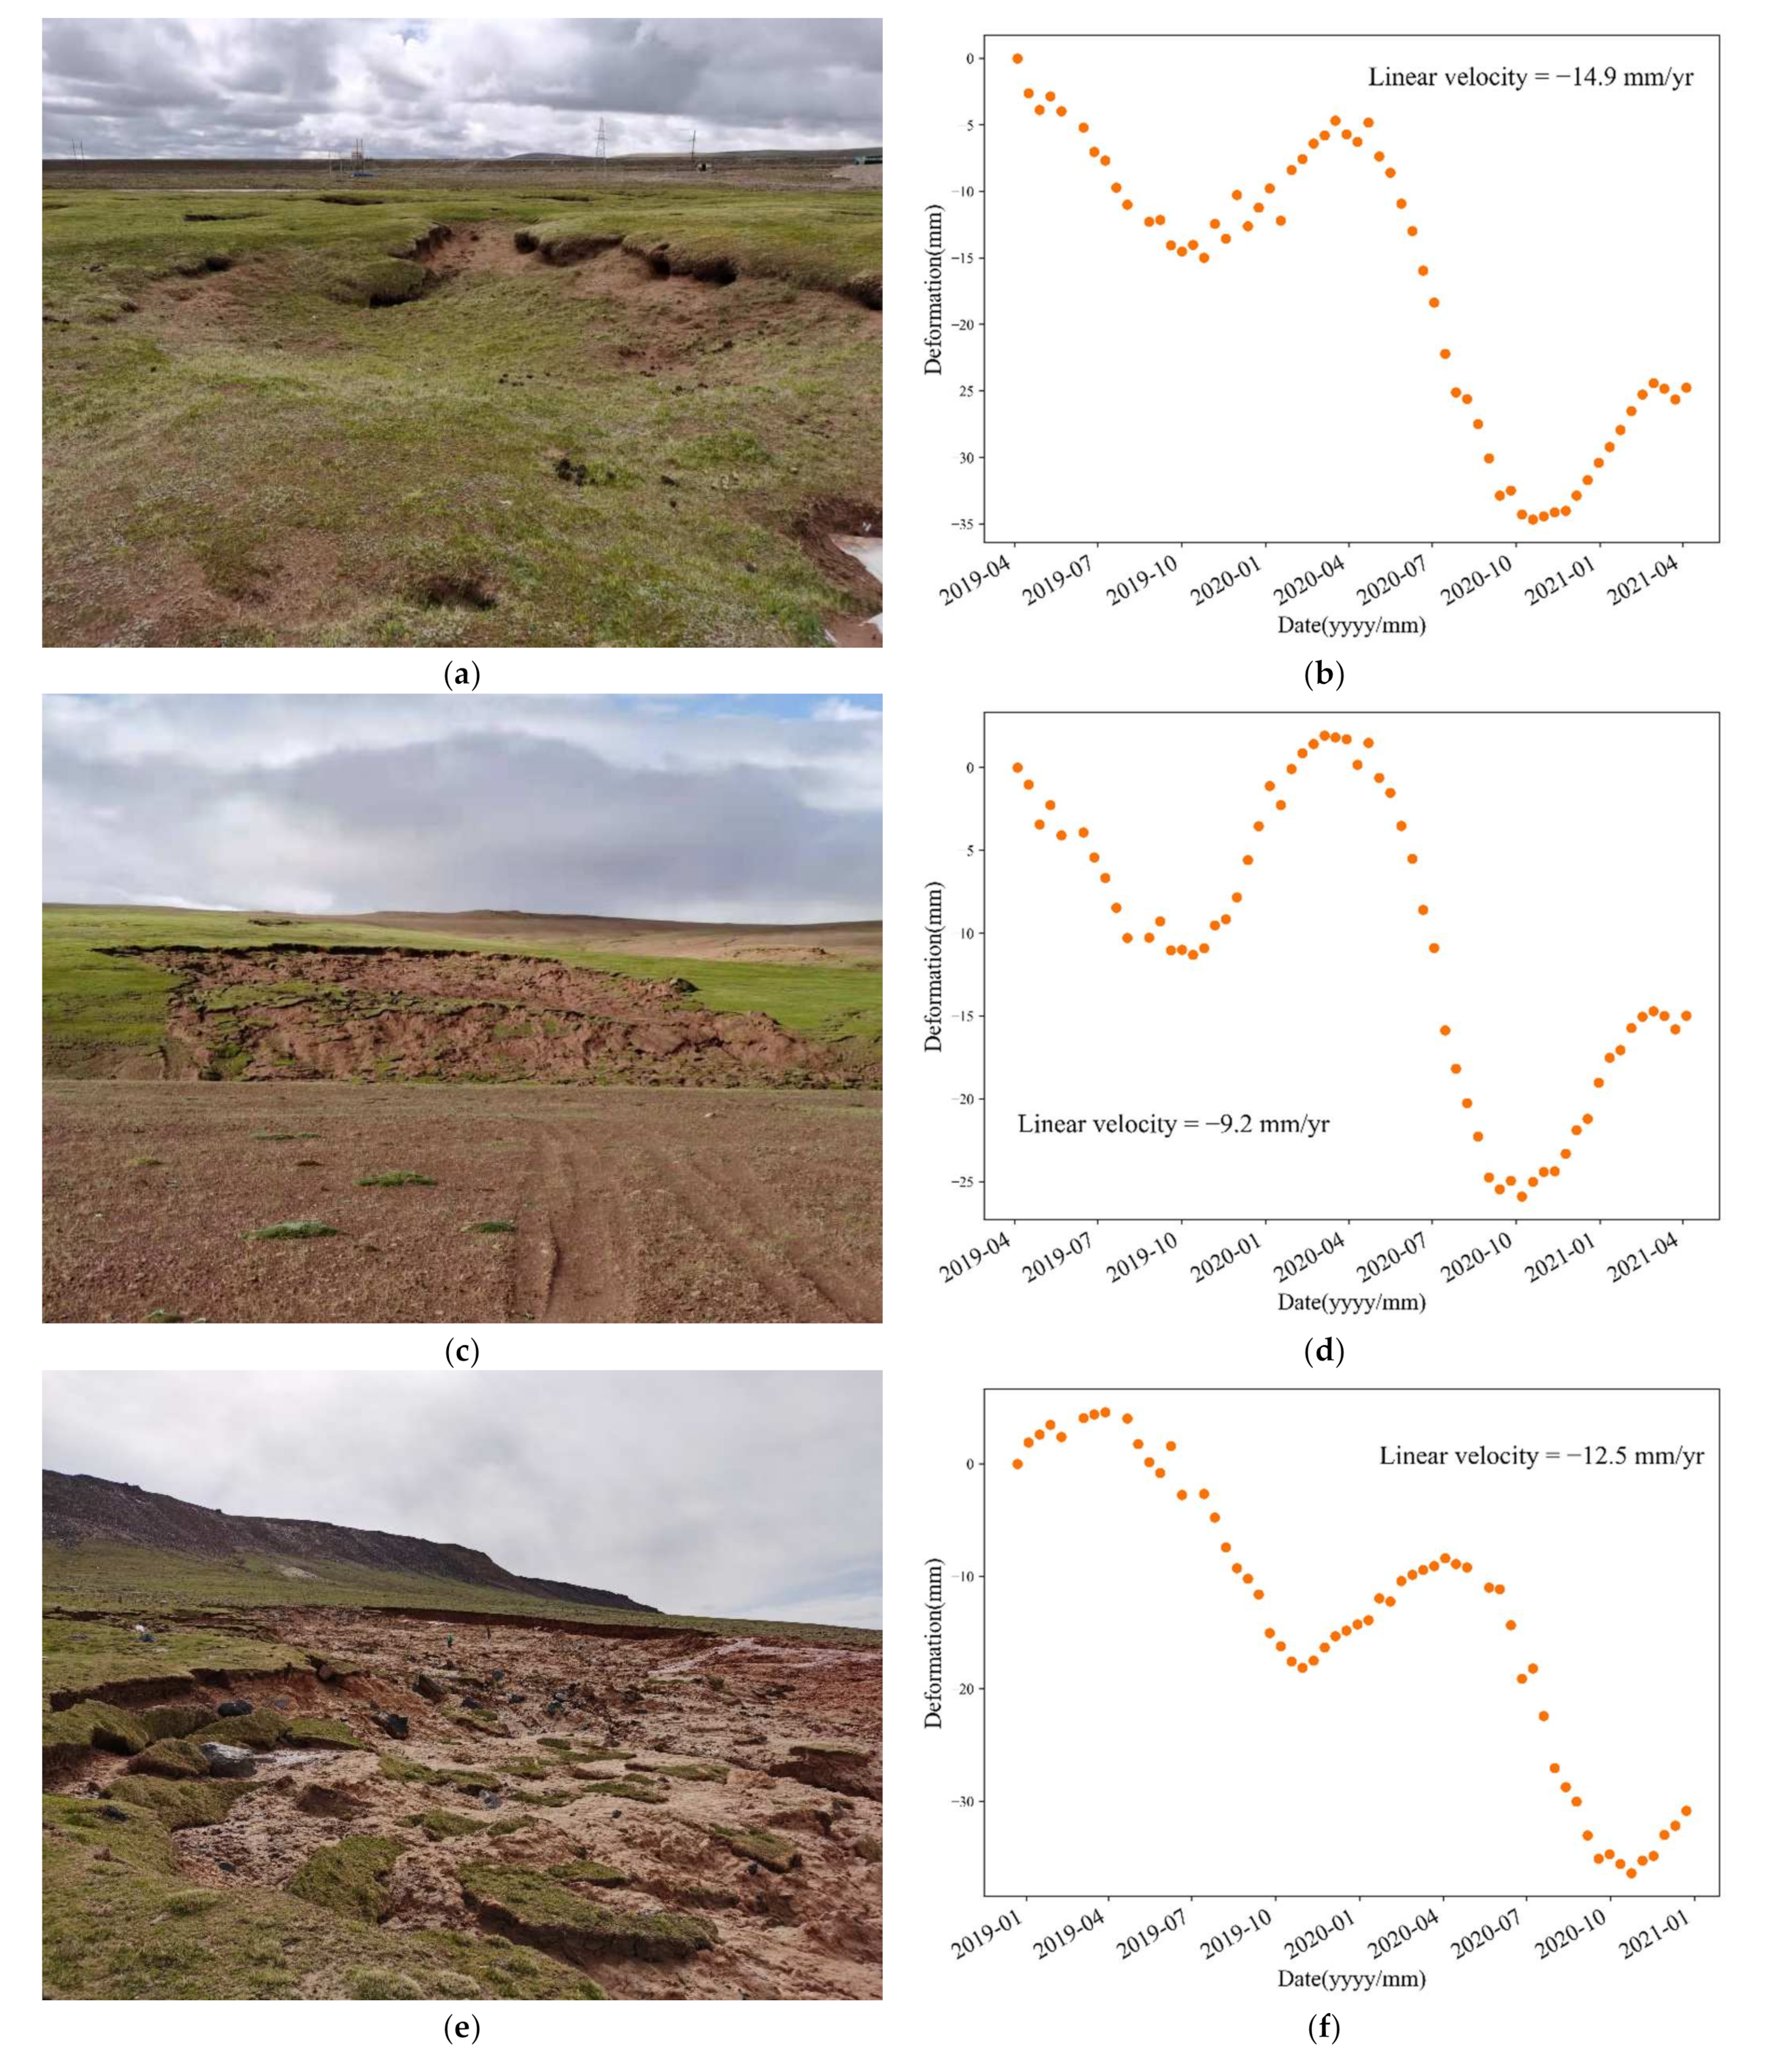
4.2.3. Field Verification
5. Discussion
5.1. Comparisons with Previous Studies
5.2. Spatial Heterogeneity of Time of Maximum Thawing Depth
5.3. Application Potential of Large-Scale InSAR Deformation
6. Conclusions
Author Contributions
Funding
Data Availability Statement
Acknowledgments
Conflicts of Interest
References
- Cheng, G.; Zhao, L.; Li, R.; Wu, X.; Sheng, Y.; Hu, G.; Zou, D.; Jin, H.; Li, X.; Wu, Q. Characteristic, changes and impacts of permafrost on Qinghai-Tibet plateau. Chin. Sci. Bull. 2019, 64, 2783–2795. (In Chinese) [Google Scholar]
- Zhao, L.; Hu, G.; Zou, D.; Wu, X.; Ma, L.; Sun, Z.; Yuan, L.; Zhou, H.; Liu, S. Permafrost Changes and Its Effects on Hydrological Processes on Qinghai-Tibet Plateau. Bull. Chin. Acad Sci. 2019, 34, 1223–1246. (In Chinese) [Google Scholar]
- Zhao, L.; Wu, X.; Wang, Z.; Sheng, Y.; Fang, H.; Zhao, Y.; Hu, G.; Li, W.; Pang, Q.; Shi, J.; et al. Soil organic carbon and total nitrogen pools in permafrost zones of the Qinghai-Tibetan Plateau. Sci. Rep. 2018, 8, 3656. [Google Scholar] [CrossRef] [PubMed]
- Mu, C.; Abbott, B.W.; Norris, A.J.; Mu, M.; Fan, C.; Chen, X.; Jia, L.; Yang, R.; Zhang, T.; Wang, K.; et al. The status and stability of permafrost carbon on the Tibetan Plateau. Earth-Science Reviews 2020, 211, 104344. [Google Scholar] [CrossRef]
- Zheng, G.; Yang, Y.; Yang, D.; Dafflon, B.; Yi, Y.; Zhang, S.; Chen, D.; Gao, B.; Wang, T.; Shi, R.; et al. Remote sensing spatiotemporal patterns of frozen soil and the environmental controls over the Tibetan Plateau during 2002–2016. Remote Sens. Environ. 2020, 247, 111927. [Google Scholar] [CrossRef]
- Cheng, G.D.; Jin, H.J. Permafrost and groundwater on the Qinghai-Tibet Plateau and in northeast China. Hydrogeol. J. 2013, 21, 5–23. [Google Scholar] [CrossRef]
- Wu, Q.; Hou, Y.; Yun, H.; Liu, Y. Changes in active-layer thickness and near-surface permafrost between 2002 and 2012 in alpine ecosystems, Qinghai-Xizang (Tibet) Plateau, China. Glob. Planet. Chang. 2015, 124, 149–155. [Google Scholar] [CrossRef]
- Yang, M.X.; Nelson, F.E.; Shiklomanov, N.I.; Guo, D.L.; Wan, G.N. Permafrost degradation and its environmental effects on the Tibetan Plateau: A review of recent research. Earth Sci. Rev. 2010, 103, 31–44. [Google Scholar] [CrossRef]
- Ran, Y.H.; Li, X.; Cheng, G.D. Climate warming over the past half century has led to thermal degradation of permafrost on the Qinghai-Tibet Plateau. Cryosphere 2018, 12, 595–608. [Google Scholar] [CrossRef] [Green Version]
- Liu, L.; Schaefer, K.; Zhang, T.; Wahr, J. Estimating 1992–2000 average active layer thickness on the Alaskan North Slope from remotely sensed surface subsidence. J. Geophys. Res. 2012, 117, F01005. [Google Scholar] [CrossRef]
- Daout, S.; Dini, B.; Haeberli, W.; Doin, M.P.; Parsons, B. Ice loss in the Northeastern Tibetan Plateau permafrost as seen by 16 yr of ESA SAR missions. Earth Planet. Sci. Lett. 2020, 545, 116404. [Google Scholar] [CrossRef]
- Liu, L.; Schaefer, K.M.; Chen, A.C.; Gusmeroli, A.; Zebker, H.A.; Zhang, T. Remote sensing measurements of thermokarst subsidence using InSAR. J. Geophys. Res. 2015, 120, 1935–1948. [Google Scholar] [CrossRef] [Green Version]
- Chen, J.; Liu, L.; Zhang, T.; Cao, B.; Lin, H. Using Persistent Scatterer Interferometry to Map and Quantify Permafrost Thaw Subsidence: A Case Study of Eboling Mountain on the Qinghai-Tibet Plateau. J. Geophys. Res. Earth Surf. 2018, 123, 2663–2676. [Google Scholar] [CrossRef]
- Liu, L.; Zhang, T.; Wahr, J. InSAR measurements of surface deformation over permafrost on the North Slope of Alaska. J. Geophys. Res. 2010, 115, F03023. [Google Scholar] [CrossRef]
- Chen, J.; Wu, Y.; O’Connor, M.; Cardenas, M.B.; Schaefer, K.; Michaelides, R.; Kling, G. Active layer freeze-thaw and water storage dynamics in permafrost environments inferred from InSAR. Remote Sens. Environ. 2020, 248, 112007. [Google Scholar] [CrossRef]
- Chen, J.; Günther, F.; Grosse, G.; Liu, L.; Lin, H. Sentinel-1 InSAR Measurements of Elevation Changes over Yedoma Uplands on Sobo-Sise Island, Lena Delta. Remote Sens. 2018, 10, 1152. [Google Scholar] [CrossRef] [Green Version]
- Abe, T.; Iwahana, G.; Efremov, P.V.; Desyatkin, A.R.; Kawamura, T.; Fedorov, A.; Zhegusov, Y.; Yanagiya, K.; Tadono, T. Surface displacement revealed by L-band InSAR analysis in the Mayya area, Central Yakutia, underlain by continuous permafrost. Earth Planets Space 2020, 72, 138. [Google Scholar] [CrossRef]
- Daout, S.; Doin, M.P.; Peltzer, G.; Socquet, A.; Lasserre, C. Large-scale InSAR monitoring of permafrost freeze-thaw cycles on the Tibetan Plateau. Geophys. Res. Lett. 2017, 44, 901–909. [Google Scholar] [CrossRef]
- Li, R.; Li, Z.; Han, J.; Lu, P.; Qiao, G.; Meng, X.; Hao, T.; Zhou, F. Monitoring surface deformation of permafrost in Wudaoliang Region, Qinghai-Tibet Plateau with ENVISAT ASAR data. Int. J. Appl. Earth Obs. Geoinf. 2021, 104, 102527. [Google Scholar] [CrossRef]
- Chen, J.; Wu, T.; Zou, D.; Liu, L.; Wu, X.; Gong, W.; Zhu, X.; Li, R.; Hao, J.; Hu, G.; et al. Magnitudes and patterns of large-scale permafrost ground deformation revealed by Sentinel-1 InSAR on the central Qinghai-Tibet Plateau. Remote Sens. Environ. 2022, 268, 112778. [Google Scholar] [CrossRef]
- Elliott, J.R.; Elliott, A.J.; Hooper, A.; Larsen, Y.; Marinkovic, P.; Wright, T.J. Earthquake monitoring gets boost from new satellite. Eos Trans. Am. Geophys. Union 2015, 96, 14–18. [Google Scholar] [CrossRef]
- Weiss, J.R.; Walters, R.J.; Morishita, Y.; Wright, T.J.; Lazecky, M.; Wang, H.; Hussain, E.; Hooper, A.J.; Elliott, J.R.; Rollins, C.; et al. High-resolution surface velocities and strain for Anatolia from Sentinel-1 InSAR and GNSS data. Geophys. Res. Lett. 2020, 47, e2020GL087376. [Google Scholar] [CrossRef]
- Lazeck, M.; Spaans, K.; González, P.J.; Maghsoudi, Y.; Wright, T.J. LiCSAR: An automatic InSAR tool for measuring and moni-toring tectonic and volcanic activity. Remote Sens. 2020, 12, 2430. [Google Scholar] [CrossRef]
- Zhao, L.; Zou, D.F.; Hu, G.J.; Du, E.J.; Pang, Q.Q.; Xiao, Y.; Li, R.; Sheng, Y.; Wu, X.D.; Sun, Z.; et al. Changing climate and the permafrost environment on the Qinghai-Tibet (Xizang) plateau. Permafr. Periglac. Processes 2020, 31, 396–405. [Google Scholar] [CrossRef]
- Liu, Q.; Niu, J.; Lu, P.; Dong, F.; Zhou, F.; Meng, X.; Xu, W.; Li, S.; Hu, B.X. Interannual and seasonal variations of permafrost thaw depth on the Qinghai-Tibetan plateau: A comparative study using long short-term memory, convolutional neural networks, and random forest. Sci. Total Environ. 2022, 838, 155886. [Google Scholar] [CrossRef]
- Zou, D.; Zhao, L.; Sheng, Y.; Chen, J.; Hu, G.; Wu, T.; Wu, J.; Xie, C.; Wu, X.; Pang, Q.; et al. A new map of permafrost distribution on the Tibetan Plateau. Cryosphere 2017, 11, 2527–2542. [Google Scholar] [CrossRef] [Green Version]
- Ran, Y.; Li, X.; Cheng, G.; Nan, Z.; Che, J.; Sheng, Y.; Wu, Q.; Jin, H.; Luo, D.; Tang, Z.; et al. Mapping the permafrost stability on the Tibetan Plateau for 2005–2015. Sci. China Earth Sci. 2021, 51, 183–200. [Google Scholar] [CrossRef]
- Qin, Y.; Wu, T.; Zhao, L.; Wu, X.; Li, R.; Xie, C.; Pang, Q.; Hu, G.; Qiao, Y.; Zhao, G.; et al. Numerical Modeling of the Active Layer Thickness and Permafrost Thermal State across Qinghai-Tibetan Plateau. J. Geophys. Res. Atmos. 2017, 122, 11604–11620. [Google Scholar] [CrossRef]
- Wang, C.; Zhang, Z.; Zhang, H.; Zhang, B.; Wu, Q. Active Layer Thickness Retrieval of Qinghai-Tibet Permafrost Using the TerraSAR-X InSAR Technique. IEEE J. Sel. Top. Appl. Earth Obs. Remote Sens. 2018, 11, 4403–4413. [Google Scholar] [CrossRef]
- Sun, Z.; Ma, W.; Zhang, S.; Wen, Z.; Wu, J.L. Embankment Stability of the Qinghai–Tibet Railway in Permafrost Regions. J. Cold Reg. Eng. 2018, 32, 118–124. [Google Scholar] [CrossRef]
- Li, S.; Lai, Y.; Zhang, M.; Dong, Y. Study on long-term stability of Qinghai–Tibet Railway embankment. Cold Reg. Sci. Technol. 2009, 57, 139–147. [Google Scholar] [CrossRef]
- Morishita, Y.; Lazecky, M.; Wright, T.J.; Weiss, J.R.; Elliott, J.R.; Hooper, A. LiCSBAS: An Open-Source InSAR Time Series Analysis Package Integrated with the LiCSAR Automated Sentinel-1 InSAR Processor. Remote Sens. 2020, 12, 424. [Google Scholar] [CrossRef] [Green Version]
- Li, S.; Li, Z.; Hu, J.; Sun, Q.; Yu, X. Investigation of the Seasonal oscillation of the permafrost over Qinghai-Tibet Plateau with SBAS-InSAR algorithm. Chin. J. Geophys. 2013, 56, 1476–1486. (In Chinese) [Google Scholar]
- Li, R.; Zhao, L.; Ding, Y.J.; Wu, T.; Xiao, Y.; Du, E.J.; Liu, G.; Qiao, Y. Temporal and spatial variations of the active layer along the Qinghai-Tibet highway in a permafrost region. Chin. Sci. Bull. 2012, 57, 4609–4616. (In Chinese) [Google Scholar] [CrossRef] [Green Version]
- Liu, X.; Zhao, C.; Zhang, Q.; Lu, Z.; Li, Z.; Yang, C.; Zhu, W.; Liu-Zeng, J.; Chen, L.; Liu, C. Integration of Sentinel-1 and ALOS/PALSAR-2 SAR datasets for mapping active landslides along the Jinsha River corridor, China. Eng. Geol. 2021, 11, 106033. [Google Scholar] [CrossRef]
- Zhao, Q.; Pepe, A.; Gao, W.; Lu, Z.; Bonano, M.; He, M.L.; Wang, J.; Tang, X. A DInSAR Investigation of the Ground Settlement Time Evolution of Ocean-Reclaimed Lands in Shanghai. IEEE Sel. Top. Appl. Earth Obs. Remote Sens. 2015, 8, 1763–1781. [Google Scholar] [CrossRef]
- Pepe, A.; Bonano, M.; Zhao, Q.; Yang, T.; Wang, H. The use of C-/X-band time-gapped SAR data and geotechnical models for the study of Shanghai’s ocean-reclaimed lands through the SBAS-DInSAR technique. Remote Sens. 2016, 8, 911. [Google Scholar] [CrossRef] [Green Version]
- Harris, C.; Kern-Luetschg, M.; Murton, J.; Font, M.; Davies, M.; Smith, F. Solifluction Processes on Permafrost and Non-Permafrost Slopes: Results of a Large-scale Laboratory Simulation. Permafr. Periglac. Processes 2008, 19, 359–378. [Google Scholar] [CrossRef]
- Dong, X.; Liu, C.; Li, M.; Ma, D.; Chen, Q.; Zang, S. Variations in active layer soil hydrothermal dynamics of typical wetlands in permafrost region in the Great Hing’an Mountains, northeast China. Ecol. Indic. 2021, 129, 107880. [Google Scholar] [CrossRef]
- Farquharson, L.M.; Romanovsky, V.E.; Cable, W.L.; Walker, D.A.; Kokelj, S.V.; Nicolsky, D. Climate Change Drives Widespread and Rapid Thermokarst Development in Very Cold Permafrost in the Canadian High Arctic. Geophys. Res. Lett. 2019, 46, 6681–6689. [Google Scholar] [CrossRef] [Green Version]
- Shiklomanov, N.I.; Nelson, F.E. Analytic representation of the active layer thickness field, Kuparuk River Basin, Alaska. Ecol. Model. 1999, 123, 105–125. [Google Scholar] [CrossRef]
- Clayton, L.K.; Schaefer, K.; Battaglia, M.J.; Bourgeau-Chavez, L.; Chen, J.; Chen, R.H.; Chen, A.; Bakian-Dogaheh, K.; Grelik, S.; Jafarov, E.; et al. Active layer thickness as a function of soil water content. Environ. Res. Lett. 2021, 16, 055028. [Google Scholar] [CrossRef]


| Frame | Date | Ascending/Descending | Sentinel-1 Data Count |
|---|---|---|---|
| 099A_05217_131313 | 12/01/2018–14/01/2020 | Ascending | 58 |
| 099A_05416_131313 | 07/01/2019–08/01/2021 | Ascending | 58 |
| 026A_05128_131313 | 21/01/2017–26/01/2019 | Ascending | 60 |
| 143A_05651_131313 | 04/03/2018–05/03/2020 | Ascending | 54 |
| 041A_05629_131313 | 22/12/2018–23/12/2020 | Ascending | 58 |
| 041A_05430_131313 | 11/10/2018–12/10/2020 | Ascending | 54 |
| 012A_05443_131313 | 07/03/2018–08/03/2020 | Ascending | 55 |
| 085A_05455_131313 | 12/03/2018–13/03/2020 | Ascending | 58 |
| 085A_05654_131313 | 24/03/2018–06/02/2020 | Ascending | 54 |
| 158A_05451_131313 | 03/05/2018–18/03/2020 | Ascending | 59 |
| 056A_05457_131313 | 07/10/2019–10/02/2021 | Ascending | 43 |
| 077D_05487_141313 | 20/02/2017–10/02/2019 | Descending | 42 |
| 077D_05685_121313 | 07/09/2018–23/05/2020 | Descending | 44 |
| 004D_05513_131313 | 05/01/2018–07/01/2020 | Descending | 53 |
| 150D_05505_131313 | 04/04/2019–24/03/2021 | Descending | 60 |
| 121D_05470_131313 | 09/01/2019–10/01/2021 | Descending | 53 |
| 121D_05668_131313 | 17/10/2018–02/07/2020 | Descending | 40 |
| 121D_05217_131313 | 09/01/2019–10/01/2021 | Descending | 62 |
| 019D_05619_131313 | 02/01/2019–28/12/2020 | Descending | 48 |
| Permafrost Type | Area (km2) | Proportion |
|---|---|---|
| Extremely stable | 122 | 0.3% |
| Stable | 3745 | 8.9% |
| Sub-stable | 13,732 | 32.9% |
| Transitional | 16,992 | 40.7% |
| Unstable | 7202 | 17.2% |
| Observation Point | Leveling Rate (mm/yr) | InSAR Rate (mm/yr) | Difference between Leveling and InSAR (mm/yr) | Observation Point | Leveling Rate (mm/yr) | InSAR Rate (mm/yr) | Difference between Leveling and InSAR (mm/yr) |
|---|---|---|---|---|---|---|---|
| Y1 | 1 | −4 | −5 | Y12 | 0 | 0 | 0 |
| Y2 | −1 | −4 | −3 | Y13 | −1 | 0 | 1 |
| Y3 | 0 | 3 | 3 | Y14 | −4 | −7 | −3 |
| Y4 | −7 | −11 | −4 | Y15 | −7 | −12 | −5 |
| Y5 | −4 | −2 | 2 | Y16 | −11 | −13 | −2 |
| Y6 | −5 | −8 | −3 | Y17 | −2 | −3 | −1 |
| Y7 | −2 | −3 | −1 | Y18 | −2 | −9 | −7 |
| Y8 | 4 | 3 | −1 | Y19 | −4 | −6 | −2 |
| Y9 | −16 | −13 | 3 | Y20 | −4 | −9 | −5 |
| Y10 | −14 | −7 | 7 | Y21 | −1 | −5 | −4 |
| Y11 | −6 | −8 | −2 | Mean ± std | 3 ± 2 | ||
| Authors | Study Area | SAR Data | Observation Period | Linear Rate (mm/yr) | This Study Result (mm/yr) |
|---|---|---|---|---|---|
| Chen et al. | central QTP | Sentinel-1 | 2014–2019 | −15 to 15 | −20 to 15 |
| Wang et al. | Beiluhe Basin | TerraSAR | 2014–2016 | −15 to 0 | −15 to 5 |
| Li et al. | Wudaoliang region | ENVISAT | 2006–2009 | −15 to 15 | −20 to 10 |
Publisher’s Note: MDPI stays neutral with regard to jurisdictional claims in published maps and institutional affiliations. |
© 2022 by the authors. Licensee MDPI, Basel, Switzerland. This article is an open access article distributed under the terms and conditions of the Creative Commons Attribution (CC BY) license (https://creativecommons.org/licenses/by/4.0/).
Share and Cite
Xu, Z.; Jiang, L.; Niu, F.; Guo, R.; Huang, R.; Zhou, Z.; Jiao, Z. Monitoring Regional-Scale Surface Deformation of the Continuous Permafrost in the Qinghai–Tibet Plateau with Time-Series InSAR Analysis. Remote Sens. 2022, 14, 2987. https://doi.org/10.3390/rs14132987
Xu Z, Jiang L, Niu F, Guo R, Huang R, Zhou Z, Jiao Z. Monitoring Regional-Scale Surface Deformation of the Continuous Permafrost in the Qinghai–Tibet Plateau with Time-Series InSAR Analysis. Remote Sensing. 2022; 14(13):2987. https://doi.org/10.3390/rs14132987
Chicago/Turabian StyleXu, Zhida, Liming Jiang, Fujun Niu, Rui Guo, Ronggang Huang, Zhiwei Zhou, and Zhiping Jiao. 2022. "Monitoring Regional-Scale Surface Deformation of the Continuous Permafrost in the Qinghai–Tibet Plateau with Time-Series InSAR Analysis" Remote Sensing 14, no. 13: 2987. https://doi.org/10.3390/rs14132987
APA StyleXu, Z., Jiang, L., Niu, F., Guo, R., Huang, R., Zhou, Z., & Jiao, Z. (2022). Monitoring Regional-Scale Surface Deformation of the Continuous Permafrost in the Qinghai–Tibet Plateau with Time-Series InSAR Analysis. Remote Sensing, 14(13), 2987. https://doi.org/10.3390/rs14132987