
Investigation of Long-Term Forest Dynamics in Protected Areas of Northeast China Using Landsat Data


 , ,
, ,
Abstract
1. Introduction
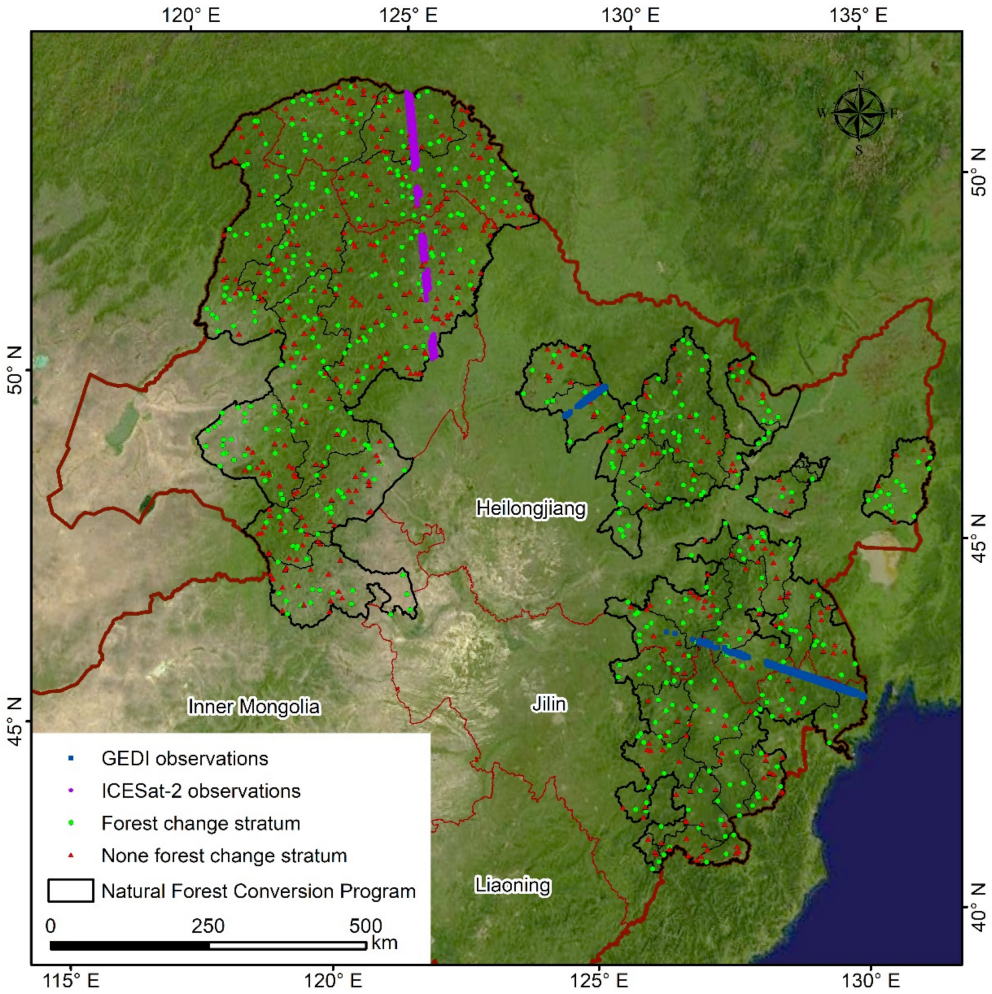
2. Study Area
3. Data and Methods
3.1. Remote Sensing Data
3.2. Tree-Canopy Cover Estimation
3.3. Forest Change Detection
3.4. Forest Change Accuracy Validation
3.4.1. Point Selection
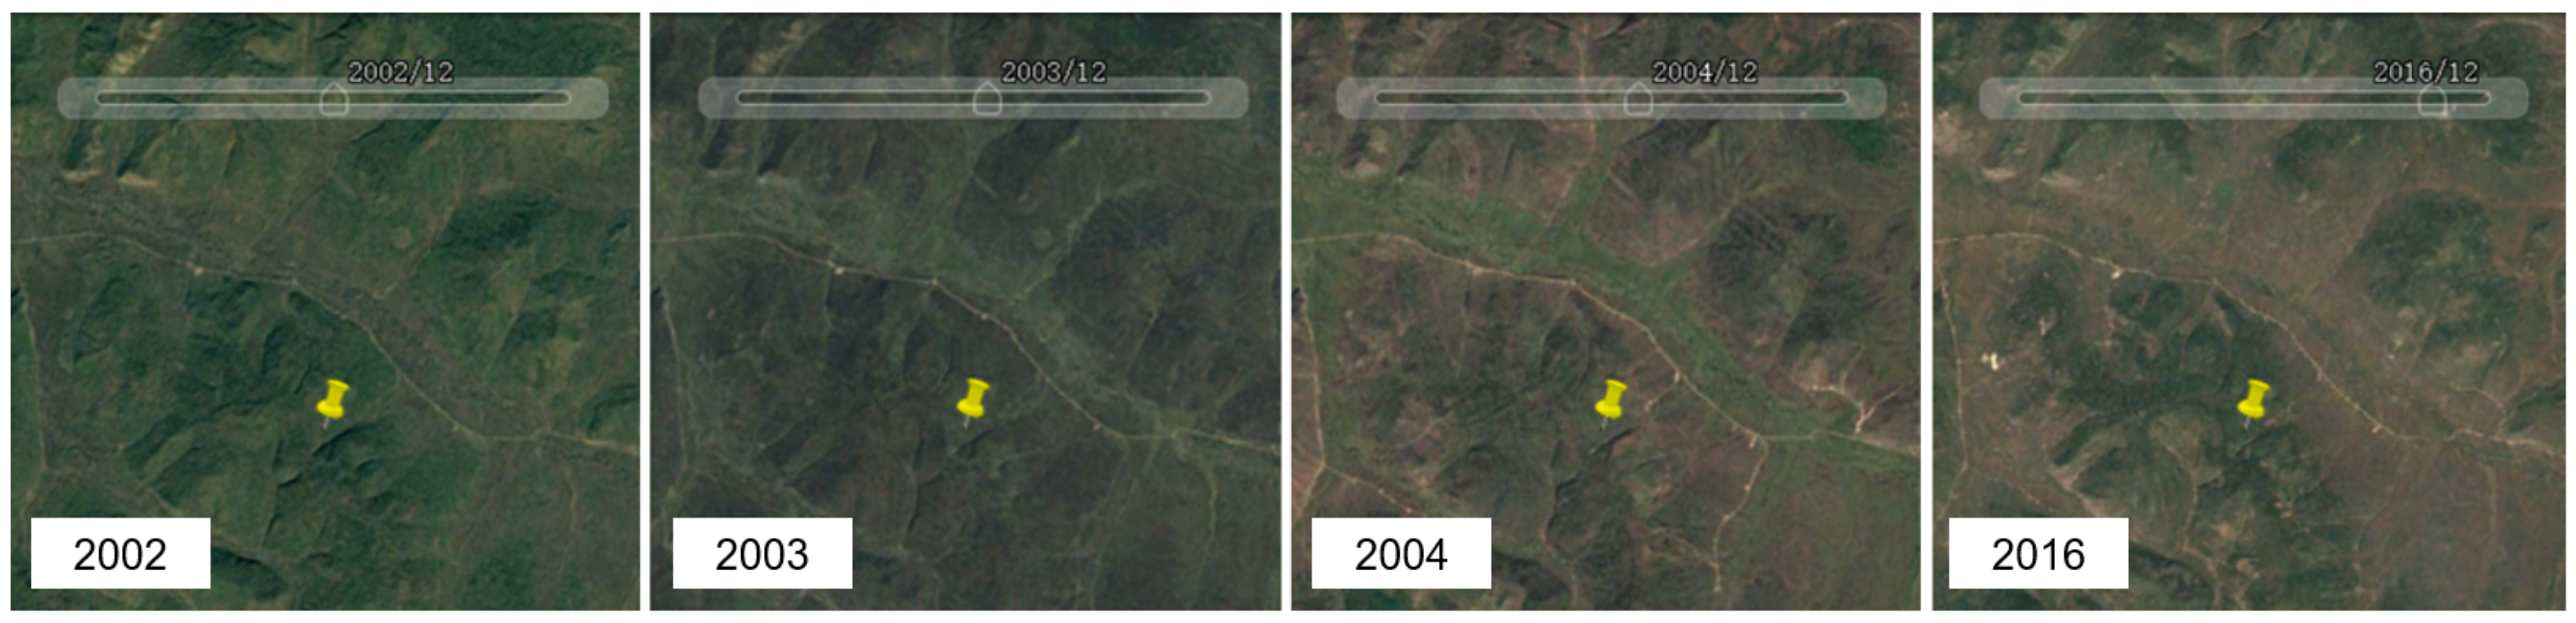
3.4.2. Visual Interpretation
3.4.3. Validation Metrics
4. Results
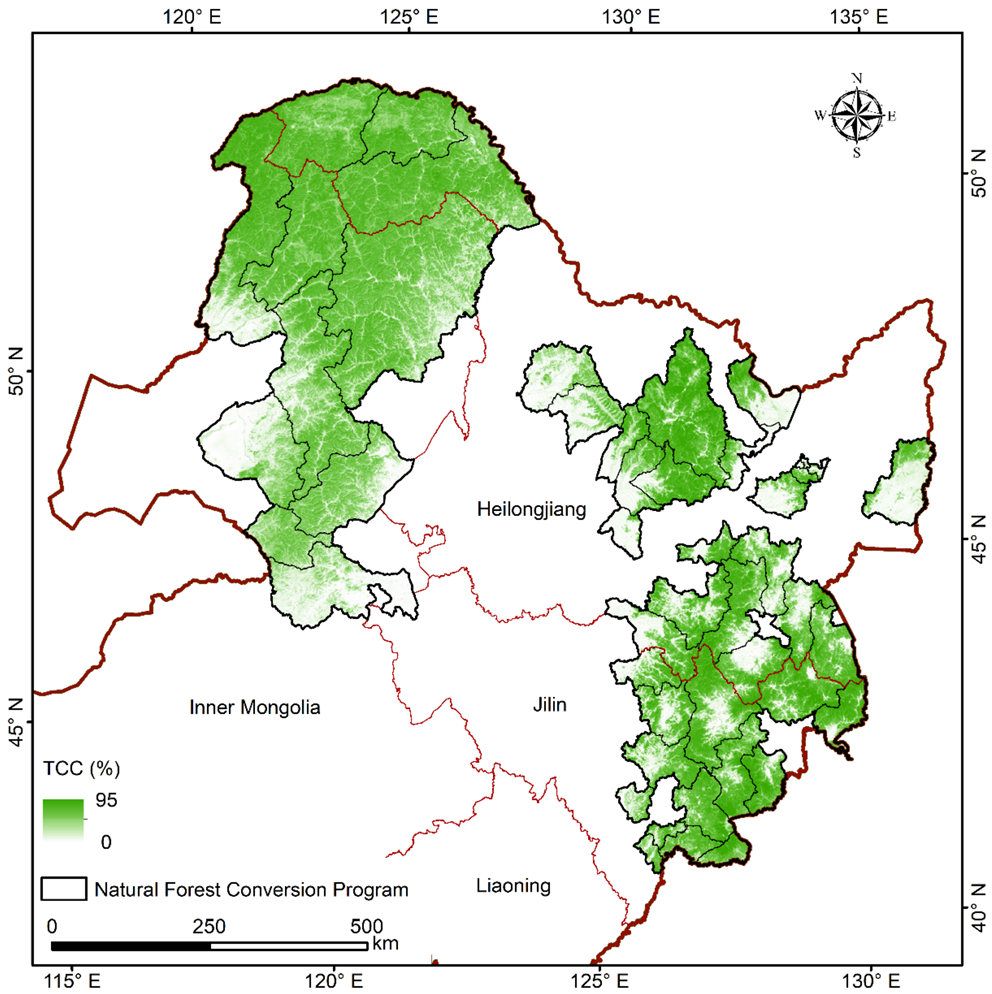
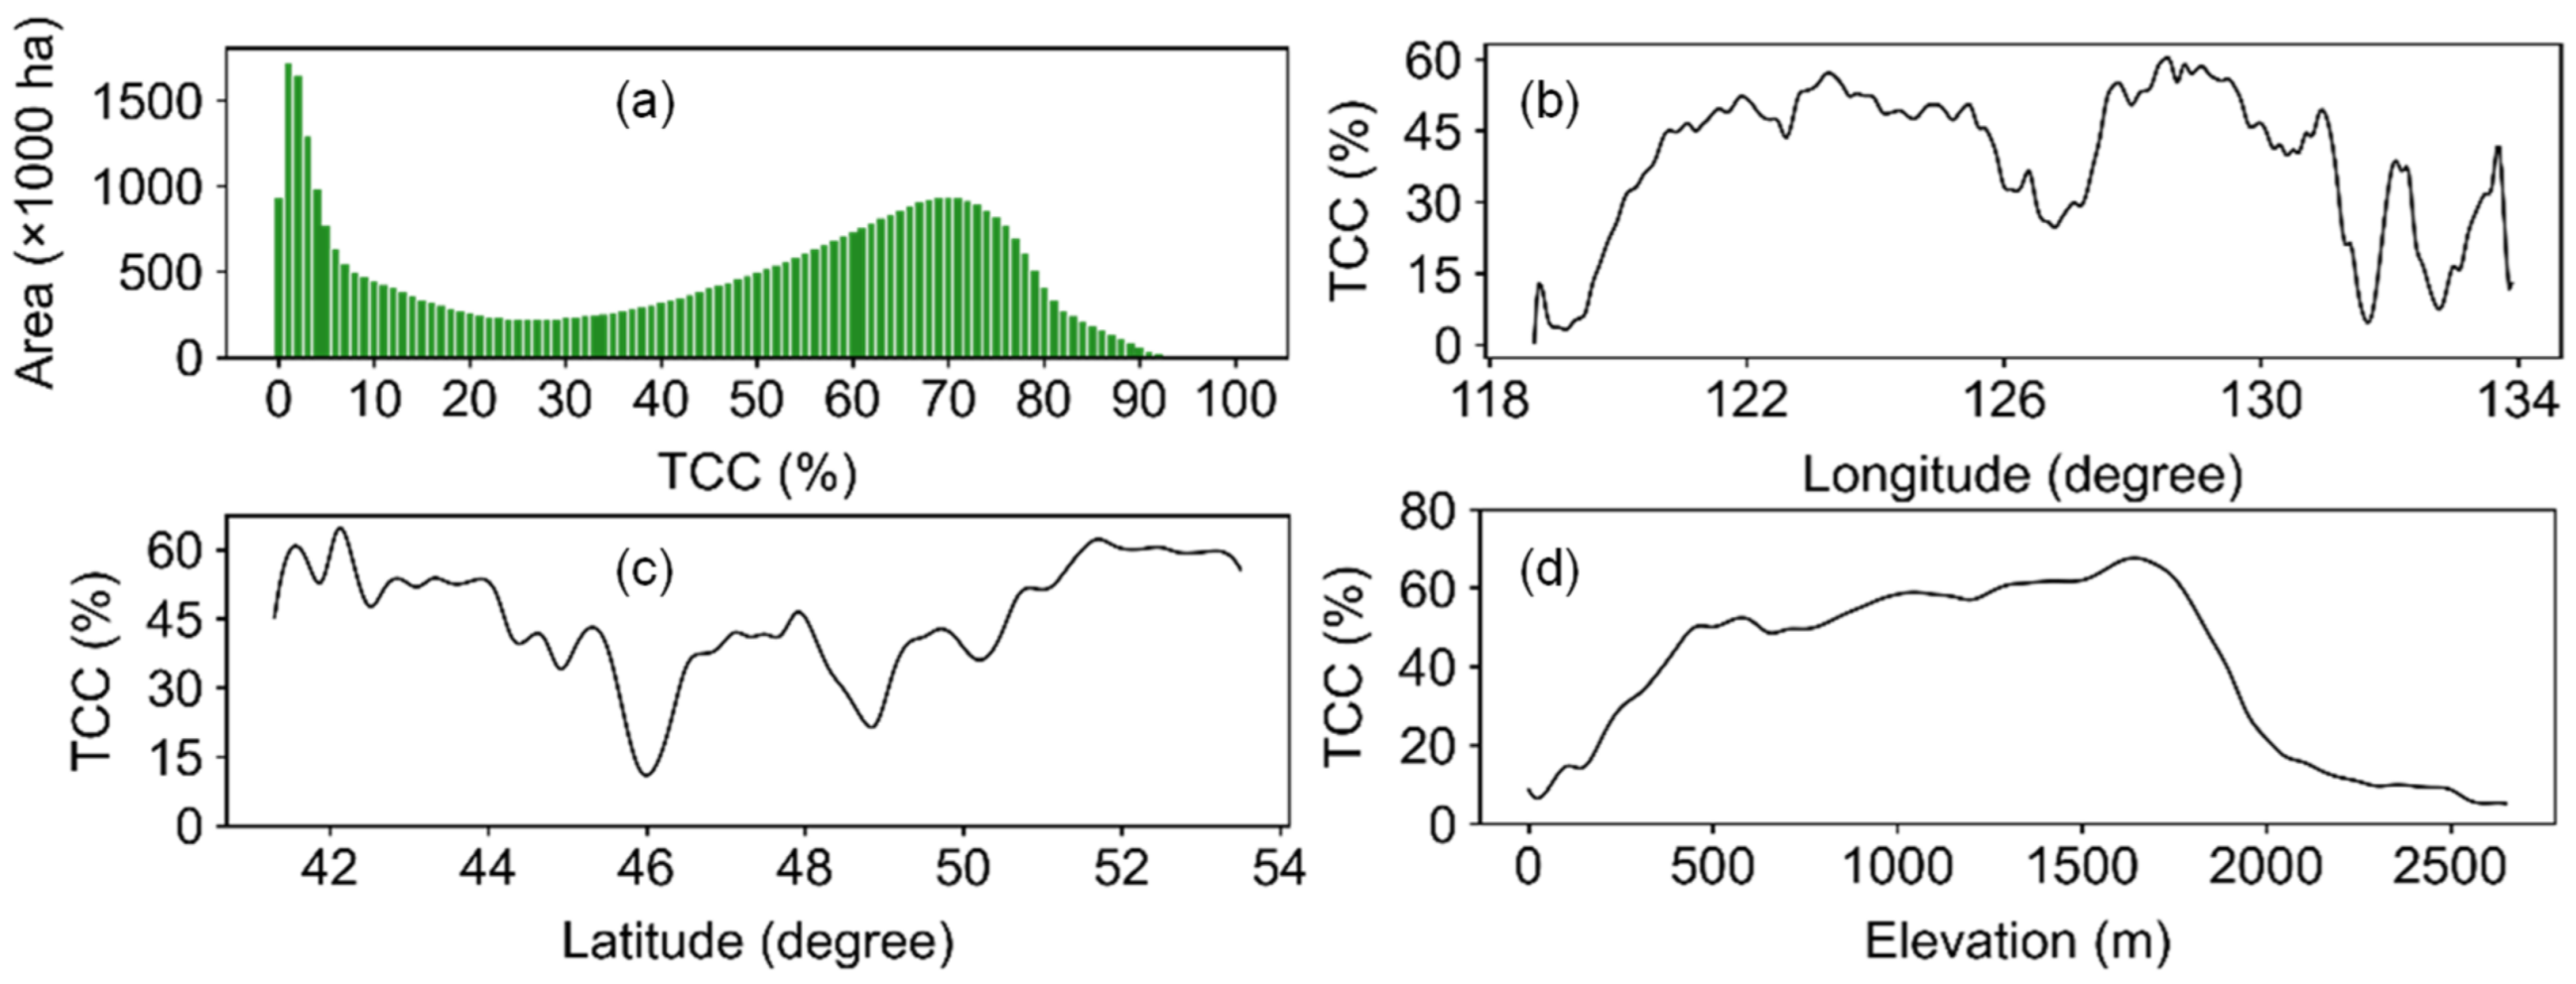
4.1. Spatial Distribution of Tree-Canopy Cover
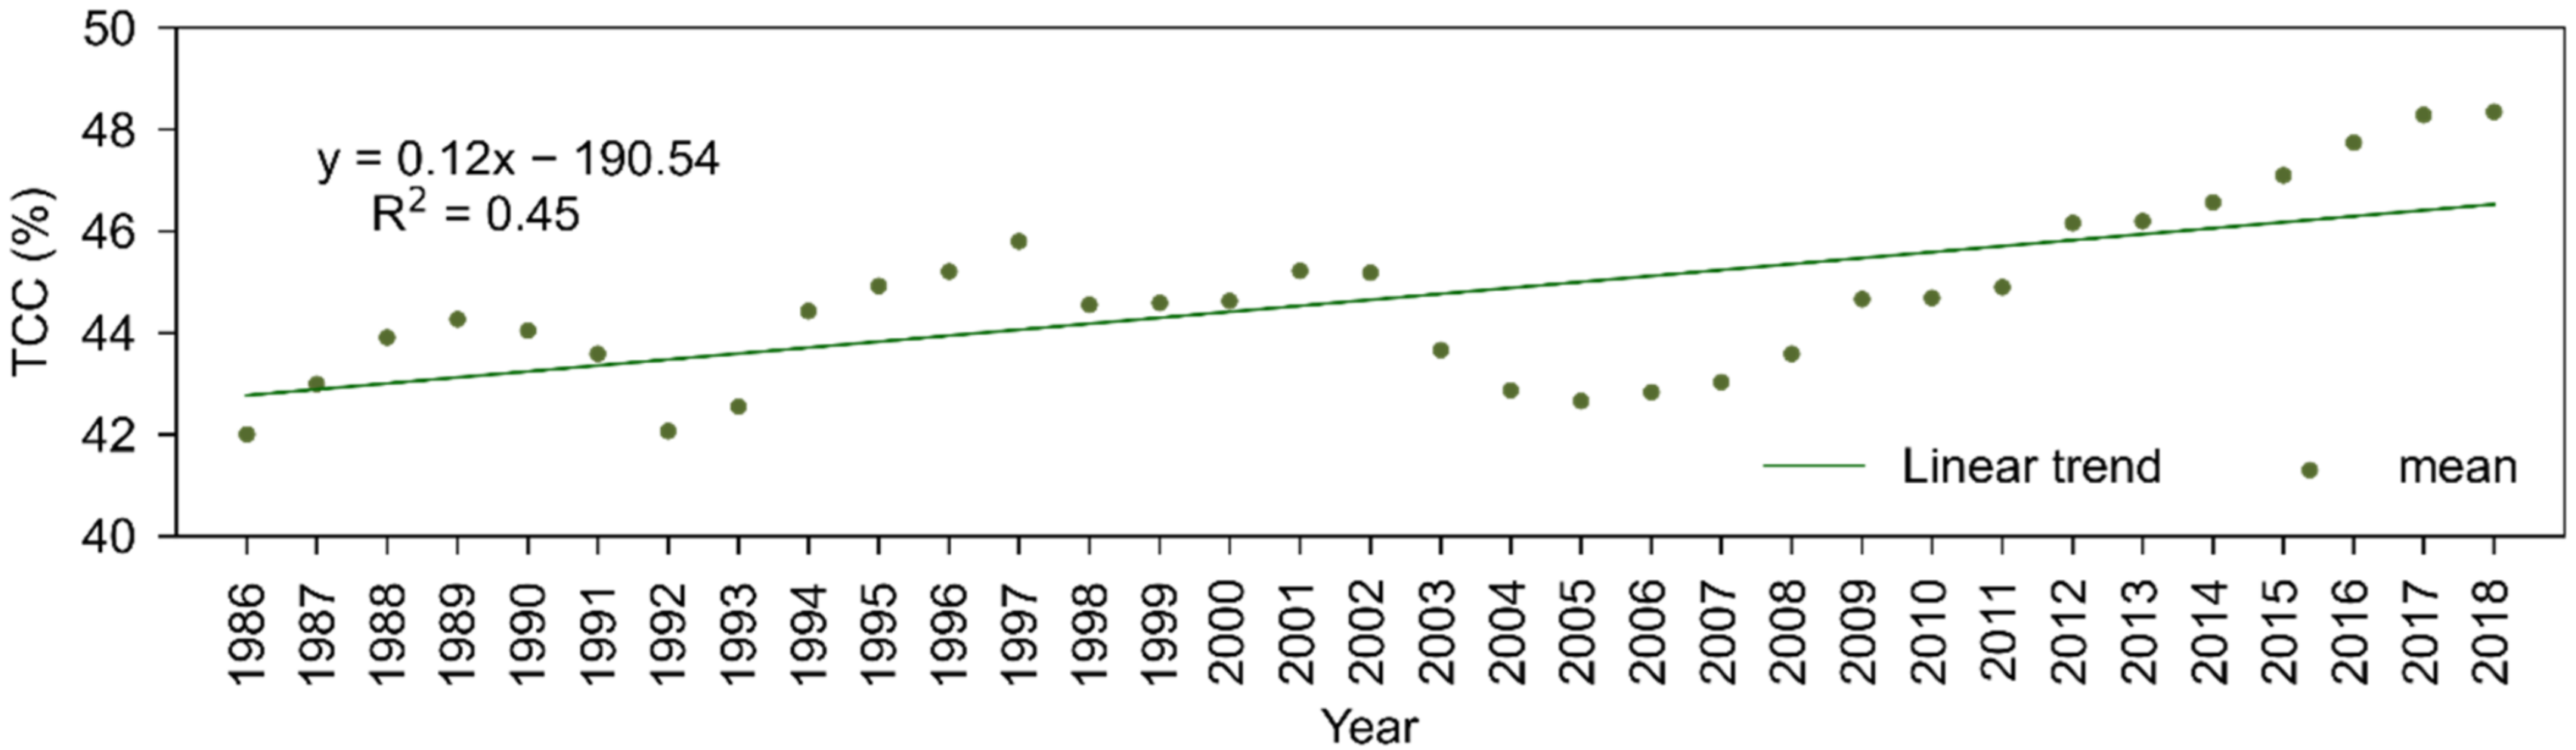
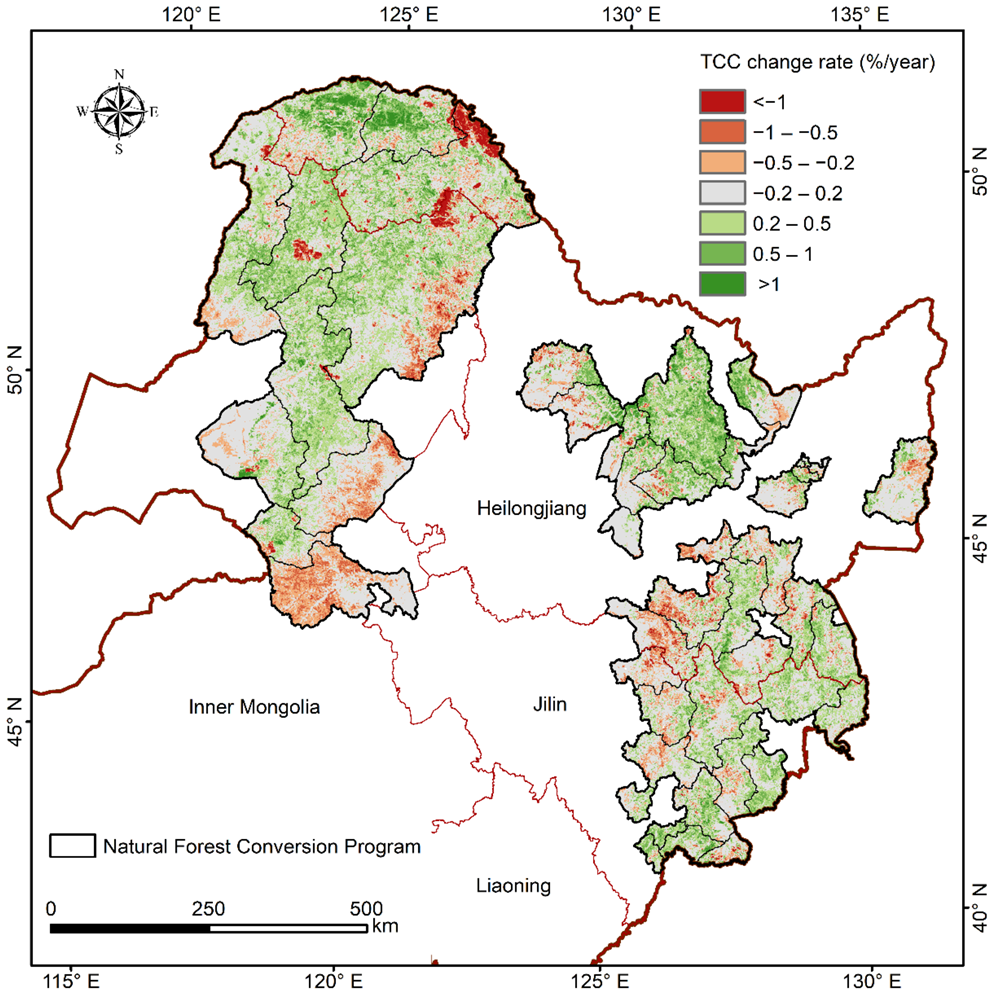
4.2. Spatio-Temporal Changes of Tree-Canopy Cover
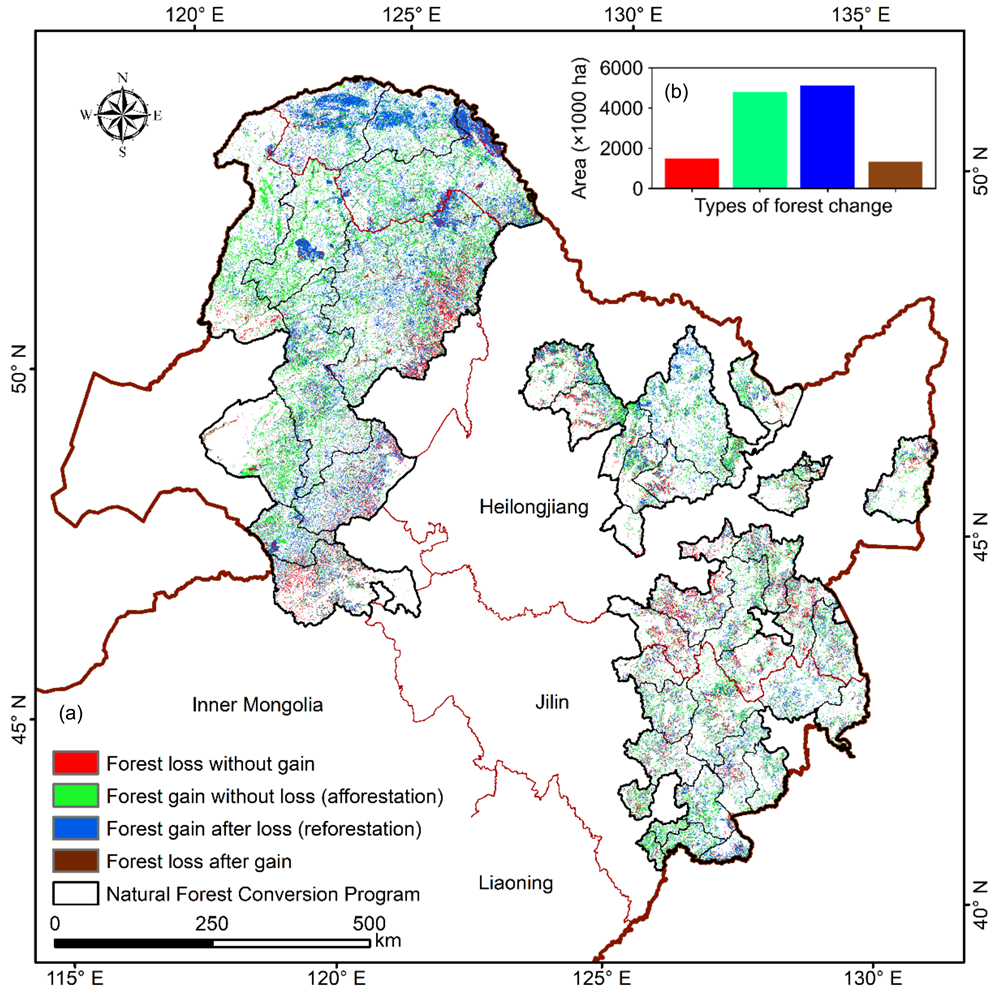
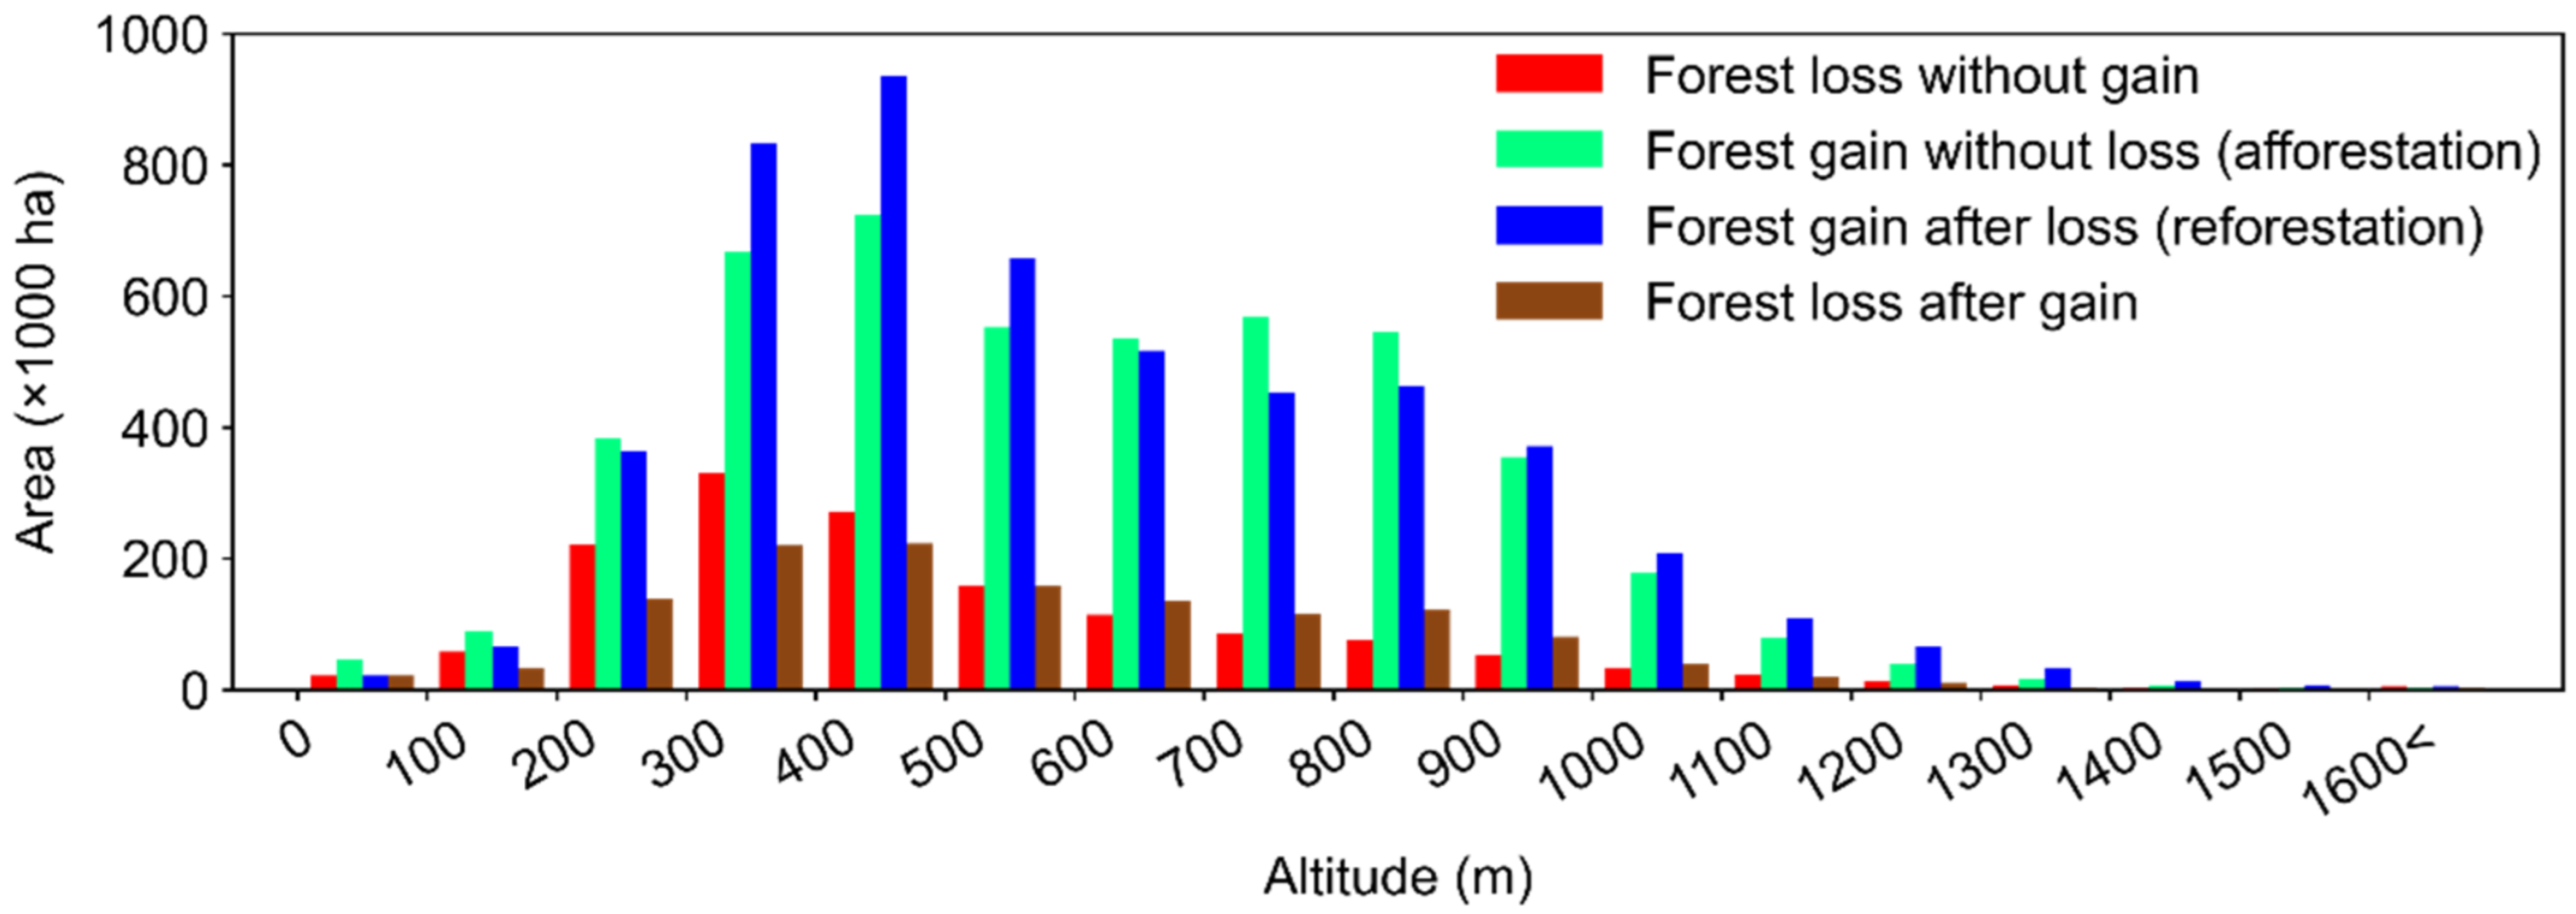
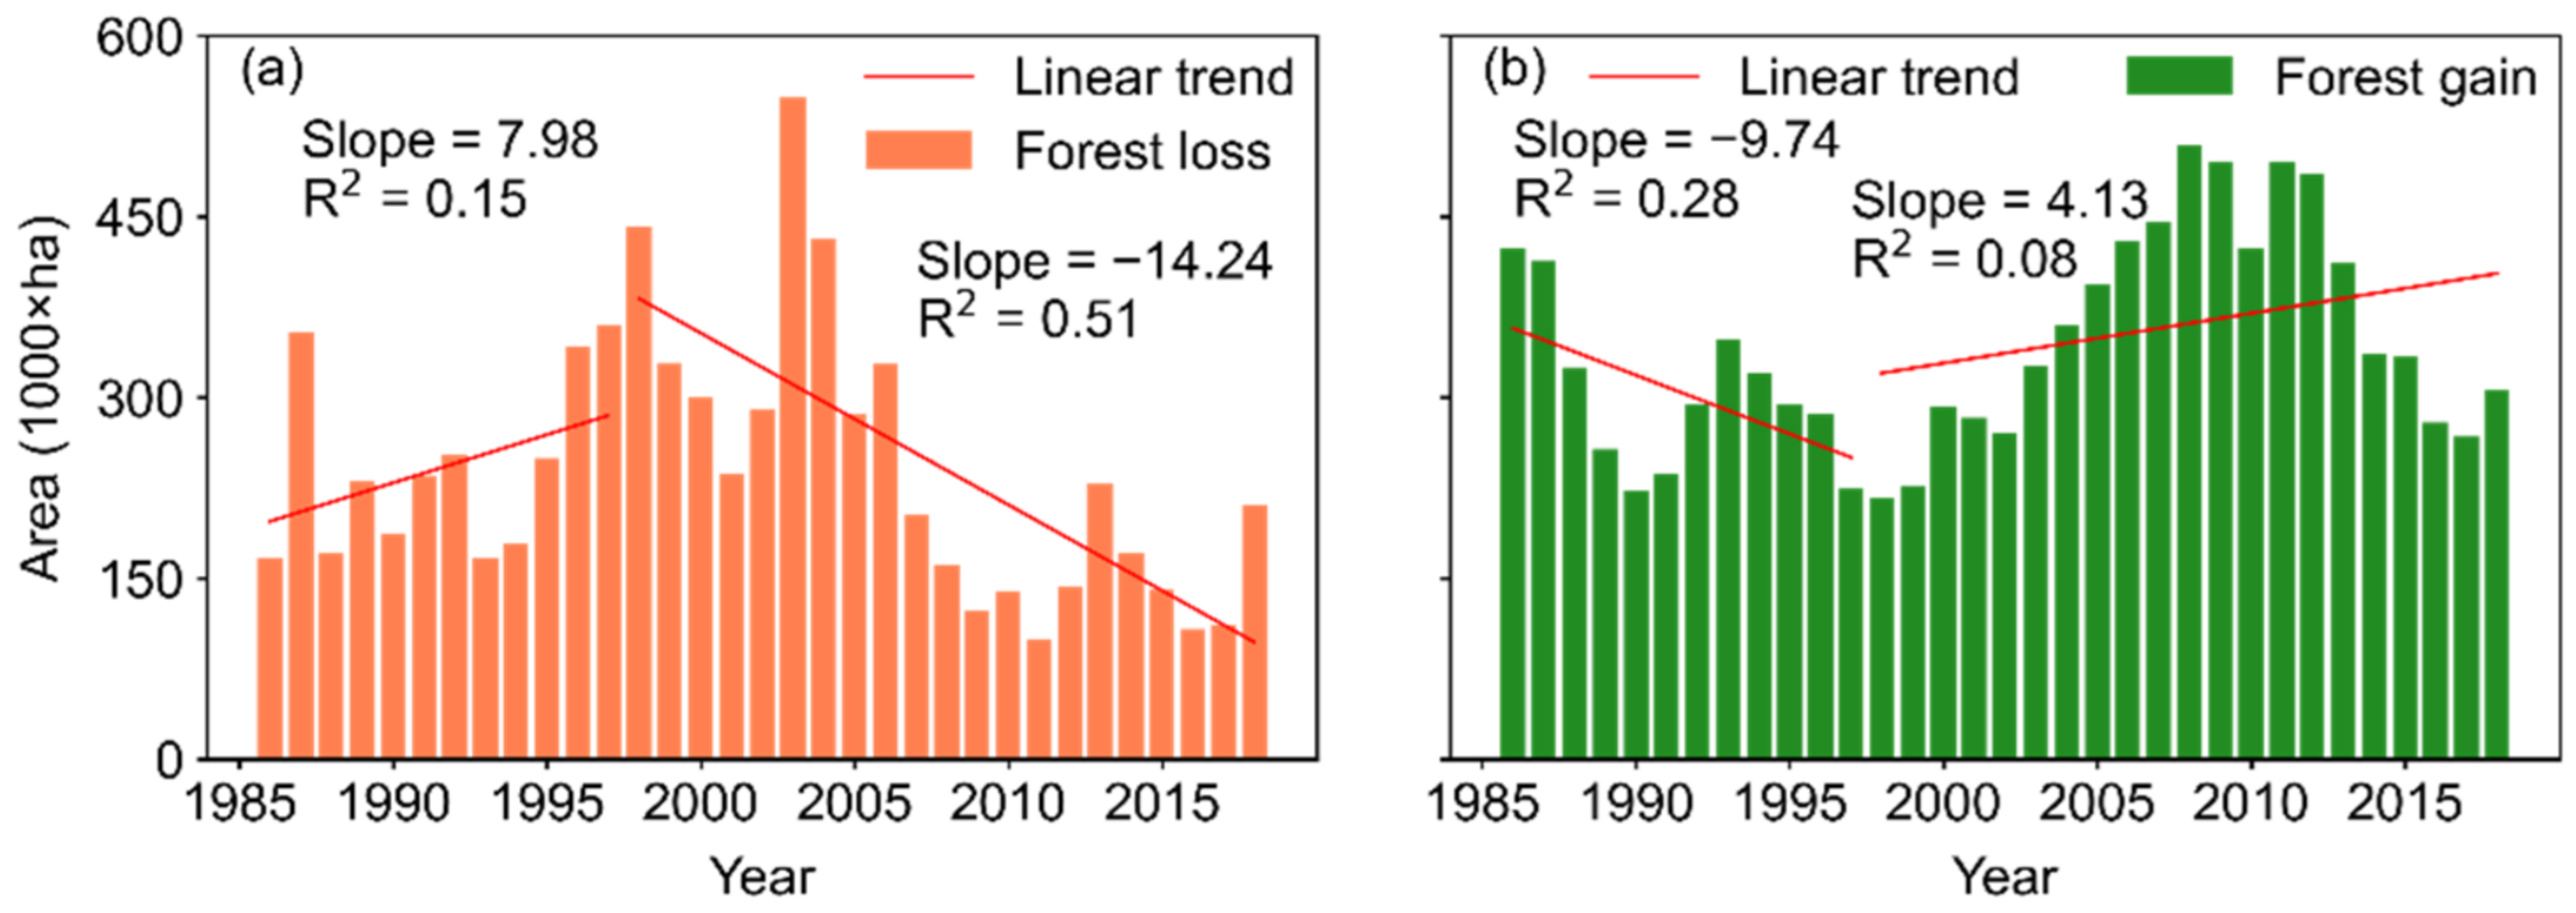
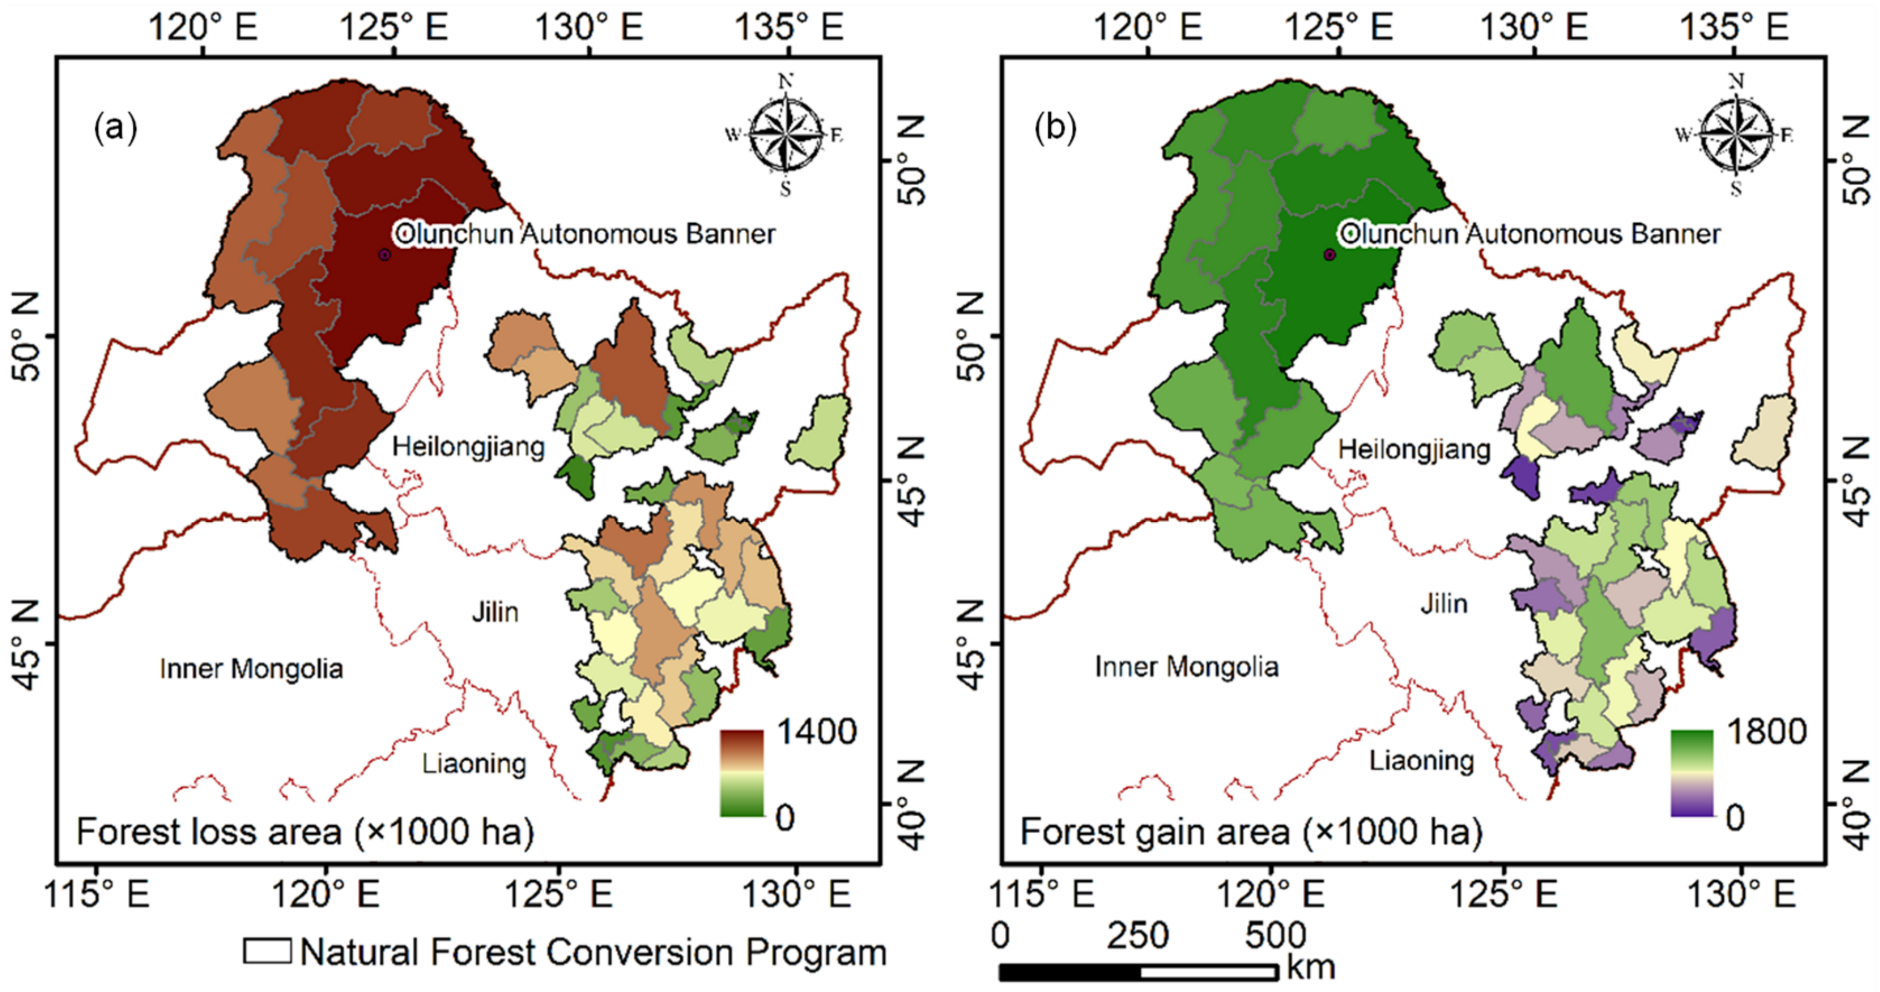
4.3. Forest Loss and Gain
5. Discussion
5.1. The Impact of Forest Protection Policies on Forest Change
5.2. Accurate Detection of Forest Change
5.3. Validation
6. Conclusions
Author Contributions
Funding
Data Availability Statement
Conflicts of Interest
References
- FAO. Global Forest Resources Assessment 2020; FAO: Rome, Italy, 2020; ISBN 978-92-5-132974-0. [Google Scholar]
- Griffiths, P.; Kuemmerle, T.; Baumann, M.; Radeloff, V.C.; Abrudan, I.V.; Lieskovsky, J.; Munteanu, C.; Ostapowicz, K.; Hostert, P. Forest Disturbances, Forest Recovery, and Changes in Forest Types across the Carpathian Ecoregion from 1985 to 2010 Based on Landsat Image Composites. Remote Sens. Environ. 2014, 151, 72–88. [Google Scholar] [CrossRef]
- Kautz, M.; Meddens, A.J.H.; Hall, R.J.; Arneth, A. Biotic Disturbances in Northern Hemisphere Forests—A Synthesis of Recent Data, Uncertainties and Implications for Forest Monitoring and Modelling: Biotic Disturbances in Northern Hemisphere Forests. Glob. Ecol. Biogeogr. 2017, 26, 533–552. [Google Scholar] [CrossRef]
- Westerling, A.L. Increasing Western US Forest Wildfire Activity: Sensitivity to Changes in the Timing of Spring. Philos. Trans. R. Soc. B Biol. Sci. 2016, 371, 20150178. [Google Scholar] [CrossRef] [PubMed]
- Allen, C.D.; Breshears, D.D.; McDowell, N.G. On Underestimation of Global Vulnerability to Tree Mortality and Forest Die-off from Hotter Drought in the Anthropocene. Ecosphere 2015, 6, art129. [Google Scholar] [CrossRef]
- Goldewijk, K.K. Estimating Global Land Use Change over the Past 300 Years: The HYDE Database. Glob. Biogeochem. Cycles 2001, 15, 417–433. [Google Scholar] [CrossRef]
- Turner, M.G.; Baker, W.L.; Peterson, C.J.; Peet, R.K. Factors Influencing Succession: Lessons from Large, Infrequent Natural Disturbances. Ecosystems 1998, 1, 511–523. [Google Scholar] [CrossRef]
- Seidl, R.; Thom, D.; Kautz, M.; Martin-Benito, D.; Peltoniemi, M.; Vacchiano, G.; Wild, J.; Ascoli, D.; Petr, M.; Honkaniemi, J.; et al. Forest Disturbances under Climate Change. Nat. Clim. Chang. 2017, 7, 395–402. [Google Scholar] [CrossRef]
- Nabuurs, G.-J.; Lindner, M.; Verkerk, P.J.; Gunia, K.; Deda, P.; Michalak, R.; Grassi, G. First Signs of Carbon Sink Saturation in European Forest Biomass. Nat. Clim. Chang. 2013, 3, 792–796. [Google Scholar] [CrossRef]
- Seidl, R.; Schelhaas, M.-J.; Rammer, W.; Verkerk, P.J. Increasing Forest Disturbances in Europe and Their Impact on Carbon Storage. Nat. Clim. Chang. 2014, 4, 806–810. [Google Scholar] [CrossRef]
- Masek, J.G.; Huang, C.; Wolfe, R.; Cohen, W.; Hall, F.; Kutler, J.; Nelson, P. North American Forest Disturbance Mapped from a Decadal Landsat Record. Remote Sens. Environ. 2008, 112, 2914–2926. [Google Scholar] [CrossRef]
- Dai, L.; Zhao, F.; Shao, G.; Zhou, L.; Tang, L. China’s Classification-Based Forest Management: Procedures, Problems, and Prospects. Environ. Manag. 2009, 43, 1162–1173. [Google Scholar] [CrossRef] [PubMed]
- Zhang, P.; Shao, G.; Zhao, G.; Le Master, D.C.; Parker, G.R.; Dunning, J.B., Jr.; Li, Q. China’s Forest Policy for the 21st Century. Science 2000, 288, 2135–2136. [Google Scholar] [CrossRef] [PubMed]
- Yang, H. China’s Natural Forest Protection Program: Progress and Impacts. For. Chron. 2017, 93, 113–117. [Google Scholar] [CrossRef][Green Version]
- Feng, M.; Li, X. Land Cover Mapping toward Finer Scales. Sci. Bull. 2020, 65, 1604–1606. [Google Scholar] [CrossRef]
- Wulder, M.A.; White, J.C.; Loveland, T.R.; Woodcock, C.E.; Belward, A.S.; Cohen, W.B.; Fosnight, E.A.; Shaw, J.; Masek, J.G.; Roy, D.P. The Global Landsat Archive: Status, Consolidation, and Direction. Remote Sens. Environ. 2016, 185, 271–283. [Google Scholar] [CrossRef]
- Wulder, M.A.; White, J.C.; Goward, S.N.; Masek, J.G.; Irons, J.R.; Herold, M.; Cohen, W.B.; Loveland, T.R.; Woodcock, C.E. Landsat Continuity: Issues and Opportunities for Land Cover Monitoring. Remote Sens. Environ. 2008, 112, 955–969. [Google Scholar] [CrossRef]
- Hansen, M.C.; Loveland, T.R. A Review of Large Area Monitoring of Land Cover Change Using Landsat Data. Remote Sens. Environ. 2012, 122, 66–74. [Google Scholar] [CrossRef]
- Vogelmann, J.E.; Xian, G.; Homer, C.; Tolk, B. Monitoring Gradual Ecosystem Change Using Landsat Time Series Analyses: Case Studies in Selected Forest and Rangeland Ecosystems. Remote Sens. Environ. 2012, 122, 92–105. [Google Scholar] [CrossRef]
- Hansen, M.C.; Stehman, S.V.; Potapov, P.V.; Fung, I.Y. Quantification of Global Gross Forest Cover Loss. Proc. Natl. Acad. Sci. USA 2010, 107, 8650–8655. [Google Scholar] [CrossRef]
- Hansen, M.C.; Potapov, P.V.; Moore, R.; Hancher, M.; Turubanova, S.A.; Tyukavina, A.; Thau, D.; Stehman, S.V.; Goetz, S.J.; Loveland, T.R.; et al. High-Resolution Global Maps of 21st-Century Forest Cover Change. Science 2013, 342, 850–853. [Google Scholar] [CrossRef]
- Song, X.-P.; Hansen, M.C.; Stehman, S.V.; Potapov, P.V.; Tyukavina, A.; Vermote, E.F.; Townshend, J.R. Global Land Change from 1982 to 2016. Nature 2018, 560, 639–643. [Google Scholar] [CrossRef] [PubMed]
- Ceccherini, G.; Duveiller, G.; Grassi, G.; Lemoine, G.; Avitabile, V.; Pilli, R.; Cescatti, A. Abrupt Increase in Harvested Forest Area over Europe after 2015. Nature 2020, 583, 72–77. [Google Scholar] [CrossRef]
- DeVries, B.; Verbesselt, J.; Kooistra, L.; Herold, M. Robust Monitoring of Small-Scale Forest Disturbances in a Tropical Montane Forest Using Landsat Time Series. Remote Sens. Environ. 2015, 161, 107–121. [Google Scholar] [CrossRef]
- Hamunyela, E.; Brandt, P.; Shirima, D.; Do, H.T.T.; Herold, M.; Roman-Cuesta, R.M. Space-Time Detection of Deforestation, Forest Degradation and Regeneration in Montane Forests of Eastern Tanzania. Int. J. Appl. Earth Obs. Geoinf. 2020, 88, 102063. [Google Scholar] [CrossRef]
- Hansen, M.C.; Townshend, J.R.G.; DeFries, R.S.; Carroll, M. Estimation of Tree Cover Using MODIS Data at Global, Continental and Regional/Local Scales. Int. J. Remote Sens. 2005, 26, 4359–4380. [Google Scholar] [CrossRef]
- DiMiceli, C.; Townshend, J.; Carroll, M.; Sohlberg, R. Evolution of the Representation of Global Vegetation by Vegetation Continuous Fields. Remote Sens. Environ. 2021, 254, 112271. [Google Scholar] [CrossRef]
- Townshend, J.R.G.; Justice, C.O. Selecting the Spatial Resolution of Satellite Sensors Required for Global Monitoring of Land Transformations. Int. J. Remote Sens. 1988, 9, 187–236. [Google Scholar] [CrossRef]
- Sexton, J.O.; Song, X.-P.; Feng, M.; Noojipady, P.; Anand, A.; Huang, C.; Kim, D.-H.; Collins, K.M.; Channan, S.; DiMiceli, C.; et al. Global, 30-m Resolution Continuous Fields of Tree Cover: Landsat-Based Rescaling of MODIS Vegetation Continuous Fields with Lidar-Based Estimates of Error. Int. J. Digit. Earth 2013, 6, 427–448. [Google Scholar] [CrossRef]
- Feng, M.; Sexton, J.O.; Huang, C.; Anand, A.; Channan, S.; Song, X.-P.; Song, D.-X.; Kim, D.-H.; Noojipady, P.; Townshend, J.R. Earth Science Data Records of Global Forest Cover and Change: Assessment of Accuracy in 1990, 2000, and 2005 Epochs. Remote Sens. Environ. 2016, 184, 73–85. [Google Scholar] [CrossRef]
- Liang, L.; Li, L.; Liu, Q. Precipitation Variability in Northeast China from 1961 to 2008. J. Hydrol. 2011, 404, 67–76. [Google Scholar] [CrossRef]
- Huang, L.; Wang, B.; Niu, X.; Gao, P.; Song, Q. Changes in Ecosystem Services and an Analysis of Driving Factors for China’s Natural Forest Conservation Program. Ecol. Evol. 2019, 9, 3700–3716. [Google Scholar] [CrossRef]
- Xiao, X.; Boles, S.; Liu, J.; Zhuang, D.; Liu, M. Characterization of Forest Types in Northeastern China, Using Multi-Temporal SPOT-4 VEGETATION Sensor Data. Remote Sens. Environ. 2002, 82, 335–348. [Google Scholar] [CrossRef]
- Tang, H.; Armston, J. GEDI L2B Footprint Canopy Cover and Vertical Profile Metrics. 39. Available online: https://lpdaac.usgs.gov/documents/588/GEDI_FCCVPM_ATBD_v1.0.pdf (accessed on 1 October 2021).
- Neuenschwander, A.; Pitts, K. The ATL08 Land and Vegetation Product for the ICESat-2 Mission. Remote Sens. Environ. 2019, 221, 247–259. [Google Scholar] [CrossRef]
- Sexton, J.O.; Noojipady, P.; Anand, A.; Song, X.-P.; McMahon, S.; Huang, C.; Feng, M.; Channan, S.; Townshend, J.R. A Model for the Propagation of Uncertainty from Continuous Estimates of Tree Cover to Categorical Forest Cover and Change. Remote Sens. Environ. 2015, 156, 418–425. [Google Scholar] [CrossRef]
- Brovelli, M.; Molinari, M.; Hussein, E.; Chen, J.; Li, R. The First Comprehensive Accuracy Assessment of GlobeLand30 at a National Level: Methodology and Results. Remote Sens. 2015, 7, 4191–4212. [Google Scholar] [CrossRef]
- Sexton, J.O.; Urban, D.L.; Donohue, M.J.; Song, C. Long-Term Land Cover Dynamics by Multi-Temporal Classification across the Landsat-5 Record. Remote Sens. Environ. 2013, 128, 246–258. [Google Scholar] [CrossRef]
- Sexton, J.O.; Noojipady, P.; Song, X.-P.; Feng, M.; Song, D.-X.; Kim, D.-H.; Anand, A.; Huang, C.; Channan, S.; Pimm, S.L.; et al. Conservation Policy and the Measurement of Forests. Nat. Clim. Chang. 2016, 6, 192–196. [Google Scholar] [CrossRef]
- Yu, D.; Zhou, L.; Zhou, W.; Ding, H.; Wang, Q.; Wang, Y.; Wu, X.; Dai, L. Forest Management in Northeast China: History, Problems, and Challenges. Environ. Manag. 2011, 48, 1122–1135. [Google Scholar] [CrossRef]
- Curtis, P.G.; Slay, C.M.; Harris, N.L.; Tyukavina, A.; Hansen, M.C. Classifying Drivers of Global Forest Loss. Science 2018, 361, 1108–1111. [Google Scholar] [CrossRef]
- Ji, L.; Wang, Z.; Wang, X.; An, L. Forest Insect Pest Management and Forest Management in China: An Overview. Environ. Manag. 2011, 48, 1107–1121. [Google Scholar] [CrossRef]
- Yi, K.; Bao, Y. Estimates of Wildfire Emissions in Boreal Forests of China. Forests 2016, 7, 158. [Google Scholar] [CrossRef]
- Milodowski, D.T.; Mitchard, E.T.A.; Williams, M. Forest Loss Maps from Regional Satellite Monitoring Systematically Underestimate Deforestation in Two Rapidly Changing Parts of the Amazon. Environ. Res. Lett. 2017, 12, 094003. [Google Scholar] [CrossRef]
- Tropek, R.; Sedláček, O.; Beck, J.; Keil, P.; Musilová, Z.; Šímová, I.; Storch, D. Comment on “High-Resolution Global Maps of 21st-Century Forest Cover Change”. Science 2014, 344, 981. [Google Scholar] [CrossRef] [PubMed]
- Brandt, M.; Tucker, C.J.; Kariryaa, A.; Rasmussen, K.; Abel, C.; Small, J.; Chave, J.; Rasmussen, L.V.; Hiernaux, P.; Diouf, A.A.; et al. An Unexpectedly Large Count of Trees in the West African Sahara and Sahel. Nature 2020, 587, 78–82. [Google Scholar] [CrossRef]


| Accuracy Index | Forest Loss (%) | Forest Gain (%) |
|---|---|---|
| Overall accuracy | 94.92 | 94.13 |
| Producer’s accuracy | 85.21 | 87.74 |
| User’s accuracy | 84.26 | 88.31 |
| Period (Year) | Forest Loss Area (×1000 ha) | Forest Gain Area (×1000 ha) | ||
|---|---|---|---|---|
| Total | Annual Average | Total | Annual Average | |
| 1986–1997 | 2894.02 | 241.17 | 3646.38 | 303.87 |
| 1998–2018 | 5030.43 | 239.54 | 7590.93 | 361.47 |
| 1986–2018 | 7924.45 | 240.13 | 11,237.31 | 340.52 |
Publisher’s Note: MDPI stays neutral with regard to jurisdictional claims in published maps and institutional affiliations. |
© 2022 by the authors. Licensee MDPI, Basel, Switzerland. This article is an open access article distributed under the terms and conditions of the Creative Commons Attribution (CC BY) license (https://creativecommons.org/licenses/by/4.0/).
Share and Cite
Wang, J.; He, Z.; Wang, C.; Feng, M.; Pang, Y.; Yu, T.; Li, X. Investigation of Long-Term Forest Dynamics in Protected Areas of Northeast China Using Landsat Data. Remote Sens. 2022, 14, 2988. https://doi.org/10.3390/rs14132988
Wang J, He Z, Wang C, Feng M, Pang Y, Yu T, Li X. Investigation of Long-Term Forest Dynamics in Protected Areas of Northeast China Using Landsat Data. Remote Sensing. 2022; 14(13):2988. https://doi.org/10.3390/rs14132988
Chicago/Turabian StyleWang, Jianbang, Zhuoyu He, Chunling Wang, Min Feng, Yong Pang, Tao Yu, and Xin Li. 2022. "Investigation of Long-Term Forest Dynamics in Protected Areas of Northeast China Using Landsat Data" Remote Sensing 14, no. 13: 2988. https://doi.org/10.3390/rs14132988
APA StyleWang, J., He, Z., Wang, C., Feng, M., Pang, Y., Yu, T., & Li, X. (2022). Investigation of Long-Term Forest Dynamics in Protected Areas of Northeast China Using Landsat Data. Remote Sensing, 14(13), 2988. https://doi.org/10.3390/rs14132988