Next Article in Journal
Coastal Erosion and Flooding Threaten Low-Lying Coastal Tracts at Lipari (Aeolian Islands, Italy)
Next Article in Special Issue
Linkage of Strong Intraseasonal Events of the East Asian Winter Monsoon to the Tropical Convections over the Western Pacific
Previous Article in Journal
Remote-Sensing Monitoring of Postfire Vegetation Dynamics in the Greater Hinggan Mountain Range Based on Long Time-Series Data: Analysis of the Effects of Six Topographic and Climatic Factors
Previous Article in Special Issue
The Impact of Central Heating on the Urban Thermal Environment Based on Multi-Temporal Remote Sensing Images
 
 
Correction published on 8 June 2023, see Remote Sens. 2023, 15(12), 3003.
Article

Increased Compound Droughts and Heatwaves in a Double Pack in Central Asia

1
State Key Laboratory of Desert and Oasis Ecology, Xinjiang Institute of Ecology and Geography, Chinese Academy of Sciences, Urumqi 830011, China
2
University of Chinese Academy of Sciences, Beijing 100049, China
3
College of Geography and Remote Sensing Sciences, Xinjiang University, Urumqi 830046, China
*
Author to whom correspondence should be addressed.
Remote Sens. 2022, 14(13), 2959; https://doi.org/10.3390/rs14132959
Submission received: 3 May 2022 / Revised: 18 June 2022 / Accepted: 19 June 2022 / Published: 21 June 2022 / Corrected: 8 June 2023

Abstract

:
Compound droughts and heatwaves (CDHWs) are likely to cause more severe natural disasters than a single extreme event, and they have been exacerbated by rapid global warming. Based on high-resolution grid data, this study combines the daily-scale ERA5-Land dataset and the monthly-scale SPEI dataset with multiple indicators to analyze CDHWs. We calculated and analyzed the temporal and spatial modal distribution of CDHWs in Central Asia from 1981 to 2018, and in this paper, we discuss the sequence relationship between drought events, heatwave events, and CDHWs. The results show that the number of CDHWs in the study region have increased over time and expanded in terms of area, especially in eastern and southwestern Central Asia. The tsum (total frequency of CDHWs) was 0.5 times higher than the total heatwave frequency and it increased at a rate of 0.17/yr. The maximum duration of tmax (maximum duration of CDHWs in days) was 17 days. Furthermore, the occurrence rate of tmax was 96.67%, and the AH (CDHWs’ accumulated heat) had a rate of 97.78%, which, upon examination of the spatial trend pattern, accounted for the largest increase in terms of area. We also found that the TAH (CDHWs’ average temperature anomalies, SPEI < −0.5) shows obvious seasonality, with the increases in winter and spring being significantly greater than the increases in summer and autumn. The intensity of the CDHWs was stronger than that of a single extreme event, the temperature anomaly was higher than the average of 0.4–0.8 °C, and there was a north–south spatial pattern across the study region. In eastern and northwestern Central Asia, the AH and heatwaves (SPEI < −0.5) increased by 15–30 times per year on average. During the transition from the base period to the reference period, CDHWs increased by 25%, and the number of dry days prior to the CDHWs decreased by 7.35 days. The conclusion of our study can provide a theoretical basis for coping with climate change in arid zones.

Graphical Abstract

1. Introduction

The Sixth Scientific Assessment Report, issued by the Intergovernmental Panel on Climate Change (IPCC), notes that global climate change, caused by human activities and extreme weather and climate events, and the resultant sustained warming that has ensued in various locations, will cause more frequent and serious extreme events [1]. Compound events are generally more threatening to humans and the ecological environment than a single climate event [2,3]. In particular, compound droughts and heatwaves (CDHWs) have attracted increased attention in recent years [4,5,6,7], due to the significant impact that they can have upon society and the environment [8,9,10]. Global warming has exacerbated the occurrence of drought and heatwave events [11], especially in North America, Asia, Europe, and Australia. The findings of several recent studies have shown that the frequency and severity of CDHWs are increasing [12,13,14,15]. Moreover, the results indicate that the precipitation trend is the main influencing factor regulating the increase of CDHWs on land, thus highlighting the importance of monitoring regional precipitation trends [16]. In one study, the influence of multiple variables on drought, heatwave, and windy composite events was investigated using the Copula function, and the results indicated a need to determine all influencing factors within each composite event [17]. More recently, a comprehensive study of drought, heatwave, and wildfire events was conducted. The findings indicated that areas of drought, and areas with frequent heatwave complex events, are more prone to wildfire events, which is essential for understanding the interactions between wildfires and weather conditions [18]. Other studies demonstrate the diversity of composite event combinations, and their wider social and ecological impacts, by studying how floods affect the productivity and carbon cycles of arid/semi-arid grasslands when they occur during a drought [19]. High temperatures accelerate soil evaporation [6], and they increase the loss of soil and plant moisture, which, in turn, worsens droughts [20]. Moreover, a sustained level of heat can lead to heatwaves, thus posing a great threat to ecology, the economy, and overall human health. As the interactions between high temperatures and droughts can lead to the worsening of a disaster, it is crucial to quantitatively assess the frequency of occurrence and scope of these extreme complex events [21].
A high-temperature heatwave is defined as weather that is characterized by an unusually high temperature that lasts for several days. Due to geographical and socio-economic differences, the methods used to study high-temperature heatwaves vary around the world and there is no uniform standard [22]. Heatwaves are typically identified by using the relative threshold and absolute threshold methods, and they are defined by their absolute temperature and percentile [9,23]. Anomalies that occur in absolute and mean temperatures may lead to a broad range of social and environmental impacts [24,25]; however, given the regional differences in heatwave patterns and observations, as well as the need to compare heatwave trends in various regions around the world, an approach that takes a number of different factors into consideration would be useful for research purposes. The percentile threshold method facilitates comparisons across regions and at different times, and it has good utility in large regional comprehensive assessments [26,27]. This strategy for heatwave assessment is applied according to the three aspects of frequency, intensity, and duration. On this basis, the present paper considers the accumulated heat and average temperature anomaly of a given heatwave day, and it explores the characteristics of a heatwave in Central Asia using five dimensions.
The current tendency in arid zones is to become more arid [28]. Increasing aridity is especially prominent in developing countries, with significant arid trends recently emerging in Africa and Eurasia [29]. Asia is home to one of the world’s largest non-zonal arid zones [30], which is located in a region that is both a climate change sensitive zone and a highly vulnerable global water resource system and ecosystem [31]. In light of global warming, extreme weather events in arid regions of Central Asia are receiving increasing attention [32,33,34,35], largely due to the region’s role as the economic hub of the Silk Road. Moreover, with an oasis economy as the mainstay, a fragile desert ecosystem is more susceptible to extreme events [33,36]. An in-depth understanding of the characteristics of climate change in Central Asia’s arid regions would provide a scientific basis for disaster prevention and mitigation, as well as for an active response to climate change [37].
To that end, the current paper investigates CDHWs in relation to AH (CDHWs’ accumulated heat) and TAH (CDHWs’ average temperature anomalies on heatwave days, SPEI < −0.5). These measures are applied to evaluate composite events, using the extreme drought and heatwave composite events in Central Asia from 1981 to 2018 as a starting point. The evolution of compound events are then analyzed, with a view to improve the ability of arid areas to cope with climate change.

2. Materials and Methods

2.1. Study Area

Central Asia is traditionally made up of five countries (Kazakhstan, Uzbekistan, Kyrgyzstan, Tajikistan, and Turkmenistan), though in a broader sense, Central Asia also includes arid northwest China (Figure 1) [38]. The Chinese component of the region is located at 46°–107°E and 34°–56°N, which is deep in the hinterland of Eurasia, and is far away from any ocean. Climatically, all of Central Asia is classified as being temperate continental, which means that it is characterized by perennial drought, little rain, and robust evaporation. The region also has a landform pattern of alternating mountains and basins, with the precipitation in the mountainous areas being greater than that in basins. Its vegetation is dominated by desert and grassland, and its ecosystem is fragile [30].

2.2. Data Sources

2.2.1. ERA5-Land Hourly Data

We used the fifth-generation European reanalysis (ERA5-Land) dataset to obtain hourly atmospheric data (https://cds.climate.copernicus.eu/#!/home, accessed on 1 October 2021). ERA5-Land has a resolution of 0.1° × 0.1°, though its original resolution was 9 km. This dataset provides data from the last 70 years, using the laws of physics to combine model data with observations from around the world in order to produce a globally complete and consistent dataset. The data are generated by replacing the terrestrial portion of the European Centre for Medium-Range Weather Forecasts (ECMWF) data [39]. ERA5 can easily replace other reanalysis products with high temporal and spatial resolutions [26]. In the present study, we used ERA5-Land to interpolate data from the study area in order to match the resolution of the Standardized Precipitation Evapotranspiration Index (SPEI) data. In addition, we resampled the hourly temperature data into a daily scale in order to extract the daily maximum temperature, and to adjust the spatial resolution of ERA5-Land from 0.1° to 0.5° by bilinear interpolation.

2.2.2. SPEI Data

The global Standardized Precipitation Evapotranspiration Index (SPEI) dataset (https://spei.csic.es/spei_database/, accessed on 1 October 2021) has a 0.5° spatial resolution and a monthly time resolution. The SPEI provides long-term, reliable information concerning drought conditions on a global scale, and it uses time scales ranging from 1 to 48 months. Currently, the dataset covers the period between January 1901 and December 2018.The temperature is used to calculate evapotranspiration using Thornthwaite’s method. This index is calculated by using precipitation and air temperature data to characterize the dry and wet states. As it considers more parameters than the Standardized Precipitation Index (SPI), it is more developed than the SPI, and it also notes the effects of evapotranspiration. It is more applicable in areas with significant temperature changes (such as medium subarid regions), and thus it is especially suitable for long-term studies. We chose SPEI data using a three-month scale, because it characterizes the effects of seasonal drought well. Moreover, as the length of time increases, the SPEI becomes more stable, and the duration of the dry and wet states increases [40,41].

2.2.3. Other Data

Data concerning rivers, lakes, and boundaries are derived from the Natural Earth dataset (https://www.naturalearthdata.com/, accessed on 1 October 2021). Natural Earth was built from a collaboration between many volunteers, it is supported by the NACIS (North American Cartographic Information Society), and it is free for use in any type of project. The land use data comes from (https://data.tpdc.ac.cn/, accessed on 1 October 2021). This type of land cover project is part of the second stage of ESA’s Climate Change Initiative, and it has a spatial resolution of 300 m. Elevation data comes from (https://earthexplorer.usgs.gov/, accessed on 1 October 2021).

2.3. Methods

2.3.1. Evaluation of Heatwave Events and Drought Events

We used the percentile threshold method, along with the daily maximum temperature, to define the heatwave occurrence as a daily maximum temperature that exceeds the 90% threshold for at least three consecutive days (Figure 2a) [42]. The 90% threshold was calculated using 38 samples, which provided a daily maximum temperature from 1979 to 2018 [23,43]. For example, the daily maximum temperature on January 1, during the time period studied, is defined as the threshold of that particular day. There are 365 thresholds for each grid point in the study area to compare with the daily maximum temperature in the studied period. In order to make the threshold results more robust, we adopted a three-day moving window algorithm, with 120 samples taken from December 31, January 1, and January 2 of the previous year; these samples were also taken from the time period that is being studied and used for the threshold calculation [24]. As can be seen from the distribution of threshold values (Figure 2b), the uneven solar radiation readings are caused by differences in latitude. As one moves from lower to higher latitudes, the threshold values gradually increase. The maximum threshold value is about 35 °C and the minimum threshold value is about 15 °C, giving a latitude-affected threshold difference of around 20 °C. From a longitudinal perspective, however, the differences in threshold distribution are relatively small. Overall, the threshold distribution is consistent, concentrated at around 25 °C, and is mainly affected by topography.
To quantify the different types of heatwaves, we selected eight characteristic indicators. The main indicators are frequency, intensity, maximum duration, annual accumulated heat, and average temperature anomalies on heatwave days. We found that heatwave frequency could be divided into weak, medium, and strong high-temperature heatwaves. More specifically, if a heatwave had a threshold that was greater than 90% for three consecutive days, but less than five days, we defined this event as a weak high-temperature heatwave. If a heatwave had a threshold that was greater than 90% for five consecutive days, but less than seven days, we defined this event as a medium high-temperature heatwave. However, if a heatwave had a threshold that was greater than 90% for seven consecutive days or more, we defined this event as a strong high-temperature heatwave. Intensity is defined as the average intensity across all heatwave days, and maximum duration is defined as the maximum duration of the heatwave. Accumulated heat describes the additional heat generated by a heatwave during a given time (e.g., a given month) in terms of the sum of outliers between each heatwave day and the 90% threshold for that month [42]. In order to better compile statistics on the temporal and spatial variation characteristics of accumulated heat, we converted monthly accumulated heat into annual accumulated heat using maximum synthesis, as defined below:
Heat Y cum = 1 n T anom
Heat Y cum represents the accumulated heat in a year, n represents the number of all heatwave days in a year, and T anom represents the temperature anomaly between all heatwave days in a year and the heatwave threshold.
The mean temperature anomalies of heatwave days were defined as (monthly accumulated heatwave days)/(monthly total number of heatwave days). In this study, the mean temperature anomalies of heatwave days were calculated on an annual scale in the study area to determine whether there was a significant change in heatwave accumulation on an interannual scale between all heatwave days and the heatwave threshold in a year:
Avg anom = Heat Ycum HWF
In this formulation, Avg anom is the average temperature anomaly for all heatwave days in a year, and HWF represents the total number of heatwaves in a year.
Drought was assessed using SPEI, with the drought threshold set as SPEI < −0.5. Anything exceeding this threshold was defined as a drought state (Figure 2a).

2.3.2. Evaluation of Heatwave–Drought Compounds

Compound droughts and heatwaves are heatwaves that occur under drought conditions [26], and multiple heatwave events in a drought are referred to as multiple CDHWs [24]. Figure 2c illustrates the intensity and duration of CDHWs. Since drought indicators are based on monthly scales, heatwave indicators for the entire studied time period should be calculated first, followed by a calculation of monthly heatwave indicators that correspond with drought. Our assessment of CDHWs follows the criteria used for heatwaves, as long as CDHWs are defined as being above the drought threshold. To assess the severity of CDHWs, we compared the frequency, intensity, maximum duration, accumulated annual heat, and mean temperature on heatwave days during a drought. The CDHW indexes are further explained below. CDHW frequency is categorized as t3 (weak frequency CDHWs), t5 (medium frequency CDHWs), t7 (strong frequency CDHWs), and tsum (total number of heatwaves that occur under all drought conditions). CDHW intensity is categorized as tmean, with intensity defined as the mean intensity of all heatwave events under drought conditions. CDHW duration is categorized as tmax (maximum duration of heatwaves in days under drought conditions) and AH (CDHWs’ accumulated heat) is categorized as being the extra heat generated under drought conditions. TAH (CDHWs’ temperature anomalies on heatwave days, SPEI < −0.5) is categorized as being the average temperature anomalies of regional heatwave days in a drought state (accumulated heat/total days of heatwave) to determine whether there is a significant change in AH during a drought state.

2.3.3. Statistical Methods

Empirical orthogonal function (EOF) analysis involves decomposing time-varying variable fields into time-invariant spatial functions and time-dependent functions. The spatio-temporal dataset is then simplified, as it is transformed into spatial modes of physical quantities and associated time projections (time series) [44]. These spatial modes are EOFs, and they can be thought of as basic functions (a set of basic vectors in a space) which correspond with the variances. The relevant time projection is the principal component (PC) and is the time coefficient of the EOFs. Raw data can be reconstructed by using EOFs and PCs. EOFs can be used to better explore the main information and potential trends of composite indicators. EOFs have been widely used in the analysis of temporal and spatial changes in meteorological and hydrological elements, and it is a common statistical method to study and analyze the state of the climate in a typical region. EOFs are able to capture the main features and highlight the hidden trends of TAH and SPEI [45]. In this paper, EOFs are used to capture the time and space modes of composite indicators.
The Mann–Kendall test and the Theil–Sen slope calculation are nonparametric trend tests that do not assume the normal distribution of data and are insensitive to outliers. The Thiel–Sen slope estimator is a statistical method used to estimate trend rates. It is a nonparametric test that can be used for non-normal data. In this study, the Mann–Kendall trend test, combined with the Thiel–Sen slope estimation, is used to estimate trend rates and their significance in a time series [46]. Spatial trend is one of the most commonly used research methods in the field of meteorology and climate studies. Spatial distribution differences between different regions can be seen from space, and significant changes in different regions can be seen through significance tests. This approach also makes it easier to understand the impact of climate warming on composite events.

3. Results

3.1. Spatio-Temporal Variations of Compound Events in Central Asia

By analyzing the maximum duration of the CDHWs’ tmax (Figure 3a) and the temperature anomalies in TAH (Figure 3b), it is evident that both of these values increase substantially each year, and they are accompanied by fluctuations in regional (high) temperatures [36]. Furthermore, both tmax and TAH show significant shifts around 1997. tmax occurred twice in all months, for a maximum duration of 17 days. From 1981 to 2018, the monthly CDHW rate was 96.67%, with CDHWs occurring nearly every month. The incidence of tmax showed no major differences across seasons, but there was a notable increase in interannual variation. The maximum TAH reached 8 °C in January 2007, and the minimum TAH was about 0.1 °C; however, TAH was greatly influenced by seasons, as the increases in TAH during winter and spring were greater than those in summer and autumn. We defined temperature anomalies of more than six CDHWs in a month as being an extreme compound event. Prior to 1994, there were only a few temperature anomalies in terms of CDHWs (around 6 °C over 3 months); however, after 1994, the temperature anomalies of extreme CDHWs showed greater interannual variation, whereas the temperature anomalies with seasonal variation were less obvious.
The frequency changes of CDHWs showed clear increasing trends (Figure 4a–d). Moreover, t3 had the largest growth rate, at an average of 0.038 event/yr. In addition, t3 had the highest occurrence frequency, with an average of 1.2 times per year, which is 0.5 times that of heatwaves. It reached a maximum value in 2008 and a minimum value in 1996. The average occurrence frequency of t5 was 0.41 times per year, and the rate at which it increased was by 0.016 event/yr. In contrast, t7 had the lowest occurrence frequency and the slowest growth rate compared with t5 and t3, with an average frequency of 0.14. As illustrated in Figure 4d, tsum is the sum of the frequency of heatwaves under all drought conditions. The average frequency of tsum was 4.8 event/yr, and it increased at an average rate of 0.17 times per year. The filled area of the diagram illustrates that the total frequency of heatwaves per year was about twice that of CDHWs, and that heatwave events had a tendency to become a CDHW. Figure 4e presents tmean as the intensity of CDHWs, with an annual growth rate of 0.002 event/yr. As shown in the figure, the intensity of tmean increases as the interannual scale progresses. The three years with the strongest intensities were 2001, 2008 and 2017, and the average intensity of heatwaves was 0.06 event/yr. The intensity of composite events was not significantly different from that of heatwave events. The maximum duration of CDHWs and tmax increased steadily (Figure 4f), with an interannual growth rate of 0.083 days/yr and an average duration of 2.9 days. The maximum duration of a CDHW occurred in 2007 and 2017 and lasted about 4 days, whereas the minimum duration of a CDHW occurred in 1986 and lasted about 1.6 days, and the tmax increased by 2.4 days. For AH, the increasing trend is more obvious (Figure 4g), with an interannual increase of 0.47 °C. AH shows a higher growth trend after 2004, with an average value of 13.4 °C. The maximum temperature (about 34 °C) occurred in 2008. Moreover, drought had a great influence on AH. The interannual growth rate of TAH was about 0.008 °C/yr (Figure 4h), and the maximum value of TAH occurred in 2003, at about 1.9 °C/yr. Overall, the interannual increase rate was relatively gentle, though TAH had an influence on mean temperature anomalies in Central Asia.
The spatial trend of each index of composite events in Central Asia is shown in Figure 5a–h. As is evident, the increase in the frequency of t3 was the highest in the eastern and southwestern parts of the region, reaching 0.21 event/yr, and passing the significance test. Only in the central area did t3 show a decreasing trend. Compared with t5 and t7, t3 has the same spatial distribution and the highest increasing rate of successive trend decreases, at 0.1 event/yr and 0.075 event/yr, respectively. For the entire Central Asian region, tsum represents the spatial trend of frequency, thus indicating that the distribution of tsum and t3 is similar; therefore, it can be inferred that t3 is the main frequency type of tsum, and that it follows a trend of becoming stronger interannually, with 1.05 event/yr being the highest frequency trend reported in Central Asia. Although the spatial trends of the tmean and tmax were not obvious, an increasing trend was observed in a few parts of the southeastern, central, and western regions, and the overall intensity of the tmean and duration tmax of the entire region continued to increase. The accumulated heatwave spatial trend in Central Asia had a comparative relationship with the total frequency tsum of CDHWs, with the AH reaching 2.4 °C in most areas of southwestern China, and 1.2 °C to 1.6 °C in southeastern China. In the central area, the AH slightly decreased, with the maximum decreasing trend hitting 0.4 °C. Moreover, the TAH was similar to the tmean and tmax, but the spatial trend was not obvious. The mean temperature anomalies in the central and southeastern regions of Central Asia had a great influence on only a small part of the land. As shown in Figure 5i, the trend increases for the five indexes all exceed 90% of the region. The area affected by AH increased, and it accounts for the largest proportion of affected land (up to 97.78%), whereas the area affected by t7 also increased, but it accounts for the smallest proportion of affected land (91.4%). From these statistics, we can clearly see that the increased occurrence of extreme CDHWs in Central Asia is not only obvious, but there is an indication that they will only continue to become more frequent.

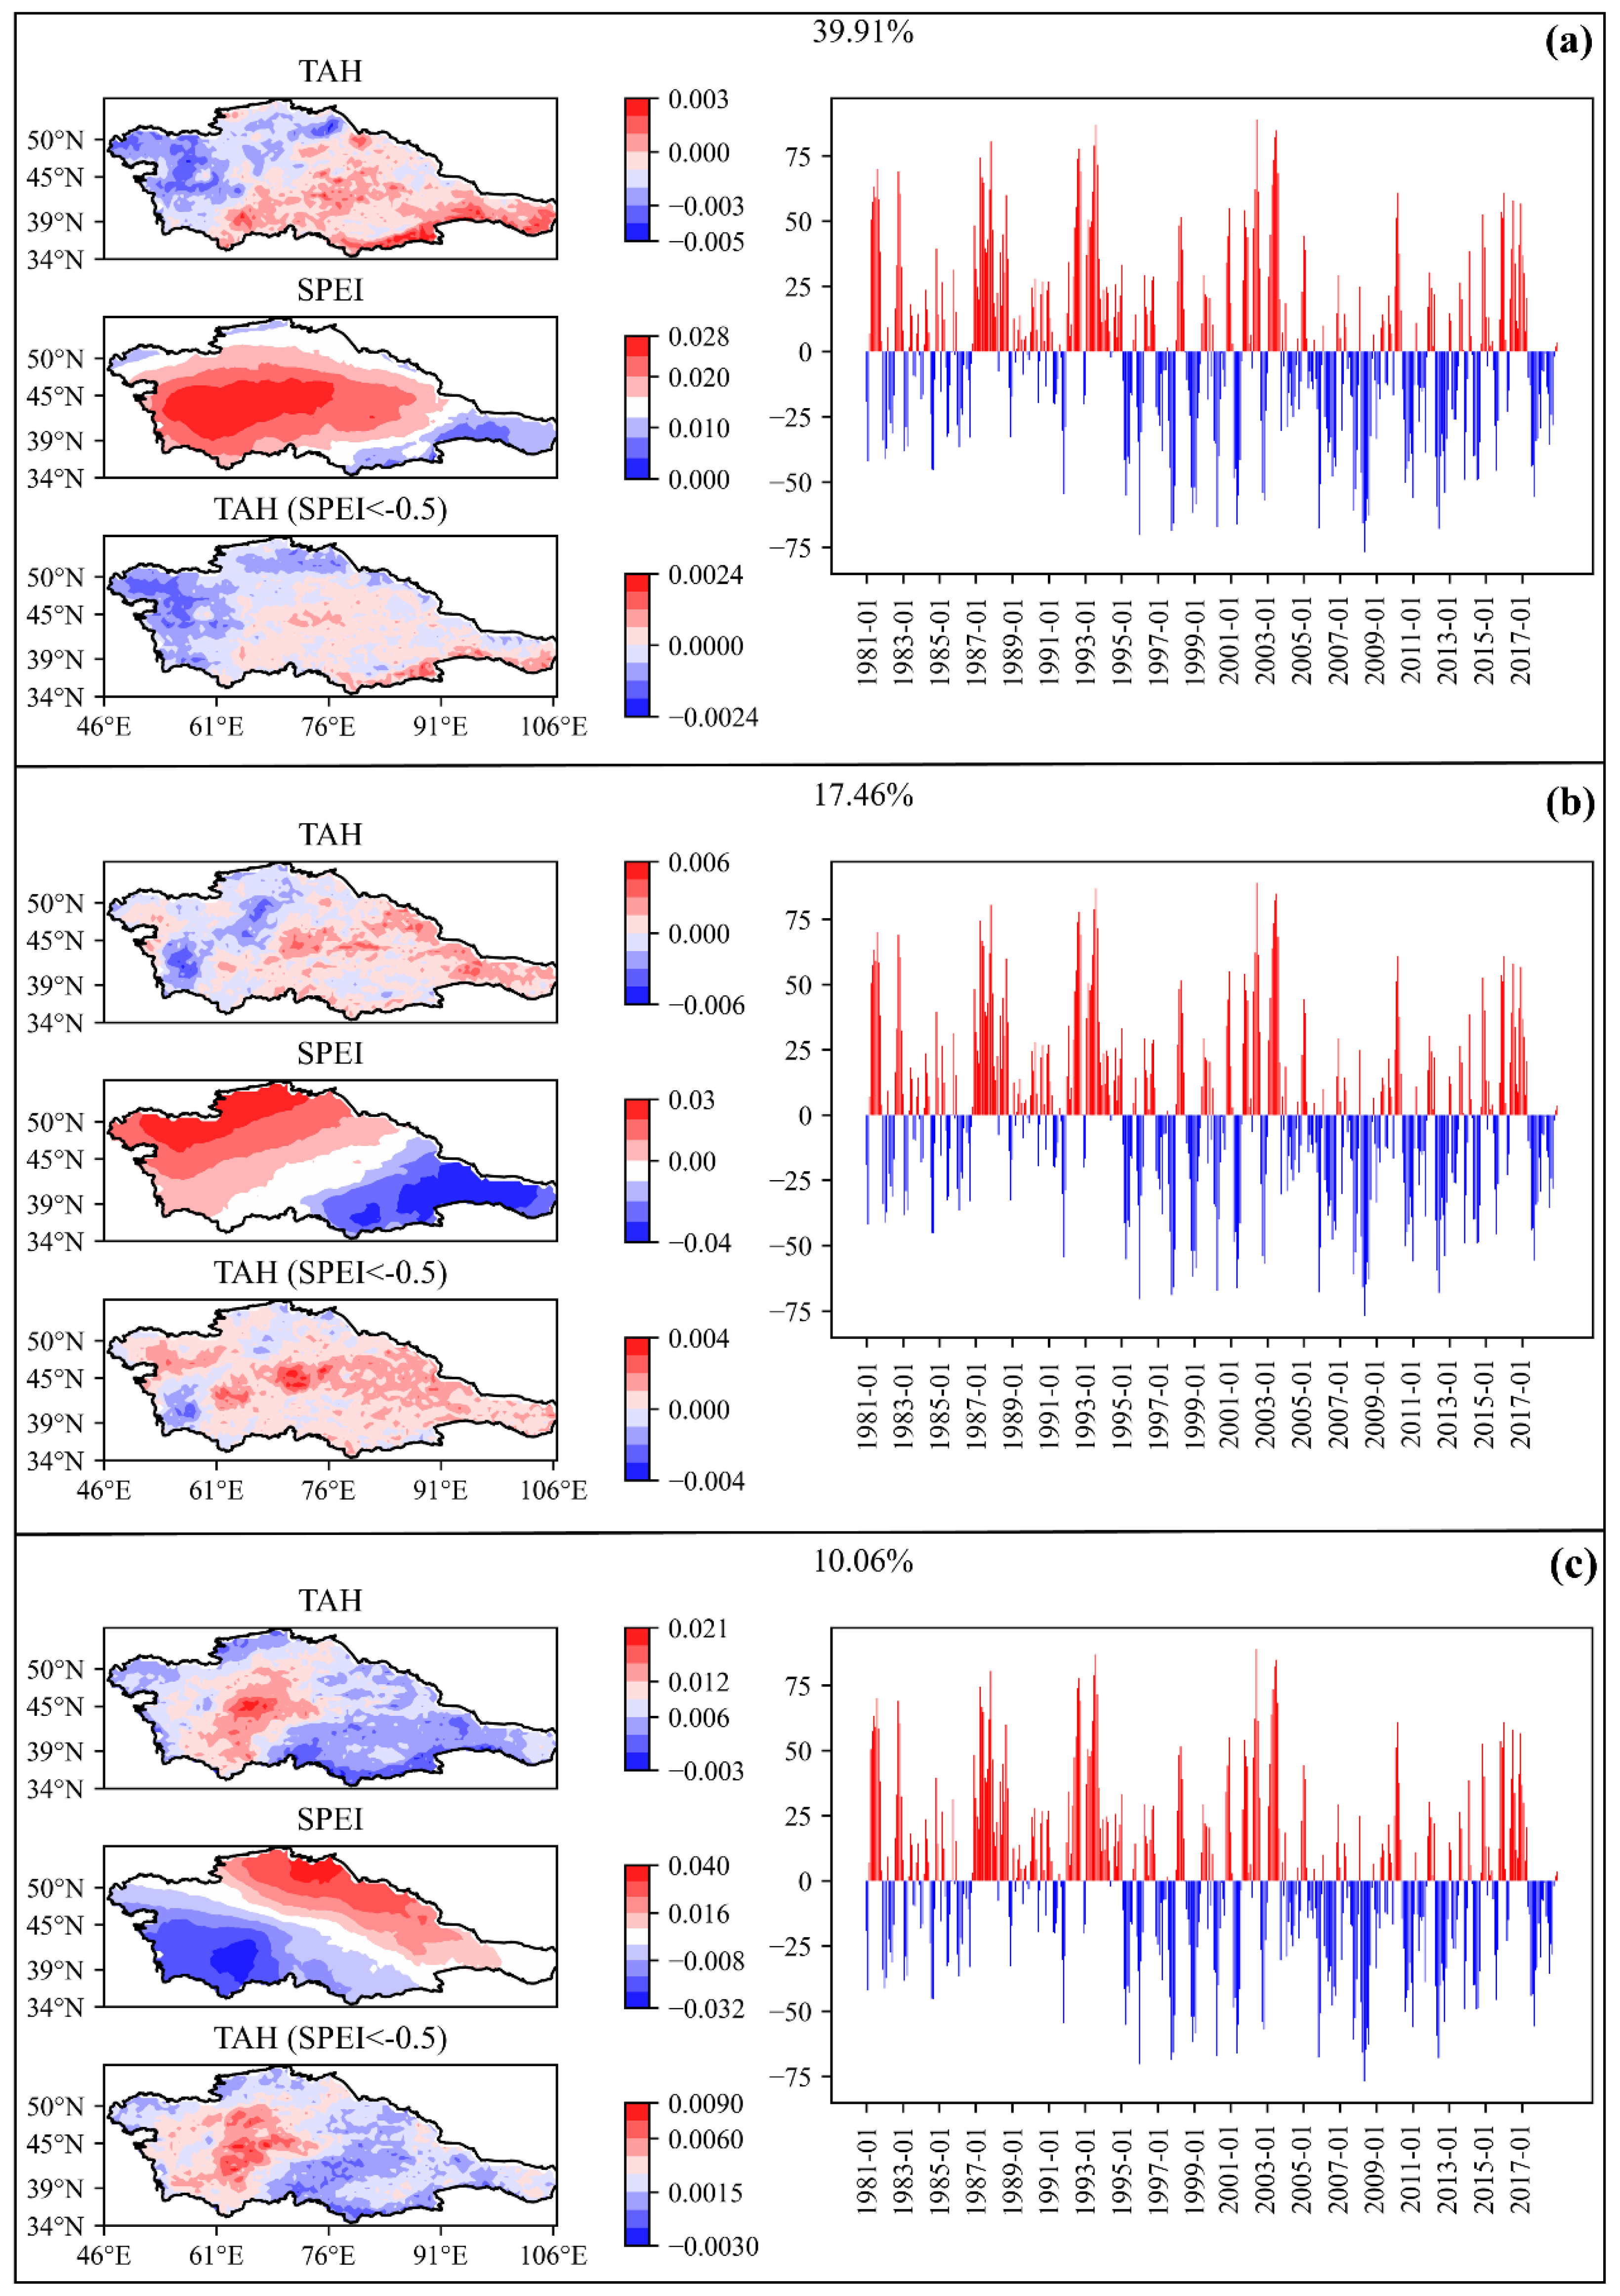
3.2. Modal Analysis of Compound Events in Central Asia

Spatial modalities can indicate the coefficients of multiple indicators across an entire space field, whereas the time coefficient can analyze the weight of the corresponding space contribution at a certain time. We first normalized TAH, SPEI, and TAH(SPEI < −0.5), and then we performed multivariate EOF analysis for the sequence. Our results showed that the accumulated variance contribution rate of the first three feature vectors of the EOF analysis was as high as 67.43%. The first three modes basically reflected the Central Asian AH, SPEI, and TAH(SPEI < −0.5).
The variance contribution rate of the first mode, EOF1, which is the main mode, was as high as 39.91% (Figure 6a). The proportion of areas with a TAH vector mean > 0 is smaller than those with a vector mean < 0. The areas with TAH > 0 are mainly distributed at the southeastern edge and within the central portion of Central Asia, and a negative value of TAH appears in the northwestern part of the study region, indicating that the incidence of TAH is low in this mode. In general, TAH is high in the east and low in the west. The mean values of the drought condition vectors of the first mode are all > 0, which reflects the consistent frequency variations of SPEI in Central Asia, and the high frequencies are concentrated in most areas of southwestern China. TAH(SPEI < −0.5) is greater than TAH, and the east–west differentiation pattern is more obvious, indicating that TAH(SPEI < −0.5) is influenced by the complementary effects of TAH and SPEI. For example, TAH occurred less frequently in most of the arid regions in the central region, whereas TAH(SPEI < −0.5) showed a high frequency in central China, which may be closely related to the TAH–SPEI drought pattern.
The variance contribution rate of the second mode, EOF2, is 17.46% (Figure 6b), and the mean value of the overall vector of the space field of TAH is > 0. EOF2 shows that the spatial frequency of TAH has good coverage, and the high frequency is concentrated in the northeastern margins and middle portions of Central Asia. There were both positive and negative areas of drought status in the SPEI, with the spatial pattern of the drought status showing a step-like distribution pattern from southeast to northwest. In the second mode, TAH and SPEI have the same effect on TAH(SPEI < −0.5), which is, broadly speaking, a positive effect.
The variance contribution rate of the third mode, EOF3, is 10.06% (Figure 6c). This mode basically presents the opposite spatial distribution pattern to EOF1 and EOF2. The spatial field of TAH is positive in the west and negative in the east, thus presenting a pattern of east–west differentiation. The SPEI of the drought state is divided between the southeast and the northwest. In the northeast, the SPEI value gradually increases, and the drought state trend weakens, whereas in the southwest, the SPEI value gradually decreases, thus indicating that the drought state trend becomes stronger. The frequency of TAH(SPEI < −0.5) in the western region of the space field is higher, whereas the frequency in the eastern region is lower. The highest value is concentrated in the southwestern region.
The results show that in the study area, CDHWs mainly occurred in the central and eastern regions, and that the probability of occurrence (SPEI < −0.5) has been aggravated in recent years. In general, the positive part of TAH was greater than the negative part. TAH made a positive contribution to the space field in 1988, 1993, and 2002, and a negative one in 2008. Furthermore, TAH(SPEI < −0.5) showed typical regional characteristics in arid areas. Its intensity was higher in the southeastern portion of the Taklimakan Desert than in other areas, with the extent of damage extending to mid and southwestern Central Asia.

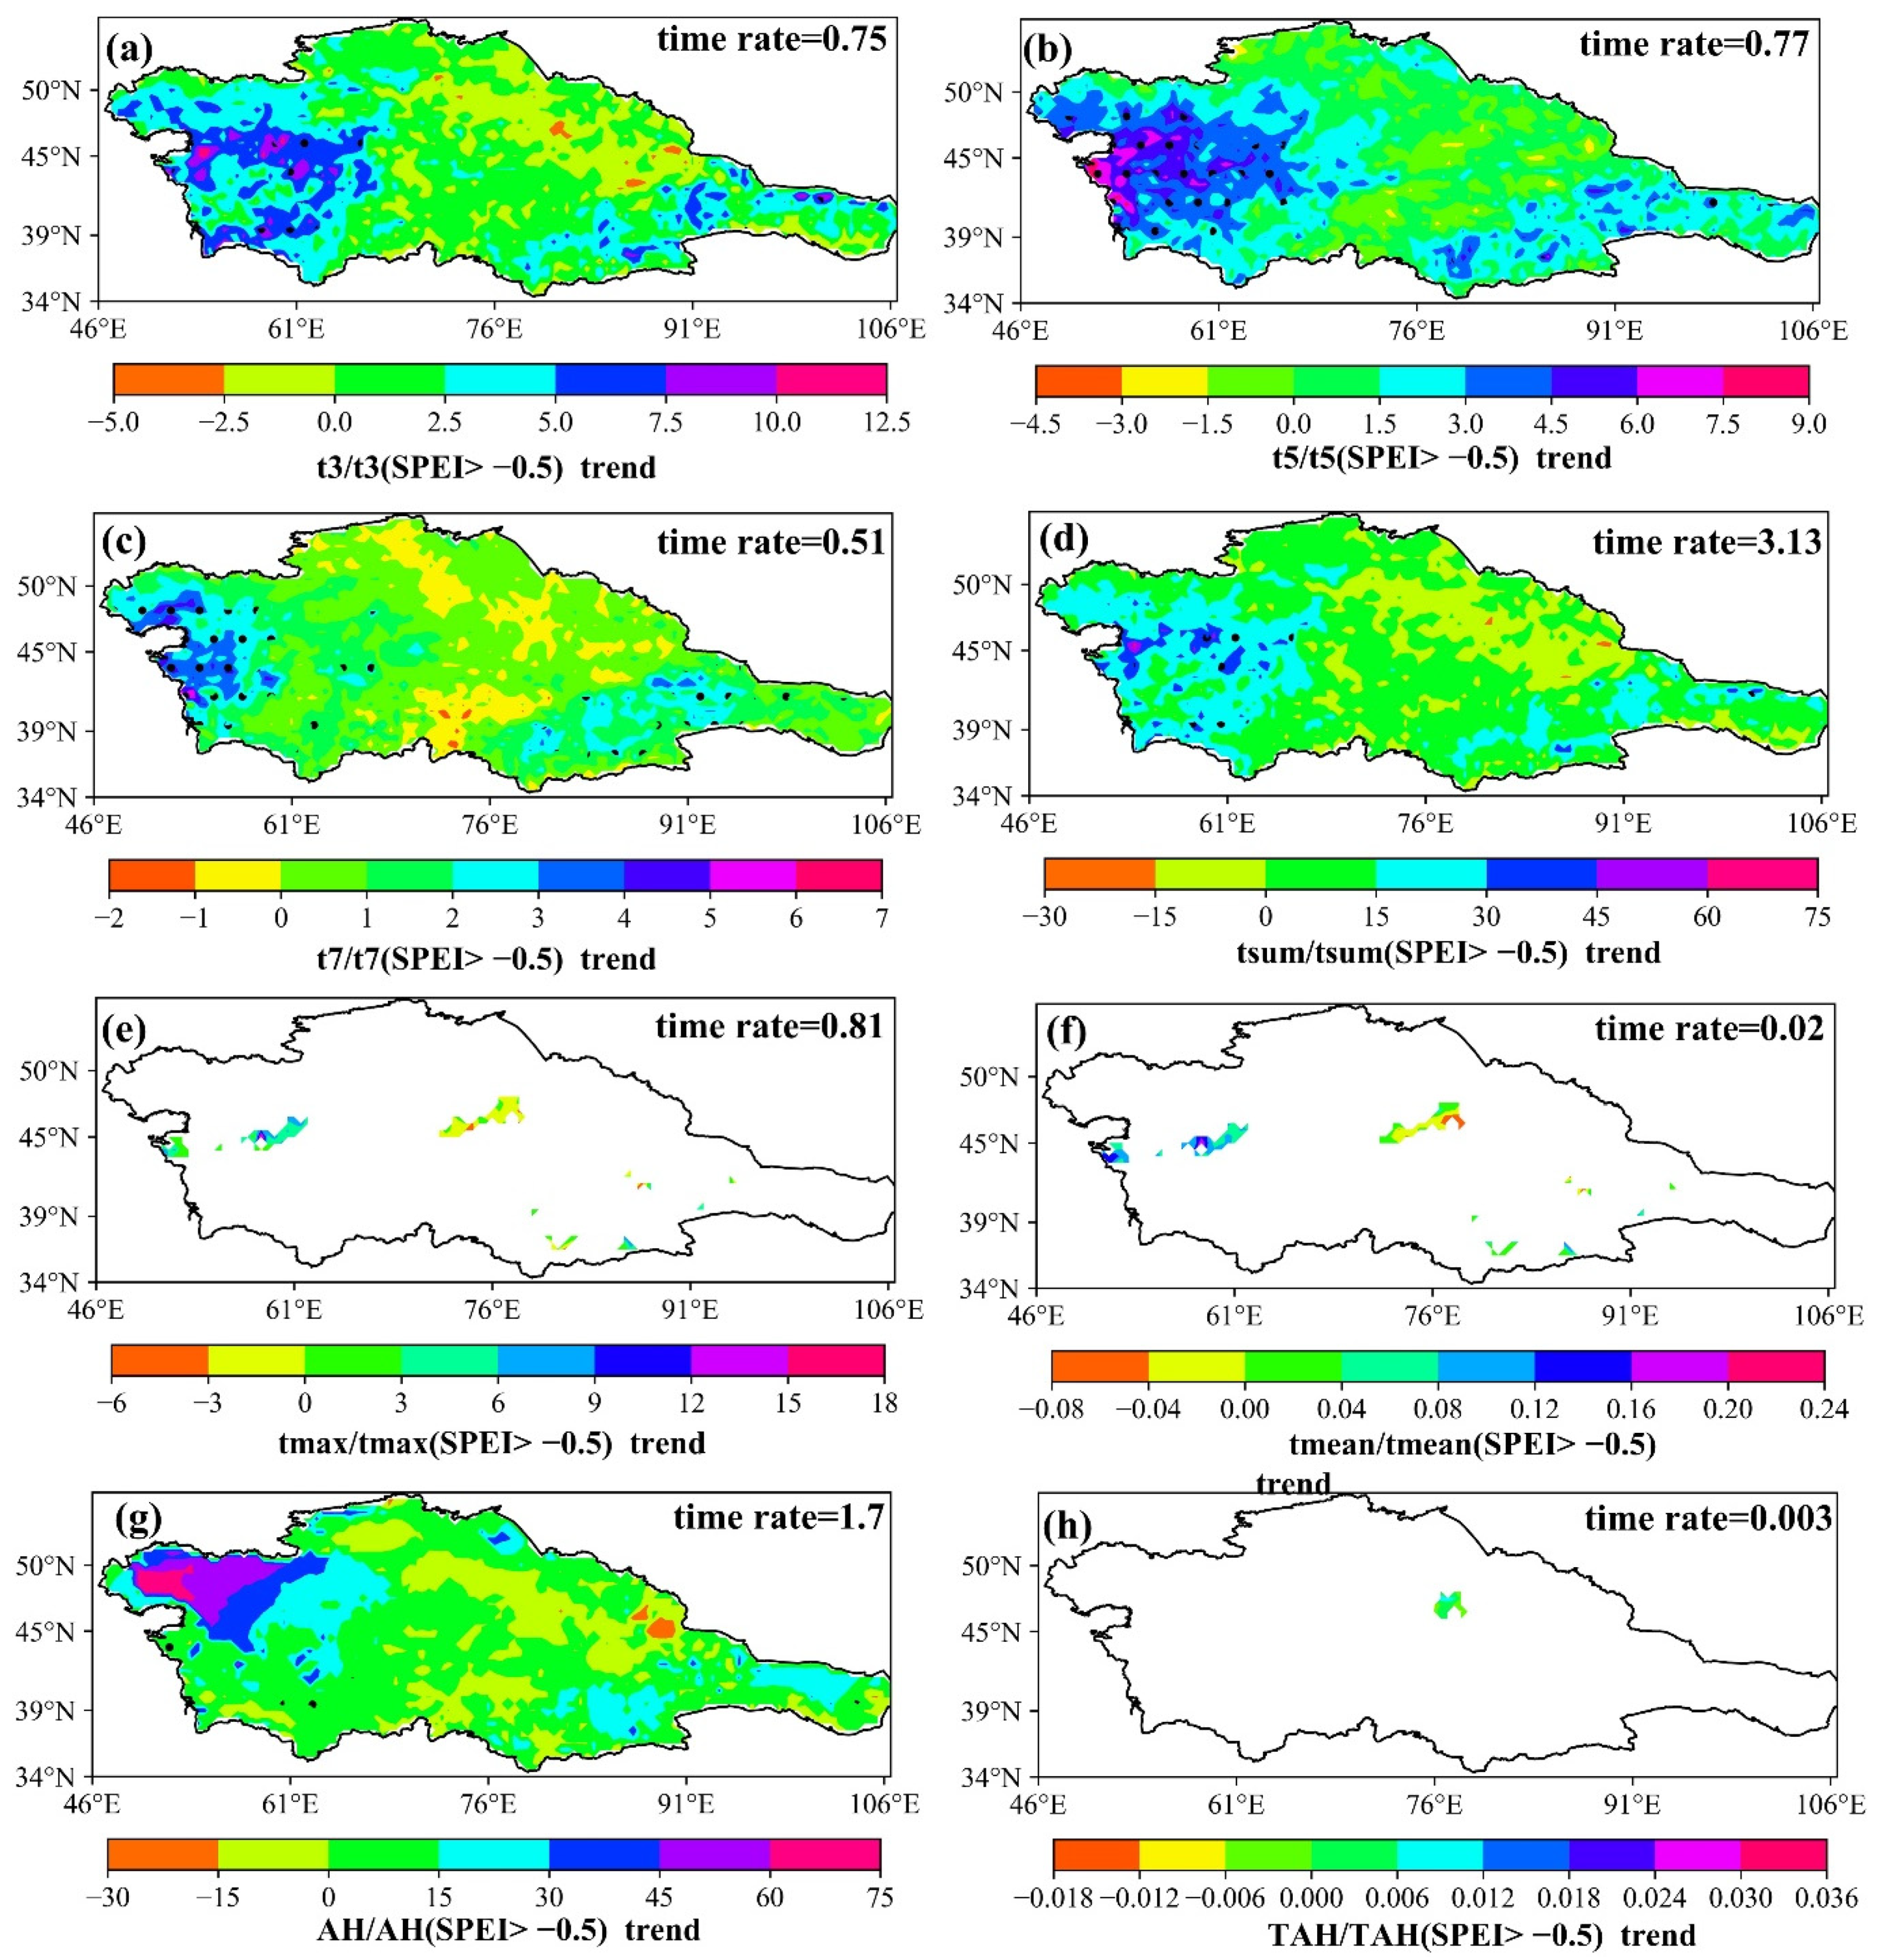
3.3. Comparative Analysis of CDHW Intensity and Single Heatwave Events

By comparing the TAH and tmax mean values of wet months with those of dry months (Figure 7a,b), we can see that TAH(SPEI > −0.5), rather than TAH(SPEI < −0.5), had a higher average strength. We can also see that temperature exceeded the average strength by about 0.4–0.8 °C. Similarly, by looking at the tmax index, particularly tmax in a humid state and tmax in drought state, we can see a north–south spatial pattern. The difference basically occurs as a dividing line at a 45° north latitude, thus presenting a spatial pattern that is high in the south and low in the north. South of 45N°, the duration of tmax was 1–3 days in a humid state, and there were a few areas in the north where the wet tmax exceeded dry tmax by 2–3 days. The correlation analysis of SPEI and AH (Figure 7c) shows that the two have a good correlation of R2 = 0.46. The aggravating factor of drought will lead to AH, and AH will further accelerate the occurrence of aridification. The spatial correlation distribution diagram illustrates that the positive correlation area reached 80.2%. More specifically, SPEI and AH had a strong positive correlation at the northwestern border of China and in some areas in the southwest of Central Asia, with the correlation coefficient reaching about 0.4.
The temporal and spatial trends of heatwave intensity during periods of drought and non-drought can indicate the quantitative relationship between compound events and single heatwave intensity (Figure 8). For t3/t3(SPEI > −0.5) (Figure 8a), the trend frequency in the northeastern area was 2.5 times per year. Furthermore, its largest ratio reached 5 times the frequency of the trend area. Most of the other regional multiples were stronger than single CDHW trends that concern heatwave frequency (about 2.5 times per year on average) in the southwest of the most eastern areas, whereas a small number had an area ratio of 7.5 times. The average annual growth rate of the CDHWs trend t3 was 0.75 times per year. Moreover, CDHWs t5/t5(SPEI > −0.5) (Figure 8b) and t7/t7(SPEI > −0.5) (Figure 8c) had the same spatial distribution pattern as t3, t5/t5(SPEI > −0.5). The highest spatial growth rate of a trend was 0.77 times per year, and the average frequency intensity trend of the CDHWs was higher than that of singular heatwaves. As tsum/tsum (SPEI > −0.5) (Figure 8d) reflects the multiple trend of all occurrence frequencies, the mean frequency intensity of the tsum of CDHWs was about 15 times that of a single heatwave event, and it even reached 60 times per year in sporadic areas of northeastern China. The annual growth rate of tsum/tsum (SPEI > −0.5) was 3.13 times per year. In summary, the frequency trends of the four indicators have higher rate of growth in terms of space, which expands annually. tmax/tmax(SPEI< −0.5) (Figure 8e) showed a high interannual growth rate of 0.81 times per year, though no obvious spatial trend emerged. tmean/tmean(SPEI< −0.5) (Figure 8f) showed no significant trend in terms of space, but it still increased at a rate of 0.02 times per year over time. The AH/AH (SPEI < −0.5) (Figure 8g) trend showed that AH can increase, and it had an annual growth rate of about 1.7 times per year. The increasing area of the spatial trend accounted for more than 80%. Moreover, the AH/AH (SPEI > −0.5) trend reached 15 times per year, with a relatively gentle trend change in the middle. Finally, we noted that multiples of TAH were insensitive to AH in the spatial distribution, compared with singular thermal events (Figure 8h), while still showing a slight increase of 0.003 times per year as an interannual trend.

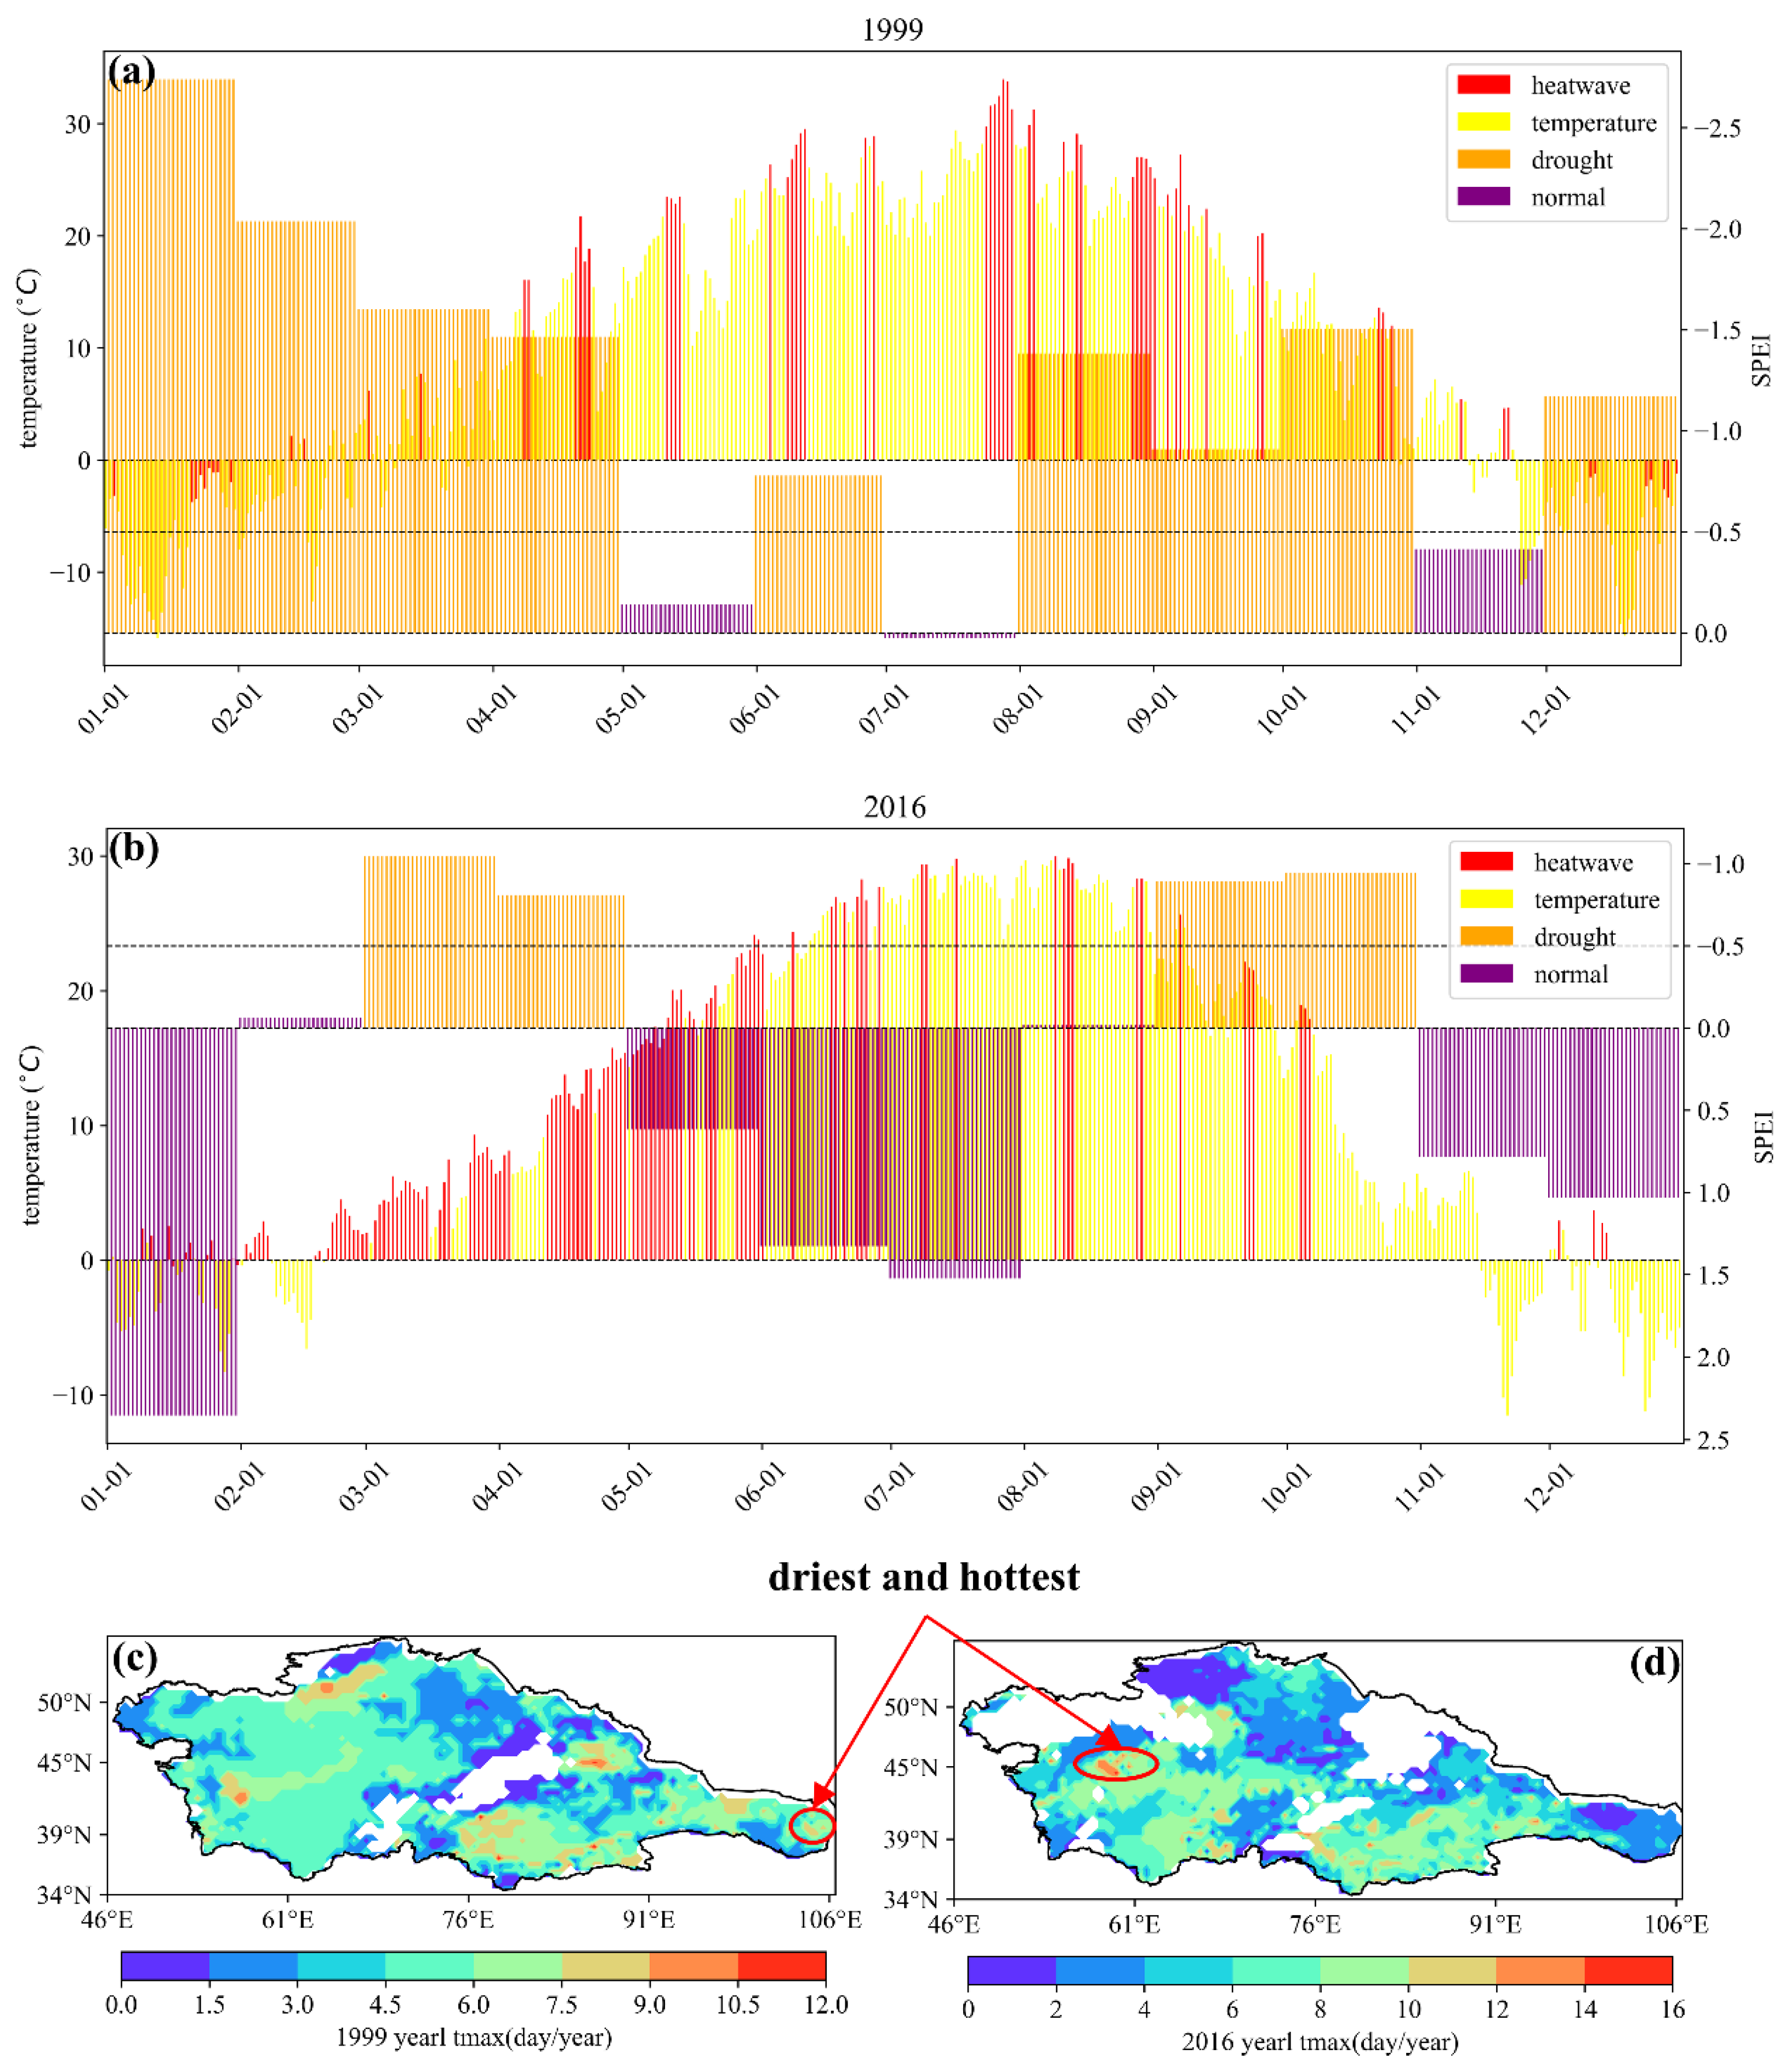
3.4. Relationship of CDHWs to Drought and Heatwave Events

We divided the entire research period into a base period (1981–1999) and a reference period (2000–2018), and then we explored the quantitative relationship between CDHWs, drought events, and heatwave events by looking for the hottest grid points in the two periods. The hottest grid in the base period was 105.5°E and 40°N in 1999 (Figure 9c), whereas the hottest grid in the reference period was 59.5°E and 45.5°N in 2016 (Figure 9d). We defined a discontinuous heatwave day as the occurrence of at least three consecutive wet days before the heatwave. During the dry months in the base period (Figure 9a), there was an average of 14.67 dry days prior to each discontinuous heatwave day. During the humid months, there was an average of 4.73 humid days prior to each discontinuous heatwave day. Furthermore, we found that there were more heatwave days occurring during drought states than humid states. For the dry months in the reference period (Figure 9b), there were, on average, 6 dry days prior to each discontinuous heatwave day, whereas for the wet months, there were, on average, 7.25 wet days; therefore, we can surmise that heatwaves in a drought state occurred at essentially the same frequency (about 6 days) as those in a humid state. In the transitional phase between the base and reference periods, the number of drought days prior to the composite event decreased by 7.35 days, and the influence of the composite event on the drought increased (Table 1).
As is evident from Table 2, the proportions of CDHWs, heatwave events, and drought events were 67.27% and 14.29% in the base period, and 42.28% and 42.62% in the reference period. During the transition from the base period to the reference period, the occurrence probability of CDHWs increased from 39% to 52%, for an increase of 21%, and the occurrence probability of heatwave events increased from 58% to 123%, for an increase of 52.84%. On the other hand, drought events decreased from 273% to 122%, which represents a decrease of 123.77%; therefore, in the reference period, the proportion of CDHWs and heatwave events played a leading role, and the proportion of CDHWs and drought events increased by 52.98%. However, in the reference period, the proportion of CDHWs, heatwave events, and drought events was basically the same, at about 42% (Table 2).

4. Discussion

The increasing frequency and intensity of CDHWs is exacerbated by global warming, as well as by extreme mean temperature anomalies on a regional scale [42]. Although the increasing rate of CDHWs is worrisome, the increasing magnitude of CDHWs is relatively consistent [9]. Both heatwaves and CDHWs are highly sensitive to variabilities in climate [24,34]. The present study investigated the frequency, intensity, maximum duration, and heat accumulation under drought conditions, and the regional mean temperature anomalies in Central Asia during 1981–2018. The results show that the frequency, intensity, and maximum duration of CDHWs have increased, and that accumulated heat is increasingly prominent in the eastern and southwestern parts of the study area. Our results are in agreement with the assessment of global CDHWs [26] in terms of their increased frequency and intensity. There is an increase in terms of the areas that are affected by CDHWs; the emerging pattern is spatially asymmetric and there is a greater amplification effect across the Northern Hemisphere. Concurrent, multi-type, extreme climate events have gradually become a frontier issue in current disaster research [43]; therefore, it is important to clarify the temporal and spatial variation characteristics of concurrent, multi-type, extreme climate events on a global scale, as well as in local regions, for future comprehensive meteorological disaster trend diagnoses and prevention [31].
In terms of single extreme climate events, heatwaves can occur in any season of the year, though most happen in summer and fall [47]. In this paper, the comparison of results in arid and non-arid areas showed that winter was becoming warmer at a greater rate in arid areas than warming that occurred in summer [36]. Furthermore, we found that winter warming amplified the effect of composite events occurring in arid zones, and that soil moisture was increasing, along with air humidity and temperature; this is because temperature anomalies were more likely to cause heatwave days [13], and the driving factors of land complex events and land-air feedback are often characterized by air subsidence. This leads to further air warming and drying, and it increases during latent heat flux or sensible heat flux [23]. Combined events caused by drought and heatwave are mainly controlled by surface flux [43]. The frequent occurrence of high temperature heatwaves may not directly trigger drought, but when it occurs, high temperature heatwaves will cause the drought to develop more rapidly and with greater intensity [48]. On the other hand, drought also provides strong atmospheric circulation and underlying surface conditions for the generation of high temperatures and heatwaves [49,50], thus having a significant impact upon the socio-economic and ecological environment. In their recent work, Perkins-Kirkpatrick introduced accumulated heat and mean temperature anomalies of heatwave days into the assessment of global heatwaves, which quantitatively analyzed regional differences in terms of heatwave intensity [42]. In the present study, we introduced this concept for the first time in the assessment of composite events, and we found that there was a significant increase in the trend for accumulated heat in arid Central Asia. Latitude is also a key factor that should be considered when assessing global or regional CDHWs [15]; however, the internal relationship between drought and heatwave events becomes more complicated due to differences in heat distribution across various dimensions, which are caused by solar radiation. These differences mean that agricultural production and ecology at different latitudes vary in terms of their ability to adapt to regional CDHWs [51].
As CDHWs can form as a combination of several single climate events [5], the future frequency of complex drought and heatwave occurrences in arid areas should concern us. Low-frequency CDHWs may not only be within the adaptive range, but they may also be more sensitive to high-frequency and high-intensity complex events [34]. Moreover, regional differences may result in changes to the factor combination structure of regional CDHWs. In the future, different disaster-causing factors could be reasonably selected based on regional characteristics. It would then be possible to further explore the internal physical mechanisms of regional CDHWs and evaluate their impacts on agriculture, ecology, and public health.

5. Conclusions

In this study, we analyzed the temporal and spatial variations of combined droughts and heatwaves in Central Asia from 1981 to 2018. We also analyzed the seasonal differences of tmax and TAH at a monthly scale, and we analyzed the spatial modal changes of combined droughts and heatwaves using the EOF method. The intensity of the composite drought and heatwave was compared with that of single heatwaves, based on the monthly mean TAH and monthly mean tmax. In order to explore the effects of drought events and heatwave events on the occurrence of composite droughts and heatwaves, we used 1981–1999 as the base period and 2000–2018 as the reference period to find the hottest and driest grid points in the two periods. The relationship between CDHWs and heatwave events and drought events was also explored. The results show that:
(1) From 1981 to 2018, CDHWs in Central Asia showed an increasing trend in terms of temporal and spatial variation. tsum increased at a rate of 0.17/yr, and the annual average frequency of CDHWs was 4.8 event/yr. The total frequency of CDHWs was as high as half the total frequency of heatwaves. CDHWs with the strongest intensity occurred in 2001, 2017, and 2018, with the tmax maximum duration reaching 17 days. In terms of spatial trends, the increased area of accumulated heat accounted for the largest proportion of affected land (97.78%). Additionally, we found that TAH was significantly affected by seasonality, with increases in TAH during winter and spring being greater than those in summer and autumn. TAH also exerted an influence on mean temperature anomalies.
(2) The accumulated variance contribution rate of EOF was as high as 67.43%, which essentially explains the modal distribution of CDHWs in Central Asia. In 1988, 1993, and 2002, TAH(SPEI < −0.5) showed a typical regional distribution in arid areas, and the intensity in the southeastern part of the Taklimakan Desert was obviously higher than that in other areas.
(3) The TAH(SPEI < −0.5) intensity was higher than the average TAH intensity of 0.4–0.8 °C in wet conditions, and it showed a north–south spatial pattern. In the transitional phase between the base and reference periods, the number of drought days prior to a CDHW decreased by 7.35 days, whereas the influence of CDHWs on droughts increased. During the transition from the base to the reference period, CDHWs increased by 25%, heatwave events increased from 58 to 123 (accounting for 52.84% of the increase), and drought events slightly decreased.
Our results emphasize the spatio-temporal variations and modal analysis of CDHWs in arid areas, along with the relationship between CDHWs and the occurrence of single heatwave and drought events. CDHWs in Central Asia have increased significantly as global temperatures have increased. It is well known that the wide range of impacts associated with compound events exists not only in the natural sector and ecosystems, but also in humans, particularly in areas related to public health. In the arid region of Central Asia, the occurrence of CDHWs is expected to continue to increase in the future, especially in the southeast and southwest. Research on CDHWs can provide science-based information for decision-makers to deal with climate change, and it should therefore be supported by the state and relevant departments.

Author Contributions

Conceptualization, Z.L., Y.C. and C.W.; methodology, Y.L., C.W.; software, C.W.; validation, C.W., X.W., Y.L. and Z.L.; writing—original draft preparation, C.W.; writing—review and editing, C.W., X.L., X.W., Z.K., Y.H. and F.S.; funding acquisition, Z.L. All authors have read and agreed to the published version of the manuscript.

Funding

The research was supported by the National Natural Science Foundation of China (U2003302) and the Key Research Program of the Chinese Academy of Sciences (ZDRWZS-2019-3). The authors gratefully acknowledge the Youth Innovation Promotion Association of the Chinese Academy of Sciences (2018480).

Data Availability Statement

We are thankful for the data provided by the high-resolution European Centre for Medium-Range Weather Forecasts Reanalysis5 (ERA5; https://cds.climate.copernicus.eu/#!/home), and Global SPEI database (SPEI; https://spei.csic.es/spei_database).

Conflicts of Interest

The authors declare no conflict of interest.

References

  1. Masson-Delmotte, V.; Zhai, A.P.; Pirani, S.L.; Connors, C.; Péan, S.; Berger, N.; Caud, Y.; Chen, L.; Goldfarb, M.I.; Gomis, M.; et al. (Eds.) IPCC, 2021: Climate Change 2021: The Physical Science Basis. Contribution of Working Group I to the Sixth Assessment Report of the Intergovernmental Panel on Climate Change; Cambridge University Press: Cambridge, UK, 2021. [Google Scholar]
  2. Beringer, J.; Moore, C.E.; Cleverly, J.; Campbell, D.I.; Cleugh, H.; De Kauwe, M.G.; Kirschbaum, M.U.F.; Griebel, A.; Grover, S.; Huete, A.; et al. Bridge to the future: Important lessons from 20 years of ecosystem observations made by the OzFlux network. Glob. Chang. Biol. 2022, 28, 3489–3514. [Google Scholar] [CrossRef] [PubMed]
  3. Rodrigues, R.R.; Taschetto, A.S.; Sen Gupta, A.; Foltz, G.R. Common cause for severe droughts in South America and marine heatwaves in the South Atlantic. Nat. Geosci. 2019, 12, 620–626. [Google Scholar] [CrossRef]
  4. Alimonti, G.; Mariani, L.; Prodi, F.; Ricci, R.A. A critical assessment of extreme events trends in times of global warming. Eur. Phys. J. Plus 2022, 137, 112. [Google Scholar] [CrossRef]
  5. Guerreiro, S.B.; Dawson, R.J.; Kilsby, C.; Lewis, E.; Ford, A. Future heat-waves, droughts and floods in 571 European cities. Environ. Res. Lett. 2018, 13, 034009. [Google Scholar] [CrossRef]
  6. Lyon, B. Southern Africa Summer Drought and Heat Waves: Observations and Coupled Model Behavior. J. Clim. 2009, 22, 6033–6046. [Google Scholar] [CrossRef]
  7. Mazdiyasni, O.; AghaKouchak, A. Substantial increase in concurrent droughts and heatwaves in the United States. Proc. Natl. Acad. Aci. USA 2015, 112, 11484–11489. [Google Scholar] [CrossRef]
  8. Heinicke, S.; Frieler, K.A.; Jagermeyr, J.; Mengel, M. Global gridded crop models underestimate yield responses to droughts and heatwaves. Environ. Res. Lett. 2022, 17, 044026. [Google Scholar] [CrossRef]
  9. Mukherjee, S.; Ashfaq, M.; Mishra, A.K. Compound Drought and Heatwaves at a Global Scale: The Role of Natural Climate Variability-Associated Synoptic Patterns and Land-Surface Energy Budget Anomalies. J. Geophys. Res. Atmos. 2020, 125, e2019JD031943. [Google Scholar] [CrossRef]
  10. Zhou, S.; Yuan, X. Upwind Droughts Enhance Half of the Heatwaves Over North China. Geophys. Res. Lett. 2022, 49, e2021GL096639. [Google Scholar] [CrossRef]
  11. Pascoa, P.; Gouveia, C.M.; Russo, A.; Ribeiro, A.F.S. Summer hot extremes and antecedent drought conditions in Australia. Int. J. Clim. 2022. [Google Scholar] [CrossRef]
  12. Brás, T.A.; Seixas, J.; Carvalhais, N.; Jägermeyr, J. Severity of drought and heatwave crop losses tripled over the last five decades in Europe. Environ. Res. Lett. 2021, 16, 065012. [Google Scholar] [CrossRef]
  13. Christian, J.I.; Basara, J.B.; Hunt, E.D.; Otkin, J.A.; Xiao, X. Flash drought development and cascading impacts associated with the 2010 Russian heatwave. Environ. Res. Lett. 2020, 15, 094078. [Google Scholar] [CrossRef]
  14. Libonati, R.; Geirinhas, J.L.; Silva, P.S.; Russo, A.; Rodrigues, J.A.; Belem, L.B.C.; Nogueira, J.; Roque, F.O.; DaCamara, C.C.; Nunes, A.M.B.; et al. Assessing the role of compound drought and heatwave events on unprecedented 2020 wildfires in the Pantanal. Environ. Res. Lett. 2022, 17, 015005. [Google Scholar] [CrossRef]
  15. Sharma, S.; Mujumdar, P. Increasing frequency and spatial extent of concurrent meteorological droughts and heatwaves in India. Sci. Rep. 2017, 7, 15582. [Google Scholar] [CrossRef] [PubMed]
  16. Bevacqua, E.; Zappa, G.; Lehner, F.; Zscheischler, J. Precipitation trends determine future occurrences of compound hot-dry events. Nat. Clim. Chang. 2022, 12, 350–355. [Google Scholar] [CrossRef]
  17. Tavakol, A.; Rahmani, V.; Harrington, J., Jr. Probability of compound climate extremes in a changing climate: A copula-based study of hot, dry, and windy events in the central United States. Environ. Res. Lett. 2020, 15, 104058. [Google Scholar] [CrossRef]
  18. Hoover, D.L.; Hajek, O.L.; Smith, M.D.; Wilkins, K.; Slette, I.J.; Knapp, A.K. Compound hydroclimatic extremes in a semi-arid grassland: Drought, deluge, and the carbon cycle. Glob. Chang. Biol. 2022, 28, 2611–2621. [Google Scholar] [CrossRef]
  19. Gouveia, C.M.; Bistinas, I.; Liberato, M.L.R.; Bastos, A.; Koutsias, N.; Trigo, R. The outstanding synergy between drought, heatwaves and fuel on the 2007 Southern Greece exceptional fire season. Agric. For. Meteorol. 2016, 218–219, 135–145. [Google Scholar] [CrossRef]
  20. Miralles, D.G.; Gentine, P.; Seneviratne, S.I.; Teuling, A.J. Land-atmospheric feedbacks during droughts and heatwaves: State of the science and current challenges. Ann. N. Y. Acad. Sci. 2019, 1436, 19–35. [Google Scholar] [CrossRef]
  21. Palmer, T. Resilience in the developing world benefits everyone. Nat. Clim. Chang. 2020, 10, 794–795. [Google Scholar] [CrossRef]
  22. Baldwin, J.W.; Dessy, J.B.; Vecchi, G.A.; Oppenheimer, M. Temporally Compound Heat Wave Events and Global Warming: An Emerging Hazard. Earths Future 2019, 7, 411–427. [Google Scholar] [CrossRef]
  23. Shi, Z.; Jia, G.; Zhou, Y.; Xu, X.; Jiang, Y. Amplified intensity and duration of heatwaves by concurrent droughts in China. Atmos. Res. 2021, 261, 105743. [Google Scholar] [CrossRef]
  24. Kong, Q.; Guerreiro, S.B.; Blenkinsop, S.; Li, X.-F.; Fowler, H.J. Increases in summertime concurrent drought and heatwave in Eastern China. Weather Clim. Extrem 2020, 28, 100242. [Google Scholar] [CrossRef]
  25. Yuan, W.; Cai, W.; Chen, Y.; Liu, S.; Dong, W.; Zhang, H.; Yu, G.; Chen, Z.; He, H.; Guo, W.; et al. Severe summer heatwave and drought strongly reduced carbon uptake in Southern China. Sci. Rep. 2016, 6, 18813. [Google Scholar] [CrossRef]
  26. Mukherjee, S.; Mishra, A.K. Increase in Compound Drought and Heatwaves in a Warming World. Geophys. Res. Lett. 2021, 48, e2020GL090617. [Google Scholar] [CrossRef]
  27. Suarez, M.J.; Koster, R.D.; Wang, H.; Schubert, S.D.; Groisman, P.Y. Northern Eurasian Heat Waves and Droughts. J. Clim. 2014, 27, 3169–3207. [Google Scholar] [CrossRef]
  28. Huang, J.; Li, Y.; Fu, C.; Chen, F.; Fu, Q.; Dai, A.; Shinoda, M.; Ma, Z.; Guo, W.; Li, Z.; et al. Dryland climate change: Recent progress and challenges. Rev. Geophys. 2017, 55, 719–778. [Google Scholar] [CrossRef]
  29. Huang, J.; Ji, M.; Xie, Y.; Wang, S.; He, Y.; Ran, J. Global semi-arid climate change over last 60 years. Clim. Dyn. 2016, 46, 1131–1150. [Google Scholar] [CrossRef]
  30. Li, Z.; Fang, G.H.; Chen, Y.N.; Duan, W.L.; Mukanov, Y. Agricultural water demands in Central Asia under 1.5 degrees C and 2.0 degrees C global warming. Agric. Water Manag. 2020, 231, 106020. [Google Scholar] [CrossRef]
  31. Lian, X.; Piao, S.; Chen, A.; Huntingford, C.; Fu, B.; Li, L.Z.X.; Huang, J.; Sheffield, J.; Berg, A.M.; Keenan, T.F.; et al. Multifaceted characteristics of dryland aridity changes in a warming world. Nat. Rev. Earth Environ. 2021, 2, 232–250. [Google Scholar] [CrossRef]
  32. Li, S.Y.; Luo, J.C.; Xu, Y.J.; Zhang, L.Q.; Ye, C. Hydrological seasonality and nutrient stoichiometry control dissolved organic matter characterization in a headwater stream. Sci. Total Environ. 2022, 807, 150843. [Google Scholar] [CrossRef] [PubMed]
  33. Li, Z.; Chen, Y.N.; Fang, G.H.; Li, Y.P. Multivariate assessment and attribution of droughts in Central Asia. Sci. Rep. 2017, 7, 1316. [Google Scholar] [CrossRef]
  34. Mukherjee, S.; Mishra, A.K.; Ashfaq, M.; Kao, S.C. Relative effect of anthropogenic warming and natural climate variability to changes in Compound drought and heatwaves. J. Hydrol. 2022, 605, 127396. [Google Scholar] [CrossRef]
  35. Rolle, M.; Tamea, S.; Claps, P. Climate-driven trends in agricultural water requirement: An ERA5-based assessment at daily scale over 50 years. Environ. Res. Lett. 2022, 17, 044017. [Google Scholar] [CrossRef]
  36. Li, Z.; Chen, Y.N.; Li, W.H.; Deng, H.J.; Fang, G.H. Potential impacts of climate change on vegetation dynamics in Central Asia. J. Geophys. Res. Atmos. 2015, 120, 12345–12356. [Google Scholar] [CrossRef]
  37. Chen, H.; Huang, J.J.; Dash, S.S.; Wei, Y.; Li, H. A hybrid deep learning framework with physical process description for simulation of evapotranspiration. J. Hydrol. 2022, 606, 127422. [Google Scholar] [CrossRef]
  38. Hu, Z.; Zhang, C.; Hu, Q.; Tian, H. Temperature Changes in Central Asia from 1979 to 2011 Based on Multiple Datasets*. J. Clim. 2014, 27, 1143–1167. [Google Scholar] [CrossRef]
  39. Muñoz-Sabater, J.; Dutra, E.; Agustí-Panareda, A.; Albergel, C.; Arduini, G.; Balsamo, G.; Boussetta, S.; Choulga, M.; Harrigan, S.; Hersbach, H.; et al. ERA5-Land: A state-of-the-art global reanalysis dataset for land applications. Earth Syst. Sci. Data 2021, 13, 4349–4383. [Google Scholar] [CrossRef]
  40. Vicente-Serrano, S.M.; Beguería, S.; López-Moreno, J.I. A Multiscalar Drought Index Sensitive to Global Warming: The Standardized Precipitation Evapotranspiration Index. J. Clim. 2010, 23, 1696–1718. [Google Scholar] [CrossRef]
  41. Vicente-Serrano, S.M.; Begueria, S.; Lorenzo-Lacruz, J.; Camarero, J.J.; Lopez-Moreno, J.I.; Azorin-Molina, C.; Revuelto, J.; Moran-Tejeda, E.; Sanchez-Lorenzo, A. Performance of Drought Indices for Ecological, Agricultural, and Hydrological Applications. Earth Interact. 2012, 16, 1–27. [Google Scholar] [CrossRef]
  42. Perkins-Kirkpatrick, S.E.; Lewis, S.C. Increasing trends in regional heatwaves. Nat. Commun. 2020, 11, 3357. [Google Scholar] [CrossRef]
  43. Shi, H.; García-Reyes, M.; Jacox, M.G.; Rykaczewski, R.R.; Black, B.A.; Bograd, S.J.; Sydeman, W.J. Co-occurrence of California Drought and Northeast Pacific Marine Heatwaves Under Climate Change. Geophys. Res. Lett. 2021, 48, e2021GL092765. [Google Scholar] [CrossRef]
  44. Zhu, Y.; Liu, S.Y.; Yi, Y.; Xie, F.M.; Grunwald, R.; Miao, W.F.; Wu, K.P.; Qi, M.M.; Gao, Y.P.; Singh, D. Overview of terrestrial water storage changes over the Indus River Basin based on GRACE/GRACE-FO solutions. Sci. Total Environ. 2021, 799, 149366. [Google Scholar] [CrossRef] [PubMed]
  45. Eom, J.; Seo, K.W.; Ryu, D. Estimation of Amazon River discharge based on EOF analysis of GRACE gravity data. Remote Sens. Environ. 2017, 191, 55–66. [Google Scholar] [CrossRef]
  46. Sen, P.K. Estimates of the Regression Coefficient Based on Kendall’s Tau. J. Am. Stat. Assoc. 1968, 63, 1379–1389. [Google Scholar] [CrossRef]
  47. Sutanto, S.J.; Vitolo, C.; Di Napoli, C.; D’Andrea, M.; Van Lanen, H.A.J. Heatwaves, droughts, and fires: Exploring compound and cascading dry hazards at the pan-European scale. Environ. Int. 2020, 134, 105276. [Google Scholar] [CrossRef] [PubMed]
  48. Raymond, C.; Matthews, T.; Horton, R.M.; Fischer, E.M.; Fueglistaler, S.; Ivanovich, C.; Suarez-Gutierrez, L.; Zhang, Y. On the Controlling Factors for Globally Extreme Humid Heat. Geophys. Res. Lett. 2021, 48, e2021GL096082. [Google Scholar] [CrossRef]
  49. Dong, Z.C.; Wang, J.Y.; Qiu, T.M.; Wu, J.L.; An, Y.; Shi, X.X.; Sun, X.C.; Jiang, L.P.; Liu, X.F.; Yang, G.; et al. Perfluorooctane sulfonate induces mitochondrial calcium overload and early hepatic insulin resistance via autophagy/detyrosinated alpha-tubulin-regulated IP3R2-VDAC1-MICU1 interaction. Sci. Total Environ. 2022, 825, 153933. [Google Scholar] [CrossRef]
  50. He, Y.; Hu, X.K.; Xu, W.; Fang, J.Y.; Shi, P.J. Increased probability and severity of compound dry and hot growing seasons over world’s major croplands. Sci. Total Environ. 2022, 824, 153885. [Google Scholar] [CrossRef]
  51. Happel, A.; Gallagher, D. Decreases in wastewater pollutants increased fish diversity of Chicago’s waterways. Sci. Total Environ. 2022, 824, 153776. [Google Scholar] [CrossRef]
Figure 1. Study area: (a) location of Central Asia on the world map; (b) distribution of land use conditions in Central Asia; (c) elevation changes and distribution of rivers and lakes in Central Asia. The map is based on the standard map number GS (2016) 1666 downloaded from the standard map service website of the National Bureau of Mapping Geographic Information, and the base map is not modified.
Remotesensing 14 02959 g001
Figure 2. Coupling mechanism diagram of drought events, heatwave events, and CDHWs. (a) Drought events, heatwave events, and CDHWs that are defined by randomly selected grid points at certain locations in a certain year; specific times and locations are shown at the thresholds of 9°E, 11.5°N, and at 18 grid points in 2012. (b) Three-dimensional spatial distribution of heatwave thresholds (c) showing the local magnified details of (a). The intensity and duration of CDHWs are further indicated.
Remotesensing 14 02959 g002
Figure 3. Monthly means in the panel axes. (a) Maximum duration tmax of CDHWs using a monthly scale, and (b) the average temperature TAH anomalies of CDHWs using a monthly scale. (The grid value is the maximum value for the corresponding month.).
Remotesensing 14 02959 g003
Figure 4. (ah) Time trend and significance test for each CDHW index in Central Asia. Note: The orange area represents the occurrence of all heatwave days, and the green area represents the occurrence of heatwaves under drought conditions.
Remotesensing 14 02959 g004
Figure 5. (ah) Spatial trend and significance tests for each index of CDHWs in Central Asia; (i) proportion of affected areas which have increased according to the trends of some indicators (black point highlights the 95% significance level).
Remotesensing 14 02959 g005
Figure 6. Multivariate EOF analysis of TAH (heatwave), SPEI (drought), and TAH(SPEI < −0.5) (CDHWs). (a) First mode; (b) second mode; (c) third mode.
Remotesensing 14 02959 g006
Figure 7. (a) Differences between TAH(SPEI < −0.5) and TAH(SPEI > −0.5); (b) differences between tmax (SPEI < −0.5) and tmax (SPEI > −0.5); (c) the SPEI (drought) and AH (accumulated heat) correlation.
Remotesensing 14 02959 g007
Figure 8. (ah) Trends in heatwave mean intensity in CDHWs vs. non-drought periods (CDHWs/heatwaves during non-drought periods).
Remotesensing 14 02959 g008
Figure 9. Discussion on the relationship between CDHWs, drought events, and heatwave events. (a) Statistics regarding the hottest and driest grid points in the base period (1999); (b) statistics regarding the hottest and driest grid points in the reference period (2019); (c,d) driest points in the base and reference periods, respectively, and the spatial distribution of the hottest grid points.
Remotesensing 14 02959 g009
Table 1. Number and average days of discrete heatwaves in dry and wet conditions.
DaysAverage
1999_Wet18 14 15 24 11 13 7 12 12 27 11 1214.67
1999_Dry11 25 11 9 154.73
2016_Dry4 8 66
2016_Wet8 10 4 6 8 8 7 77.25
Table 2. Occurrences and proportions of droughts, heatwaves, and CDHWs.
CDHWsHeatwavesDroughtsCDHWs/HeatwavesCDHWs/Droughts
1999395827367.27%14.29%
20165212312242.28%42.62%
Publisher’s Note: MDPI stays neutral with regard to jurisdictional claims in published maps and institutional affiliations.

