Article

Swin-Transformer-Enabled YOLOv5 with Attention Mechanism for Small Object Detection on Satellite Images

1
MOE Key Laboratory for Nonequilibrium Synthesis and Modulation of Condensed Matter, Research Center for Space Optics and Astronomy, School of Physics, Xi’an Jiaotong University, Xi’an 710049, China
2
Shanghai Institute of Satellite Engineering, Shanghai Academy of Spaceflight Technology, Shanghai 201109, China
3
Shanghai Institute of Technical Physics, Chinese Academy of Sciences, Shanghai 200083, China
*
Author to whom correspondence should be addressed.
Remote Sens. 2022, 14(12), 2861; https://doi.org/10.3390/rs14122861
Submission received: 27 April 2022 / Revised: 3 June 2022 / Accepted: 12 June 2022 / Published: 15 June 2022
(This article belongs to the Special Issue Earth Observations for Sustainable Development Goals)

Abstract

:
Object detection has made tremendous progress in natural images over the last decade. However, the results are hardly satisfactory when the natural image object detection algorithm is directly applied to satellite images. This is due to the intrinsic differences in the scale and orientation of objects generated by the bird’s-eye perspective of satellite photographs. Moreover, the background of satellite images is complex and the object area is small; as a result, small objects tend to be missing due to the challenge of feature extraction. Dense objects overlap and occlusion also affects the detection performance. Although the self-attention mechanism was introduced to detect small objects, the computational complexity increased with the image’s resolution. We modified the general one-stage detector YOLOv5 to adapt the satellite images to resolve the above problems. First, new feature fusion layers and a prediction head are added from the shallow layer for small object detection for the first time because it can maximally preserve the feature information. Second, the original convolutional prediction heads are replaced with Swin Transformer Prediction Heads (SPHs) for the first time. SPH represents an advanced self-attention mechanism whose shifted window design can reduce the computational complexity to linearity. Finally, Normalization-based Attention Modules (NAMs) are integrated into YOLOv5 to improve attention performance in a normalized way. The improved YOLOv5 is termed SPH-YOLOv5. It is evaluated on the NWPU-VHR10 dataset and DOTA dataset, which are widely used for satellite image object detection evaluations. Compared with the basal YOLOv5, SPH-YOLOv5 improves the mean Average Precision (mAP) by 0.071 on the DOTA dataset.

Graphical Abstract

1. Introduction

Earth satellite technology usually acquires high-resolution satellite photographs to observe the Earth’s surface. However, existing interpretation algorithms face a significant challenge in digesting plenty of satellite images. Object detection is one of the most fundamental issues in computer vision, which means finding predefined instances reliably and efficiently from photographs. It has wide applications in disaster monitoring, precision agriculture, urban traffic management, etc. [1,2,3].
Recently, data-driven deep learning methods have promoted significant progress in segmentation and object detection tasks [4,5,6]. The detection precision is affected by the quality and quantity of the training dataset [7]. Some comprehensive and challenging natural image datasets, such as PASCAL VOC [8] and MS COCO [9], have driven the advancement of object detection. However, object detection is still a difficult task for optical satellite images. The reasons are as follows. First, unlike natural images by ground-based cameras with horizontal views, satellite images taken from a bird’s-eye view have a wide imaging range with comprehensive information. For complicated landscapes and urban environments, there is an imbalanced distribution of front items and complex background information [10]. Then, objects in satellite photographs frequently have variable visual appearances and optical attributes due to various imaging settings, such as views, lighting, and occlusion [11,12]. Finally, compared to larger objects, small objects often lack sufficient information about their appearance, making them more challenging to identify from the background or similar objects.
In this research, we focus on strengthening object detection performance in satellite images to respond to the above challenges. In addition, as the satellite image object detection tends to be real-time, the detection speed also poses a significant challenge to the detection algorithm. You Only Look Once (YOLO) neural networks [13,14,15,16], which integrate object classification and localization (two-stage) into a one-stage regression issue, can significantly improve detection speed [17]. As far as we know, YOLOv5 is the newest version of YOLO, which has the best performance on natural images for object detection. It is because YOLOv5 uses the improved CSPDarknet53 [18] and Path Aggregation Network (PANet [19]) as the backbone and neck of the network, respectively.
However, it is hard to apply YOLOv5 to satellite images for object detection directly. In this paper, we update YOLOv5 from the following three aspects. First, the deep feature maps fused in the neck of YOLOv5 would lose small object information due to excessive downsampling. To avoid this issue, we added a new branch in the shallower network layer for detecting small objects for the first time. Then, the feature information can be preserved to the maximum. Second, a convolution neural network (CNN) is usually used to build the backbone of the YOLO net; however, it is only good at capturing local information. Although the transformer can compensate for global modeling ability, the classical transformer would be subject to squared computational complexity when processing high-resolution satellite images. Fortunately, the shift window of the Swin transformer would bring a higher efficiency by limiting the self-attention computation to a local window [20]. This architecture has the flexibility to model at various scales and has linear computational complexity relative to the image size. Therefore, we replace the regular CNN prediction heads with Swin transformer Prediction Heads (SPHs). It can be more effective in detecting different sizes of objects with four different scales of prediction heads. Third, the Normalization-based Attention Module (NAM) is used to progressively construct the attention information along channel-wise and spatial-wise dimensions from the region of interest. Finally, the modified YOLOv5 is named SPH-YOLOv5. Experimental results show that our proposed SPH-YOLOv5 outperforms the general YOLOv5 in satellite images for detecting objects.
Our contribution can be summarized as follows:
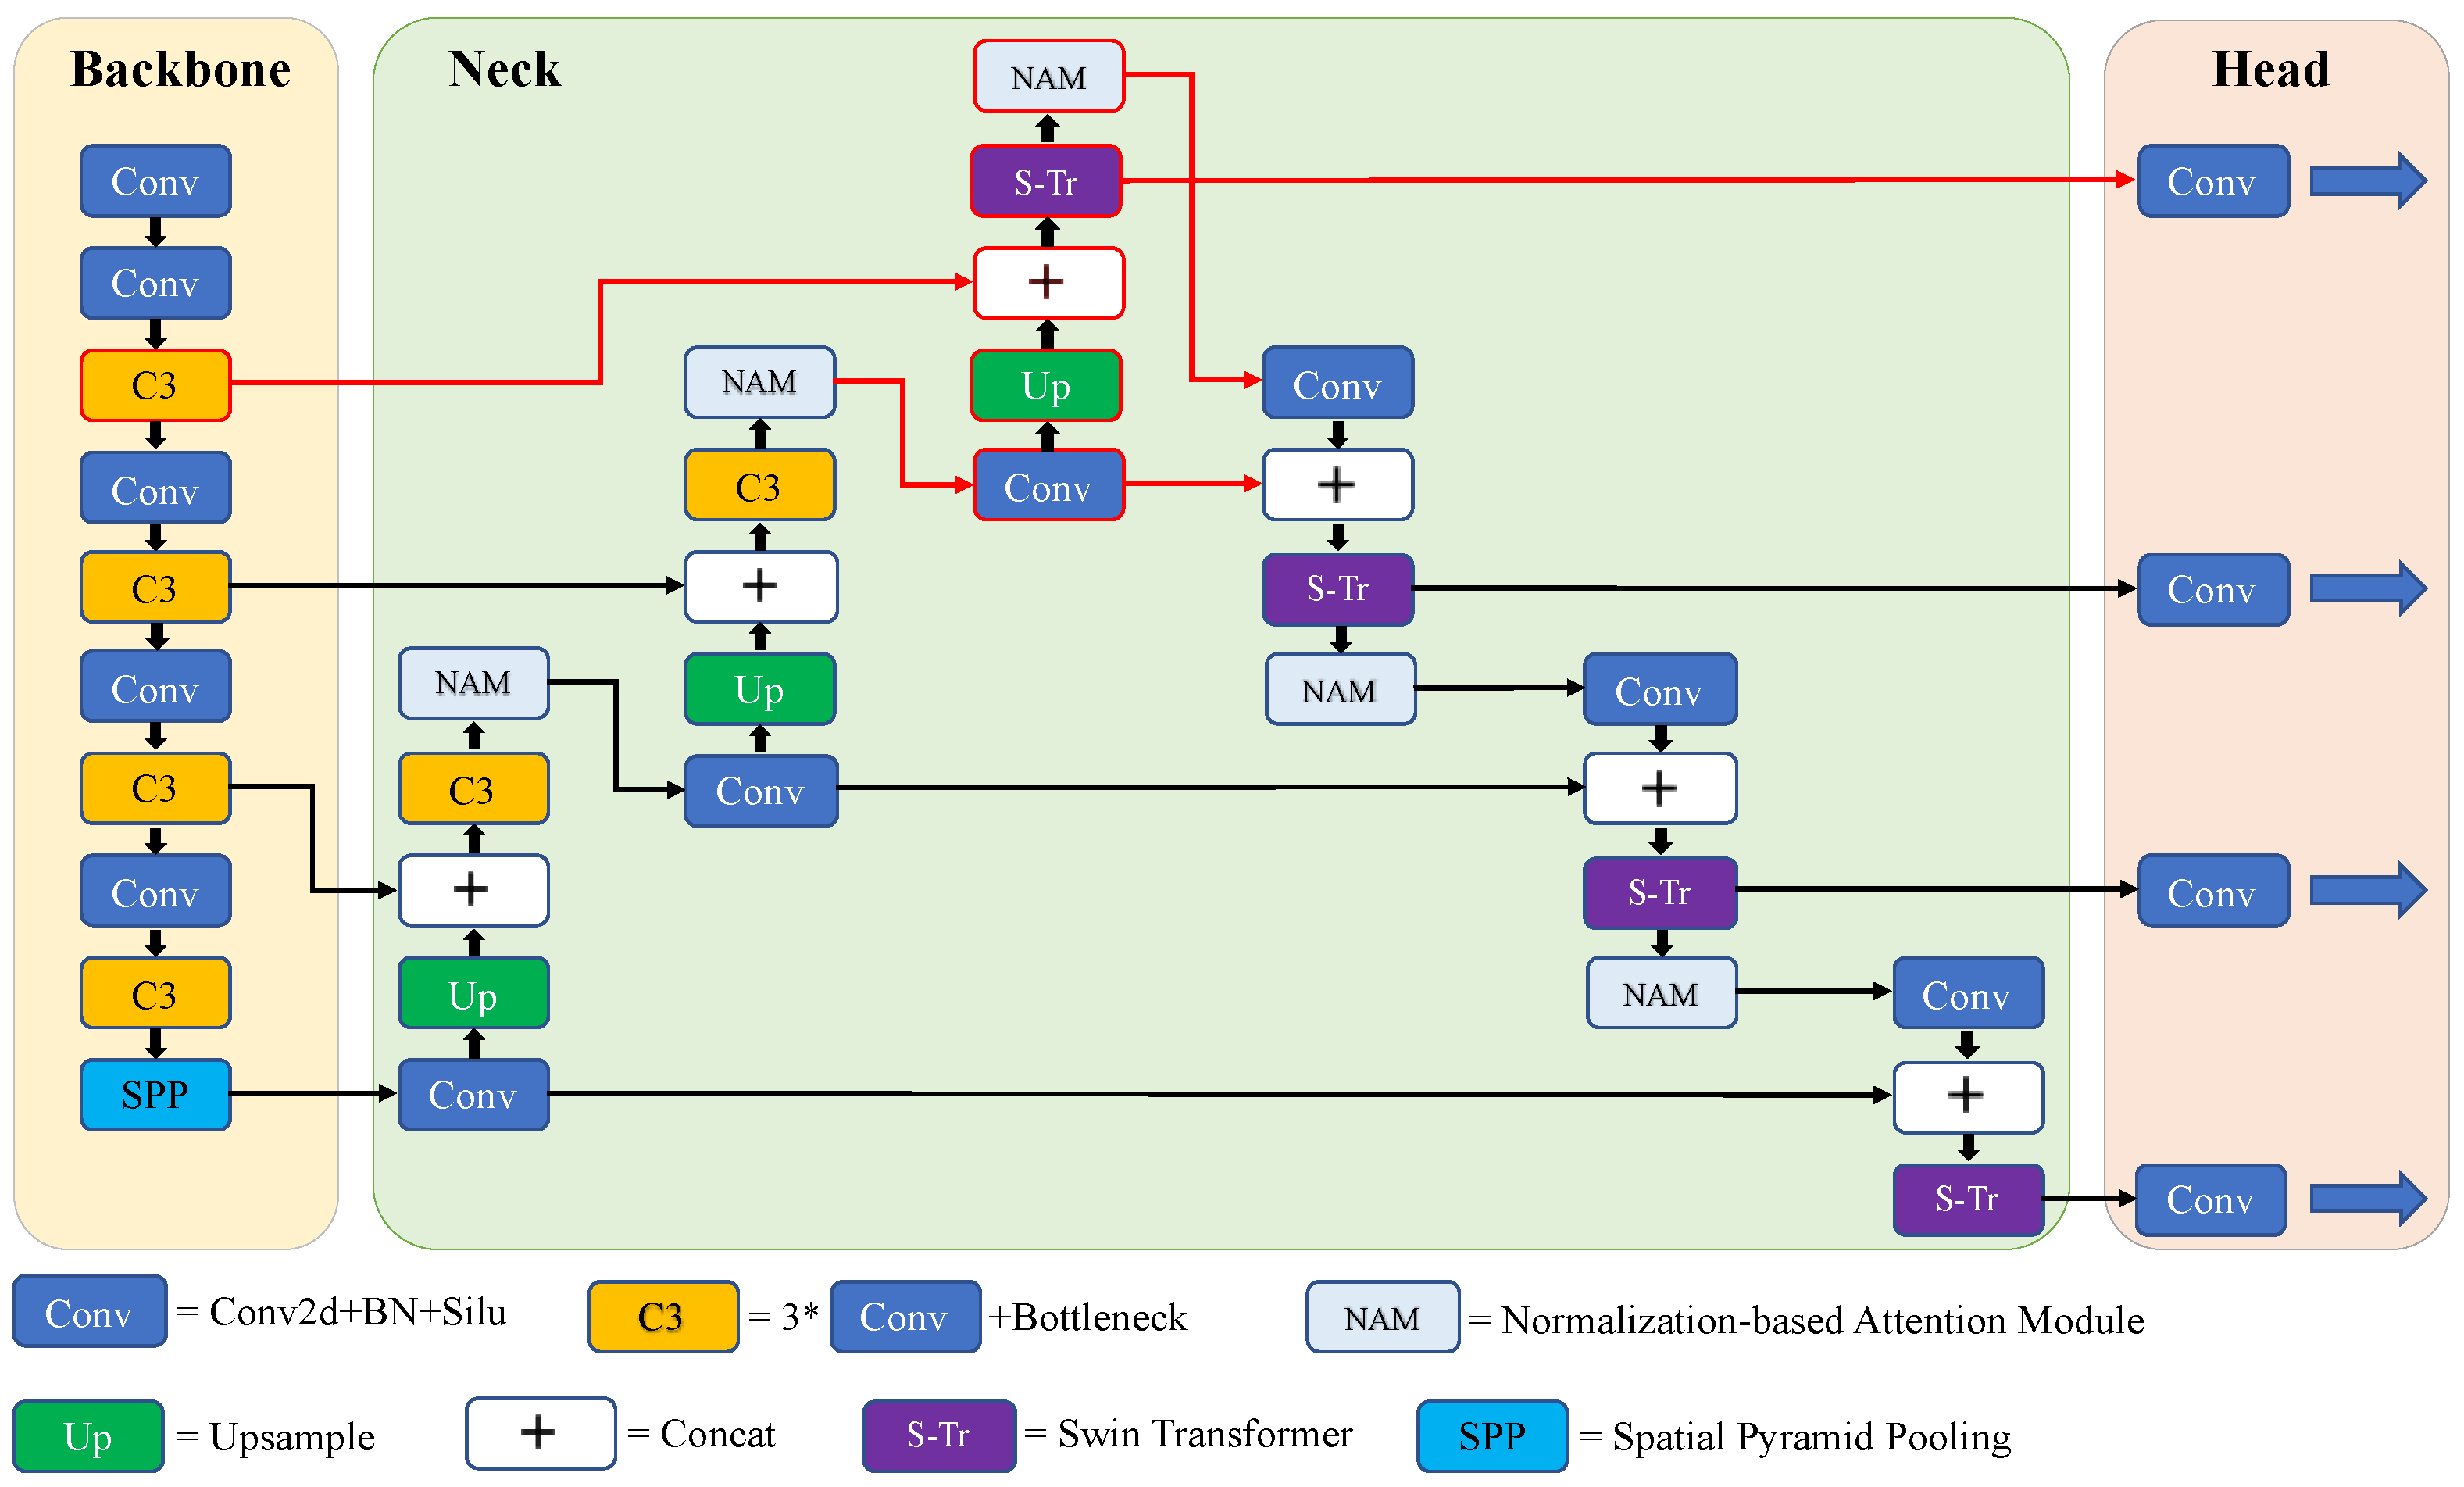
  • New feature fusion layers and prediction head are added from the shallow layer in YOLOv5 for the first time to detect small objects because it can maximumly preserve the feature information.
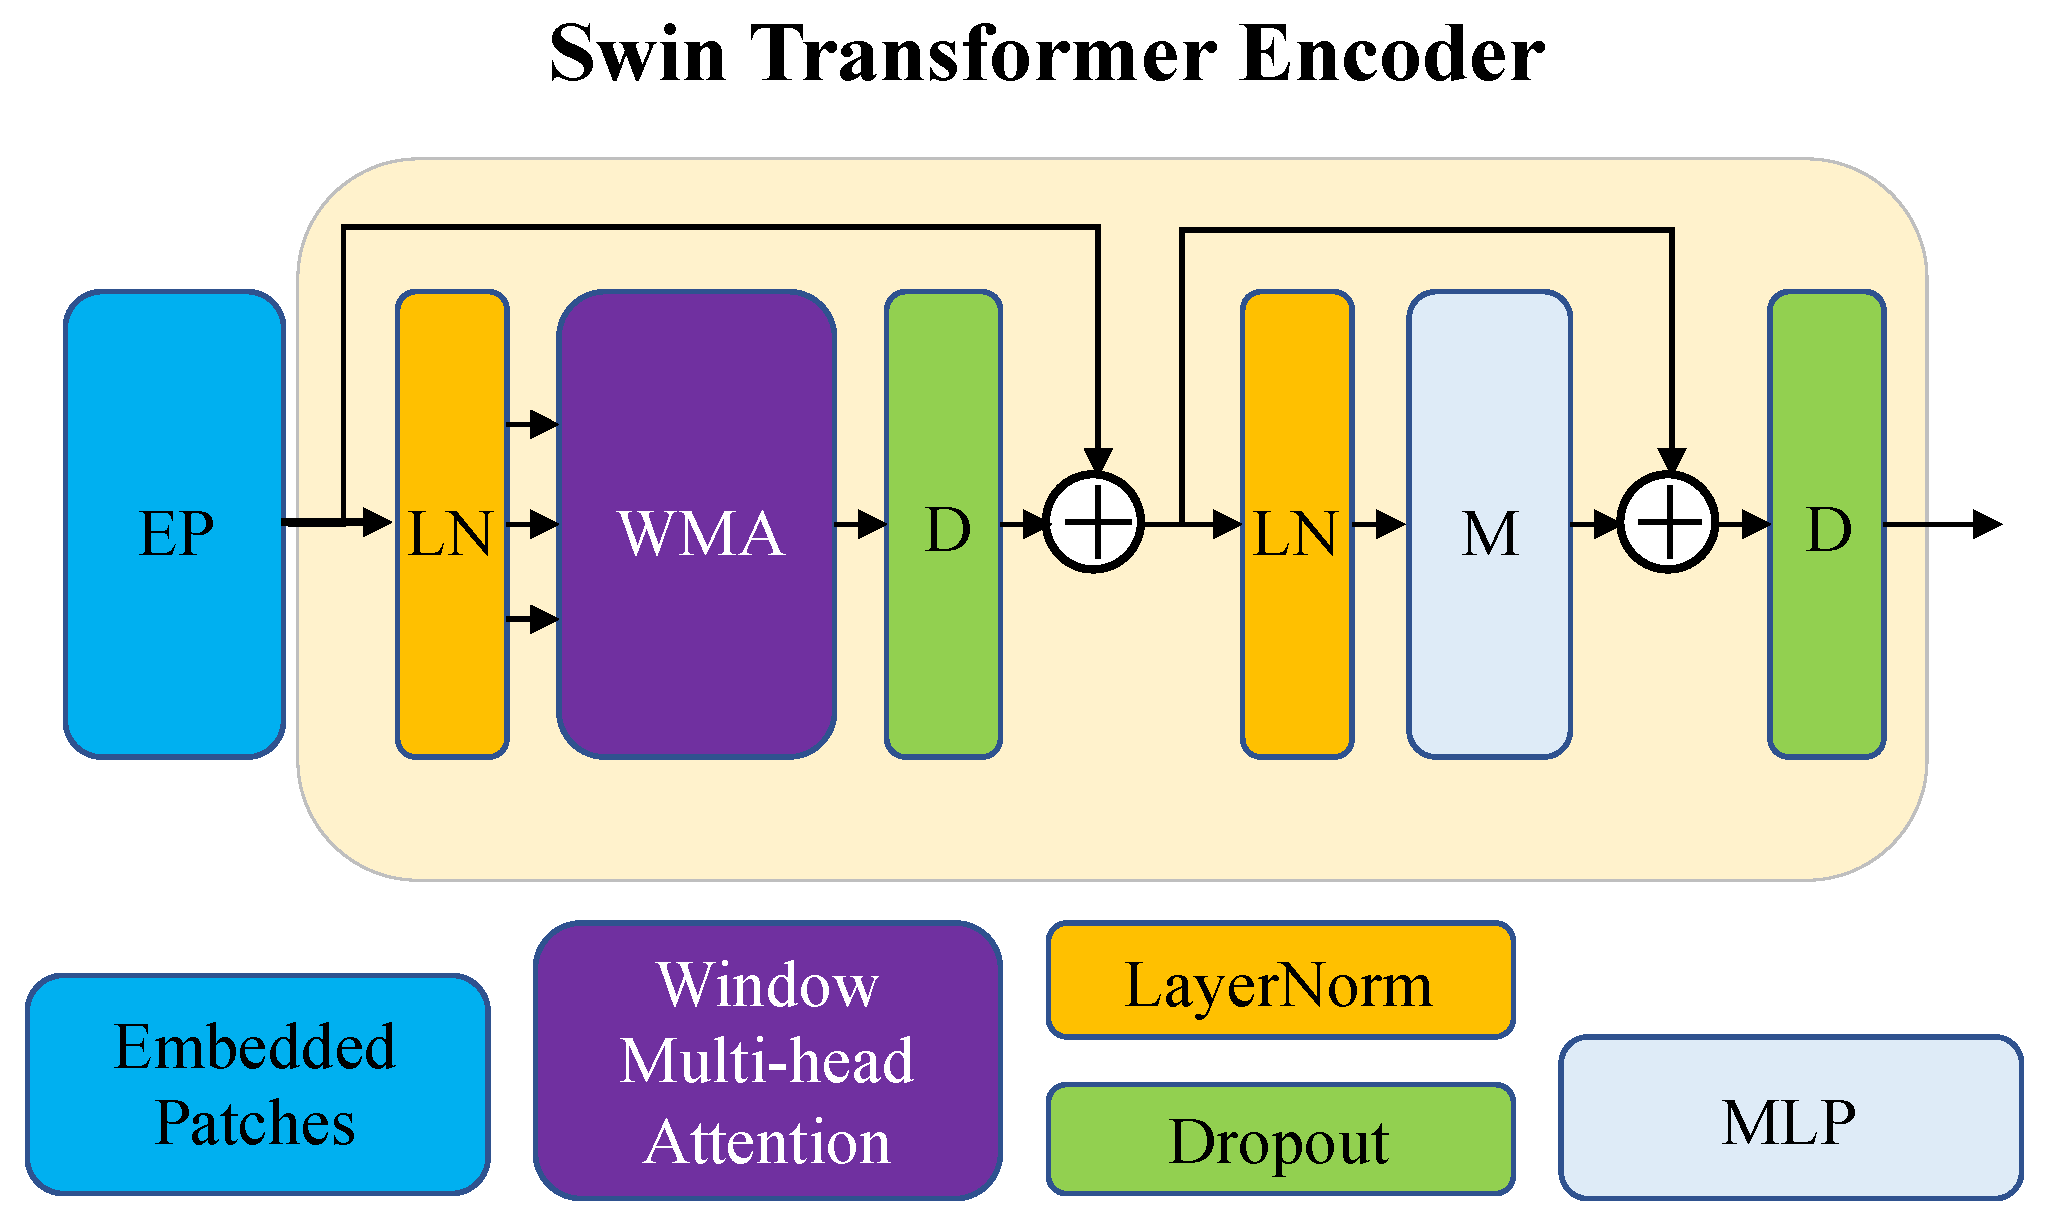
  • Original convolutional prediction heads in YOLOv5 are replaced with Swin Transformer Prediction Heads (SPHs) for the first time to reduce computational complexity.
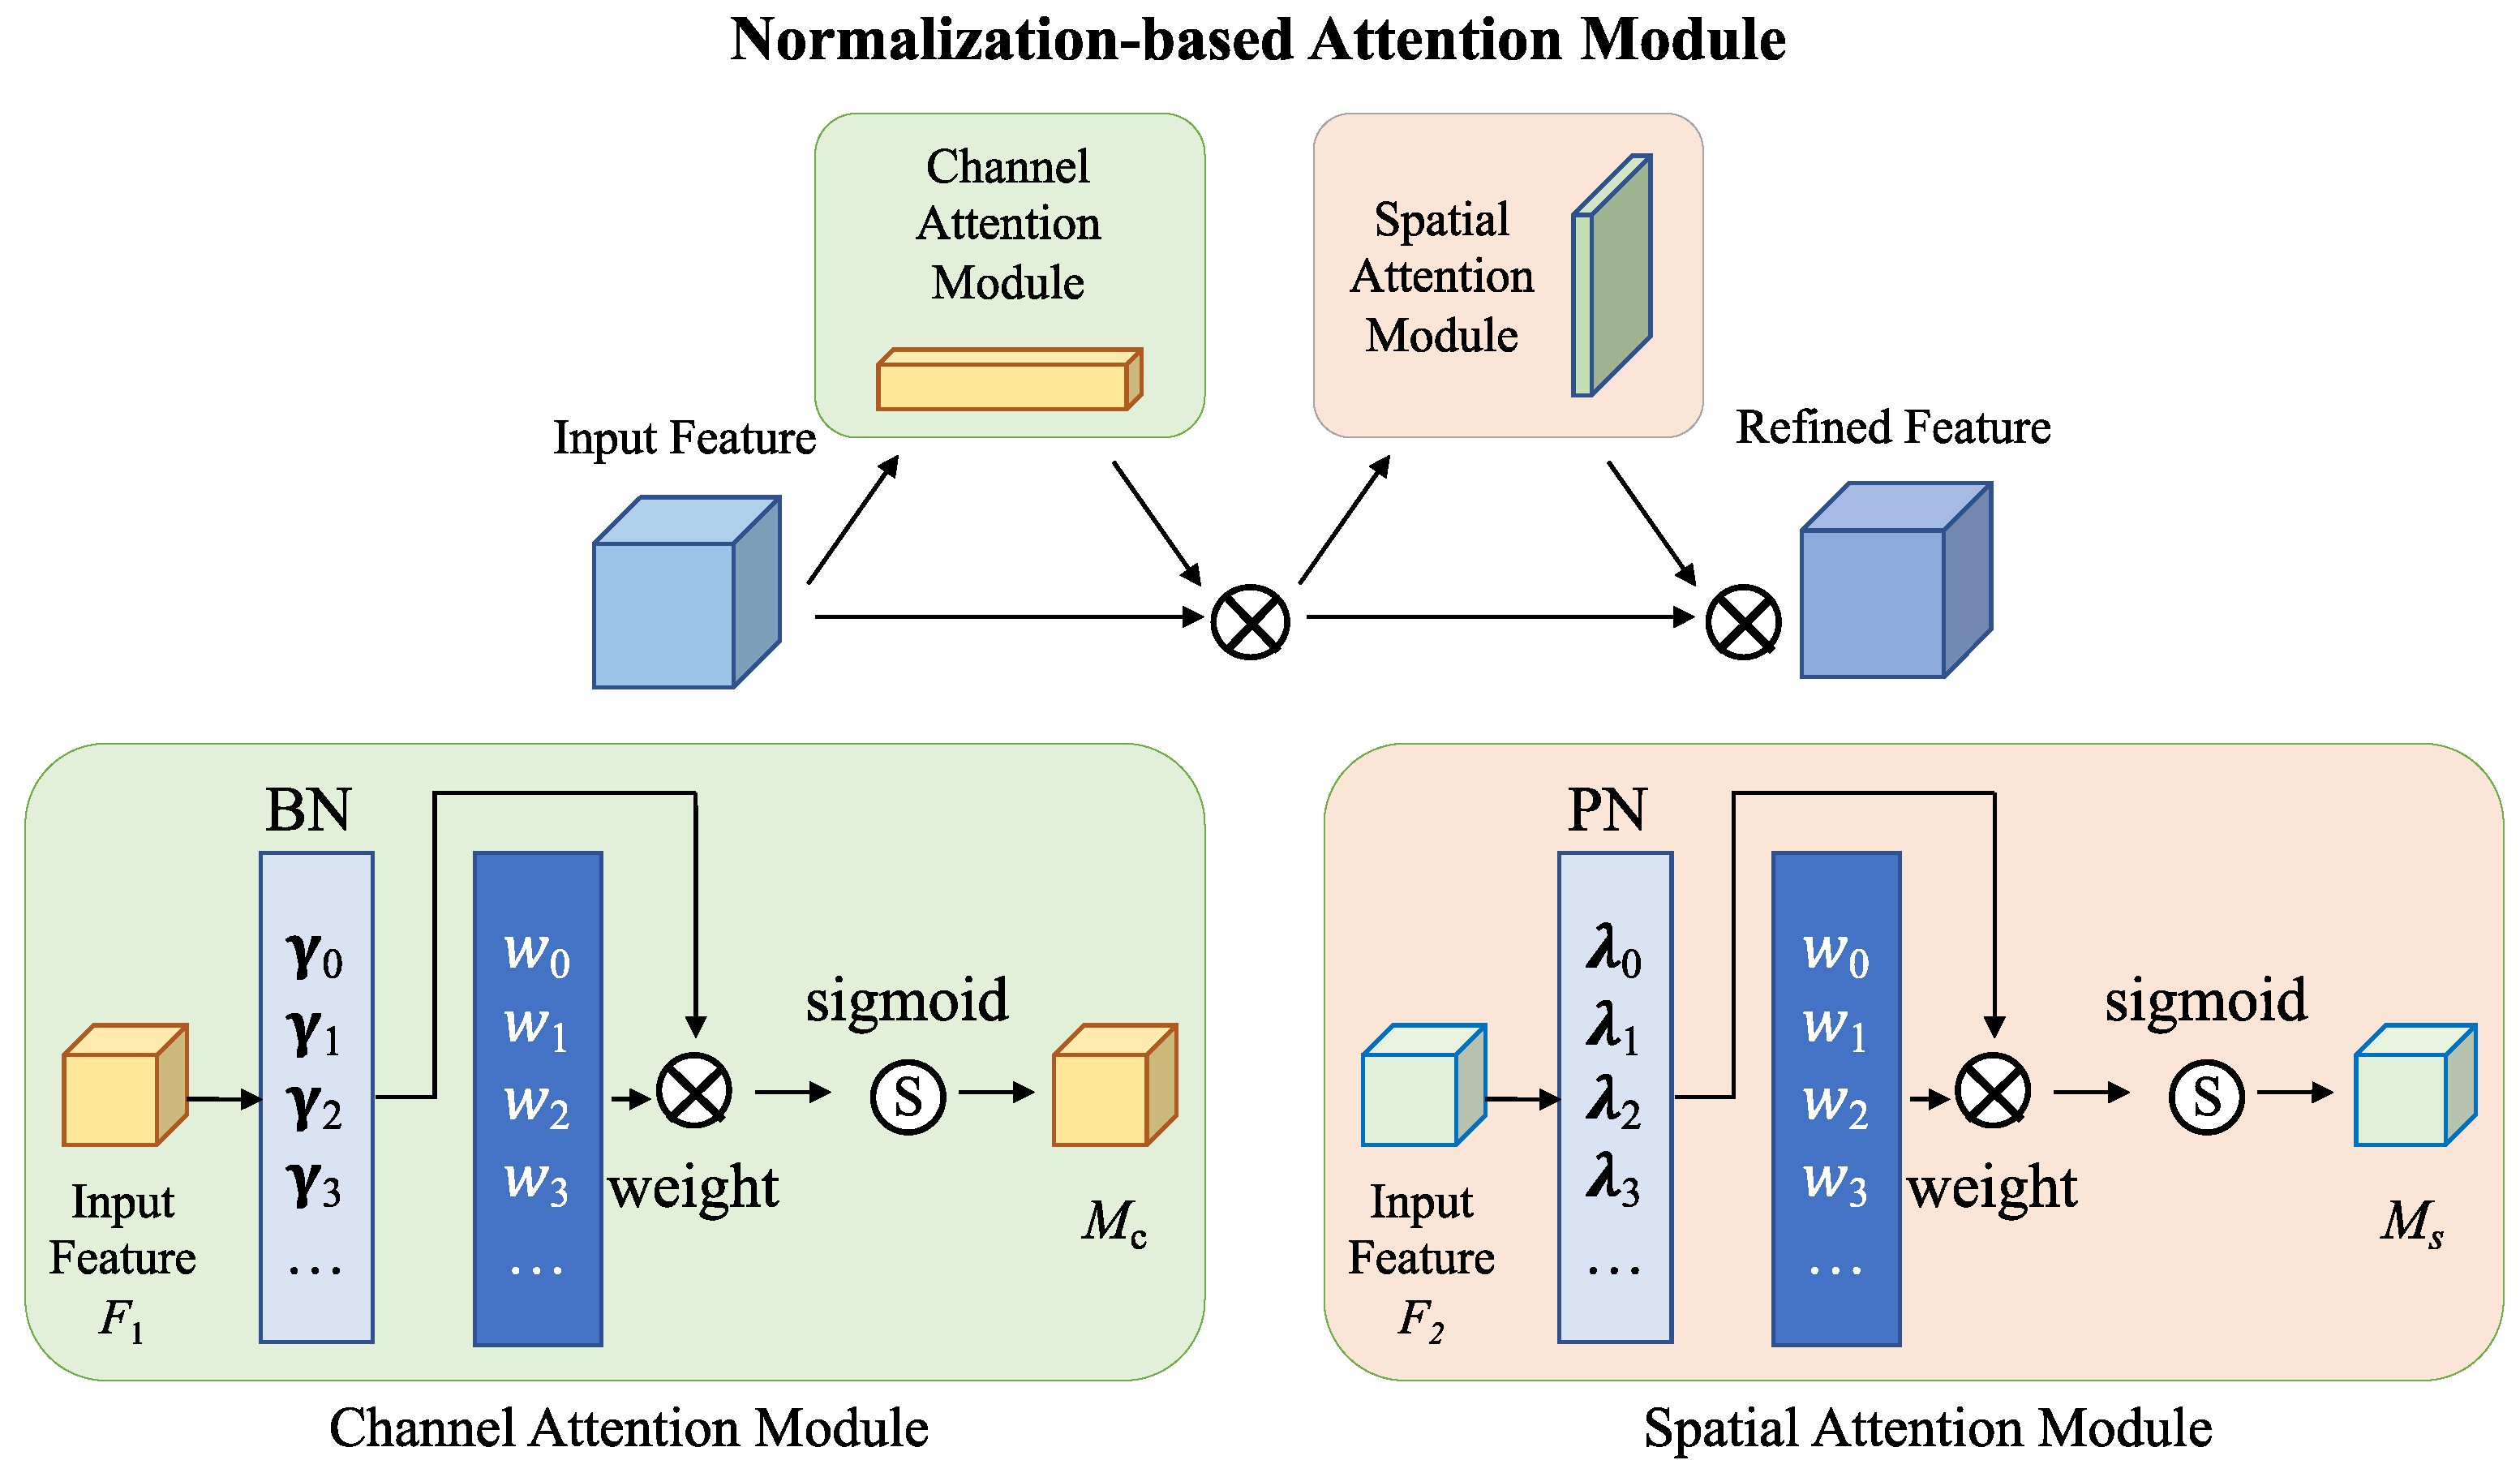
  • Normalization-based Attention Modules (NAMs) are integrated into YOLOv5 to add a sparsity penalty to the attention module to improve performance.
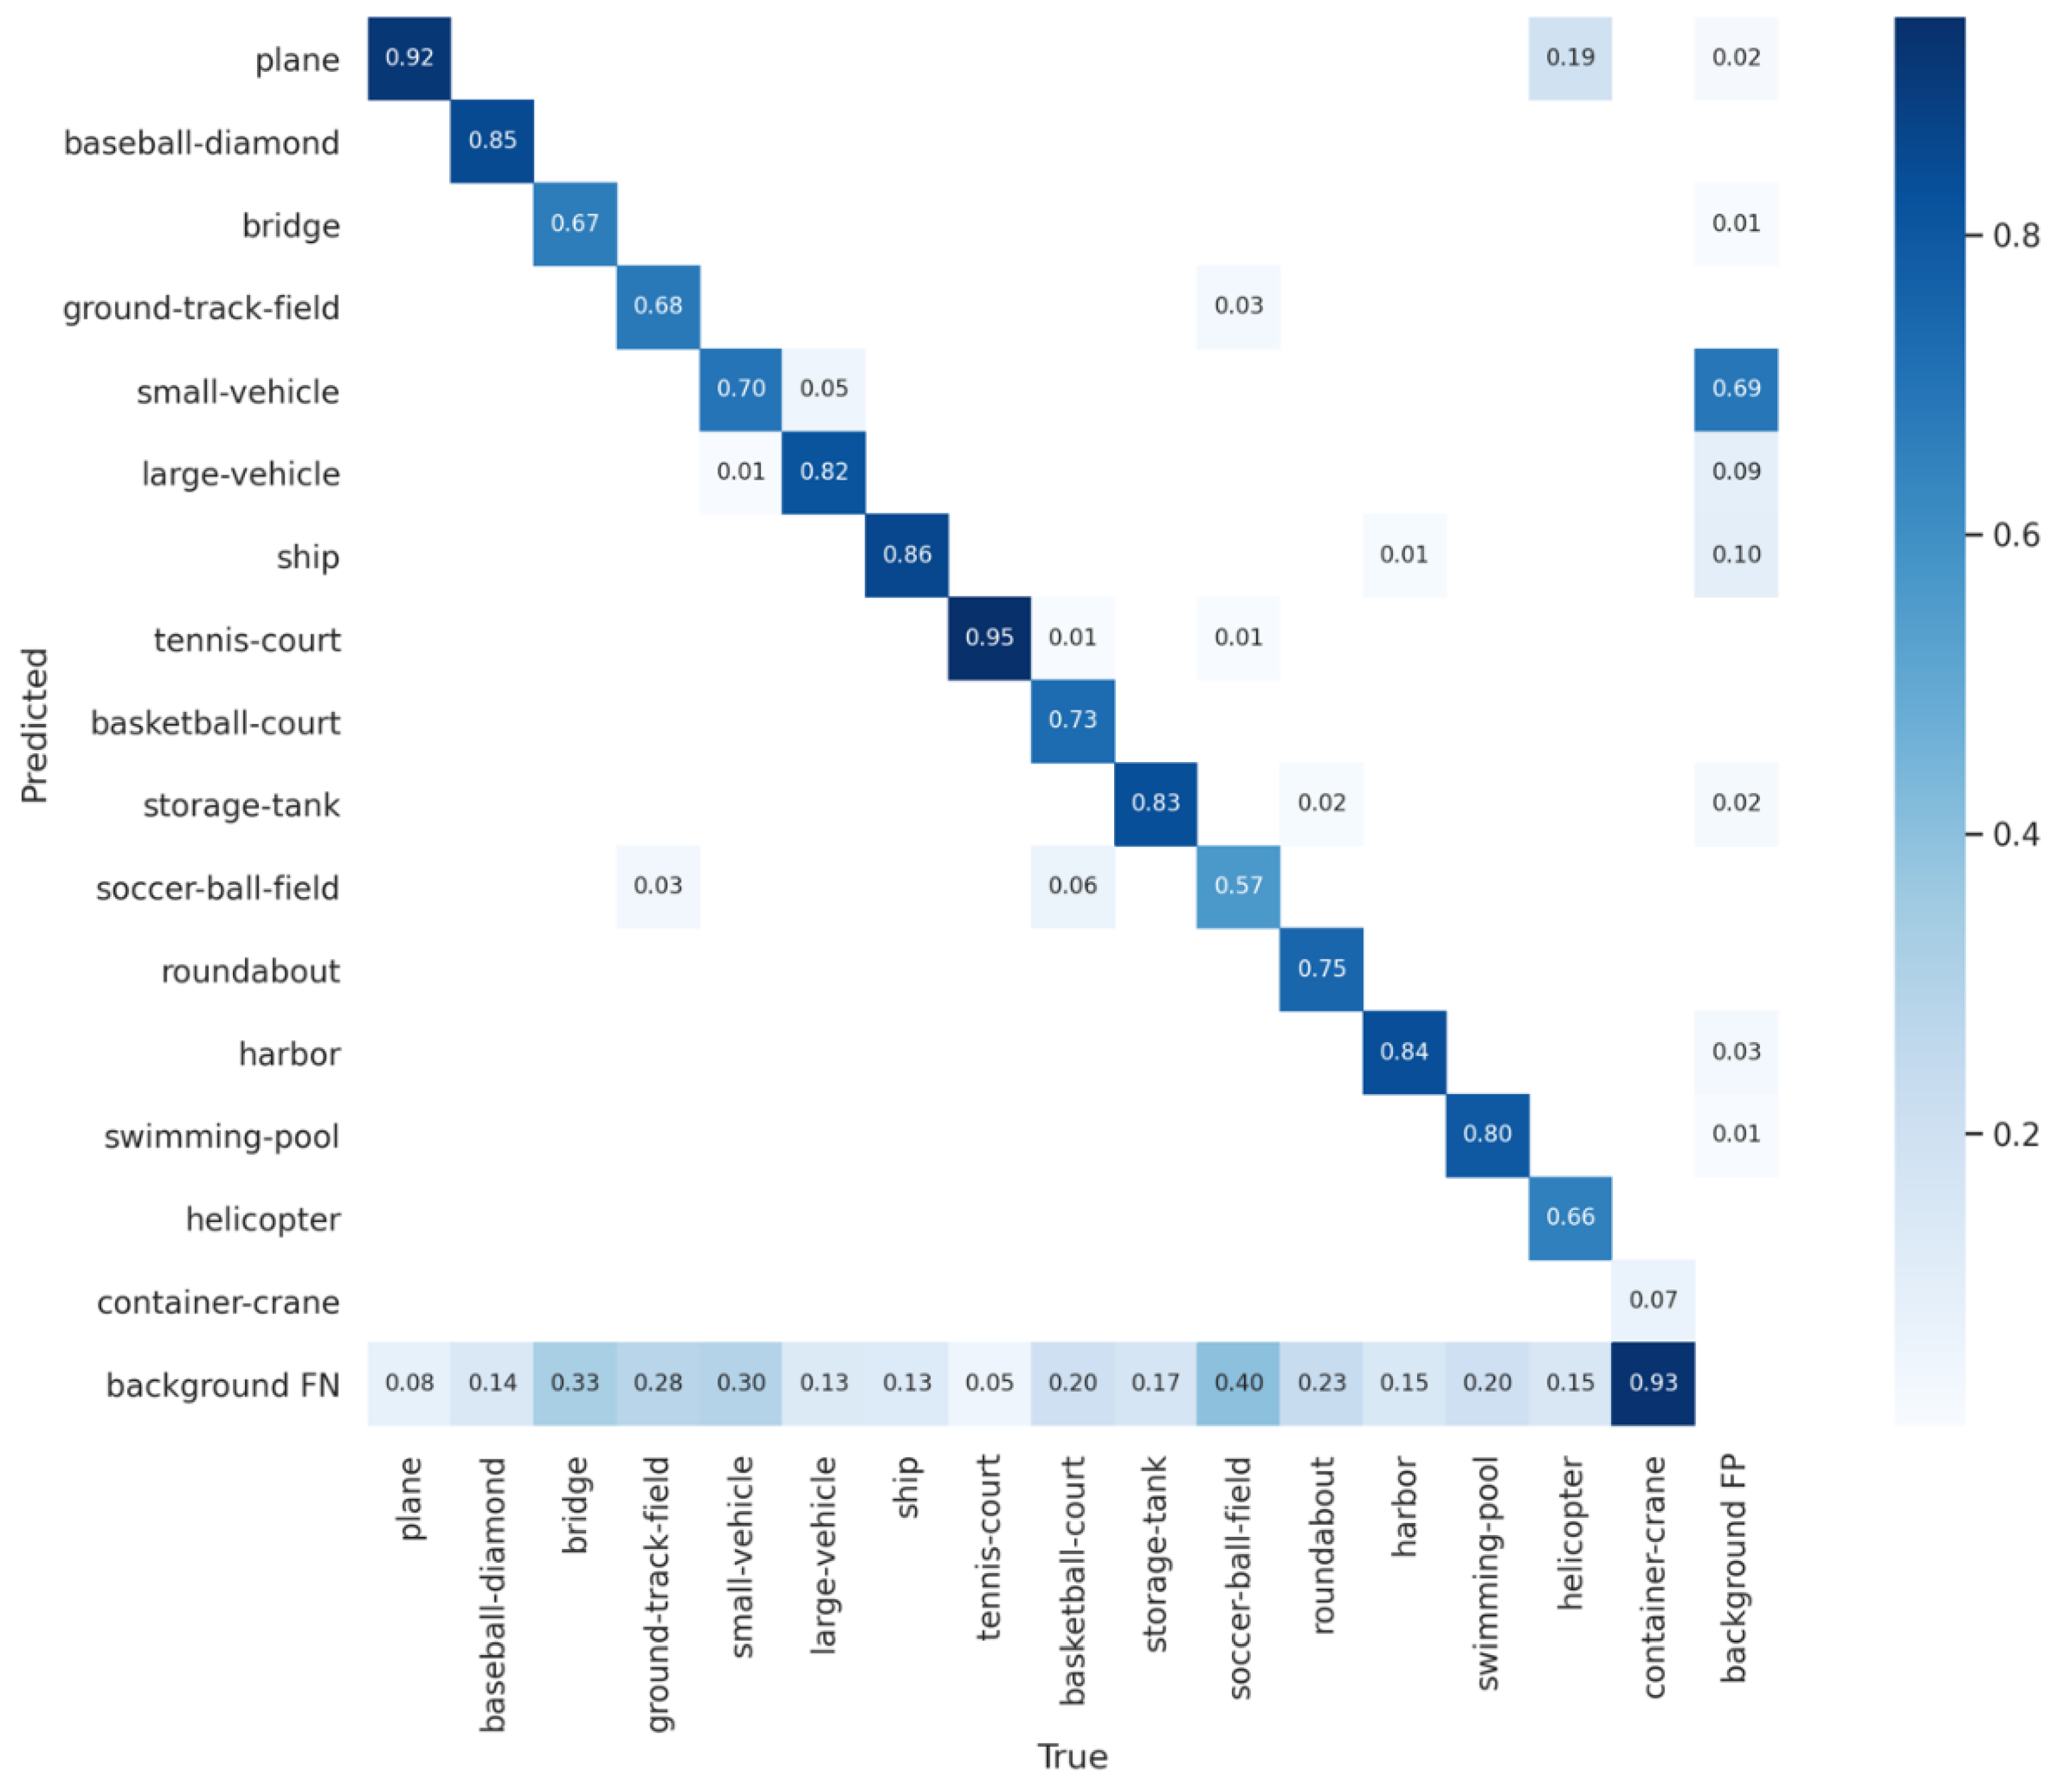
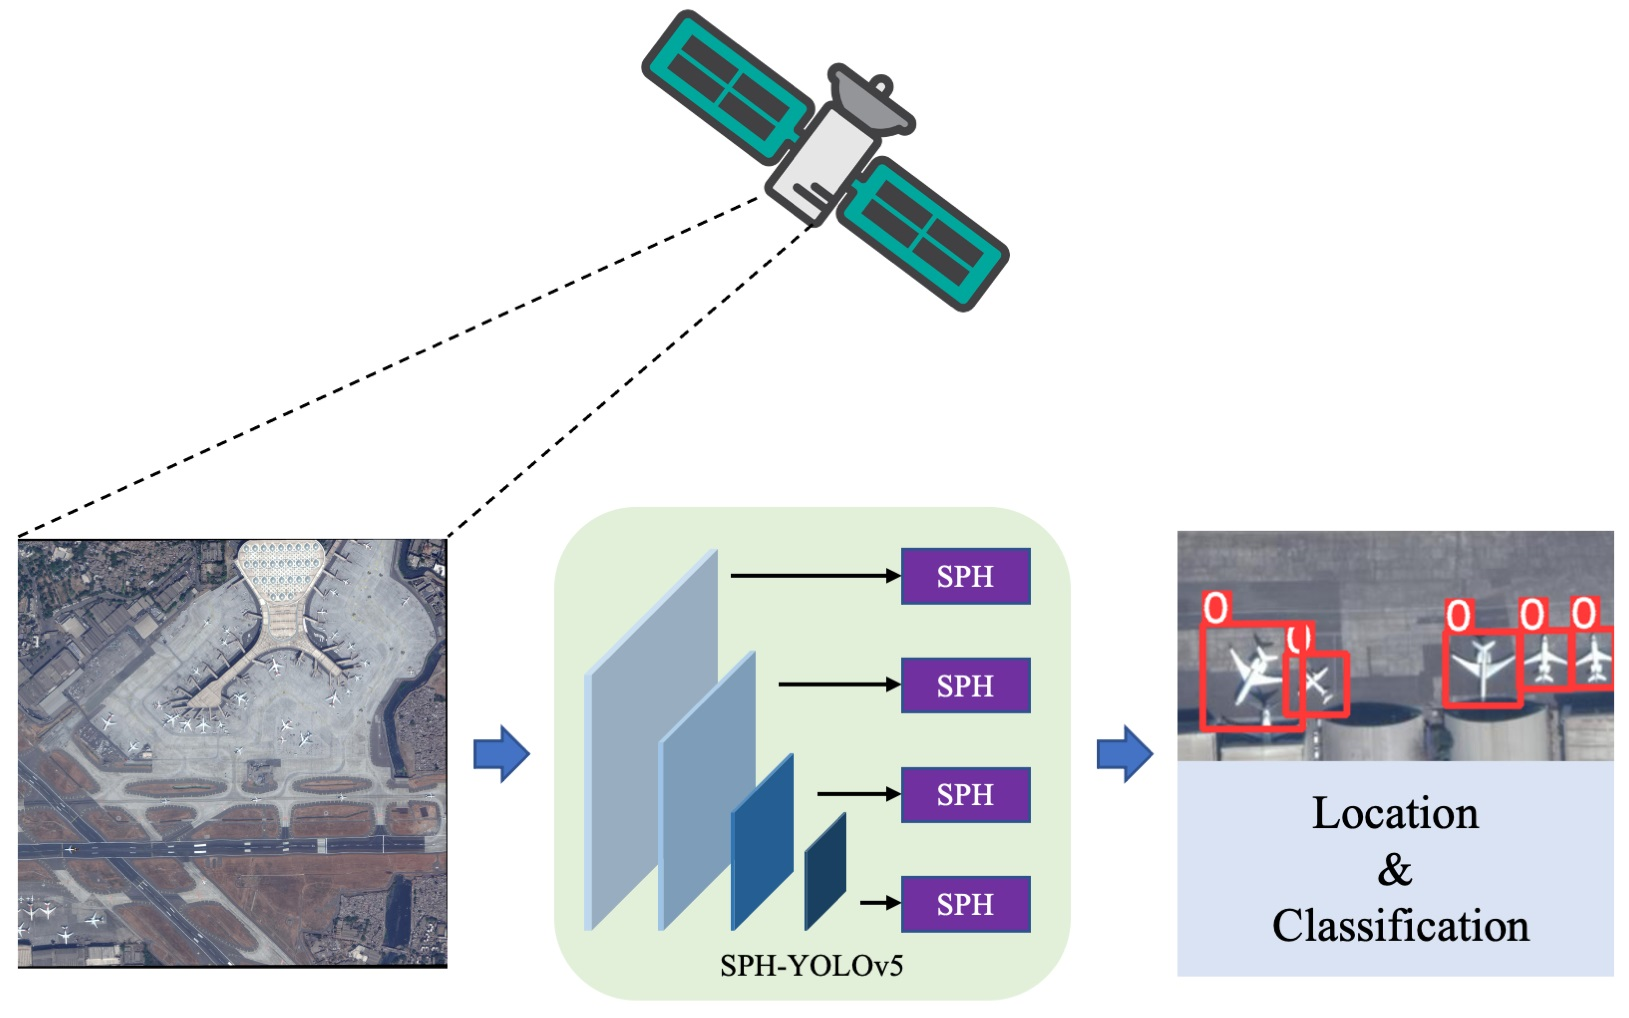
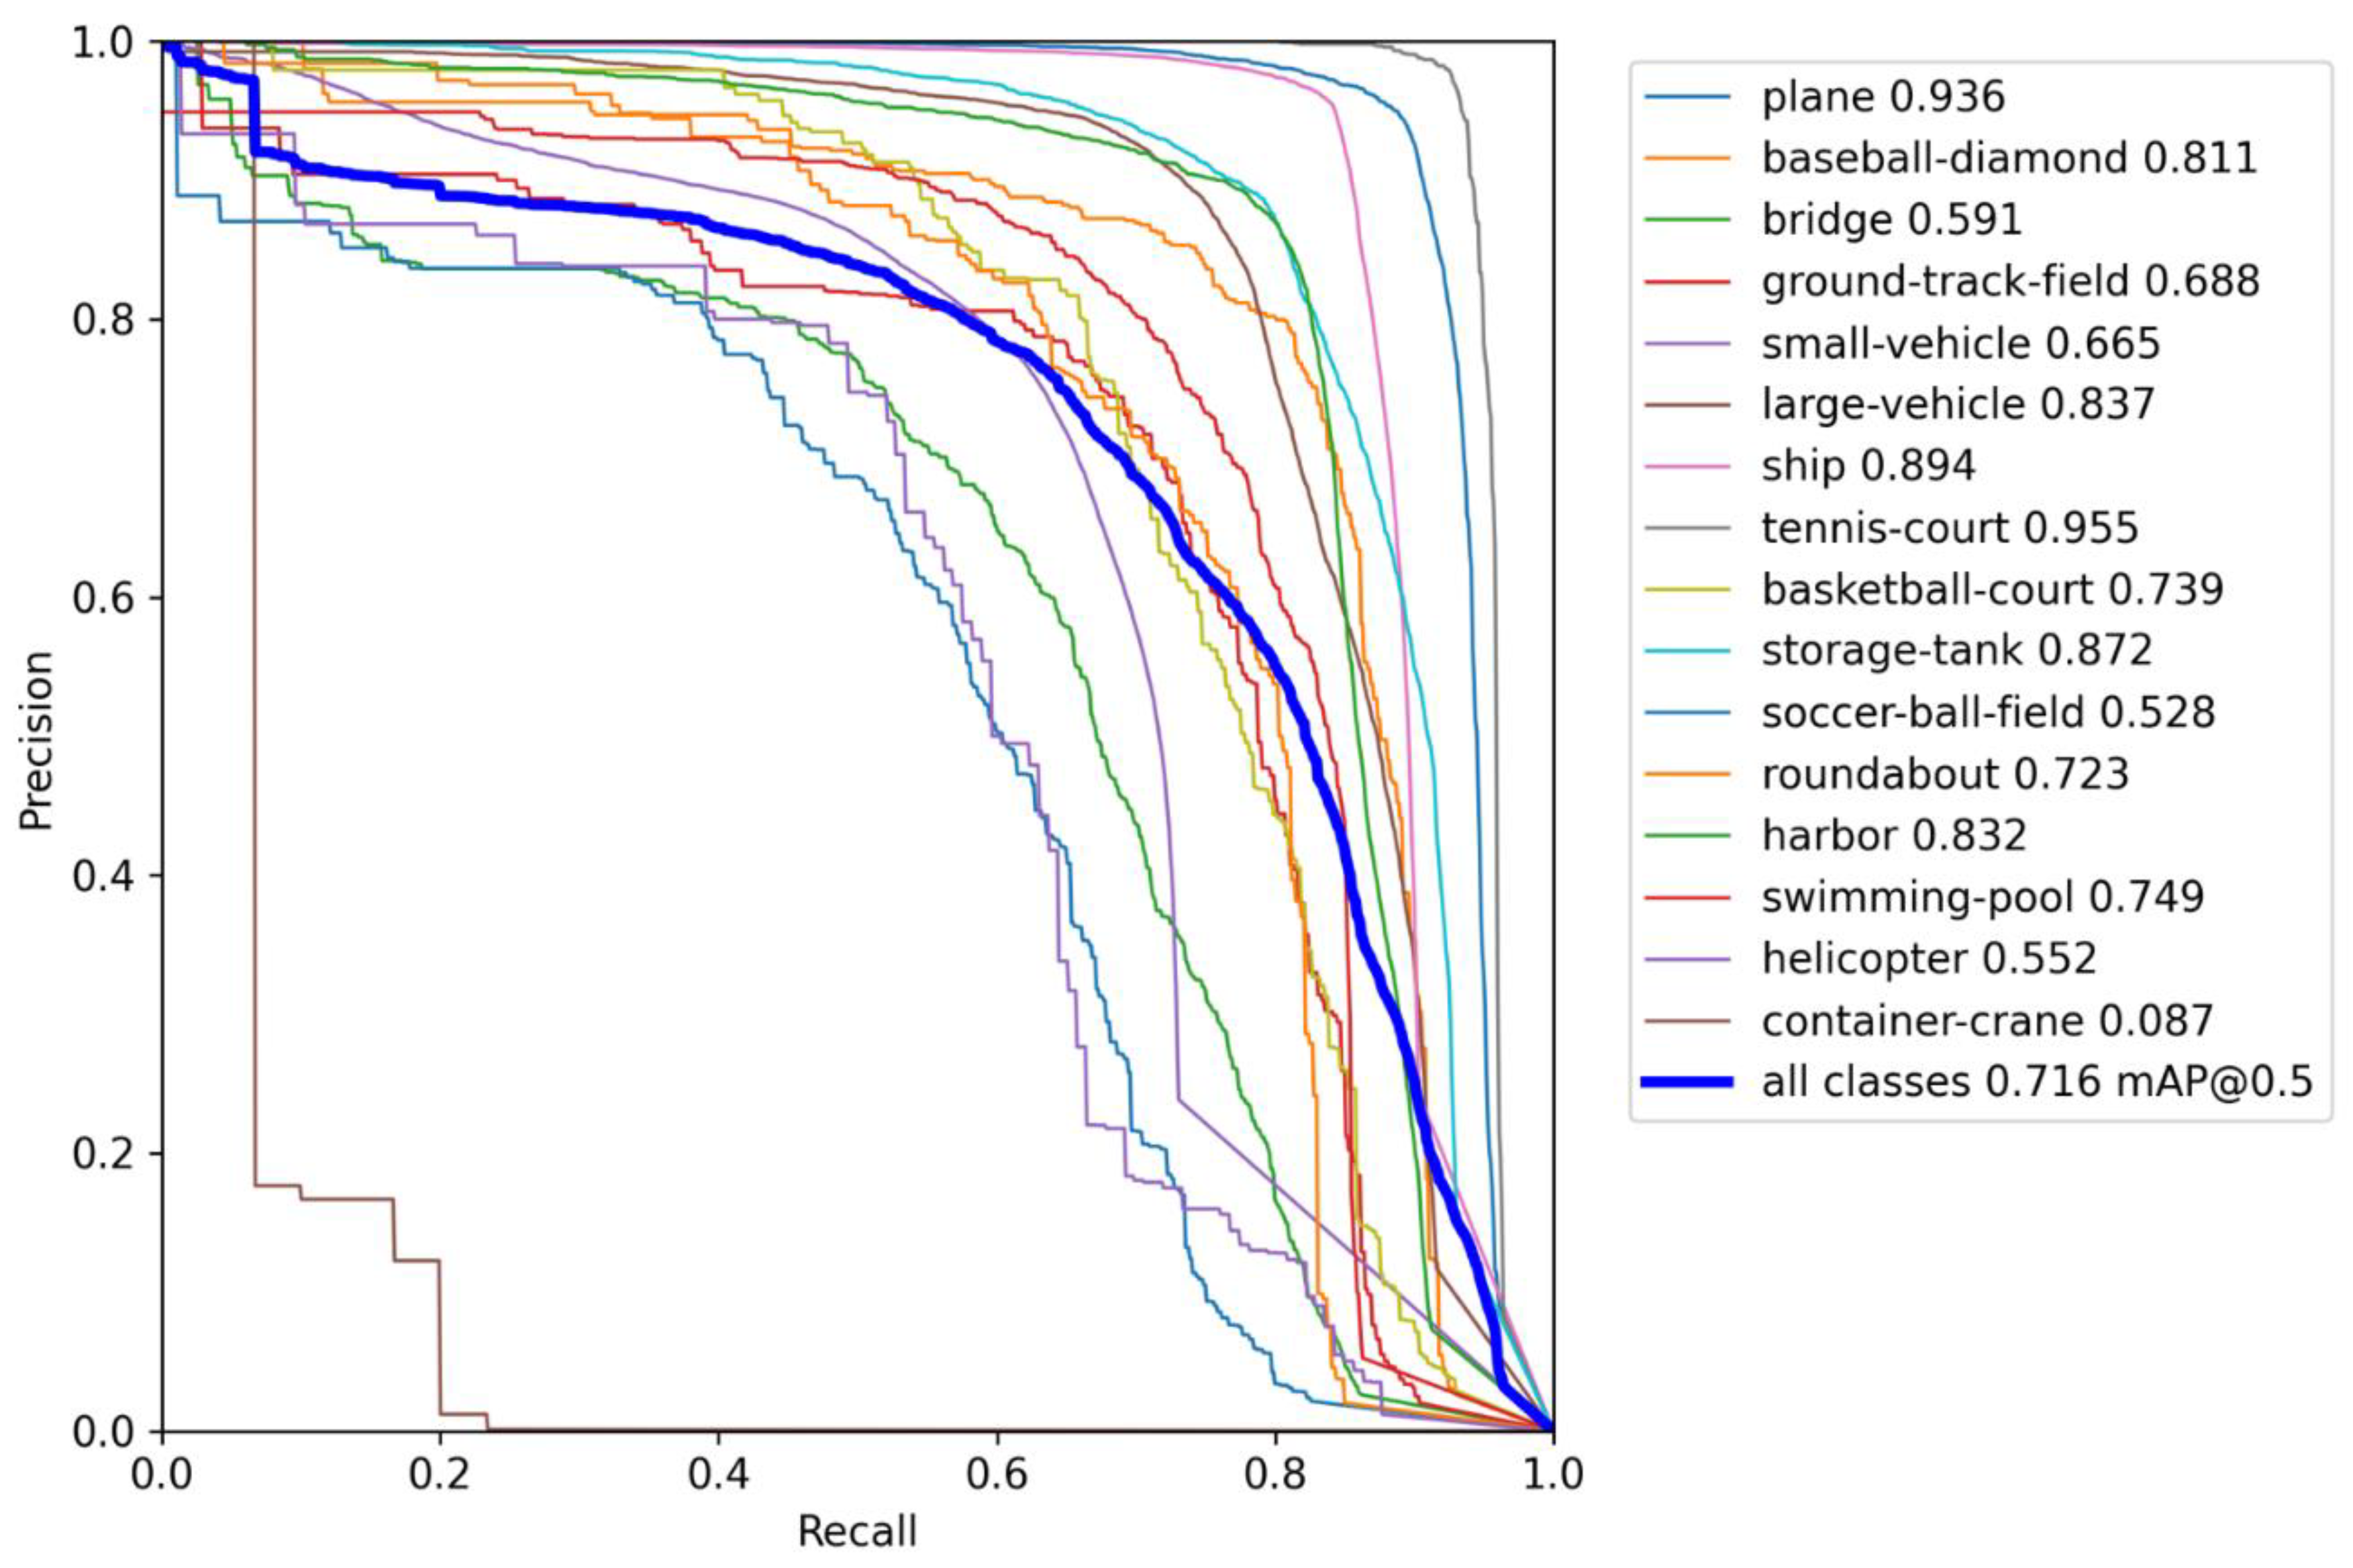
  • Our proposed SPH-YOLOv5 achieves 0.716 mean Average Precision (mAP) on the DOTA dataset with complex objects and 0.98 on the NWPU-VHR10 dataset with relatively simple objects, the best accuracy among the results of the existing models.

2. Related Work

2.1. Object Detection

Feature extraction is crucial for object detection because it can transform raw data into high-level feature representations. However, traditional model-driven approaches, such as Histogram of Oriented Gradients (HOG) [21] and Scale Invariant Feature Transform (SIFT) [22], usually take considerable time and staffing to deal with large datasets. In contrast, data-driven deep learning methods can automatically extract robust feature representations from the raw data, outperforming traditional extraction approaches. Furthermore, they can relieve the heavy load of traditional feature modeling and engineering. Recently, object detection frameworks based on deep learning have been broadly divided into two types: two-stage detection frameworks and one-stage detection frameworks [23].
The two-stage methods use the selective search algorithm to extract candidate regions in the first stage. Then, they take CNN to extract features from the candidate regions and finally apply the classifier for classification at the second stage. Region-CNN (R-CNN) [24] is a typical two-stage object detection algorithm. However, R-CNN fixes the size of the input image. To avoid this drawback, Spatial Pyramid Pooling Network (SPP-Net) [25] introduces spatial pyramid pooling, which can extract features from arbitrary regions, allowing the network to detect objects from the input images of various sizes and significantly reduce computational effort. Fast R-CNN [26] incorporates the strengths of SPP-Net and avoids the considerable overlap of region proposals in R-CNN. It proposes a shared feature extraction network for all candidate regions, which brings improvements in detection speed and accuracy. Unlike region proposal generation with the selective search in Fast-RCNN, Faster R-CNN [27] designs a Region Proposal Network (RPN) and proposes an anchor frame mechanism for region proposal generation, which brings a considerable boost. However, none of the above methods are end-to-end frameworks. The detection speed would be limited.
In contrast, one-stage methods directly predict bounding boxes and class probabilities end-to-end. They are faster and less computationally expensive than the two-stage models and have the capability of detection in real time. For example, Single Shot MultiBox Detector (SSD) [6] uses a fully convolutional network (FCN) for feature extraction and detects small and large objects from shallow and high-level feature maps, respectively. However, the one-stage object detector has a category imbalance problem; thus, its detection accuracy is lower than that of the two-stage object detector. RetinaNet [5] utilizes a focal loss to address the category imbalance problem, which guarantees detection speed while outperforming all two-stage detection algorithms simultaneously. YOLO [13] is another representative one-stage object detection algorithm that pursues extreme speed, which results in a low recall rate. YOLOv2 [14] replaces GoogleNet in YOLO with Darknet-19 as the feature extraction network to improve detection performance. Darknet-19 has fewer convolutional layers and more efficient performance. Meanwhile, YOLOv2 also introduces the prior anchor frame from the RPN to improve the recall rate. YOLOv3 [15] updates its feature extraction network from Darknet-19 into Darknet-53 with the multiscale framework and adds residual connection from ResNet [28]. It uses feature maps with three different scales for object detection to improve the detection accuracy of small objects. YOLOv4 [16] designs a Cross Stage Partial (CSP) structure based on Darknet53 to form a backbone network to reduce the computational effort further and enhance the gradient performance. Furthermore, it introduces CIoU loss [29] and Mish activation functions [30] to further improve detection accuracy. Besides, the powerful Scaled-YOLOv4 [31] offers a range of linearly scaled object detection models for engineering applications. As the latest and strongest generation of the YOLO series, the YOLOv5 model inherits all the above advantages. On the MS COCO Val 2017 dataset, YOLOv5 reports the highest mAP of 55.4%, with an inference time of 19.4 ms per picture, and is now rated top among state-of-the-art object detectors. Therefore, in this paper, we used YOLOv5 as a benchmark framework for detecting satellite optical image objects.

2.2. Data Augmentation

Datasets are crucial for deep learning. However, creating plenty of satellite datasets is expensive and impractical. Data augmentation is a popular and effective way to improve detection performance. Multiple data augmentation strategies can expand the number of training datasets and enrich the diversity of datasets, thus enhancing the robustness and generalization ability of the detection model. Early data enhancement methods utilized distortion, rotation, and scaling to improve image classification accuracy [32]. Subsequently, geometric transformation data enhancement methods were developed, including random scaling, cropping, panning, and clipping. In addition, photometric transformations are also widely used. For example, changing the training data’s hue, saturation, and value to expand the dataset. There are also some more unique methods for enhancing multi-image fusion data. Mixup [33] expands the dataset by randomly weighting and mixing images from different categories in the training dataset. Cutout [34] randomly erases parts of the sample image and fills them with zero-pixel. CutMix [35] improves Cutout by not filling the erased part with zero-pixel, but with pixel values from other training images. Mosaic combines the advantages of the above methods. It is first proposed in YOLOv4, and the main idea is to randomly crop four images and stitch them into one image as training data. It greatly enriches the background of the images. However, stitching four images together inevitably increases the batch size. Therefore, batch normalization is required to calculate the four images. In YOLOv5, the combination of Mixup and Mosaic effectively expands the satellite dataset and dramatically improves object detection performance, especially for small objects. Therefore, our benchmark network combined Mixup, Mosaic, and traditional data augmentation strategies.

2.3. The Attention Mechanism

The attention mechanism originated from the studies of selective human attention to information. It allows neural networks to have the perception-adapted ability in computer vision tasks, specifically by making the model pay more attention to the essential parts of the input and thus extracting key features. The attention mechanism has also derived different representations in practice. Recurrent Attention Model (RAM) [36] pioneers the combination of attention mechanism with deep neural network. Recurrent Neural Networks (RNN) are fundamental tools for attention mechanism early. In order to implement spatial attention in CNN, Spatial Transformer Network (STN) [37] was proposed to automatically select the features of the region of interest and perform a spatial transformation of data with various deformations. Different from spatial attention, Squeeze-and-Excitation Network (SENet) [38] demonstrates a unique channel attention network that adaptively predicts possible essential features. Convolutional Block Attention Module (CBAM) [39] combines channel attention and spatial attention and is one of the most widely used lightweight attention modules to capture both spatial and channel features. The latest phase of research on attention mechanisms comes from self-attention, which originates from natural language processing. A novel non-local network [40] introduces self-attention into computer vision tasks and makes excellent progress in the field of object detection. Recently, without any convolutional and recurrent operations, various pure self-attention deep networks (named visual transformers) [41,42] have emerged, showing great potential for attention-based models with overall improvements in detection speed and detection performance and generalization capabilities [43]. For example, TPH-YOLOv5 with a transformer prediction head is developed for UAV images [44]. However, the transformer encounters obstacles in processing high-resolution images because the computational complexity of self-attention is quadratic to image size. Recently, the Swin transformer proposes a hierarchical transformer with shifted windows, significantly improving computational efficiency and detection performance [20].
Satellite images include both sparsely and densely distributed objects. Complex objects place higher demands on the feature extraction network. Generally, CNN extracts features with translational invariance, while the transformer does not have such visual features. CNN is good at extracting local information, while the Swin transformer is good at global modeling and has a stronger anti-interference ability. Due to the above characteristics, we expect to enhance the extraction of information features by combining CNN and the Swin transformer, to explore the representation potential of attention mechanisms, and to advance the development of object detection in satellite images.

3. Theoretical Model

3.1. Review of YOLOv5

The framework architecture of YOLOv5 consists of three main parts: backbone, neck, and predict head. The backbone extracts feature information from input pictures, and the neck combines the gathered feature information and creates three different scales of feature maps. The prediction head detects objects based on these created feature maps. YOLOv5 employs the CSPDarknet53 framework with an SPP layer as the backbone, the PANet as the neck, and the YOLO detection head. YOLOv5 can calculate the best anchor frame value by adapting the clustering algorithm in different training datasets. In addition, YOLOv5 has tried various combinations of activation functions, such as sigmoid, leaky-ReLU, and SiLU [45]. There are five derived models for YOLOv5, including YOLOv5n, YOLOv5s, YOLOv5m, YOLOv5l, and YOLOv5x. They have the same model architecture, but different model widths and depths. The smaller models are faster and are usually designed for mobile deployment. The larger model is more computationally intensive, but has a better performance.

3.2. SPH-YOLOv5

The architecture of our proposed SPH-YOLOv5 for object detection on optical satellite images is depicted in Figure 1.

3.2.1. Proposed Prediction Head for Small Objects

The SPH-YOLOv5 backbone network contains continuous down-sampling convolutional layers, so the feature map decreases as the network deepens during feature information extraction. The small size of the feature map affects the detection of small objects in the image. Unfortunately, satellite images contain a large number of small objects. To enhance the feature fusion effect of small objects, we added an extra prediction head and residual connections from the shallower backbone network. They bring the low-level, high-resolution feature information into the feature fusion layer, making the added prediction head more sensitive to small objects. Finally, four different scale features of the prediction head are more adaptable to the dramatic changes in the scale of the satellite image objects.

3.2.2. Normalization-Based Attention Module (NAM)

The NAM is the variant of the CBAM module [44,46], which was originally proposed for image classification. As shown in Figure 2, it includes redesigning channel and spatial attention submodules in sequence. They can reweight attention by adjusting the variance measurement of the training weights in both channel and spatial dimensions. One of the vital scaling factors comes from batch normalization (BN).
B o u t = B N ( B i n ) = γ B i n μ b σ b 2 + ε + β ,
where γ and β represent the trainable scale and shift parameters, respectively; and μ b and σ b are the mean and standard deviation in each batch b , respectively. The scaling factor γ is the variance in BN. A larger variance means more variation and richer information. More attention can be given to important channels based on γ normalized correlation weights W γ for the channel attention module, and less informative weights will be suppressed. Let us suppose F 1 R H × W × C is the input feature map, where H , W and C represent the height, width, and number of channels, respectively. The output M c of the channel attention can be expressed as
M c = s i g m o i d ( W γ ( B N ( F 1 ) ) ) .
In the manner of the channel attention module, its spatial attention module applies BN to pixels in the spatial dimension. It is the so-called pixel normalization (PN). It focuses on the more informative pixels according to the scaling factor λ and adjusts the associated weights W λ . Similarly, F 2 R H × W × C is the input feature map and the output M s of the spatial attention models is:
M s = s i g m o i d ( W λ ( P N ( F 2 ) ) ) .
To suppress the less important weights, NAM adds a regularization term to the loss function,
L o s s = ( x , y ) l ( f ( x , W ) , y ) + p g ( γ ) + p g ( λ ) ,
where l ( ) and g ( ) represent the loss function and l 1 norm penalty function, respectively; x and y are the input and output, respectively; W is the network weight; and p is the equilibrium penalty factor.
In satellite images, the comprehensive imaging coverage can introduce complex background interference. It has been demonstrated that CBAM in TPH-YOLOv5 for UVA images can inform the network on what to focus on and where to focus using spatial and cross-channel feature connections. Nevertheless, NAM improves CBAM in weight normalization, bringing a clean module and higher computational efficiency. The neck is the crucial link between the top and bottom of the object detection framework. It reprocesses and rationalizes the important features extracted from the backbone to facilitate the object prediction of the head in the next step. Therefore, we inserted the NAM module after each concatenation operation before inputting the following feature layer in YOLOv5’s neck. It can help to refine the fused feature information in the neck. In this study, we added five NAM modules to the neck of SPH-YOLOv5, aiming to refine the channel and spatial information of the feature fusion layer. It can help the model to focus more on the object’s key messages in a complex environment. Furthermore, the increased computational cost is inconsiderable because of its lightweight design.

3.2.3. Swin Transformer Encoder Block

Inspired by the visual transformer, researchers have developed a superior network by combining CNN with the transformer. The transformer has a more vital ability to capture global information than CNN and performs better for dense and occluded objects in satellite datasets. We took both and fused them in the network by adding four Swin transformer encoder blocks to every prediction head.
Given a feature map X R H × W × C , after linear projection and reshape operations, the feature map becomes Q ,   K ,   V R N × C to feed self-attention, where N = H × W . The output of self-attention is expressed as:
Z = A V ,
A = s o f t m a x ( Q K T ) ,
where A R N × N is the attention matrix representing the relationship between all elements on the feature map and other elements. The output Z aggregates global information. The actual computation of the transformer is performed in parallel, where the inputs are computed separately and then integrated, considering the correlation. It is called Multi-head Self Attention (MSA). MSA generates an attention matrix by integrating multiple independent subspaces used to compute self-attention. This process is the core of transformer.
However, we found in our experiments that the transformer consumes enormous computational resources when processing high-resolution satellite images because the computational complexity of MSA in transformer is proportional to the quadratic image size. To improve the computational efficiency of self-attention, we introduced the Swin transformer encoder blocks into the prediction header of our SPH-YOLOv5. Its structure is shown in Figure 3. Each Swin transformer encoder contains two sub-layers. The first sub-layer is Window Multi-head Self-Attention (W-MSA). It divides the feature map into separate windows in a non-overlapping manner, and then self-attention is computed in these local windows. For a feature map X R H × W × C with a local window of size m × m , the computational complexity Ω are:
Ω ( MSA ) = 4 H W C 2 + 2 ( H W ) 2 C ,
Ω ( W - MSA ) = 4 H W C 2 + 2 ( H W ) 2 C .
The computational complexity is significantly reduced since the window size is much smaller than the image size. The second sublayer (MLP) is a fully connected layer. A residual connection between W-MSA and MLP is added to counteract gradient disappearance and degradation of the weight matrix.

3.2.4. Comparison with TPH-YOLOv5

According to the above statements, it is easy to deduce the difference between our proposed SPH-YOLOv5 from TPH-YOLOv5 in ref. [44]. First, TPH-YOLOv5 focuses on UAV images, while our SPH-YOLOv5 aims for satellite images with smaller objects and weaker information than the UAV images. Second, TPH-YOLOv5 only adds a transformer prediction head. In contrast, we added not only a Swin transformer prediction head, but also another C3 module in the backbone network. The backbone network in TPH-YOLOv5 has only three C3 modules, but we had four C3 modules to retain the features of small objects better. Third, TPH-YOLOv5 uses a general transformer that is not adaptable to processing higher resolution satellite images. In contrast, our SPH-YOLOv5 introduces the Swin transformer to compute self-attention with sliding windows to achieve a higher computational efficiency and a better performance on higher resolution satellite images. Finally, we upgraded the CBAM in TPH-YOLOv5 to NAM to reduce fully connection layers and improve the attention module in a normalized way. As a result, our proposed SPH-YOLOv5 has a competitive performance on the public higher resolution satellite images dataset, as demonstrated in the following section.

4. Experiments

To validate the effectiveness of our proposed model, we conducted experiments on two widely used satellite image datasets, NWPU-VHR10 [47] and DOTA [48].

4.1. Datasets and Evaluation Metrics

The NWPU-VHR10 dataset contains 800 high-resolution RGB satellite images, including 715 images with a spatial resolution of 2 m and 85 images with a spatial resolution of 8 cm. The image size is almost close to 1000 × 1000. It was cropped from the Google Earth and Vaihingen datasets and then manually annotated by experts. The dataset is divided into ten categories (aircraft, ships, storage tanks, baseball fields, tennis courts, basketball courts, surface runways, ports, bridges, and vehicles) and includes background images without objects.
The DOTA dataset is derived from Google Earth, the Gaofen-2 (GF-2) satellite, the Jilin-1 (JL-1) satellite, etc. It contains 2806 RGB images ranging in size from 800 × 800 to 4000 × 4000. It contains 16 types of objects (plane, ship, storage tank, baseball diamond, tennis court, basketball court, ground track field, harbor, bridge, large vehicle, small vehicle, helicopter, roundabout, soccer ball field, swimming pool, and container crane).
As shown in Table 1, objects between 10–50 pixels in size are called small objects, and objects larger than 300 pixels are called large objects. Object sizes of 50 to 300 pixels are called medium objects. So, the DOTA dataset has more small objects than the NWPU-VHR10 dataset, and the corresponding detection will be more challenging. For the NWPU-VHR10 dataset, we kept its original size for input to the network. A total of 75% of the images were randomly selected as the training set and 25% as validation. For the DOTA dataset, we cropped the more prominent images so that there were overlaps and upscaled the smaller images. Finally, approximately 15,000 images with a size of 1024 × 1024 were generated. Similarly, 75% were randomly selected for training, and 25% were left for validation.
We chose the frequently used Precision (P), Recall (R), Average Precision (AP), and mean Average Precision (mAP) as evaluation metrics. P and R are defined with the True Positive (TP), False Positive (FP), True Negative (TN), and False Negative (FN) as:
P = T P ( T P + F P ) ,
R = T P ( T P + F N ) .
After creating the precision–recall curve (P-R curve) from the precision and recall, AP can be calculated using the area under the P-R curve,
AP = 0 1 P ( R ) d R ,
and mAP is the average of all APs for N categories,
mAP = 1 N AP .

4.2. Implementation Details

Our proposed SPH-YOLOv5 were implemented in the PyTorch framework, and all variant models were trained and tested on an NVIDIA RTX3090 GPU with 24 GB memory. In the training phase, we used the pre-trained model of YOLOv5’s backbone on the COCO dataset [9] for transfer learning, saving considerable training time. We used the SGD optimizer for training with an initial learning rate of 0.01. The NWPU-VHR10 dataset was trained with 50 epochs, while the DOTA dataset was trained with 150 epochs. The first three epochs were trained using warm-up, which is a common learning rate optimization method. The learning rate of 0.1 was decreased at the first 3 epochs approximately, and a learning rate of 0.01 was subsequently used. Warm-up allows a deeper model to remain stable. It should be noted that all images are enlarged to 1280 × 1280 automatically by the SPH-YOLOv5 to facilitate the detection of small objects. Thanks to the GPU memory saved by the Swin transformer encoder, the batch size can be no less than 16. In contrast, for the transformer encoder, the batch size can only be set to 2.
The implementation of TPH-YOLOv5 is different from the SPH-YOLOv5. We trained the model at the first 2 epochs for warm-up. We used the Adam optimizer for training and used 3e-4 as the initial learning rate with the cosine learning rate schedule. The learning rate of the last epoch decays to 0.12 of the initial learning rate. The batch size is only 2.
Other detection models, such as Faster R-CNN [27], RetinaNet [5], SSD [6], YOLOv3 [15], Scaled-YOLOv4 [31], and YOLOv5, were verified using the default settings in the corresponding literatures.

4.3. Experimental Results

We demonstrated the SPH-YOLOv5 on the NWPU-VHR10 and DOTA test datasets and compared the results with other representative models. The results are shown in Table 2 and Table 3. The highest mAP was obtained in the NWPU-VHR10 dataset. On the DOTA dataset, our method achieves a mAP of 0.716, which is 0.071 higher than that of YOLOv5, proving its effectiveness for small object detection on satellite images. These results indicate that our model can maintain medium object detection performance, while improving small object detection capability.
We first drew the P-R curve for each category as shown in Figure 4. The AP, the integrated area under the curve, is calculated in legend. The larger the AP, the better the detection performance. Generally, the Intersection over Union (IoU) threshold and confidence threshold are two essential metrics for deep learning models. We then calculated the confusion matrix of the SPH-YOLOv5 results for the DOTA test set with the IoU threshold 0.5 and the confidence threshold 0.25, respectively. As shown in Figure 5, the confusion matrix visualizes the classification of each category. Each row represents the predicted categories, each column represents the actual categories, and the data on the diagonal line represents the proportion of categories that were correctly classified. However, it is shown that the high FN for the container crane category means that most objects are missed. The corresponding AP is also very low. It is mainly because the container-crane category training samples are much less than other categories. The lack of training samples leads to a limited extraction of features and results in a high FN. In addition, the FP is high for the small vehicle category, producing false alarms. Although the training samples of small vehicle are sufficient, they belong to tiny objects, which are very hard to detect in a dense environment with objects blocking each other.
We show some representative detection results from the SPH-YOLOv5 on the DOTA dataset in Figure 6. The SPH-YOLOv5 is suitable for several small- and medium-sized objects, such as planes, small vehicles, and ships, demonstrating the value of contextual knowledge in providing further assistance. However, these objects are frequently clumped together and difficult to differentiate. Furthermore, the SPH-YOLOv5 shows super performance in object categories with significant scale variation, such as tennis court, soccer ball field, and harbor. The SPH-YOLOv5 can simultaneously extract the detailed low-level characteristics for localization and the high-level semantics for identification.
We tested the inference speed of several comparison algorithms on satellite images on our device in Table 4. There is a speed advantage of our proposed model SPH-YOLOv5 compared to TPH-YOLOv5, proving the computational effect advantage of the Swin transformer and NAM. However, it is still slower than YOLOv5, probably because of the redundancy caused by the many modules we added to improve the accuracy. Streamlining the model to improve the speed in the future is an essential direction of work.

4.4. Ablation Experiments

First, we investigated the fusion of kinds of modules in the YOLOv5 framework, as shown in Table 5. It is interesting to find that embedding the additional feature layers in the added detection head (termed as P2) can expectedly improve the mAP by about 0.03. In contrast, the fusion of the attention modules, such as transformer, Swin transformer, or NAM, introduces a relatively moderate improvement on mAP (about 0.01~0.02). It is mainly because the fusion of P2 changes the whole architecture of the YOLOv5, making it more significant than the other local modules. Although the introduction of self-attention modules can improve the detection performance of satellite objects, the Swin transformer can reduce the computational complexity with a larger batch size at the same time.
Second, we only analyzed the NAM module. The NAM is formed in four ways: using channel attention, using spatial attention only, using both attention modules simultaneously, and using a normalization-based method. As shown in Table 6, the normalization-based way is better than the others. Spatial attention is more effective than channel attention, mainly because spatial information is more affluent than channel information on satellite RGB images. Therefore, spatial attention captures more delicate features and plays a vital role in detection.

4.5. Hyperparameter Exploration

The detection performance of SPH-YOLOv5 is also affected by different hyperparameter settings, such as scaled image size, batch size, and optimizer. To obtain the optimal hyperparameters for the SPH-YOLOv5 model, we manually adjusted the parameters to observe the performance of the DOTA dataset. The experimental results are shown in Table 7. It is noted that the optimal performance is obtained when using the SGD optimizer with a batch size of 16 and the scaled image size of 1280 × 1280. However, we observed that the Adam optimizer converges faster, although the detection accuracy is not as good as the SGD. It is well known that the GPU memory generally limits the batch size. It was found that the maximum batch size is 2 for the use of transformer prediction head, while the maximum batch size is 32 for the use of the Swin transformer prediction head. It means that the Swin transformer can effectively reduce the computational complexity and save GPU memory. Furthermore, the scaled image size refers to the input size that conforms to the YOLOv5 network limits and anchor box settings. We compared the impact of different scaled sizes, while keeping the original image size constant. It should be noted that the default scaled image size that inputs into the YOLOv5 is 640, which just adapts to the small sizes of natural images. However, the sizes of satellite images are intrinsically larger. Therefore, the larger scaled size of 1280 can retain more detailed feature information about the small object and improve detection accuracy.

5. Conclusions

This paper updated the state-of-the-art YOLOv5 model for detecting natural images to the SPH-YOLOv5 model for adapting satellite images. We improved the YOLOv5 network structure according to the characteristics of satellite images. The novel feature fusion layers and the prediction heads (SPHs) were added in YOLOv5. The shallow features acquired from the backbone network were brought into the feature fusion layer, effectively reducing the feature information loss of small objects and improving the detection performance in satellite images. In addition, multiple NAM attention modules were introduced for specifically focusing on objects in complex scenes. Both spatial attention and channel attention were used to find attention regions in dense scenes. The use of the Swin transformer can effectively improve the model detection performance and overcome the computational complexity of transformer. The proposed SPH-YOLOv5 was tested on the widely used NWPU-VHR10 dataset and the DOTA dataset, and the resulting mAPs reached 0.980 and 0.716, respectively, which are better than other models’ performance. The effectiveness of the proposed SPH-YOLOv5 for object detection on satellite images was fully demonstrated. Multispectral images have the advantage of rich spectral information compared with RGB images, which can theoretically improve the detection effect. Still, there are few large-scale multispectral remote sensing datasets with detailed annotation. So, it is not confident that our proposed model is valid on multispectral data. However, the proposed method does not fully utilize the spectral information, and the subsequent fusion of RGB images with multispectral data can be considered to improve the detection efficiency.

Author Contributions

Conceptualization, H.G.; methodology, H.G. and T.M.; software and experiments, Q.L. and H.G.; validation, H.G., W.W., F.H., H.L. and A.T.; writing—original draft preparation, H.G., X.L., Z.L. and B.W.; writing—review and editing, T.M.; funding acquisition, T.M., C.L., H.D. and Z.H. All authors contributed to the results’ analysis and reviewed the manuscript. All authors have read and agreed to the published version of the manuscript.

Funding

This work was supported in part by the National Natural Science Foundation of China (NSFC) under Grants 62175196, 61775176 and 62125505, in part by the Shaanxi Province Key Research and Development Program under Grants 2021GXLH-Z-058, 2020GY-131 and 2021SF-135, in part by the Innovation Capability Support Program of Shaanxi under Grant 2021TD-57, and in part by the Fundamental Research Funds for the Central Universities under Grant xjh012020021.

Data Availability Statement

Not applicable.

Conflicts of Interest

The authors declare no conflict of interest.

References

  1. Sadgrove, E.J.; Falzon, G.; Miron, D.; Lamb, D.W. Real-time object detection in agricultural/remote environments using the multiple- expert colour feature extreme learning machine (mec-elm). Comput. Ind. 2018, 98, 183–191. [Google Scholar] [CrossRef]
  2. Reilly, V.; Idrees, H.; Shah, M. Detection and tracking of large number of targets in wide area surveillance. In Computer Vision—ECCV 2010, Proceedings of the 11th European Conference on Computer Vision, Heraklion, Crete, Greece, 5–11 September 2010; Daniilidis, K., Maragos, P., Paragios, N., Eds.; Springer: Berlin/Heidelberg, Germany, 2010; pp. 186–199. [Google Scholar]
  3. Kussul, N.; Lavreniuk, M.; Skakun, S.; Shelestov, A. Deep learning classification of land cover and crop types using remote sensing data. IEEE Geosci. Remote Sens. Lett. 2017, 14, 778–782. [Google Scholar] [CrossRef]
  4. Zhang, L.; Lan, M.; Zhang, J.; Tao, D. Stagewise Unsupervised Domain Adaptation with Adversarial Self-Training for Road Segmentation of Remote-Sensing Images. IEEE Trans. Geosci. Remote Sens. 2022, 60, 1–13. [Google Scholar] [CrossRef]
  5. Lin, T.Y.; Goyal, P.; Girshick, R.; He, K.; Dollar, P. Focal loss for dense object detection. IEEE Trans. Pattern Anal. Mach. Intell. 2020, 42, 318–327. [Google Scholar] [CrossRef] [PubMed] [Green Version]
  6. Liu, W.; Anguelov, D.; Erhan, D.; Szegedy, C.; Reed, S.; Fu, C.Y.; Berg, A.C. Ssd: Single shot multibox detector. In Computer Vision—ECCV 2016, Proceedings of the 14th European Conference on Computer Vision, Amsterdam, The Netherlands, 11–14 October 2022; Leibe, B., Matas, J., Sebe, N., Welling, M., Eds.; Springer International Publishing: Cham, Switzerland, 2016; pp. 21–37. [Google Scholar]
  7. Wang, Y.; Bashir, S.M.A.; Khan, M.; Ullah, Q.; Wang, R.; Song, Y.; Guo, Z.; Niu, Y. Remote sensing image super-resolution and object detection: Benchmark and state of the art. Expert Syst. Appl. 2022, 197, 116793. [Google Scholar] [CrossRef]
  8. Everingham, M.; van Gool, L.; Williams, C.; Winn, J.; Zisserman, A. The pascal visual object classes (voc) challenge. Int. J. Comput. Vis. 2010, 88, 303–338. [Google Scholar] [CrossRef] [Green Version]
  9. Lin, T.Y.; Maire, M.; Belongie, S.; Hays, J.; Perona, P.; Ramanan, D.; Dollar, P.; Zitnick, C.L. Microsoft coco: Common objects in context. In European Conference on Computer Vision; Springer: Berlin/Heidelberg, Germany, 2014; pp. 740–755. [Google Scholar]
  10. Cheng, G.; Lang, C.; Wu, M.; Xie, X.; Yao, X.; Han, J. Feature enhancement network for object detection in optical remote sensing images. J. Remote Sens. 2021, 2021, 9805389. [Google Scholar] [CrossRef]
  11. Long, Y.; Gong, Y.; Xiao, Z.; Liu, Q. Accurate object localization in remote sensing images based on convolutional neural networks. IEEE Trans. Geosci. Remote Sens. 2017, 55, 2486–2498. [Google Scholar] [CrossRef]
  12. Ke, L.; Gang, W.; Gong, C.; Liqiu, M.; Junwei, H. Object detection in optical remote sensing images: A survey and a new benchmark. ISPRS J. Photogramm. Remote Sens. 2020, 159, 296–307. [Google Scholar]
  13. Redmon, J.; Divvala, S.; Girshick, R.; Farhadi, A. You only look once: Unified, real-time object detection. In Proceedings of the 2016 IEEE Conference on Computer Vision and Pattern Recognition (CVPR), Las Vegas, NV, USA, 27–30 June 2016; pp. 779–788. [Google Scholar]
  14. Redmon, J.; Farhadi, A. Yolo9000: Better, faster, stronger. In Proceedings of the 2017 IEEE Conference on Computer Vision and Pattern Recognition (CVPR), Honolulu, HI, USA, 21–27 July 2017; pp. 6517–6525. [Google Scholar]
  15. Joseph, R.; Ali, F. Yolov3: An incremental improvement. arXiv 2018, arXiv:1804.02767. [Google Scholar]
  16. Bochkovskiy, A.; Wang, C.Y.; Liao, H.Y.M. Yolov4: Optimal speed and accuracy of object detection. arXiv 2020, arXiv:2004.10934. [Google Scholar]
  17. Roy, A.M.; Bose, R.; Bhaduri, J. A fast accurate fine-grain object detection model based on yolov4 deep neural network. Neural Comput. Appl. 2022, 34, 3895–3921. [Google Scholar] [CrossRef]
  18. Wang, C.Y.; Liao, H.Y.M.; Wu, Y.H.; Chen, P.Y.; Hsieh, J.W.; Yeh, I.H. Cspnet: A new backbone that can enhance learning capability of CNN. In Proceedings of the 2020 IEEE/CVF Conference on Computer Vision and Pattern Recognition Workshops (CVPRW), Seattle, WA, USA, 14–19 June 2020; pp. 1571–1580. [Google Scholar]
  19. Liu, S.; Qi, L.; Qin, H.; Shi, J.; Jia, J. Path aggregation network for instance segmentation. In Proceedings of the IEEE Conference on Computer Vision and Pattern Recognition, Salt Lake City, UT, USA, 18–22 June 2018; pp. 8759–8768. [Google Scholar]
  20. Liu, Z.; Lin, Y.; Cao, Y.; Hu, H.; Wei, Y.; Zhang, Z.; Lin, S.; Guo, B. Swin transformer: Hierarchical vision transformer using shifted windows. In Proceedings of the IEEE/CVF International Conference on Computer Vision, Montreal, BC, Canada, 11–17 October 2021; pp. 10012–10022. [Google Scholar]
  21. Dalal, N.; Triggs, B. Histograms of oriented gradients for human detection. In Proceedings of the 2005 IEEE Computer Society Conference on Computer Vision and Pattern Recognition (CVPR’05), San Diego, CA, USA, 20–25 June 2005; Volume 1, pp. 886–893. [Google Scholar]
  22. Low, D. Distinctive image features from scale-invariant keypoints. Int. J. Comput. Vis. 2004, 60, 91–110. [Google Scholar] [CrossRef]
  23. Liu, L.; Ouyang, W.; Wang, X.; Fieguth, P.; Chen, J.; Liu, X.; Pietika inen, M. Deeplearningforgenericobjectdetection: A survey. arXiv 2018, arXiv:1809.02165. [Google Scholar]
  24. Girshick, R.; Donahue, J.; Darrell, T.; Malik, J. Rich feature hierarchies for accurate object detection and semantic segmentation. In Proceedings of the IEEE Conference on Computer Vision and Pattern Recognition, Columbus, OH, USA, 23–28 June 2014; pp. 580–587. [Google Scholar]
  25. He, K.; Zhang, X.; Ren, S.; Sun, J. Spatial pyramid pooling in deep convolutional networks for visual recognition. IEEE Trans. Pattern Anal. Mach. Intell. 2015, 37, 1904–1916. [Google Scholar] [CrossRef] [Green Version]
  26. Girshick, R. Fast r-cnn. In Proceedings of the IEEE International Conference on Computer Vision, Berlin, Germany, 11–14 March 2015; pp. 1440–1448. [Google Scholar]
  27. Ren, S.; He, K.; Girshick, R.; Sun, J. Faster r-cnn: Towards real-time object detection with region proposal networks. IEEE Trans. Pattern Anal. Mach. Intell. 2017, 39, 1137–1149. [Google Scholar] [CrossRef] [Green Version]
  28. He, K.; Zhang, X.; Ren, S.; Sun, J. Deep residual learning for image recognition. In Proceedings of the IEEE Conference on Computer Vision and Pattern Recognition, Las Vegas, NV, USA, 27–30 June 2016; pp. 770–778. [Google Scholar]
  29. Zheng, Z.; Wang, P.; Liu, W.; Li, J.; Ye, R.; Ren, D. Distance-iouloss: Faster and better learning for bounding box regression. In Proceedings of the AAAI Conference on Artificial Intelligence, New York, NY, USA, 7–12 February 2020; Volume 34, pp. 12993–13000. [Google Scholar]
  30. Misra, D. Mish:Aselfregularizednon-monotonicactivationfunction. arXiv 2019, arXiv:1908.08681. [Google Scholar]
  31. Wang, C.Y.; Bochkovskiy, A.; Liao, H.Y.M. Scaled-yolov4: Scaling cross stage partial network. In Proceedings of the IEEE/CVF Conference on Computer Vision and Pattern Recognition, Virtual, 19–25 June 2021; pp. 13029–13038. [Google Scholar]
  32. Simard, P.Y.; Steinkraus, D.; Platt, J.C. Best practices for convolutional neural networks applied to visual document analysis. In Proceedings of the 7th International Conference on Document Analysis and Recognition (ICDAR 2003), Edinburgh, UK, 3–6 August 2003; Volume 3. [Google Scholar]
  33. Zhang, H.; Cisse, M.; Dauphin, Y.N.; Lopez-Paz, D. mixup:Beyond empirical risk minimization. arXiv 2017, arXiv:1710.09412. [Google Scholar]
  34. DeVries, T.; Taylor, G.W. Improved regularization of convolutional neural networks with cutout. arXiv 2017, arXiv:1708.04552. [Google Scholar]
  35. Yun, S.; Han, D.; Oh, S.J.; Chun, S.; Choe, J.; Yoo, Y. Cutmix: Regularization strategy to train strong classifiers with localizable features. In Proceedings of the IEEE/CVF International Conference on Computer Vision, Seoul, Korea, 27 October–2 November 2019; pp. 6023–6032. [Google Scholar]
  36. Mnih, V.; Heess, N.; Graves, A. Recurrent models of visual attention. Adv. Neural Inf. Process. Syst. 2014, 27, 2204–2212. [Google Scholar]
  37. Jaderberg, M.; Simonyan, K.; Zisserman, A. Spatial transformer networks. Adv. Neural Inf. Process. Syst. 2015, 28, 2017–2025. [Google Scholar]
  38. Hu, J.; Shen, L.; Sun, G. Squeeze-and-excitation networks. In Proceedings of the IEEE Conference on Computer Vision and Pattern Recognition, Salt Lake City, UT, USA, 18–22 June 2018; pp. 7132–7141. [Google Scholar]
  39. Woo, S.; Park, J.; Lee, J.-Y.; Kweon, I.S. Cbam: Convolutional block attention module. In Proceedings of the European Conference on Computer Vision (ECCV), Munich, Germany, 8–14 September 2018; pp. 3–19. [Google Scholar]
  40. Wang, X.; Girshick, R.; Gupta, A.; He, K. Non-local neural networks. In Proceedings of the IEEE Conference on Computer Vision and Pattern Recognition, Salt Lake City, UT, USA, 18–22 June 2018; pp. 7794–7803. [Google Scholar]
  41. Dosovitskiy, A.; Beyer, L.; Kolesnikov, A.; Weissenborn, D.; Zhai, X.; Unterthiner, T.; Dehghani, M.; Minderer, M.; Heigold, G.; Gelly, S.; et al. An image is worth 16x16 words: Transformers for image recognition at scale. arXiv 2020, arXiv:2010.11929. [Google Scholar]
  42. Yuan, L.; Chen, Y.; Wang, T.; Yu, W.; Shi, Y.; Jiang, Z.H.; Tay, F.E.; Feng, J.; Yan, S. Tokens-to-token vit: Training vision transformers from scratch on imagenet. In Proceedings of the IEEE/CVF International Conference on Computer Vision, Montreal, BC, Canada, 11–17 October 2021; pp. 558–567. [Google Scholar]
  43. Guo, M.H.; Xu, T.X.; Liu, J.J.; Liu, Z.N.; Jiang, P.T.; Mu, T.J.; Zhang, S.H.; Martin, R.R.; Cheng, M.M.; Hu, S.M. Attention mecha-nisms in computer vision: A survey. arXiv 2021, arXiv:2111.07624. [Google Scholar]
  44. Zhu, X.; Lyu, S.; Wang, X.; Zhao, Q. Tph-yolov5: Improved yolov5 based on transformer prediction head for object detection on drone- captured scenarios. In Proceedings of the IEEE/CVF International Conference on Computer Vision, Nashville, TN, USA, 19–25 June 2021; pp. 2778–2788. [Google Scholar]
  45. Hendrycks, D.; Gimpel, K. Gaussian error linear units (gelus). arXiv 2016, arXiv:1606.08415. [Google Scholar]
  46. Liu, Y.; Shao, Z.; Teng, Y.; Hoffmann, N. NAM: Normalization-based Attention Module. arXiv 2021, arXiv:2111.12419. [Google Scholar]
  47. Cheng, G.; Han, J.; Zhou, P.; Guo, L. Multi-class geospatial object detection and geographic image classification based on collection of part detectors. ISPRS J. Photogramm. Remote Sens. 2014, 98, 119–132. [Google Scholar] [CrossRef]
  48. Xia, G.S.; Bai, X.; Ding, J.; Zhu, Z.; Belongie, S.; Luo, J.; Datcu, M.; Pelillo, M.; Zhang, L. Dota: A large-scale dataset for object detection in aerial images. In Proceedings of the IEEE Conference on Computer Vision and Pattern Recognition, Salt Lake City, UT, USA, 18–23 June 2018; pp. 3974–3983. [Google Scholar]
Figure 1. The architecture of SPH-YOLOv5. The red lines and boxes represent the added residual connections and feature fusion layers, respectively, compared to the original version. We also added five NAM modules and four Swin transformer encoders to improve performance.
Remotesensing 14 02861 g001
Figure 2. The architecture of the NAM. Two consecutive attention sub-modules refine feature maps in channel and space, respectively.
Remotesensing 14 02861 g002
Figure 3. The Swin transformer encoder’s architecture contains two main blocks, a Window Multi-head Self-Attention (W-MSA) and a Multi-Layer Perceptron (MLP). LayerNorm and Dropout layers help the network to converge better and prevent the network from overfitting.
Remotesensing 14 02861 g003
Figure 4. The P-R curve from the SPH-YOLOv5 results on the DOTA test set.
Remotesensing 14 02861 g004
Figure 5. The confusion matrix from the SPH-YOLOv5 results on the DOTA test set, with the IoU threshold of 0.5 and the confidence threshold of 0.25, respectively.
Remotesensing 14 02861 g005
Figure 6. Some visualization results from our SPH-YOLOv5 on the DOTA dataset. The detected boxes are shown with different colors according to different classes. Numbers 0–15 represent plane, baseball diamond, bridge, ground track field, small vehicle, large vehicle, ship, tennis court, basketball court, storage tank, soccer ball field, roundabout, harbor, swimming pool, helicopter, and container crane.
Remotesensing 14 02861 g006
Table 1. The distributions of the instance size for the NWPU-VHR10 and DOTA datasets.
Dataset10–50 Pixels50–300 Pixels>300 Pixels
NWPU-VHR10 15%83%2%
DOTA79%20%10%
Table 2. Test results on the NWPU-VHR10 test dataset for different detection models.
MethodPRmAP
Faster R-CNN0.9250.9170.936
RetinaNet0.9120.9120.928
SSD0.9030.9080.906
YOLOv30.9130.9190.927
Scaled-YOLOv40.9570.9210.940
YOLOv50.9610.9550.975
TPH-YOLOv50.9630.9560.978
SPH-YOLOv50.9650.9670.980
Table 3. Test results on the DOTA test dataset for different detection models.
MethodPRmAP
Faster R-CNN0.7100.5940.631
RetinaNet0.7140.5850.622
SSD0.6960.5220.561
YOLOv30.7150.5460.587
Scaled-YOLOv40.7280.5830.632
YOLOv50.7600.6010.645
TPH-YOLOv50.7850.6430.683
SPH-YOLOv50.8060.6830.716
Table 4. Inference time on the DOTA test dataset for different detection models.
MethodInference Time (per Picture)
YOLOv510.5 ms
TPH-YOLOv532.5 ms
SPH-YOLOv519.5 ms
Table 5. The effects of the YOLOv5 combining different modules on the DOTA dataset, where P2 represents the additional feature fusion layers and prediction head.
MethodsPRmAP
YOLOv50.760.6010.645
YOLOv5 + P20.8180.6250.675
YOLOv5 + P2 + Transformer0.8040.6430.683
YOLOv5 + P2 + Swin Transformer0.8050.6610.690
YOLOv5 + P2 + CBAM0.8120.6670.689
SPH-YOLOv50.8060.6830.716
Table 6. The effects of using the attention method.
TypePRmAP
Only using spatial attention0.8020.6640.709
Only using channel attention0.8010.6630.706
CBAM0.8050.6720.714
NAM0.8060.6830.716
Table 7. The effects of adjusting hyperparameters.
MethodsImage SizeBatch SizeOptimizermAP
SPH-YOLOv5128016SGD0.716
SPH-YOLOv5-2102416SGD0.711
SPH-YOLOv5-364016SGD0.705
SPH-YOLOv5-4128016Adam0.697
SPH-YOLOv5-512808SGD0.703
SPH-YOLOv5-6128032SGD0.694
Publisher’s Note: MDPI stays neutral with regard to jurisdictional claims in published maps and institutional affiliations.

