Abstract
Thunderstorm activity over the Qinghai–Tibet Plateau (QTP) has important climatic effects and disaster impacts. Using the thunderstorm feature dataset (TFD) established based on the black body temperature (TBB) and cloud classification (CLC) products of the Fengyun-2E (FY-2E) geostationary satellite, as well as the lightning data of the World Wide Lightning Location Network (WWLLN), the temporal and spatial distributions and some cloud properties of the thunderstorms over the QTP were analyzed. Approximately 93.9% and 82.7% of thunderstorms over the QTP occur from May to September and from 12 to 21 o’clock local time, and the corresponding peaks are in August and at 14:00, respectively. There are three centers featuring frequent thunderstorms in the southeast, south-central, and southwest regions of the QTP. The average thunderstorm cloud area (the region with TBB ≤ −32 °C) is 1.8 × 10⁴ km2. Approximately 32.9% of thunderstorms have strong convective cells (SCCs) composed of areas with TBB ≤ −52 °C. The average number and area ratio of SCCs are 3.6 and 25.4%, respectively, and their spatial distribution is given. The average cloud area and the number and area ratio of SCCs of extreme-lightning thunderstorms (thunderstorms with the top 10% of lightning numbers) are approximately 30.0, 3.9, and 1.5 times those of normal thunderstorms. The spatial distribution of the thunderstorm activity is quite different from that of lightning activity given by the Lightning Imaging Sensor (LIS) and Optical Transient Detector (OTD) over the northeastern and southwestern QTP, which may mean that the convection intensity, cloud structure, and charge structure of the thunderstorms over the QTP are different between different regions and seasons.
1. Introduction
The Qinghai–Tibet Plateau (QTP) plays a crucial role in the Asian (and even global) atmospheric circulation and significantly impacts climate change and weather systems, due to the dynamic effects of its high terrain (average altitude > 4000 m) and thermal effects as a heat source [1,2,3,4,5,6]; therefore, it is an area that has long been of interest to meteorologists.
In summer, the common weather systems over the QTP include the plateau shear line, vortex, and low trough [7,8,9]. Large-scale circulation combined with intense surface heating and active near-surface turbulence makes the convection activity very active over the QTP [4,10,11]. According to the “Atlas of China Disastrous Weather and Climate” issued by the Chinese Meteorological Administration [12], the central QTP presents approximately 80 thunderstorm days per year, and the number of thunderstorm days throughout the central and eastern QTP is apparently greater than those over Central and Eastern China at the same latitudes. Lightning generated by thunderstorms is one of the most important natural disasters in the QTP and often causes casualties. Thunderstorms on the QTP are often accompanied by hail and other weather phenomena; the sudden drop in temperature and road icing caused by them also often pose important safety threats. In addition, with convective properties and rich ice-phase particles, which are necessary conditions for electrification within clouds, thunderstorms are believed to be vital objects affecting the Earth’s climate by transporting water vapor and sublimating ice crystals to the top of the cloud [13,14]. Furthermore, lightning discharges are the predominant source of nitrogen oxides over the QTP; thunderstorms output nitrogen oxides and transport them upwards, thereby affecting atmospheric chemical processes [15,16,17]. Therefore, there is obvious scientific and practical significance in understanding the characteristics of thunderstorm activity in the QTP.
In this analysis, thunderstorms refer to the clouds that produce lightning. They are not completely the same as convective clouds, which have been often referred to, because not all convective clouds produce lightning. Studies directly focusing on the thunderstorm activity throughout the QTP are rare, but the existing studies based on the thunderstorm cases or concerned with the convection systems over the QTP have indicated that the characteristics of the thunderstorms over the QTP may be unique. For example, convective clouds over the QTP can constitute up to 90% of the total clouds in the central QTP [10,18], and the strong convective clouds over the QTP account for approximately 4–21% of cloud types, approximating five times that of other places in China [19]. Convective clouds over the QTP are typically isolated and have densely packed cloud tops, showing “popcorn-like” or “tower-mast-like” shapes [4,20,21]. Due to the fact that the atmospheric stratification over the QTP is typically characterized by relatively low humidity, small thickness of the troposphere, weak instability, low unstable energy, and the humidity inversion phenomenon of the near-surface layer, although it is easy to trigger convection clouds that can develop to higher altitudes, the convection clouds are usually weaker in intensity, smaller in spatial extent, and shorter in life relative to those over other places [21,22,23,24,25].
It has been reported that the lower positive charge centers in the QTP thunderstorms tend to be more robust than the upper ones in the pattern of tripolar charge structure (upper positive, middle negative, and lower positive charge regions) because of the relatively weak convection and low freezing level [26,27,28,29,30,31]. The thunderstorms over the QTP generally feature relatively small charging rates, lightning rates, lightning duration, and spatial expansion of lightning channels [23,25,28,30,32]. Therefore, despite having higher-frequency convections, the QTP is characterized by lower lightning density than the land regions to its east and south [33,34]. Meanwhile, the sensitivity of the lightning frequency to convective available potential energy (CAPE) over the QTP is much larger than that over the other regions with prominent lightning activity [35,36].
As one of the major disasters, and given their crucial impact on the atmospheric environment and climate and their uniqueness, QTP thunderstorms have fascinated researchers. There have been some studies that investigated the structure of the thunderstorms or their electric characteristics based on case studies or simulations (as listed in the last section). However, as a large area spanning approximately 2800 km from east to west and 1500 km from north to south and covering about 2.5 million square kilometers, the QTP must have obvious regional differences in the characteristics of thunderstorm activities. Therefore, it is necessary to study the characteristics of thunderstorm activity over the entire QTP. An important obstacle to conducting such studies is insufficient data. Due to the relatively harsh natural conditions and small population of the QTP, ground-based meteorological observations (such as lightning positioning, radar, etc.) are very sparse, making it difficult to cover the entire region. Previous studies on convection and lightning activities throughout the QTP are typically based on polar-orbiting satellite observation data such as TRMM (Tropical Rainfall Measuring Mission), Cloudsat, and CALIPSO (Cloud-Aerosol Lidar and Infrared Pathfinder Satellite Observation) satellites [21,22,23,35,36,37,38,39]. In terms of thunderstorm research, Li et al. [40] used the TRMM/RPF (radar precipitation feature) dataset [41] to study the spatial and temporal distribution characteristics of thunderstorms in the Asian monsoon region, including the QTP region. Based on the same dataset, Zheng and Zhang [25] studied the association of the structure of thunderstorms with flash frequency and flash size by comparing them over the QTP, Central and Eastern China, and the southern foothills of the Himalayas. However, most of the QTP thunderstorms have a short lifetime [24,27]; therefore, the polar-orbiting satellites tend to miss a large number of thunderstorms. Some other authors have also characterized thunderstorm activity in different regions using clustered lightning activity areas as a proxy for thunderstorms [42,43,44,45,46,47]. However, the used lightning location system in these studies usually only provides the discrete lightning location (meaning only one or a few limited location points for one lightning flash), and the lightning data predominantly comprises cloud-to-ground (CG) lightning; the clustered area is typically only a part of the thunderstorm and cannot reflect the overall thunderstorm cloud.
Relatively speaking, geostationary satellites can continuously observe the thunderstorm cloud over a large area, providing more complete information about the cloud than polar-orbiting satellites. Ma et al. [48] established a thunderstorm cloud feature dataset (TFD) based on the geostationary FY-2E satellite observation data and the World Wide Lightning Location Network (WWLLN) lightning data, where the lightning data were used to identify the thunderstorm, and the satellite observation provided the information on the thunderstorm cloud. Using this dataset, this study focused on the thunderstorms over the QTP and analyzed their spatial and temporal distributions and some structural characteristics, including the area, strong convective cores (SCCs), and so on. To the best of our knowledge, this may be the first time that the thunderstorms over the entire QTP have been studied as a specialized object.
2. Data and Methods
The used TFD in this study was established by Ma et al. [48] based on the FY-2E satellite observation data and WWLLN lightning data, covering the years from 2010 to 2018. The FY-2E satellite was launched on 23 December 2008. It was first set above the equator at 104.5°E in February 2009, then drifted above the equator at 86.5°E in July 2015, and ceased observation in January 2019. The TFD mainly referred to the black body temperature (TBB), corresponding to a spectrum of 10.3–11.3 μm, which was observed by the visible and infrared spin-scan radiometer (VISSR), an instrument onboard the FY-2E satellite. The TBB data have a spatial resolution of approximately 5 km at nadir and a time resolution of 1 h. The WWLLN, managed by the University of Washington along with a consortium of worldwide institutions, can continuously locate global lightning by using the time of group arrival algorithm and obtaining synchronous recordings from at least five sensors running at a very low frequency of 3–30 kHz [49,50]. The WWLLN tends to detect stronger lightning. Fan et al. [51] assessed that the detection efficiency of WWLLN for CG lightning in the mid-southern QTP is 9.4% (based on the data from 2013 to 2015) and the total lightning detection efficiency is approximately 2.6% (based on the data from 2013 to 2014). They estimated that, in the mid-southern QTP, the CG lightning data made up approximately 71.9% of all WWLLN lightning data, and the mean stroke peak currents of positive and negative CG lightning were 62.4 and –56.7 kA, respectively. Meanwhile, Ma et al. [52] exhibited the year-by-year WWLLN lightning frequency, and indicated an obvious increasing tendency of the detection efficiency of the WWLLN during the analysis period.
During the establishment of the TFD, the TBB and cloud classification (CLC) products of the FY-2E satellite were first consulted to find the spatially contiguous regions with TBB ≤ −32 °C (refer to the region delineated by the pink line in Figure 1), which was often considered to be a convection area in previous studies [53,54,55]. An ellipse fit was then performed on this region (the ellipse with the dashed-line boundary in Figure 1). If WWLLN lightning (20 min before and 40 min after TBB archive time) was detected in the area of TBB ≤ −32 °C or its fitting ellipse, the area with TBB ≤ −32 °C was preliminarily determined to be a thunderstorm cloud. If two or more fitted ellipses belonging to different clouds had overlapping areas with common lightning flashes, the corresponding clouds that also had lightning flashes in the areas of TBB ≤ −32 °C were reserved, while the others were excluded. Because of the low detection efficiency of the WWLLN [51], as long as a cloud contained at least one WWLLN lightning flash, it was regarded as a thunderstorm. It is believed that the actual lightning number in most thunderstorm cases should be greater than 1. Ma et al. [48] found that more than 75% of WWLLN lightning was located in the TBB ≤ −32 °C region.
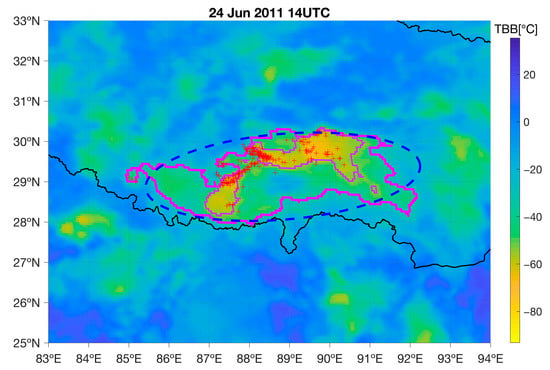
Figure 1.
An example of the identified thunderstorm cloud on 24 June 2011. The pink lines delineate the region with TBB ≤ −32 °C. The purple lines enclose the region with TBB ≤ −52 °C. The blue dashed line indicates an ellipse fitting the region with TBB ≤ −32 °C. Red “+” signs mark the location of the WWLLN lightning.
The QTP area concerned in this study is the area surrounded by the solid black line shown in Figure 2. The boundary data are from Zhang et al. [56]; they correspond to the 4000 m isoheight and cover the Chinese part of the QTP. In the selection of the thunderstorm samples, it was necessary that both the centroid and the minimum TBB value of the thunderstorms were in the analysis area. In this analysis region, the spatial resolution of the TBB data approximately changed between 5 and 7 km.
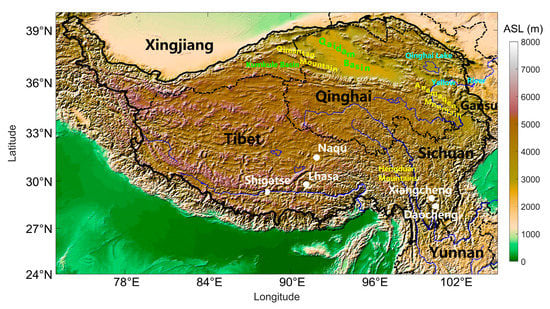
Figure 2.
The study area delineated by the black solid line. Some place names are marked; they will be mentioned in the subsequent analysis.
There are a few thunderstorm samples that have a very large cloud area (referring to the area of TBB ≤ −32 °C, the same below) but very little lightning. They are not typical thunderstorms, but can seriously affect the statistics of thunderstorm characteristics, so we performed a quality control measure to remove them. First, the thunderstorm samples were sorted and grouped according to their WWLLN lightning number. In order to ensure the statistical significance, it was mandated that the thunderstorm samples in each group must be greater than 200, which meant that the intervals of the WWLLN lightning number corresponding to the groups were not required to be the same. Then, the outliers of the cloud area in each group were determined using the following steps. We first obtained the 25th quantile value (Q1) and 75th quantile value (Q2) of the cloud area of the thunderstorms in the groups. Then, we took Q1 − 1.5 × (Q2 − Q1) as the low-end threshold, and Q2 + 1.5 × (Q2 − Q1) as the high-end threshold. The low-end and high-end thresholds corresponding to the groups were fitted (we found the power-function fitting to be the best), and the fitted curve was used as the discriminating condition of abnormal thunderstorms. The above method is the same as in Ma et al. [48].
The color shading in Figure 3 represents the number of samples corresponding to different lightning numbers and thunderstorm cloud areas. The red symbols “*” mark the high-end thresholds of the thunderstorm cloud area, and the black line is the fitting curve with equation “A = 13338.46 × F0.710” and a correlation coefficient of 0.982, where A is the cloud area, and F is the WWLLN lightning number. Thunderstorms with a cloud area above the curve were excluded as abnormal samples. It should be noted that the low-end thresholds were all negative, so there was no sample below them. Finally, a total of 104,493 thunderstorm samples were obtained in the analysis area, accounting for approximately 86.3% of the original samples. It should be noted that the thunderstorm samples represent the number of thunderstorms in 1 h (the time resolution of the FY-2E satellite). In other words, the thunderstorm activity indicated by the samples includes the information on both the thunderstorm frequency and the thunderstorm duration. For example, the situations of 5 thunderstorms in 1 h and that of 1 thunderstorm in 5 h both contributed 5 samples. In the analysis, we use the term “thunderstorm hour number (THN)” to describe the frequency of the samples.
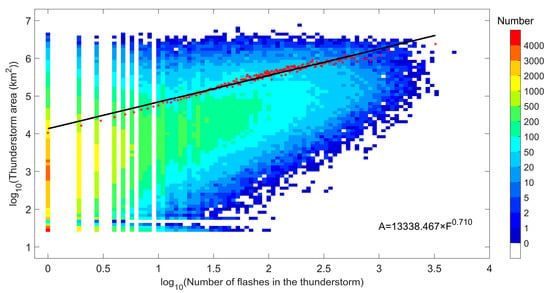
Figure 3.
Sample distribution for different lightning numbers and thunderstorm cloud areas. The red “*” marks the calculated high-end thresholds for the abnormal cloud area corresponding to the groups sorted according to the WWLLN lightning number. The black line indicates the fit to the high-end thresholds, with the power-function equation shown at the bottom right.
In Section 5, we employed a comparison of spatial distributions between thunderstorm activity and lightning activity over the QTP. The 0.5° High Resolution Full Climatology (HRFC) dataset [57] provided by the Global Hydrology Resource Center (GHRC) was used. This dataset was derived from the observations of the Optical Transient Detector (OTD) and Lightning Imaging Sensor (LIS). The OTD (1995–2000), a scientific payload on the MicroLab-1 satellite that operated at an altitude of about 735 km and an inclination of 70°, optically detected lighting flashes within a 1300 × 1300 km2 field of view with an estimated detection efficiency of 56 ± 7% for night and 44 ± 9% for noon [58,59]. The LIS aboard the TRMM satellite (1997–2015) detected the flashes from approximately 350 km before August 2001 and 400 km after that when the orbit was boosted, with a detection efficiency of approximately 93 ± 4% for night and 73 × 11% for noon in their field of view of approximately 600 × 600 km2 and observation range approximately between 38°S and 38°N [58].
3. Characteristics of Thunderstorm Activity over the QTP
3.1. Spatiotemporal Distributions
The monthly and diurnal variations in thunderstorm activity over the QTP are shown in Figure 4a,b, respectively. With regard to the monthly changes, the thunderstorm activity from January to April was generally weak, while showing a slow increase. The thunderstorm activity increased rapidly in May and reached its peak in August. The proportion of THN in August reached 29.6%. September was the second strongest month for thunderstorm activity. THN dropped sharply in October, and the overall thunderstorm activity was weak from November to December. Approximately 93.9% of the THNs appeared in the warm season from May to September. This result is in good agreement with the studies that referred to different data and documented the convection in the QTP to be weak in winter and strong in summer [60,61].
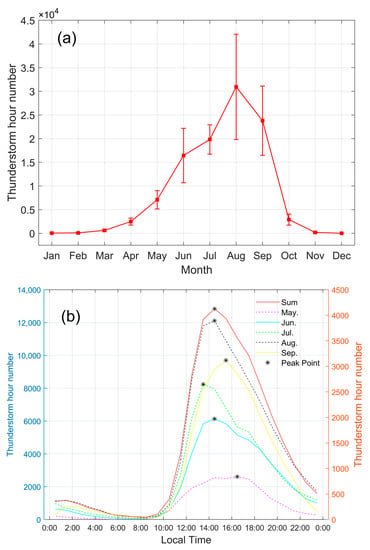
Figure 4.
Monthly variation (a) with error bars and diurnal variation (b) in thunderstorm activity over the QTP.
Figure 4b shows the diurnal variation in thunderstorms in a whole year and in each month from May to September. The thunderstorm activity was very concentrated in the afternoon, suggesting that instability associated with solar heating plays the most crucial role in the development of a QTP thunderstorm, in the same manner as convective clouds [4,22,62]. For the whole year, approximately 82.7% of the THNs occurred between 12:00 and 21:00 local time (LT). The thunderstorm activity peaked at 14:00 LT (corresponding to 14:00–15:00 LT, the same below). From May to September, the peak time of thunderstorm activity showed a continuous forward movement from May to July (the peak times were 16:00, 14:00, and 13:00 LT, respectively); meanwhile, from August to September, the peak hour showed a backward movement (the peak times were 14:00 and 15:00 LT, respectively).
Figure 5 shows the spatial distribution of thunderstorm activity over the QTP in the whole year and in each month from May to September. The frequency of THNs was counted as 1° × 1° grids according to their centroid positions.
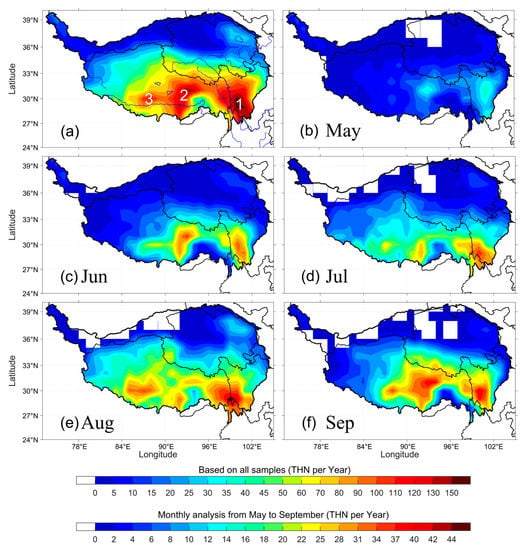
Figure 5.
Spatial distribution of thunderstorm activity. (a): Based on all samples; (b–f): Month-by-month analysis from May to September. The statistical grid is 1° × 1°, and the color-coded values in the figure indicate the average annual THN.
It can be seen from Figure 5a that the thunderstorm activity over the QTP was stronger in the southern and eastern regions than in the northern and western regions. No thunderstorm centroid fell into the statistical grids in the northern border regions of the QTP (but it is still possible for parts of the thunderstorms to cover these areas). An active thunderstorm belt extended westward in a wavy pattern from approximately 101°E in the east to approximately 86°E, and included three high-density centers in the southeast (the center is approximately 100°E, 29°N), the south-central (the center is approximately 92°E, 30°N), and the southwest (the center is approximately 88°E, 30°N) regions of the QTP. The southeast one had the most active thunderstorm, followed in turn by the south-central and southwest regions of QTP. Their centers roughly corresponded to the three regions of Xiangcheng-Daocheng in Sichuan, Lhasa-Naqu in Tibet, and Shigatse in Tibet, respectively. For convenience, we refer to them as thunderstorm high-density centers 1–3, respectively (see Figure 5a). In the northeastern QTP, there was a local center with thunderstorm activity relatively more frequent than the surrounding areas; it roughly corresponded to the Qinghai Lake. However, it should be noted that the THN density there was significantly smaller than the three centers in the southern QTP.
From the monthly spatial distribution of thunderstorm activity over the QTP (Figure 5b–f), it is clear that the thunderstorm activity over the QTP was weak in May (Figure 5b), but two thunderstorm activity centers in the southeastern and the south-central regions emerged, which roughly corresponded to the high-density centers 1 and 2 in Figure 5a. Meanwhile, the southeast center was more northerly than the high-density center 1. The south-central center was mainly near Naqu; it did not extend towards Lhasa, similar to the pattern of the high-density center 2.
In June (Figure 5c), the two high-density centers mentioned above were located closer to the whole-year high-density centers 1 and 2, and the thunderstorm activities in their connecting and peripheral areas were enhanced significantly.
In July (Figure 5d), the southeast center continued to move southward, while the high-density area corresponding to Naqu in May and June moved close to Lhasa. A “hot spot” appeared in the southwest, corresponding to the high-density center 3.
In August (Figure 5e), thunderstorm activity was the strongest in the region corresponding to the southeast center, but the center was slightly to the west relative to the whole-year high-density center 1. The south-central center was located at approximately 92°E, 29°N, still near to Lhasa. The thunderstorm activity corresponding to the southwest center strengthened apparently and extended westward. Both the high-density centers 1 and 3 hit their peaks of thunderstorm activity in August. It should be noted that thunderstorm activity over the northeastern QTP was also the strongest in August.
In September (Figure 5f), thunderstorm activity over the south-central center was enhanced significantly, reaching the maximum frequency. Meanwhile, the density and active range of thunderstorm activity over the areas corresponding to the whole-year high-density centers 1 and 3 decreased.
In October (figure omitted), the activity of thunderstorms over the whole QTP decreased sharply, and a small number of thunderstorm samples mainly appeared in the area east of 84°E and south of 36°N, with two weak thunderstorm activity centers located in the southeast and south-central centers.
According to the monthly variation in the regions with relatively frequent thunderstorm activity, the strong thunderstorm activity generally first advanced from east to west before August and then retreated from west to east in September and October. This should be associated with the weakening westerly surface winds and increasing relative humidity from the eastern to western QTP during the first period [22,62]. After August, the western wind strengthens, and water vapor content over the QTP decreases, accompanied by the eastward retreat and weakening of thunderstorm activity. From the above analysis, it is obvious that different regions of the QTP experience different seasonal changes in thunderstorm activity. The monthly variation in the diurnal peak of thunderstorm activity in Figure 4b may be related to the fact that, in different months, the main lightning activity occurred in different regions, where the surface heating effect in driving convection was different.
3.2. Structural Characteristics of Thunderstorms
3.2.1. Cloud Area
The cloud area here refers to the areas with TBB ≤ −32 °C in the thunderstorms. We only consider the thunderstorms from May to September in the analysis below, in order to exclude the possible influence of rare cases in winter (the structure of thunderstorms in the cold season may be different from that in the warm season).
Figure 6a shows the probability and cumulative probability distributions of the thunderstorm cloud area (the horizontal axis takes the logarithm). There were approximately 42.9% of the samples that were concentrated in the peak interval of 1 × 10³ to 1 × 10⁴ km2, and 90% of the thunderstorms that featured a cloud area of less than 3.5 × 10⁴ km2. The average and median thunderstorm cloud area were 1.8 × 10⁴ and 2.7 × 10³ km2, respectively. Based on the same dataset, Ma et al. [48] estimated the average thunderstorm cloud area in China to be 3.4 × 10⁴ km2. Thunderstorms over the QTP show a smaller cloud area, which is consistent with previous studies that reported that the convective clouds over the QTP have a smaller horizontal extent [22,23,25].
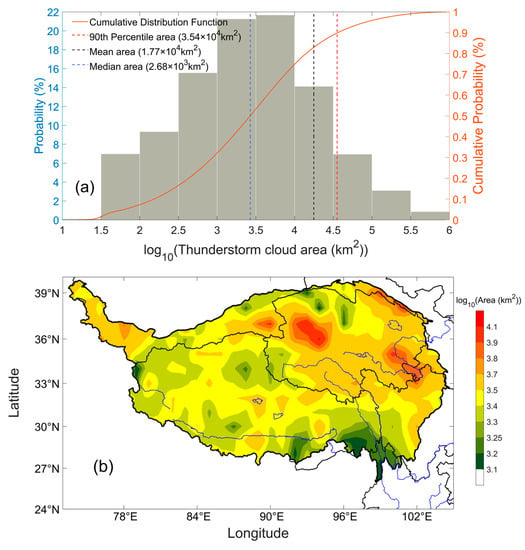
Figure 6.
Probability and cumulative probability distributions (a) and spatial distribution (b) of thunderstorm cloud area over the QTP during the warm season (from May to September). In (b), the statistical grid size is 1° × 1°.
Figure 6b shows the spatial distribution of the average thunderstorm cloud area over the QTP region. Generally, the area of thunderstorm clouds in the Qinghai region of the QTP was larger than that in Tibet. There were maxima near the northeastern and eastern borders of the QTP. Moreover, there were also three relatively clear, separate, large-value centers of thunderstorm cloud areas in the northern part of the QTP. The first center was located around 94°E and 36°N (Western Qinghai), approximately corresponding to the intersecting areas of the Qimantage Mountain and the Qaidam Basin. The second center was located in the east of Qinghai, approximately centered at 100°E and 34°N. It corresponded to the Anemaqen Mountain, located at the bend in the upper reaches of the Yellow River. To the west of the first center, there was another small local region with a large thunderstorm cloud area, centered at approximately 89°E, 37°N and located on the eastern side of the Kumkule Basin in Xinjiang. The above-mentioned places featured a thunderstorm cloud area greater than 5 × 10³ km2 and their names are also marked in Figure 2. The main body of the Qaidam Basin in Qinghai was a relatively small thunderstorm cloud area. In the three regions with strong thunderstorm activity (Figure 5a), the thunderstorm cloud area was relatively small overall. In the southeast QTP, roughly corresponding to the Hengduan Mountains, the thunderstorm had a cloud area of less than 2 × 10³ km2, showing apparently low values.
3.2.2. SCCs in Thunderstorm
We identified the continuous area of TBB ≤ −52 °C in the thunderstorm as the SCC (refer to the regions delineated by the purple lines in Figure 1), and then obtained the number of SCCs and the area ratio of the SCC (SCC area divided by cloud area). In previous studies, TBB ≤ −52 °C has been typically used as a signal for strong convection [53,54,55,63,64]. The number of SCCs reflects the situation of the thunderstorm, including strong cells. The area ratio of SCCs is related to the convective intensity of the thunderstorm. A larger area ratio of SCCs is usually correlated with stronger convection [25].
In the analysis region, 32.9% of the samples contained SCCs. Figure 7 shows the spatial distribution of the proportion of thunderstorms with SCCs. The proportions of thunderstorms containing SCCs were mainly between 20% and 50% throughout the QTP. The values in the northern and northwestern QTP were relatively low. The northeastern border of the QTP and the three regions corresponding to the relatively large average thunderstorm cloud area (Figure 6b) also featured larger proportions of thunderstorms with SCCs, with values of more than 35%. In the southwestern QTP, there was a large-area region where the proportions also exceeded 35%. In the following analysis of the SCCs, we only used the samples that contained SCCs.
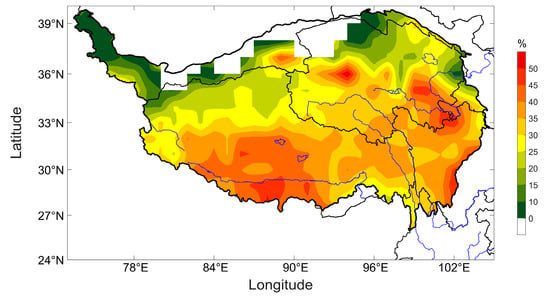
Figure 7.
Spatial distribution of the proportion of thunderstorms containing SSCs during the warm season (from May to September), with the statistical grid size being 1° × 1°.
Figure 8a shows the probability and cumulative probability distributions of the number of SCCs in thunderstorms. The interval of SCCs between 1 and 3 had the most samples (64.3%). Approximately 80.7% of the samples had SCCs of no more than 5 and 90% of thunderstorms contained SCCs of no more than 8. The average and median number of SCCs were 3.6 and 2, respectively.
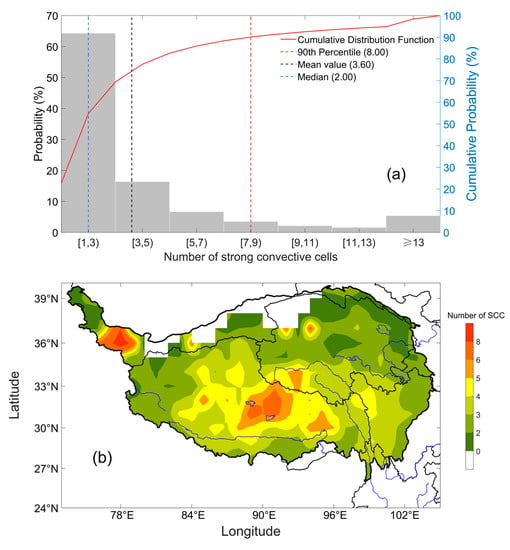
Figure 8.
Probability and cumulative probability distributions (a) and spatial distribution (b) of the number of SCCs of thunderstorms over the QTP during the warm season (from May to September). In (b), the statistical grid size is 1° × 1°.
According to Figure 8b, regarding the spatial distribution of the number of SCCs, the thunderstorms over Southern Qinghai and Central and Northern Tibet, approximately located in the region with a longitude of 83°E–96°E and latitude of 29°N–34°N, had greater SCC numbers than most other places, with an average of 4 or more SCCs in one thunderstorm and a region around 90°E, 31.5°N that featured more than 6 SCCs in one thunderstorm. Another region with a large number of SCCs was located in the west-narrow area of the QTP. It should be impacted by the thunderstorm systems on the places in the north of Pakistan and northwest of India, where the lightning activity is extremely strong and the thunderstorm properties are different from QTP [25,57].
Figure 9a shows the probability and cumulative probability distributions of the area ratio of the SCCs. The interval with an area ratio smaller than 10% gathered the most samples (27.9%). Approximately 88.3% of the samples had an area ratio below 50%. The mean and median area ratios of SCCs were 25.4% and 21.8%, respectively.
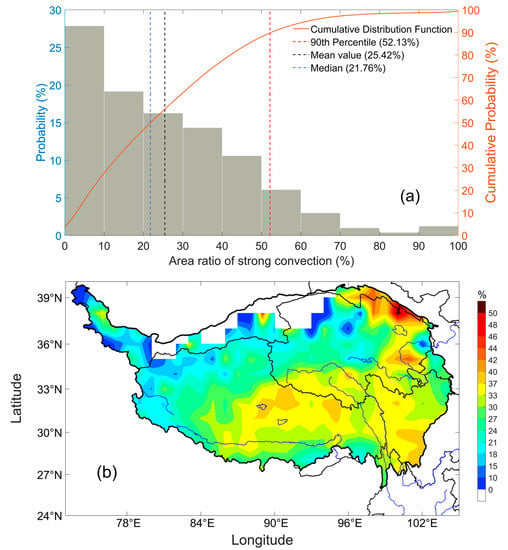
Figure 9.
Probability and cumulative probability distributions (a) and spatial distribution (b) of the area ratio of SCCs in thunderstorms over the QTP during the warm season (from May to September). In (b), the statistical grid size is 1° × 1°.
Figure 9b shows the spatial distribution of the area ratio of SCCs. The values greater than 30% were mainly distributed in the northeastern QTP and the central and eastern areas of the southern QTP, covering the three centers with high-frequency thunderstorm activity. The northeastern QTP had the largest area ratio of SCCs, with the values in some local regions exceeding 40%, which may mean that the thunderstorms in the northeastern QTP tend to have stronger convection.
4. Characteristics of Extreme-Lightning Thunderstorms
We defined extreme-lightning thunderstorms as those whose 1 h lightning frequency fell in the top 10% of all the samples. A total of 10,475 extreme-lightning thunderstorms with no less than 33 WWLLN lightning were obtained. The remaining samples were classified as normal thunderstorms. The thunderstorms yielding high-frequency lightning flashes, typically associated with strong convection, have a greater chance of producing severe weather, such as heavy rainfall, hailstones, strong winds and so on, and causing secondary disasters, therefore deserving special attention.
4.1. Spatiotemporal Distributions
Figure 10a shows that the monthly variation in extreme-lightning thunderstorm activity was generally similar to that of all the thunderstorm activity shown in Figure 4a, but what was different from the whole thunderstorm activity was that the extreme-lightning thunderstorm activity was still relatively weak in May, and suddenly increased in June. Approximately 30.9% and 28.7% of extreme-lightning thunderstorms occurred in August and September, corresponding to the two months with the most frequent extreme-lightning thunderstorm activity, respectively, and 93.4% of extreme-lightning thunderstorms were concentrated in June–September. The diurnal variation in extreme-lightning thunderstorm activity was generally consistent with the total thunderstorm activity in predominantly occurring in the afternoon, with 81.2% of the samples concentrated between 12:00 and 21:00 LT. From the diurnal variation in extreme-lightning thunderstorm activity in each month, the peaks in May, August, and September appeared at 16:00, 14:00, and 15:00 LT, respectively, similar to the diurnal variation in all thunderstorm activity (Figure 4b). However, the peak of extreme-lightning thunderstorms in June was at 13:00 LT, one hour ahead of all thunderstorms, and the peak of extreme-lightning thunderstorms in July was at 14:00 LT, one hour behind the peak of all thunderstorms.
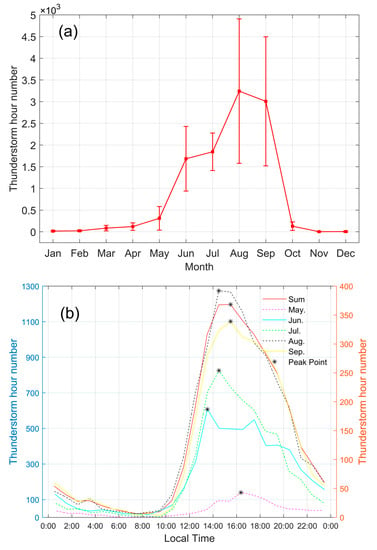
Figure 10.
Monthly variation (a) with error bars and diurnal variation (b) in extreme-lightning thunderstorms on the QTP.
The spatial distribution of extreme-lightning thunderstorm activity (Figure 11) was generally similar to that of all thunderstorms (Figure 5a). The southern QTP had greater frequencies of extreme-lightning thunderstorm activity than the northern QTP, and a few centroids of extreme-lightning thunderstorms fell into the regions to the north of 36°N. The locations of the three high-density extreme-lightning thunderstorm activity centers were approximately the same as the three high-density thunderstorm activity centers in Figure 5a in their positions, but the southeastern center was much stronger than the other two centers, which was different from the comparison of the three thunderstorm activity centers in Figure 5a. In addition, the south-central center of the high-density extreme-lightning thunderstorm was near Naqu, which was different from the high-density thunderstorm, of which the south-central center also covered Lhasa.
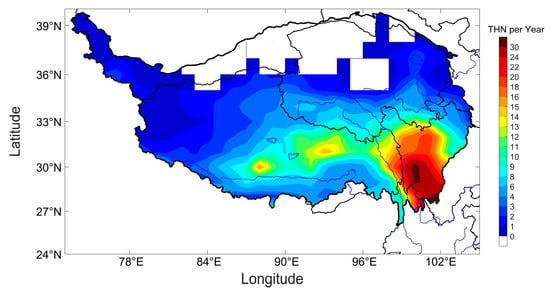
Figure 11.
Spatial distribution of extreme-lightning thunderstorms over the QTP with the statistical grid being 1° × 1°.
4.2. Structures of Extreme-Lightning Thunderstorms and Their Comparison with Normal Thunderstorms
Figure 12a presents the cloud area distributions of extreme-lightning and normal thunderstorms. The mean, 25th, 50th, and 75th values, and distribution peaks are marked on the graph. The average and median areas of the extreme-lightning thunderstorms were approximately 30 times those of normal thunderstorms. The distribution peak of the extreme-lightning thunderstorm cloud area was around 8.4 × 10⁴ km2, and the corresponding value for the normal thunderstorms was 3.4 × 10³ km2.
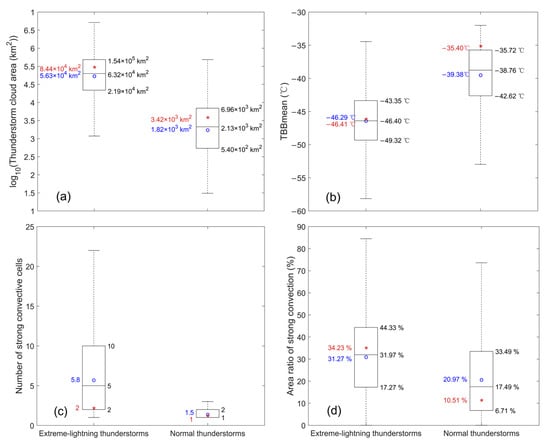
Figure 12.
Comparison of structural parameters of extreme-lightning thunderstorms with those of normal thunderstorms. (a) Cloud area; (b) average TBB; (c) number of strong convective cells; (d) area ratio of strong convection. The blue “o” represents the mean value, and the red “*” represents the distribution peak, which is obtained by the method of kernel density estimation (KDE).
Figure 12b shows that the extreme-lightning thunderstorms tended to have a lower average TBB than the normal thunderstorms. The former had a mean, median, and peak location average TBB of approximately −46.3, −46.4, and −46.4 ℃, respectively. The corresponding values for normal thunderstorm clouds were −35.4, −39.4, −38.8, and −35.4 °C. A smaller TBB value means higher cloud development and consequent stronger convection.
Figure 12c shows the distribution of the number of SCCs in extreme-lightning and normal thunderstorms, with the samples with no SCCs being excluded. The number of SCCs of extreme-lightning thunderstorms was mainly distributed from 1 to 22, with an average value of 5.8, a median value of 5, and a peak around 2. The corresponding values for normal thunderstorm values were 1–3, 1.5, 1, and 1. Obviously, the extreme-lightning thunderstorms tended to have more SCCs than the normal thunderstorms, with the former being 3.9 times that of the latter on average.
The comparison of the area ratio of SCCs between extreme-lightning thunderstorms and normal thunderstorms can be found in Figure 12d. The extreme-lightning thunderstorms had mean and median SCC area ratios of 31.3% and 32.0%, approximately 1.5 and 1.8 times those of normal thunderstorms (21.0% and 17.5%), respectively. Most samples of extreme-lightning thunderstorms had an SCC area ratio around 34.2%, much higher than the normal thunderstorms (10.5%). The larger SCC area ratio of extreme-lightning thunderstorms also suggests stronger convection relative to the normal thunderstorms, which is consistent with what the comparison of the average TBB between them indicated.
5. Discussion
5.1. Comparison of the Spatiotemporal Distribution of Thunderstorm Activity with Convection and Lightning Activity
Although there have been many studies on the convection clouds over the QTP, they are not exactly the same as thunderstorm clouds. Some convection clouds over the QTP that did not yield lightning and even significant precipitation were included in some previous studies [7,18,19]. The studies by Wu et al. [23] and Qie et al. [22] focused on the deep convective systems (DCSs) in the QTP region, referring to clouds with a 20 dBZ reflectivity over 14 km. Wu et al. [23] reported that around 40–50% of the samples in their dataset over the QTP did not generate lightning. These circumstances suggest that this study, which takes QTP thunderstorms as its subject, is not equivalent to previous studies on QTP convection. According to Wu et al. [23] and Qie et al. [22], the DCSs over the TP are more concentrated in the south part during the monsoon season of June–September, which roughly corresponds to the thunderstorm active area in Figure 5a. However, the month with the most frequent DCSs on the QTP is August, followed by July, and the frequency of DCSs decreases considerably in September [22]. For comparison, thunderstorms also have the greatest frequency in August, followed by September. The DCSs on the QTP peak at around 16:00 LT in the diurnal [22,23], which is slightly different from the peak of thunderstorm activity at 14:00–15:00 LT.
Some authors analyzed the characteristics of convective activity over the QTP by using the region with low TBB as a proxy for convection. Ma et al. [52] presented the spatial distribution of the occurrence probability of TBB ≤ −52 °C of the FY-2E satellite over the QTP. The regions with an occurrence probability of TBB ≤ −52 °C larger than 1% roughly correspond to those with THN greater than 30 per year in Figure 5a, and the locations featuring the large occurrence probability of TBB ≤ −52 °C generally correspond to the three active thunderstorm activity centers given in Figure 5a. However, the occurrence probability of TBB ≤ −52 °C is of significantly larger value and area in the southwestern QTP than in the south-central and southeastern QTP, while the thunderstorm activity was the strongest in the southeastern QTP, followed by the south-central and southwestern QTP.
Based on the TBB data of the FY-2E satellite from 2010 to 2014, Li et al. [62] took the areas with TBB ≤ −32 °C as the convections, and exhibited the spatial distributions of the occurrence frequency of TBB ≤ −32 °C over the QTP from May to August. They reported that the convective activities in May mainly occurred near the northwestern edge of the QTP and the eastern edge of the QTP (around the latitude of approximately 34°N); this is obviously different from the thunderstorm activity in May, which has low frequencies in these regions (Figure 5b). In June, the spatial distribution patterns of the thunderstorm activity and the occurrence frequency of TBB ≤ −32 °C are roughly similar, but Li et al. [62] documented the highest occurrence frequency of TBB ≤ −32 °C in the southeastern QTP; in contrast, the thunderstorm activity over the south-central QTP is almost equal to that of the southeastern QTP (Figure 5c). Li et al. [62] exhibited the maximum occurrence frequency of TBB ≤ −32 °C in July, with the large-value centers roughly corresponding to the south-central and southwestern centers of thunderstorm activity in our study, while the occurrence frequency of TBB ≤ −32 °C in the southeastern QTP was relatively weak. This is also different from the thunderstorm activity, which is relatively weak in July and more active in the eastern QTP (Figure 5d). In August, when the thunderstorm frequency over the whole QTP reaches its strongest and the southeastern QTP has the largest value (Figure 5e), Li et al. [62] recorded the decreasing occurrence frequency of TBB ≤ −32 °C and the maximum value in the southwestern QTP.
There are also evident differences in the spatial and temporal distribution of thunderstorm activity and lightning activity over the QTP. Most of the studies related to the overall lightning activity over the QTP were based on the OTD and LIS data [22,33,35,36,65]. These studies showed that there are two regions with the most frequent lightning activity over the QTP: one is the eastern QTP and the other is the south-central QTP. The first region, including the southeast and northeast parts of the QTP, exhibits a greater lighting density than the second region. In Figure 13, we show the same spatial distribution of lightning activity by using OTD and LIS data. Among them, the lightning activity centers in the southeastern and south-central QTP roughly correspond to the thunderstorm activity centers in these two places. However, the northeastern QTP, featuring a significantly high density of lightning activity, is characterized by relatively weak thunderstorm activity (Figure 5a). Meanwhile, in the southwestern QTP, where the thunderstorm activity is relatively frequent, lightning activity is generally weak and has no local high-density center. It should be noted that Ma et al. [52] and Li et al. [62] also exhibited that the northeastern (southwestern) QTP had a relatively low (high) occurrence probability of TBB ≤ −52 °C and TBB ≤ −32 °C, which is consistent with thunderstorm activity in spatial distribution.
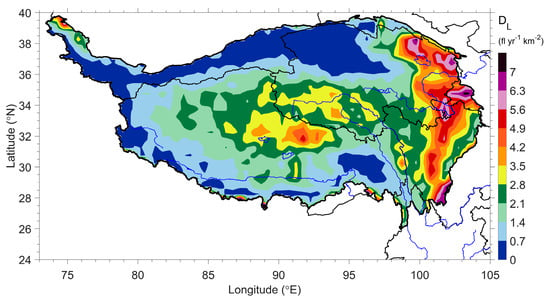
Figure 13.
Lightning distribution over the QTP observed by the OTD and LIS based on the 0.5° HRFC dataset.
Regarding the monthly variation in lightning activity over the QTP, Qie et al. [35], based on TRMM/LIS data from 1998 to 2002, obtained the peak lightning activity in June. Qi et al. [65] reported the peak lightning activity in July, using TRMM/LIS data from 1998 to 2013. These are different from the thunderstorm activity, which reached its peak in August. Meanwhile, while the lightning activity in September is not prominent [35,65], September displays the second most frequent thunderstorm activity. Qie et al. [35] showed that the peak of the diurnal variation in lightning activity was at 16:00 LT, which is the same as that of deep convection [22,23], but slightly different from that (14:00 LT) of thunderstorm activity.
5.2. Explanations for Different Spatial and Temporal Distributions between Thunderstorm and Lightning Activity
The differences between QTP thunderstorms and lightning activities in terms of spatial distribution and monthly changes are interesting, especially considering that thunderstorms are the origins of lightning.
Although with relatively low detection efficiency [51], the data from the WWLLN should not cause statistical distortion of thunderstorm activity. First of all, in the process of building the thunderstorm samples, the WWLLN lightning data were counted within 1 h, which should ensure that thunderstorms were captured efficiently, with one WWLLN lightning flash being enough to distinguish a cloud as a thunderstorm. Second, we obtained the relative detection efficiency (RDE) of WWLLN at a 1° × 1° grid point from http://wwlln.net/deMaps (accessed on 11 January 2022), and we show its spatial distribution over the QTP in Figure S1. The calculation method of the WWLLN RDE was developed from the model suggested by Hutchins et al. [66]; it used WWLLN’s own data to estimate the WWLLN RDE everywhere compared to the best average WWLLN detection efficiency. Figure S1 shows that, although the WWLLN RDE over the eastern QTP was higher than that over the western QTP, the difference between the maximum and the minimum RDEs is only approximately 5%. There is no apparent difference in RDE between the northern and southern parts of the QTP; meanwhile, the difference between lightning and thunderstorm activities in spatial distribution is reflected in the north–south direction. Therefore, the detection efficiency of WWLLN should not essentially affect the spatial distribution of thunderstorm activity. Furthermore, although the spatial distribution of the occurrence probability of low-value TBB exhibited by Ma et al. [52] and Li et al. [62] is not exactly the same as the thunderstorm activity, their results also indicated low values over the northeastern QTP and high values over the southwestern QTP, similar to the thunderstorm activity, but opposite to the lightning activity. In addition, the spatial distribution of thunderstorm days [12,52] also shows a generally similar pattern to the thunderstorm activity, especially wherein the thunderstorm days over the northeastern QTP are significantly lower than those over the centers of thunderstorm activity over the southern QTP. Based on the above analysis, we believe that the spatiotemporal distribution of thunderstorm activity given in this paper is credible.
We speculate that the differences in the spatiotemporal distributions between thunderstorm activity and lightning activity may be due to the following possibilities.
(1) The ability of thunderstorms to generate lightning, which is related to the intensity and size of the thunderstorms, may vary by region and season. The analysis of extreme-lightning thunderstorms in Section 4 indicates that thunderstorms with a larger extent and stronger convective intensity typically have a higher lightning frequency, which is consistent with the principle of lightning generation. From the analysis of the thunderstorm cloud area, the number of SCCs, and the area ratio of SSCs (Section 3.2), it can be seen that the thunderstorms in some areas of the northeastern QTP have a larger cloud area and area ratio of SCCs than those in the thunderstorm activity centers, which implies that the thunderstorms over the northeastern QTP region tend to have stronger lightning-yielding capacity. This makes it possible for the northeastern QTP to have more lightning despite the relatively low frequency of thunderstorms. Over the southwest thunderstorm activity center, the thunderstorms have a relatively smaller cloud area and a lower area ratio of SCCs, relative to those over the other two thunderstorm activity centers, which means that, even with frequent thunderstorm activity, the lightning frequency may be relatively low, caused by the relatively weak lightning-yielding capability. As for the southeastern QTP, although it features the highest-frequency thunderstorm activity and higher-frequency lightning activities, the lightning density is still weaker than the northern QTP, featuring lower-frequency thunderstorm activity (Figure 13). Checking the thunderstorm properties, we can find that there is a relatively low average thunderstorm cloud area over the southeastern QTP (Figure 6b); this may indicate that the lightning number involved in a thunderstorm there is much lower than that over the northeastern QTP.
The seasonal variation in thunderstorm intensity may be a factor responsible for the difference in thunderstorm activity and lightning activity in terms of their monthly variations. We show the monthly variations in some thunderstorm properties over the QTP from May to October in Figure S2, and find that the thunderstorm cloud area, ratio of the thunderstorms with SCCs, and area ratio all reach a peak in July, which corresponds to the peak month of lightning activity. Meanwhile, in terms of the ranking of the above three parameters of thunderstorms, September, which corresponds to the second most frequent thunderstorm activity, ranked only fourth, fourth, and third, respectively, in May–October. Apparently, the thunderstorms in July have a stronger ability to produce lightning than those in September.
(2) The features of the satellite-based lightning observation platform and the predominant discharge positions of QTP thunderstorms may be one of the reasons for the difference in the spatiotemporal distributions between thunderstorms and lightning activities. Both OTD and LIS captured lightning light signals by taking pictures in orbit. In principle, due to the attenuation function of the cloud to the lightning light, they should be more sensitive to the lightning occurring in the upper parts of clouds than the lightning occurring in the lower parts of the clouds. For most plain thunderstorms with a typical tripolar charge structure, the lightning flashes are mainly contributed by the upper two charge regions [67,68]—that is, the lightning discharge region near the upper part of the cloud, which is beneficial to OTD or LIS observations. For thunderstorms over the QTP, due to the relatively weak convection [21,22,23,25], electrification may mainly occur at lower altitudes. In the case of the tripolar charge structure, the lower positive charge region is more prominent than the upper positive charge region, and lightning flashes may be predominantly caused by the lower two charge regions [27,28,29,30,31]. Under these circumstances, OTD and LIS have the potential to miss a lot of lightning. Qie et al. [69] reported that the ratio of the thunderstorms with predominantly lower positive charge increased with the elevation of the terrain. Among the places they investigated, they reported that approximately 60% and 73% of the investigated thunderstorms over Datong (a city in the northeastern QTP, located at approximately 36.9°N, 101.7°N) and Naqu (a city corresponding to the south-central thunderstorm and lightning activity center; see Figure 2), respectively, had a prominent lower positive charge (another two places with an altitude exceeding 1500 m are beyond the analysis region). This may suggest that the OTD and LIS had higher detection efficiencies over the northeastern QTP than over the south-central QTP. There are no studies on the charge structure of the thunderstorms over other places in the QTP and their seasonal variation. However, considering the possible impact of the lightning discharge location on OTD and LIS detection efficiency, the spatiotemporal difference in the charge structure over the TP may be a factor responsible for the comparison of thunderstorm and lightning activity.
(3) Although we mentioned earlier that the low detection efficiency of WWLLN should not have a substantial impact on the representativeness of thunderstorm samples, the preference of WWLLN detection for CG lightning may have more or less impact on the shown differences in the spatiotemporal distributions between thunderstorm and QTD and LIS lightning activities. As Fan et al. [51] estimated, approximately 71.9% of WWLLN lightning data came from CG lightning in the mid-southern QTP. If a thunderstorm lacked CG lightning with strong return strokes, it might not be involved in the thunderstorm samples. Some previous studies have suggested that thunderstorms with extremely strong convection, such as supercell storms, may feature low-rate CG lightning [70,71,72], and the return strokes of CG lightning occurring in the strong convection zone may be relatively weak [73]. Therefore, some severe convective thunderstorms with low-rate and weak-return-stroke CG lightning might be missed by the WWLLN and therefore the TFD. Meanwhile, severe convective thunderstorms typically yield active intracloud lightning over the upper parts which could be captured by OTD and LIS. However, we still insist that this situation is too rare to change the conclusion, because the thunderstorms over the QTP are generally weak in intensity [25].
6. Conclusions
In this study, the TFD established based on the TBB and CLC products of the FY-2E geostationary satellite and WWLLN lightning data was used to analyze the spatiotemporal distribution of thunderstorm activities and some cloud properties over the QTP. The main conclusions are as follows.
In terms of monthly variation, approximately 93.9% of the QTP thunderstorms occur in May–September, with the highest frequency in August and the second highest frequency in September. In terms of diurnal variation, approximately 82.7% of thunderstorms occur between 12:00 and 21:00 LT, with a peak at 14:00 LT. The peak time is advanced month by month from May to July, and backward month by month from August to September.
Over the QTP, the thunderstorm activities in the southern and eastern parts are generally stronger than those in the north and west, respectively. There are three regions with the most frequent thunderstorm activity in the southeastern, south-central, and southwestern QTP, roughly corresponding to Xiangcheng–Daocheng in Sichuan, Lhasa–Nagqu in Tibet, and Shigatse in Tibet, respectively. The thunderstorm activities over the southeastern and southwestern regions are the strongest in August; the corresponding peak month of the thunderstorm activity over the south-central QTP is September. Before August (inclusive), the area with active thunderstorm activity as a whole advances from west to east; after this time, it retreats eastward.
The average cloud area of a thunderstorm over the QTP is 1.8 × 10⁴ km2, with approximately 42.9% of thunderstorm samples in the warm season having a cloud area of between 1 × 10³ and 1 × 10⁴ km2. The Qinghai part of the QTP generally features a greater thunderstorm cloud area than the Tibet region. In the three high-density centers of thunderstorm activity, the thunderstorm cloud areas are all relatively small.
There are approximately 32.9% of QTP thunderstorms that contain SSCs. In most parts of the QTP, this proportion is between 20% and 50%. The high proportions of thunderstorms with SCCs can be found in several centers featuring relatively large thunderstorm cloud areas and the northeastern and southwestern QTP, while low proportions are located in the north and northwest parts of the QTP. The average number of SCCs in the thunderstorms (with SCCs) is 3.6, with most samples having an SCC number from 1 to 3. Thunderstorms located at longitude 83°E–96°E and latitude 29°N–34°N have the highest average SCC number. With regard to the area ratio of SCC, 47.1% of the thunderstorm samples containing SCCs have a value less than 20%, with an average of 25.4%. The thunderstorms with an area ratio of SCC greater than 30% are mainly distributed in the northeastern QTP and the central and eastern parts of the southern QTP.
The monthly and diurnal variation and spatial distribution of extreme-lightning thunderstorms over the QTP are roughly similar to all thunderstorms in their patterns. Meanwhile, the extreme-lightning thunderstorms are more concentrated in June–September, and are not active in May (different from all other thunderstorms). Among the areas with high-frequency extreme-lightning thunderstorms, the southeast one is much more prominent. The cloud area, number of SCCs, and area ratio of SCCs of the extreme-lightning thunderstorms are approximately 30.0, 3.9, and 1.5 times those of normal thunderstorm clouds, respectively.
It is found that the thunderstorm activity is somewhat different from the convection and lightning activity in their spatiotemporal distribution. In particular, the comparison of the spatial distributions between the thunderstorm activity and OTD and LIS lightning activity shows disagreement in the northeastern and southwestern QTP. While the lightning density shows the largest value over the northeastern QTP and a relatively small value over the southwestern QTP, the thunderstorm shows relatively low and high frequency there, respectively. In terms of monthly variation, the peak of thunderstorm activity is in August, different from the lightning activity in June [35] or July [65]. We have carried out a discussion and deduced that the difference in spatiotemporal distributions between thunderstorm and lightning activities may be mainly related to (1) the intensity of the thunderstorm and, therefore, the ability of the thunderstorm to yield lightning, which vary with region and season over the QTP; and (2) the situations wherein the lightning discharges are predominantly contributed by the upper charge regions or the lower charge regions vary with region and season, which impacts the spatiotemporal distribution of the detection efficiency of satellite-based lightning optical detection instruments, such as OTD and LIS.
Supplementary Materials
The following supporting information can be downloaded at: https://www.mdpi.com/article/10.3390/rs14122855/s1, Figure S1: Spatial distributions of average relative detection efficiency of the WWLLN over the QTP from 2010 to 2018; Figure S2: Monthly variations in thunderstorm properties including average cloud area, proportion of thunderstorms containing strong convective cells (SCC), SCC number, and area ratio of SCC over the QTP from May to October.
Author Contributions
Conceptualization, D.Z.; methodology, D.Z. and Y.D.; software and validation, Y.D. and R.M.; formal analysis, Y.D., D.Z. and R.M.; investigation, D.Z., Y.D., R.M., Y.Z., W.L., W.Y., W.Z., L.C. and D.C.; resources, D.Z., R.M., W.Z., L.C. and D.C.; data curation, Y.D. and W.Y.; writing—original draft preparation, Y.D., D.Z. and Y.Z.; writing—review and editing, D.Z. and Y.Z.; visualization, Y.D.; supervision, D.Z., Y.Z., W.L.; project administration, D.Z. and W.L.; funding acquisition, W.L. and D.Z.; All authors have read and agreed to the published version of the manuscript.
Funding
This research was funded by the Second Tibetan Plateau Scientific Expedition and Research (STEP) Program (2019QZKK0104) and Basic Research Fund of CAMS (2020Z009).
Data Availability Statement
The data associated with this paper can be accessed from https://doi.org/10.5281/zenodo.6614568 (accessed on 20 April 2022) or from the corresponding author.
Conflicts of Interest
The authors declare no conflict of interest.
References
- Bian, J.; Li, D.; Bai, Z.; Li, Q.; Lyu, D.; Zhou, X. Transport of Asian surface pollutants to the global stratosphere from the Tibetan Plateau region during the Asian summer monsoon. Natl. Sci. Rev. 2020, 7, 516–533. [Google Scholar] [CrossRef] [Green Version]
- Liu, Y.; Lu, M.; Yang, H.; Duan, A.; He, B.; Yang, S.; Wu, G. Land–atmosphere–ocean coupling associated with the Tibetan Plateau and its climate impacts. Natl. Sci. Rev. 2020, 7, 534–552. [Google Scholar] [CrossRef] [Green Version]
- Wu, G. Land–air coupling over the Tibetan Plateau and its climate impacts. Natl. Sci. Rev. 2020, 7, 485. [Google Scholar] [CrossRef]
- Xu, X.; Zhou, M.; Chen, J.; Bian, L.; Zhang, G.; Liu, H.; Li, S.; Zhang, H.; Zhao, Y.; Jizhi, W. A comprehensive physical pattern of land-air dynamic and thermal structure on the Qinghai-Xizang Plateau. Sci. China Ser. D: Earth Sci. 2002, 45, 577–594. [Google Scholar] [CrossRef]
- Zhao, P.; Xu, X.; Chen, F.; Guo, X.; Zheng, X.; Liu, L.; Hong, Y.; Li, Y.; La, Z.; Peng, H.; et al. The third atmospheric scientific experiment for understanding the earth–atmosphere coupled system over the Tibetan Plateau and its effects. Bull. Am. Meteorol. Soc. 2018, 99, 757–776. [Google Scholar] [CrossRef]
- Zhao, P.; Li, Y.; Guo, X.; Xu, X.; Liu, Y.; Tang, S.; Xiao, W.; Shi, C.; MA, Y.; Yu, X.; et al. The Tibetan Plateau surface-atmosphere coupling system and its weather and climate effects: The Third Tibetan Plateau Atmospheric Science Experiment. J. Meteorol. Res. 2019, 33, 375–399. [Google Scholar] [CrossRef]
- Bao, X.; Yao, X. Intensity evolution of zonal shear line over the Tibetan Plateau in summer: A perspective of divergent and rotational kinetic energies. Adv. Atmos. Sci. 2022, 39, 1021–1033. [Google Scholar] [CrossRef]
- Lin, Z. Analysis of Tibetan Plateau vortex activities using ERA-Interim data for the period 1979–2013. J. Meteorol. Res. 2015, 29, 720–734. [Google Scholar] [CrossRef]
- Lin, Z.; Yao, X.; Guo, W.; Du, J. Vertical structure of Tibetan Plateau Vortex in boreal summer. Theor. Appl. Climatol. 2021, 145, 427–440. [Google Scholar] [CrossRef]
- Qian, Z.; Zhang, S.; Shan, F. Collection of Meteorological Science Experiments on the Qinghai-Tibet Plateau; Science Press: Beijing, China, 1984. [Google Scholar]
- Sugimoto, S.; Ueno, K. Formation of mesoscale convective systems over the eastern Tibetan Plateau affected by plateau-scale heating contrasts. J. Geophys. Res. Atmos. 2010, 115. [Google Scholar] [CrossRef]
- CMA (China Meteorological Administration). Atlas of China Disastrous Weather and Climate; Meteorological Press: Beijing, China, 2007; p. 21. [Google Scholar]
- Baker, M.B.; Blyth, A.M.; Christian, H.J.; Latham, J.; Miller, K.A.; Gadian, A.M. Relationships between lightning activity and various thundercloud parameters: Satellite and modelling studies. Atmos. Res. 1999, 51, 221–236. [Google Scholar] [CrossRef]
- Price, C. Evidence for a link between global lightning activity and upper tropospheric water vapour. Nature 2000, 406, 290–293. [Google Scholar] [CrossRef]
- Gordillo-Vázquez, F.J.; Pérez-Invernón, F.J.; Huntrieser, H.; Smith, A.K. Comparison of six lightning parameterizations in CAM5 and the impact on global atmospheric chemistry. Earth Space Sci. 2019, 6, 2317–2346. [Google Scholar] [CrossRef]
- Guo, F.; Ju, X.; Bao, M.; Lu, G.; Liu, Z.; Li, Y.; Mu, Y. Relationship between lightning activity and tropospheric nitrogen dioxide and the estimation of lightning-produced nitrogen oxides over China. Adv. Atmos. Sci. 2017, 34, 235–245. [Google Scholar] [CrossRef]
- Guo, F.; Mu, Y.; Li, Y.; Wang, M.; Huang, Z.; Zeng, F.; Lian, C. Effects of nitrogen oxides produced from lightning on the formation of the Ozone Valley over the Tibetan Plateau. Chin. J. Atmos. Sci 2019, 43, 266–276. (In Chinese) [Google Scholar]
- Ye, D.; Gao, Y. Meteorology on the Qinghai-Tibet Plateau; Science Press: Beijing, China, 1979. [Google Scholar]
- Dai, J. Climate on the Qinghai-Tibet Plateau; China Meteorological Press: Beijing, China, 1990. [Google Scholar]
- Fu, Y.; Liu, G.; Wu, G.; Yu, R.; Xu, Y.; Wang, Y.; Li, R.; Liu, Q. Tower mast of precipitation over the central Tibetan Plateau summer. Geophys. Res. Lett. 2006, 33. [Google Scholar] [CrossRef] [Green Version]
- Luo, Y.; Zhang, R.; Qian, W.; Luo, Z.; Hu, X. Intercomparison of deep convection over the Tibetan Plateau–Asian monsoon region and subtropical North America in boreal summer using CloudSat/CALIPSO data. J. Clim. 2011, 24, 2164–2177. [Google Scholar] [CrossRef] [Green Version]
- Qie, X.; Wu, X.; Yuan, T.; Bian, J.; Lu, D. Comprehensive pattern of deep convective systems over the Tibetan Plateau–South Asian monsoon region based on TRMM data. J. Clim. 2014, 27, 6612–6626. [Google Scholar] [CrossRef]
- Wu, X.; Qie, X.; Yuan, T. Regional distribution and diurnal variation of deep convective systems over the Asian monsoon region. Sci. China Earth Sci. 2013, 56, 843–854. [Google Scholar] [CrossRef]
- Zhang, H.; Guo, S.; Zhang, Y.; Cheng, G.; Shi, Y.; Pubu, Z.; Hou, Z.J. Distribution characteristic of severe convective thunderstorm cloud over Qinghai-Xizang Plateau. Plateau Meteorol. 2003, 22, 558–564. (In Chinese) [Google Scholar]
- Zheng, D.; Zhang, Y. New Insights into the Correlation between Lightning Flash Rate and Size in Thunderstorms. Geophys. Res. Lett. 2021, 48, e2021GL096085. [Google Scholar] [CrossRef]
- Li, Y.; Zhang, G.; Zhang, Y. Evolution of the Charge Structure and Lightning Discharge Characteristics of a Qinghai-Tibet Plateau Thunderstorm Dominated by Negative Cloud-to-Ground Flashes. J. Geophys. Res. Atmos. 2020, 125, e2019JD031129. [Google Scholar] [CrossRef]
- Guo, F.; Wang, M.; Huang, Z.; Li, Y.; Mu, Y.; Lian, C.; Zeng, F. The model analysis of lightning discharge structure characters and attributions over Qinghai-Tibetan Plateau. Plateau Meteorol. 2018, 37, 911–922. (In Chinese) [Google Scholar]
- Qie, X.; Zhang, T.; Chen, C.; Zhang, G.; Zhang, T.; Wei, W. The lower positive charge center and its effect on lightning discharges on the Tibetan Plateau. Geophys. Res. Lett. 2005, 32. [Google Scholar] [CrossRef] [Green Version]
- Wang, F.; Deng, X.; Zhang, Y.; Li, Y.; Zhang, G.; Xu, L.; Zheng, D. Numerical simulation of the formation of a large lower positive charge center in a Tibetan Plateau thunderstorm. J. Geophys. Res. Atmos. 2019, 124, 9561–9593. [Google Scholar] [CrossRef]
- Zhang, T.; Qie, X.; Yan, M. The lightning characteristics of thunderstorm over Tibetan Plateau and its origin discussion. Plateau Meteor. 2007, 26, 774–782. (In Chinese) [Google Scholar]
- Zhang, Y.; Dong, W.; Zhao, Y.; Zhang, G.; Zhang, H.; Chen, C.; Zhang, T. Study of charge structure and radiation characteristic of intracloud discharge in thunderstorms of Qinghai-Tibet Plateau. Sci. China Ser. D. Earth Sci. 2004, 47, 108–114. [Google Scholar]
- You, J.; Zheng, D.; Zhang, Y.; Yao, W.; Meng, Q. Duration, spatial size and radiance of lightning flashes over the Asia-Pacific region based on TRMM/LIS observations. Atmos. Res. 2019, 223, 98–113. [Google Scholar] [CrossRef]
- Ma, M.; Tao, S.; Zhu, B.; Lü, W. Climatological distribution of lightning density observed by satellites in China and its circumjacent regions. Sci. China Ser. D. Earth Sci. 2005, 48, 219–229. [Google Scholar] [CrossRef]
- Yuan, T.; Qie, X. Spatial and temporal distributions of lightning activities in China from satellite observation. Plateau Meteor. 2004, 23, 488–494. (In Chinese) [Google Scholar]
- Qie, X.; Toumi, R.; Yuan, T. Lightning activities on the Tibetan Plateau as observed by the lightning imaging sensor. J. Geophys. Res. Atmos. 2003, 108. [Google Scholar] [CrossRef]
- Qie, X.; Toumi, R.; Zhou, Y. Characteristics of lightning activity and its response to convective available potential energy over the central Tibetan Plateau. Chin. Sci. Bull. 2003, 48, 87–90. [Google Scholar]
- Fu, Y.; Ma, Y.; Zhong, L.; Yang, Y.; Guo, X.; Wang, C.; Xu, X.; Yang, K.; Xu, X.; Liu, L.; et al. Land-surface processes and summer-cloud-precipitation characteristics in the Tibetan Plateau and their effects on downstream weather: A review and perspective. Natl. Sci. Rev. 2020, 7, 500–515. [Google Scholar] [CrossRef] [Green Version]
- Qie, X.; Yu, Y.; Wang, D.; Wang, H.; Chu, R. Characteristics of cloud-to-ground lightning in Chinese inland plateau. J. Meteorol. Soc. Japan. Ser. II 2002, 80, 745–754. [Google Scholar] [CrossRef] [Green Version]
- Wang, H.; Luo, Y.L.; Zhang, R.H. Analyzing seasonal variation of clouds over the Asian monsoon regions and the Tibetan Plateau region using CloudSat/CALIPSO data. Chin. J. Atmos. Sci. 2011, 35, 1117–1131. (In Chinese) [Google Scholar]
- Li, J.; Wu, X.; Yuan, T.; Qie, X.; Yang, J. The temporal and spatial distribution of thunderstorms in Asia Monsoon Region based on the TRMM multi-sensor database. Chin. J. Geophys. 2019, 62, 4098–4109. (In Chinese) [Google Scholar]
- Liu, C.; Zipser, E.J.; Cecil, D.J.; Nesbitt, S.W.; Sherwood, S. A cloud and precipitation feature database from nine years of TRMM observations. J. Appl. Meteorol. Climatol. 2008, 47, 2712–2728. [Google Scholar] [CrossRef]
- Betz, H.D.; Schmidt, K.; Oettinger, W.P.; Montag, B. Cell-tracking with lightning data from LINET. Adv. Geosci. 2008, 17, 55–61. [Google Scholar] [CrossRef] [Green Version]
- Hutchins, M.L.; Holzworth, R.H.; Brundell, J.B. Diurnal variation of the global electric circuit from clustered thunderstorms. J. Geophys. Res. Space Phys. 2014, 119, 620–629. [Google Scholar] [CrossRef]
- Mezuman, K.; Price, C.; Galanti, E. On the spatial and temporal distribution of global thunderstorm cells. Environ. Res. Lett. 2014, 9, 124023. [Google Scholar] [CrossRef]
- Shi, M.; Zhang, W.; Fan, P.; Chen, Q.; Liu, Z.; Li, Q.; Liu, X. Modelling deep convective activity using lightning clusters and machine learning. Int. J. Climatol. 2022, 42, 952–973. [Google Scholar] [CrossRef]
- Tuomi, T.J.; Larjavaara, M. Identification and analysis of flash cells in thunderstorms. Q. J. R. Meteorol. Soc. A J. Atmos. Sci. Appl. Meteorol. Phys. Oceanogr. 2005, 131, 1191–1214. [Google Scholar] [CrossRef]
- Zhou, X.; Zhang, W.; Zhang, Y.; Sun, X.; Zheng, D.; Yao, W. Characteristics of thunderstorm activity in the northwest pacific based on lightning clustering method. J. Trop. Meteorol. 2021, 37, 490–501. (In Chinese) [Google Scholar]
- Ma, R.; Zheng, D.; Yao, W.; Zhang, W. Thunderstorm feature dataset and characteristics of thunderstorm activities in China. J. Appl. Meteorol. Sci. 2021, 32, 358–369. (In Chinese) [Google Scholar]
- Dowden, R.L.; Brundell, J.B.; Rodger, C.J. VLF lightning location by time of group arrival (TOGA) at multiple sites. J. Atmos. Sol. Terr. Phys. 2002, 64, 817–830. [Google Scholar] [CrossRef]
- Dowden, R.L.; Holzworth, R.H.; Rodger, C.J.; Lichtenberger, J.; Thomson, N.R.; Jacobson, A.R.; Lay, E.; Brundell, J.B.; Lyons, T.J.; O’Keefe, S.; et al. World-wide lightning location using VLF propagation in the Earth-ionosphere waveguide. IEEE Antennas Propag. Mag. 2008, 50, 40–60. [Google Scholar] [CrossRef] [Green Version]
- Fan, P.; Zheng, D.; Zhang, Y.; Gu, S.; Zhang, W.; Yao, W.; Yan, B.; Xu, Y. A performance evaluation of the World Wide Lightning Location Network (WWLLN) over the Tibetan Plateau. J. Atmos. Ocean. Technol. 2018, 35, 927–939. [Google Scholar] [CrossRef]
- Ma, R.; Zheng, D.; Zhang, Y.; Yao, W.; Zhang, W.; Cuomu, D. Spatiotemporal lightning activity detected by WWLLN over the Tibetan Plateau and its comparison with LIS lightning. J. Atmos. Ocean. Technol. 2021, 38, 511–523. [Google Scholar] [CrossRef]
- Maddox, R.A. Mesoscale convective complexes. Bull. Am. Meteorol. Soc. 1980, 61, 1374–1387. [Google Scholar] [CrossRef]
- Yao, X.; Yu, Y.; Zhao, B. Structural characteristic of Meiyu frontal cloud system and its probable causes. Plateau Meteorol. 2005, 24, 1002–1011. (In Chinese) [Google Scholar]
- Zheng, Y.; Chen, J.; Zhu, P. Climatological distribution and diurnal variation of summer mesoscale convective system in China and its adjacent areas. Chin. Sci. Bull. 2008, 53, 1574–1586. [Google Scholar]
- Zhang, Y.; Li, B.; Zheng, D. A discussion on the boundary and area of the Tibetan Plateau in China. Geogr. Res. 2002, 21, 1–8. (In Chinese) [Google Scholar]
- Cecil, D.J.; Buechler, D.E.; Blakeslee, R.J. Gridded lightning climatology from TRMM-LIS and OTD: Dataset description. Atmos. Res. 2014, 135, 404–414. [Google Scholar] [CrossRef] [Green Version]
- Boccippio, D.J.; Koshak, W.J.; Blakeslee, R.J. Performance assessment of the optical transient detector and lightning imaging sensor. Part I: Predicted diurnal variability. J. Atmos. Ocean. Technol. 2002, 19, 1318–1332. [Google Scholar] [CrossRef]
- Christian, H.J.; Blakeslee, R.J.; Boccippio, D.J.; Boeck, W.L.; Buechler, D.E.; Driscoll, K.T.; Goodman, S.J.; Hall, J.M.; Koshak, W.J.; Mach, D.M.; et al. Global frequency and distribution of lightning as observed from space by the Optical Transient Detector. J. Geophys. Res. Atmos. 2003, 108, ACL 4-1–ACL 4-15. [Google Scholar] [CrossRef]
- Jiang, J.X.; Fan, M.Z. Convective clouds and mesoscale convective systems over the Tibetan Plateau in summer. Chin. J. Atmos. Sci. 2002, 26, 263–270. (In Chinese) [Google Scholar]
- Zhang, Q.; Jin, Z.; Peng, J. The relationships between convection over the Tibetan Plateau and circulation over East Asian. Chin. J. Atmos. Sci. 2006, 30, 802. (In Chinese) [Google Scholar]
- Bo, L.I.; Liu, Y.A.N.G.; Shihao, T.A.N.G. Intraseasonal variations of summer convection over the Tibetan Plateau revealed by geostationary satellite FY-2E in 2010–2014. J. Meteor. Res. 2019, 33, 478–490. [Google Scholar]
- Laing, A.G.; Michael Fritsch, J. The global population of mesoscale convective complexes. Q. J. R. Meteorol. Soc. 1997, 123, 389–405. [Google Scholar] [CrossRef]
- Yang, X.; Fei, J.; Huang, X.; Cheng, X.; Carvalho, L.M.; He, H. Characteristics of mesoscale convective systems over China and its vicinity using geostationary satellite FY2. J. Clim. 2015, 28, 4890–4907. [Google Scholar] [CrossRef]
- Qi, P.; Zhang, D.; Zhang, Y.; Gao, L. Climatological characteristics and spatio-temporal correspondence of lightning and precipitation over the Tibetan Plateau. J. Appl. Meteorol. Sci. 2016, 27, 488–497. (In Chinese) [Google Scholar]
- Hutchins, M.L.; Holzworth, R.H.; Brundell, J.B.; Rodger, C.J. Relative detection efficiency of the world wide lightning location network. Radio Sci. 2012, 47, 1–9. [Google Scholar] [CrossRef]
- Proctor, D.E. Regions where lightning flashes began. J. Geophys. Res. Atmos. 1991, 96, 5099–5112. [Google Scholar] [CrossRef]
- Zheng, D.; Shi, D.; Zhang, Y.; Zhang, Y.; Lyu, W.; Meng, Q. Initial leader properties during the preliminary breakdown processes of lightning flashes and their associations with initiation positions. J. Geophys. Res. Atmos. 2019, 124, 8025–8042. [Google Scholar] [CrossRef]
- Qie, X.; Zhang, T.; Zhang, G.; Zhang, T.; Kong, X. Electrical characteristics of thunderstorms in different plateau regions of China. Atmos. Res. 2009, 91, 244–249. [Google Scholar] [CrossRef]
- Zheng, D.; Zhang, Y.; Meng, Q. Properties of negative initial leaders and lightning flash size in a cluster of supercells. J. Geophys. Res. Atmos. 2018, 123, 12857–12876. [Google Scholar] [CrossRef]
- Lang, T.J.; Rutledge, S.A.; Dye, J.E.; Venticinque, M.; Laroche, P.; Defer, E. Anomalously low negative cloud-to-ground lightning flash rates in intense convective storms observed during STERAO-A. Mon. Weather. Rev. 2000, 128, 160–173. [Google Scholar] [CrossRef]
- Soula, S.; Seity, Y.; Feral, L.; Sauvageot, H. Cloud-to-ground lightning activity in hail-bearing storms. J. Geophys. Res. Atmos. 2004, 109, D02101. [Google Scholar] [CrossRef]
- Wang, F.; Zhang, Y.; Liu, H.; Yao, W.; Meng, Q. Characteristics of cloud-to-ground lightning strikes in the stratiform regions of mesoscale convective systems. Atmos. Res. 2016, 178–179, 207–216. [Google Scholar] [CrossRef]
Publisher’s Note: MDPI stays neutral with regard to jurisdictional claims in published maps and institutional affiliations. |
© 2022 by the authors. Licensee MDPI, Basel, Switzerland. This article is an open access article distributed under the terms and conditions of the Creative Commons Attribution (CC BY) license (https://creativecommons.org/licenses/by/4.0/).