Article

A Comprehensive Assessment of Climate Change and Coastal Inundation through Satellite-Derived Datasets: A Case Study of Sabang Island, Indonesia

by
Komali Kantamaneni
1,*,
David Christie
2,
Charlotte E. Lyddon
3,
Peng Huang
4,
Muhammad Nizar
5,
Karuppusamy Balasubramani
6,
Venkatesh Ravichandran
7,
Kumar Arun Prasad
6,
Robert Ramesh Babu Pushparaj
8,
Peter Robins
2 and
Sigamani Panneer
9
1
Faculty of Science and Technology, University of Central Lancashire, Preston PR1 2HE, UK
2
School of Ocean Sciences, Bangor University, Menai Bridge LL59 5AB, UK
3
Department of Geography and Planning, University of Liverpool, Liverpool L69 7ZT, UK
4
Department of Materials, University of Manchester, Manchester M13 9PL, UK
5
Environmental Engineering Department, Universitas Serambi Mekkah, Banda Aceh 23246, Indonesia
6
Department of Geography, Central University of Tamil Nadu, Thiruvarur 610005, India
7
Department of Civil Engineering, Indian Institute of Technology Guwahati, Guwahati 781039, India
8
Department of Social Work, School of Social Sciences & Humanities, Central University of Tamil Nadu, Thiruvarur 610005, India
9
Centre for Happiness, Department of Social Work, School of Social Sciences & Humanities, Central University of Tamil Nadu, Thiruvarur 610005, India
*
Author to whom correspondence should be addressed.
Remote Sens. 2022, 14(12), 2857; https://doi.org/10.3390/rs14122857
Submission received: 30 April 2022 / Revised: 8 June 2022 / Accepted: 12 June 2022 / Published: 15 June 2022

Abstract

:
Climate-change-induced hazards are negatively affecting the small islands across Indonesia. Sabang Island is one of the most vulnerable small islands due to the rising sea levels and increasing coastal inundation which threaten the low-lying coastal areas with and without coastal defences. However, there is still a lack of studies concerning the long-term trends in climatic variables and, consequently, sea level changes in the region. Accordingly, the current study attempts to comprehensively assess sea level changes and coastal inundation through satellite-derived datasets and model-based products around Sabang Island, Indonesia. The findings of the study show that the temperature (both minimum and maximum) and rainfall of the island are increasing by ~0.01 °C and ~11.5 mm per year, respectively. The trends of temperature and rainfall are closely associated with vegetative growth; an upward trend in the dense forest is noticed through the enhanced vegetation index (EVI). The trend analysis of satellite altimeter datasets shows that the sea level is increasing at a rate of 6.6 mm/year. The DEM-based modelling shows that sea level rise poses the greatest threat to coastal habitations and has significantly increased in recent years, accentuated by urbanisation. The GIS-based model results predict that about half of the coastal settlements (2.5 sq km) will be submerged completely within the next 30 years, provided the same sea level rise continues. The risk of coastal inundation is particularly severe in Sabang, the largest town on the island. The results allow regional, sub-regional, and local comparisons that can assess variations in climate change, sea level rise, coastal inundation, and associated vulnerabilities.

Graphical Abstract

1. Introduction

The earth’s temperature has increased by 0.14 °F (0.08 °C) every ten years since 1880. It has almost doubled (increased by 0.32 °F/0.18 °C) since 1981. Globally, 2020 was one of the warmest years on record (+1.12 °C since 1880) [1], whilst 2021 was the sixth warmest year [2]. The surface ocean water is also warming. It has increased by ~0.13 °C every ten years over the last hundred years [3]. Sea level has risen by 21 to 24 centimetres since 1880, mostly rising in the last few decades [4]. In 2020, the global mean sea level rise reached a new high and had increased 9.13 cm from 1993 levels [5]. The compounding effect of warming and sea level rise negatively affects coastal systems and human communities. The Asia-Pacific coastal region, in particular, coastal populations in India, Bangladesh, Vietnam, and Indonesia, are highly exposed to extreme coastal hazards that are predicted to worsen in the upcoming years [6].
Indonesia, Far East Asia, is an island nation with an 81,000 km coastline comprising over 17,500 islands. Several extreme weather events, such as intense rainfall, tropical cyclones, and tsunamis, have occurred in the coastal areas of the islands in recent decades, leading to natural disasters [7,8]. In April 2021, Tropical Cyclone Seroja caused intense rainfall (up to 100 mm/day over five days), strong winds, and wave setup which caused over 180 deaths in the East Nusa Tenggara province [9]. Despite this, the annual population continues to grow at a rate of ~1.1% [10], and towns and cities are widening along the coastal stretches. The average population density in Indonesian coastal areas (80 persons/sq km) is twice the world’s average [11]. Indonesians prefer to stay near the coast due to the potential livelihood benefits such as fishing. Climate change is, therefore, a serious issue facing Indonesia, where the projected changes in temperatures, rainfall behaviour, and sea level are expected to negatively affect coastal systems and communities [12,13,14,15]. In particular, the vulnerability of coastal communities is increasing in many Indonesian islands due to coastal inundation. According to the IPCC [16], the Indonesian sea level will rise ~100 cm by 2100 due to global, national, and regional climatic changes, and this could ultimately lead to exacerbated coastal floods, erosion, and land subsidence. Rapid urbanisation and land use changes, for example, the expansion of monocultures and deforestation [17,18], on Indonesian islands are expected to increase the disaster risks further [19,20,21].
Consequently, they need to employ local adaptation and mitigation measures against sea level rise, with in situ adaptation measures, such as flood proofing property by raising floors [22,23] or income diversification in regions where fishing is impacted by changing storm patterns, preferred to relocation to the mainland [6,11,24]. The coastal zones of Indonesia require increased attention from planners and policymakers to address the predicted climate-driven challenges faced by both coastal ecosystems and socio-economic systems. While the Indonesian coasts provide many economic benefits [25], many human habitations are exposed to a variety of natural hazards, such as cyclones, erosion, saltwater intrusion, subsidence, tsunamis, and floods, due to climate change and sea level rise [26]. These hazards cannot be prevented, but the disruption and loss of human life can be mediated by implementing appropriate strategies in advance. Such strategies require a systematic assessment of the impacts of climate change and sea level rise on coastal hazards and inundation.
The literature to date on Indonesian coastal risks has focused on the major cities/islands of the country [27,28,29,30]. Many small islands in Indonesia have limited resources and are prone to natural disasters and vulnerable to climate change. Sabang Island attracts tourists from all over the world and has experienced land use degradation, rapid development, and coastal inundation [31]. Only a few researchers have analysed Sabang Island’s vulnerability to coastal hazards via systematic long-term datasets. This literature is not adequate to understand micro-level climate change and coastal inundation. The current study, therefore, evaluates Sabang Island’s vulnerability to climate change and coastal inundation using satellite datasets and GIS tools to fill this research gap.

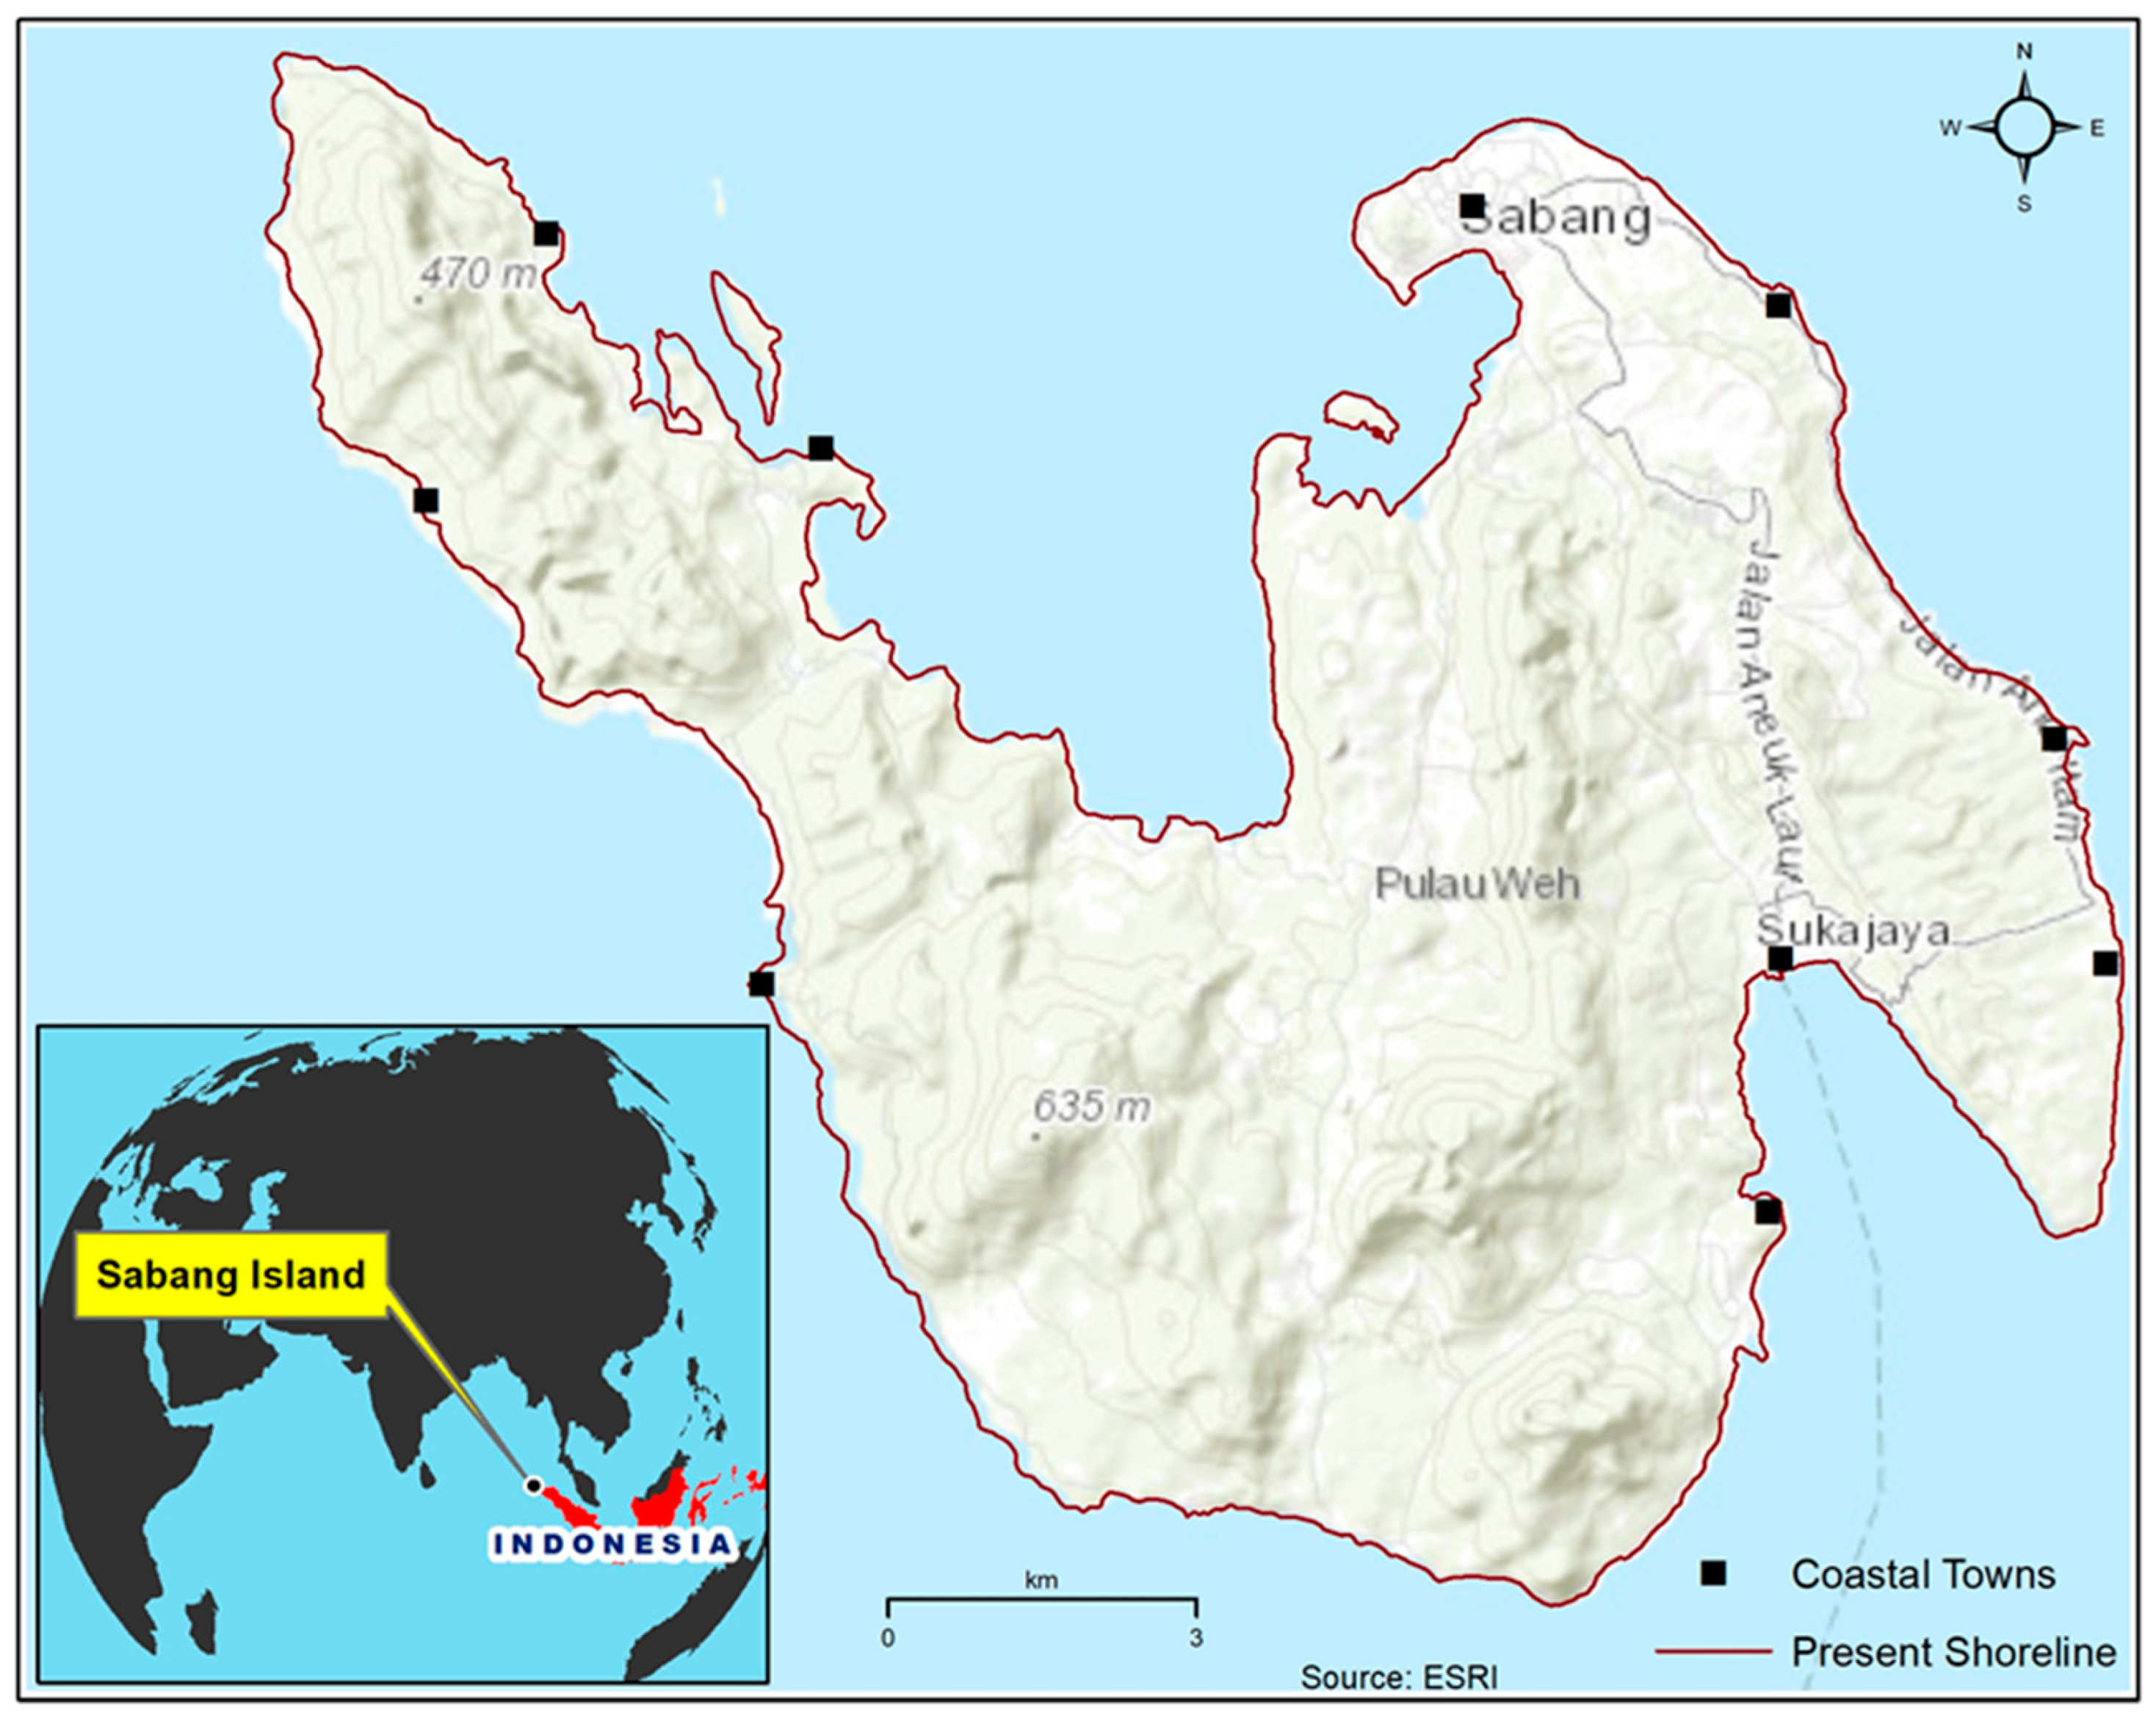
2. Case Study Area: Sabang Island

Sabang Island/Weh Island, one of the Indonesian islands, is situated in the southwestern part of Indonesia. Geographically, the island is located between 5°46′17″ and 5°54′18″ north latitude and 95°12′48″ and 95°22′39″ east longitude, with an areal extent of ~131 sq km and a ~95 km long coastline (Figure 1). Sabang is a cluster of five islands (i.e., Pulau Weh, Rubiah Island, Seulako Island, Pulau Klah, and Pulau Rnondo), of which Pulau Weh (i.e., Weh Island) is the largest island, where Sabang, the largest town, with a population of 33,217 in 2015, is located [32]. The daily solar radiation of Sabang Island is high throughout the year. The long-term data (1981–2020) show that the climate of Sabang Island is an equatorial type with hot and wet weather characteristics throughout the year. The island experiences an average temperature range of around 28 °C, with an annual rainfall of 2000 mm. The island is made mostly of volcanic rock, and the topographic variation ranges from mean sea level (MSL) to 610 m (highest at a fumarolic volcano). Dense forest is the dominant land cover type followed by the built-up and agricultural land use classes [33].

3. Methodology

3.1. Data Sources

The long-term (1981–2020) climatic parameters, including minimum temperature, maximum temperature, rainfall, and relative humidity, were extracted from the National Aeronautics and Space Administration (NASA) POWER Release 8 platform [34]. The parameters were extracted from various satellite and model-based products which are sufficiently accurate to provide reliable climate datasets for Sabang Island, where surface measurements were nonexistent for a long period [35]. All the cloud-free LANDSAT 5 and 8 satellite datasets available (1988–2021) for Sabang Island were used to compute long-term trends in land use/land cover through enhanced vegetation index (EVI) and normalised difference built-up index (NDBI). In addition, MODIS datasets were also used to extract EVI for analysing the trends in vegetation during the last two decades. The data on sea level anomalies of the island coasts were extracted using the satellite altimeter datasets obtained from Jet Propulsion Laboratory MEaSUREs gridded sea surface height anomaly (SSHA) dataset [36] for the period 1993–2019. Further, the ALOS PALSAR digital elevation model (DEM) was acquired from Alaska Satellite Facility (ASF) to construct a model for coastal inundation scenarios. Table 1 describes the data sources, parameters extracted, and time window of the satellite datasets.

3.2. Assessment of Land Use/Land Cover Change

The spatio-temporal assessment of land use/land cover is essential for understanding the interplay between climate and human society. As the case study location is a small island and consists of mainly the forest and built-up land use/land cover classes, we assessed the dynamics of forest and built-up areas through EVI and NDBI, respectively. The indices were calculated from all available cloud-free datasets from LANDSAT 5 (1988–2013), LANDSAT 8 (2014–2021), and MODIS (2000–2021) datasets of the island using Google Earth Engine (GEE). The median index values for the window periods 1988–1992, 1993–1997, 1998–2001, 2004–2009, 2014–2017, and 2018–2021 were extracted and mapped for visualisation.

3.2.1. Enhanced Vegetation Index (EVI)

EVI is primarily used for analysis and quantifying greenness on a relative scale. It is better than normalised difference vegetation index (NDVI) and more sensitive in an area where vegetation is dense [41]. EVI values range between −1 and +1, and, for healthy vegetation, the value varies between 0.2 and 0.8. The EVI can be calculated easily with the help of LANDSAT datasets using the following equation:
E V I = G R r s ( N I R ) R r s ( R e d ) R r s ( N I R ) + ( C 1 × R r s ( R e d ) C 2 × R r s ( b l u e ) + L )
where Rrs(NIR), Rrs(Red), and Rrs(blue) represent the reflectance of NIR, red and blue bands respectively; C1 and C2 are the coefficients used to correct aerosol scattering with the blue band; L is the soil adjustment factor; and G represents the gain factor. In general, C1, C2, and L values are assigned as 6.0, 7.5, and 1, respectively.

3.2.2. Normalised Difference Built-Up Index (NDBI)

The NDBI is used to discriminate between built-up areas and other land use classes [42]. As built-up areas have higher reflectance in the shortwave-infrared (SWIR) region than the near-infrared (NIR) region, the NDBI can be computed by using the following equation [43]:
N D B I = R r s ( S W I R ) R r s ( N I R ) R r s ( S W I R ) + R r s ( N I T R )
NDBI values vary from −1 to +1, where the positive indicates a built-up region.

3.3. Trend Analysis

Some non-parametric methods, such as Sen’s slope estimator and Mann-Kendall test, were used in the study to test the statistical significance of trends in climate, land use, and sea level variables. The MAKESENS template (https://en.ilmatieteenlaitos.fi/makesens (accessed on 10 May 2022)) was used to identify the trend Z score and true slope values (annual changes) in time series data. The Mann-Kendall test and Sen’s slope estimations were performed using the monthly and annual average datasets.

3.3.1. Mann-Kendall Test

The non-parametric Mann-Kendall test is widely used to detect the significant, monotonic trend pattern (i.e., upward and downward) in atmospheric and hydrological variables [44]. The main advantage of the method is that trends are not affected by minimum missing data and outliers. The Mann-Kendall test for time series x1, … xn can be calculated using:
S = i = 1 n 1 j = i + 1 n s i g n ( x j x i )
s i g n ( x j x i ) = { + 1 , i f ( x j x i ) > 0 0 , i f ( x j x i ) = 0 1 , i f ( x j x i ) < 0
where n represents the number of samples, x is the value of i = 1, 2, …, n – 1, and j = i + 1. If S > 0, then the later observations in the time series tend to be larger than those that appeared earlier in the time series, while the reverse is true if S < 0. When the mean value of S is 0, then the variance of S is calculated by the following equation:
var = 1 18 [ n ( n 1 ) ( 2 n + 5 ) t f t ( f t 1 ) ( 2 f t + 5 ) ]
The value of t varies according to the rank, and ft represents the frequency of rank t. Then, statistical Z values are computed as follows:
Z = { ( S 1 ) / var ( S ) ,                 i f   S > 0                                       0 ,                 i f   S = 0 ( S + 1 ) / var ( S ) ,                 i f   S < 0
where the values of Z represent the presence of a significant trend. If the Z value is greater than 0, there is an increasing trend and vice versa. If Z > /2 (α is a significant level), the trend is significant. The standard normal distribution of α (e.g., 0.001, 0.01, 0.05, and 0.1) is used to find the /2 value.

3.3.2. Sen’s Slope Estimator

Sen’s slope is a simple non-parametric method for estimating the magnitude of time series data [45].
Q i = x j x k j k ,           W h e r e   j > k
Sen’s estimator of the slope is the median of the N values of Qi, and it is ranked from smallest to largest. Then the Sen’s slope confidence intervals (upper and lower) are computed as follows:
N = C ( n , 2 )                                           k = s e · Z c r i t l o w e r = x ( N k ) / 2                             u p p e r = x ( N + k ) / 2 + 1
where N is the total number of pairs of time series elements of xi and xj, and se represents the standard error for the Mann-Kendall test.

3.4. Modelling of Coastal Inundation

In this study, we considered how future projected sea level rise and the resulting coastal inundation may affect Sabang Island. We used the present mean high tide level as a reference coastline to model the probable extent of coastal inundation due to extreme storm surge events and future sea levels. The study considered a first-order approximation of the inundated coastline due to sea level rise with the help of a radiometrically terrain-corrected (RTC), high-resolution ALOS PALSAR digital elevation model (DEM) dataset. The model showed coastal inundation as a function of present-day topographic and bathymetric data, with a uniformly increased water level rise added to the present-day mean high water tide line. We used satellite altimeter data to understand the sea level rise. Sen’s slope estimator of long-term sea level anomalies showed that the sea level of the island is rising at a rate of 6.6 mm per year. The IPCC reports indicate that the global mean sea level will rise 0.61–1.10 m by 2100 [46]. By considering the local trends and global projections, we applied water level rise/flooding command in Global Mapper software to simulate the scenarios of a 0.5 m (2050) and 1 m (2100) rise from the present sea level/coastline. In addition, 2, 5, and 10 m increases in water level over the mean high water tide line were also attempted to see where the water would reach maximum levels during extreme storm surge events [47]. All the modelled inundation results were delineated and used for further analysis and visualisation.

3.5. Vulnerability of Built-Up Areas

Low-lying and near-shore coastal settlements are always at high risk of various coastal hazards [48]. The risk of coastal inundation can be indirectly estimated with the help of assessing the extent of built-up areas [49]. Built-up areas can be used to understand the exposure of populations to sea level rise and associated coastal inundations. They can also be used to estimate economic losses to coastal hazards. In this study, the median NDBI layers of 2018–2021 were used to prepare the built-up layer of Sabang Island. With the help of GIS, the built-up layer was intersected with all predicted coastal inundation layers to estimate the maximum damage exposure [50]. By overlaying the modelled coastal inundation layers on a built-up layer, we mapped the vulnerable areas to coastal inundation. Although the actual risk of each inundation scenario is dependent on many factors, this assessment provided a relative assessment of the maximum potential damage exposure of human habitations to sea level rise.

4. Results

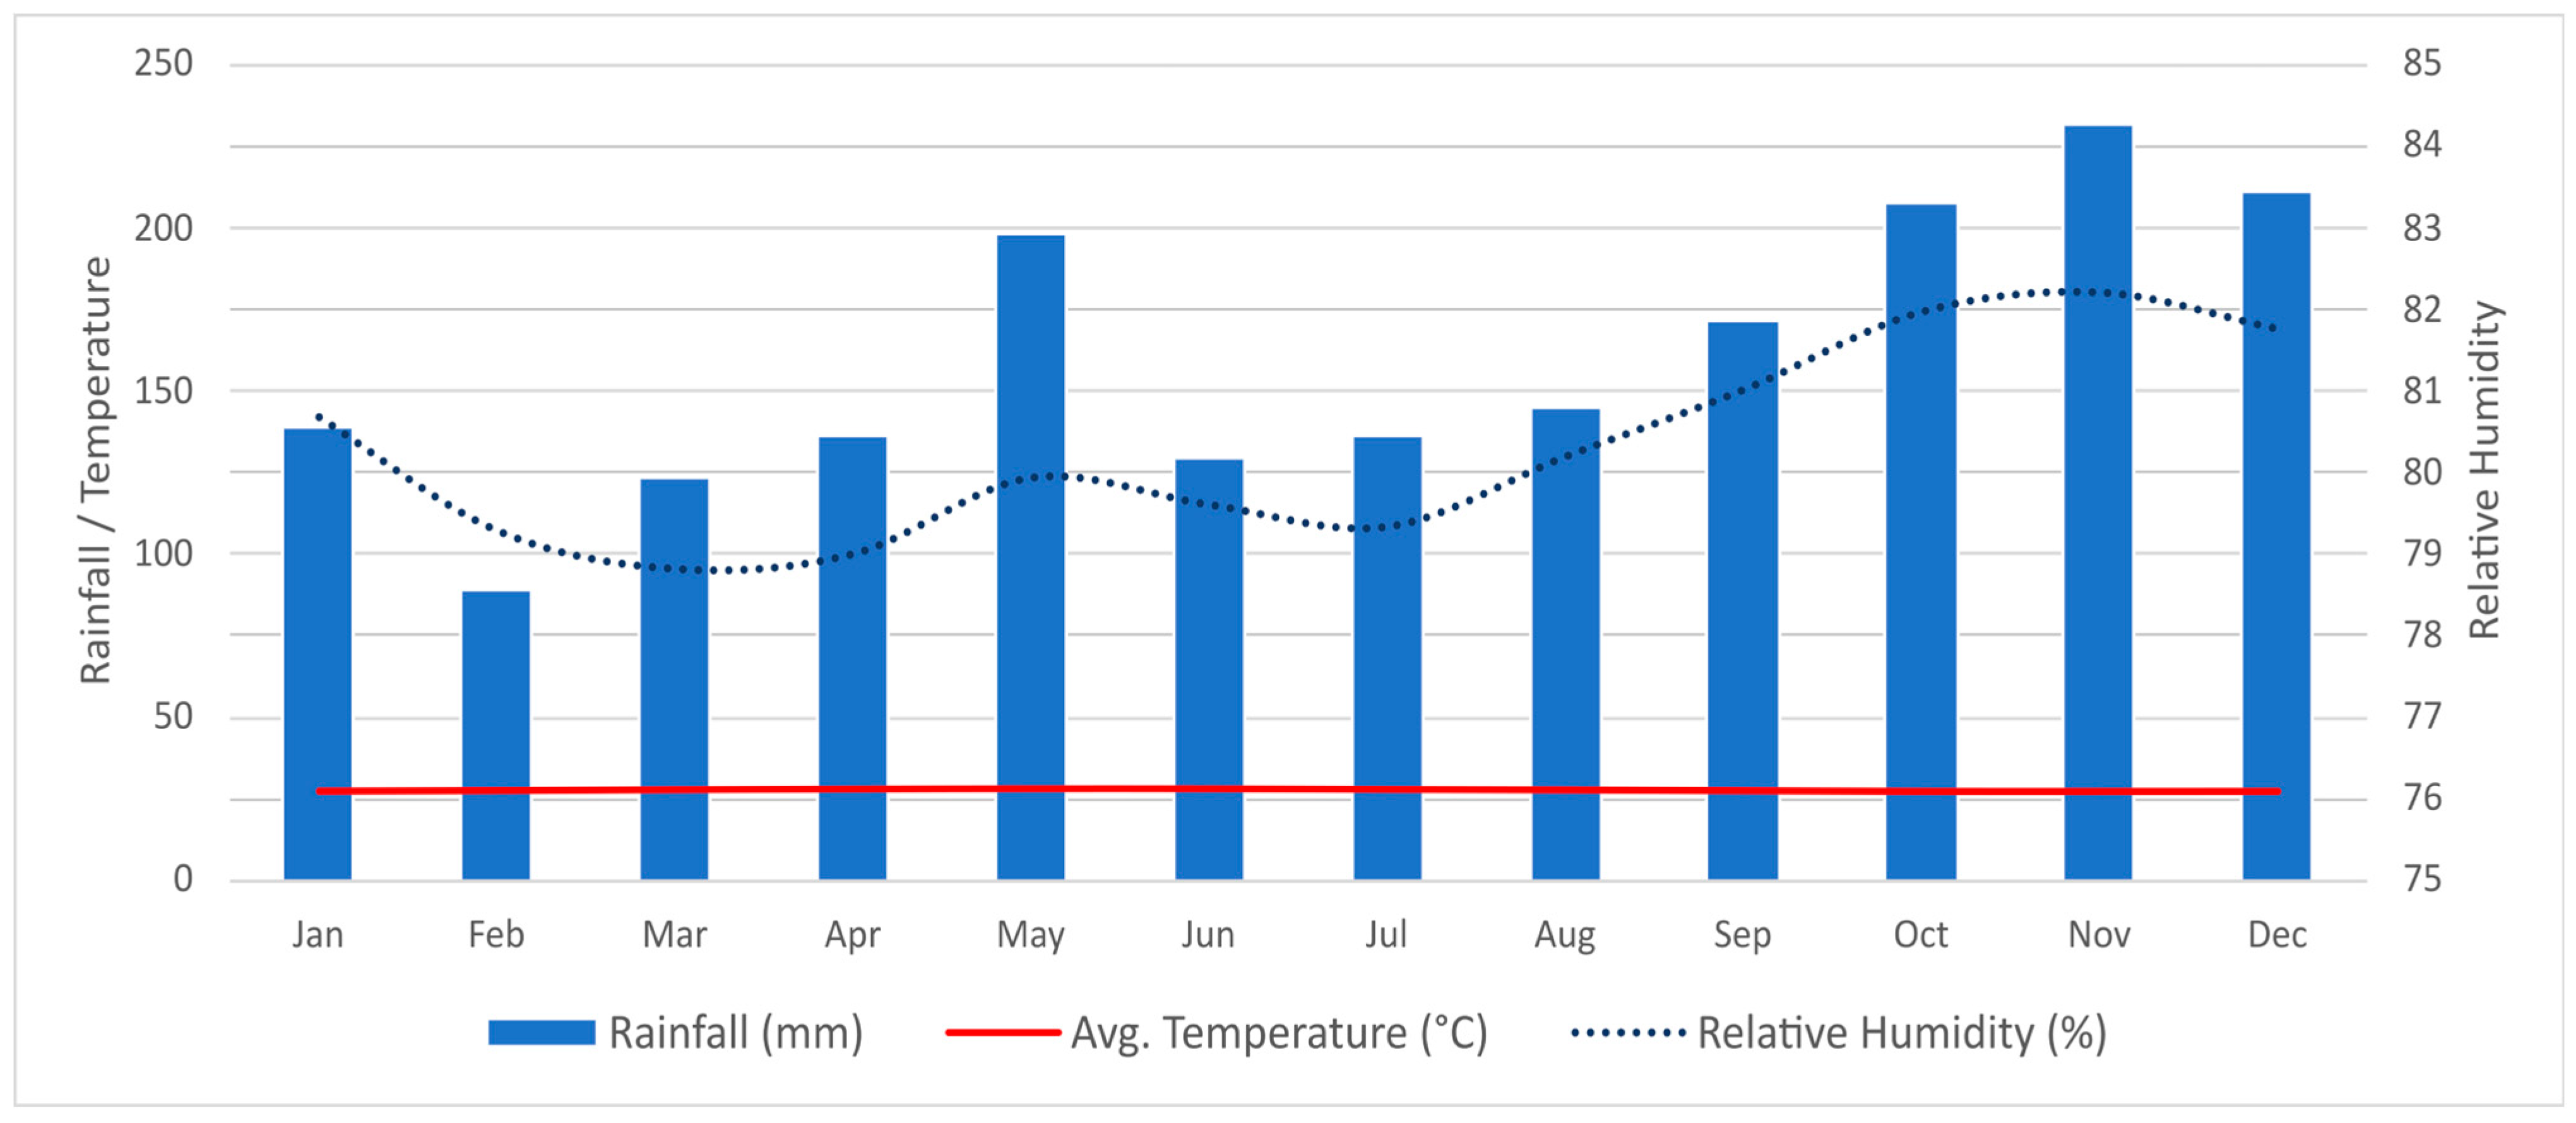
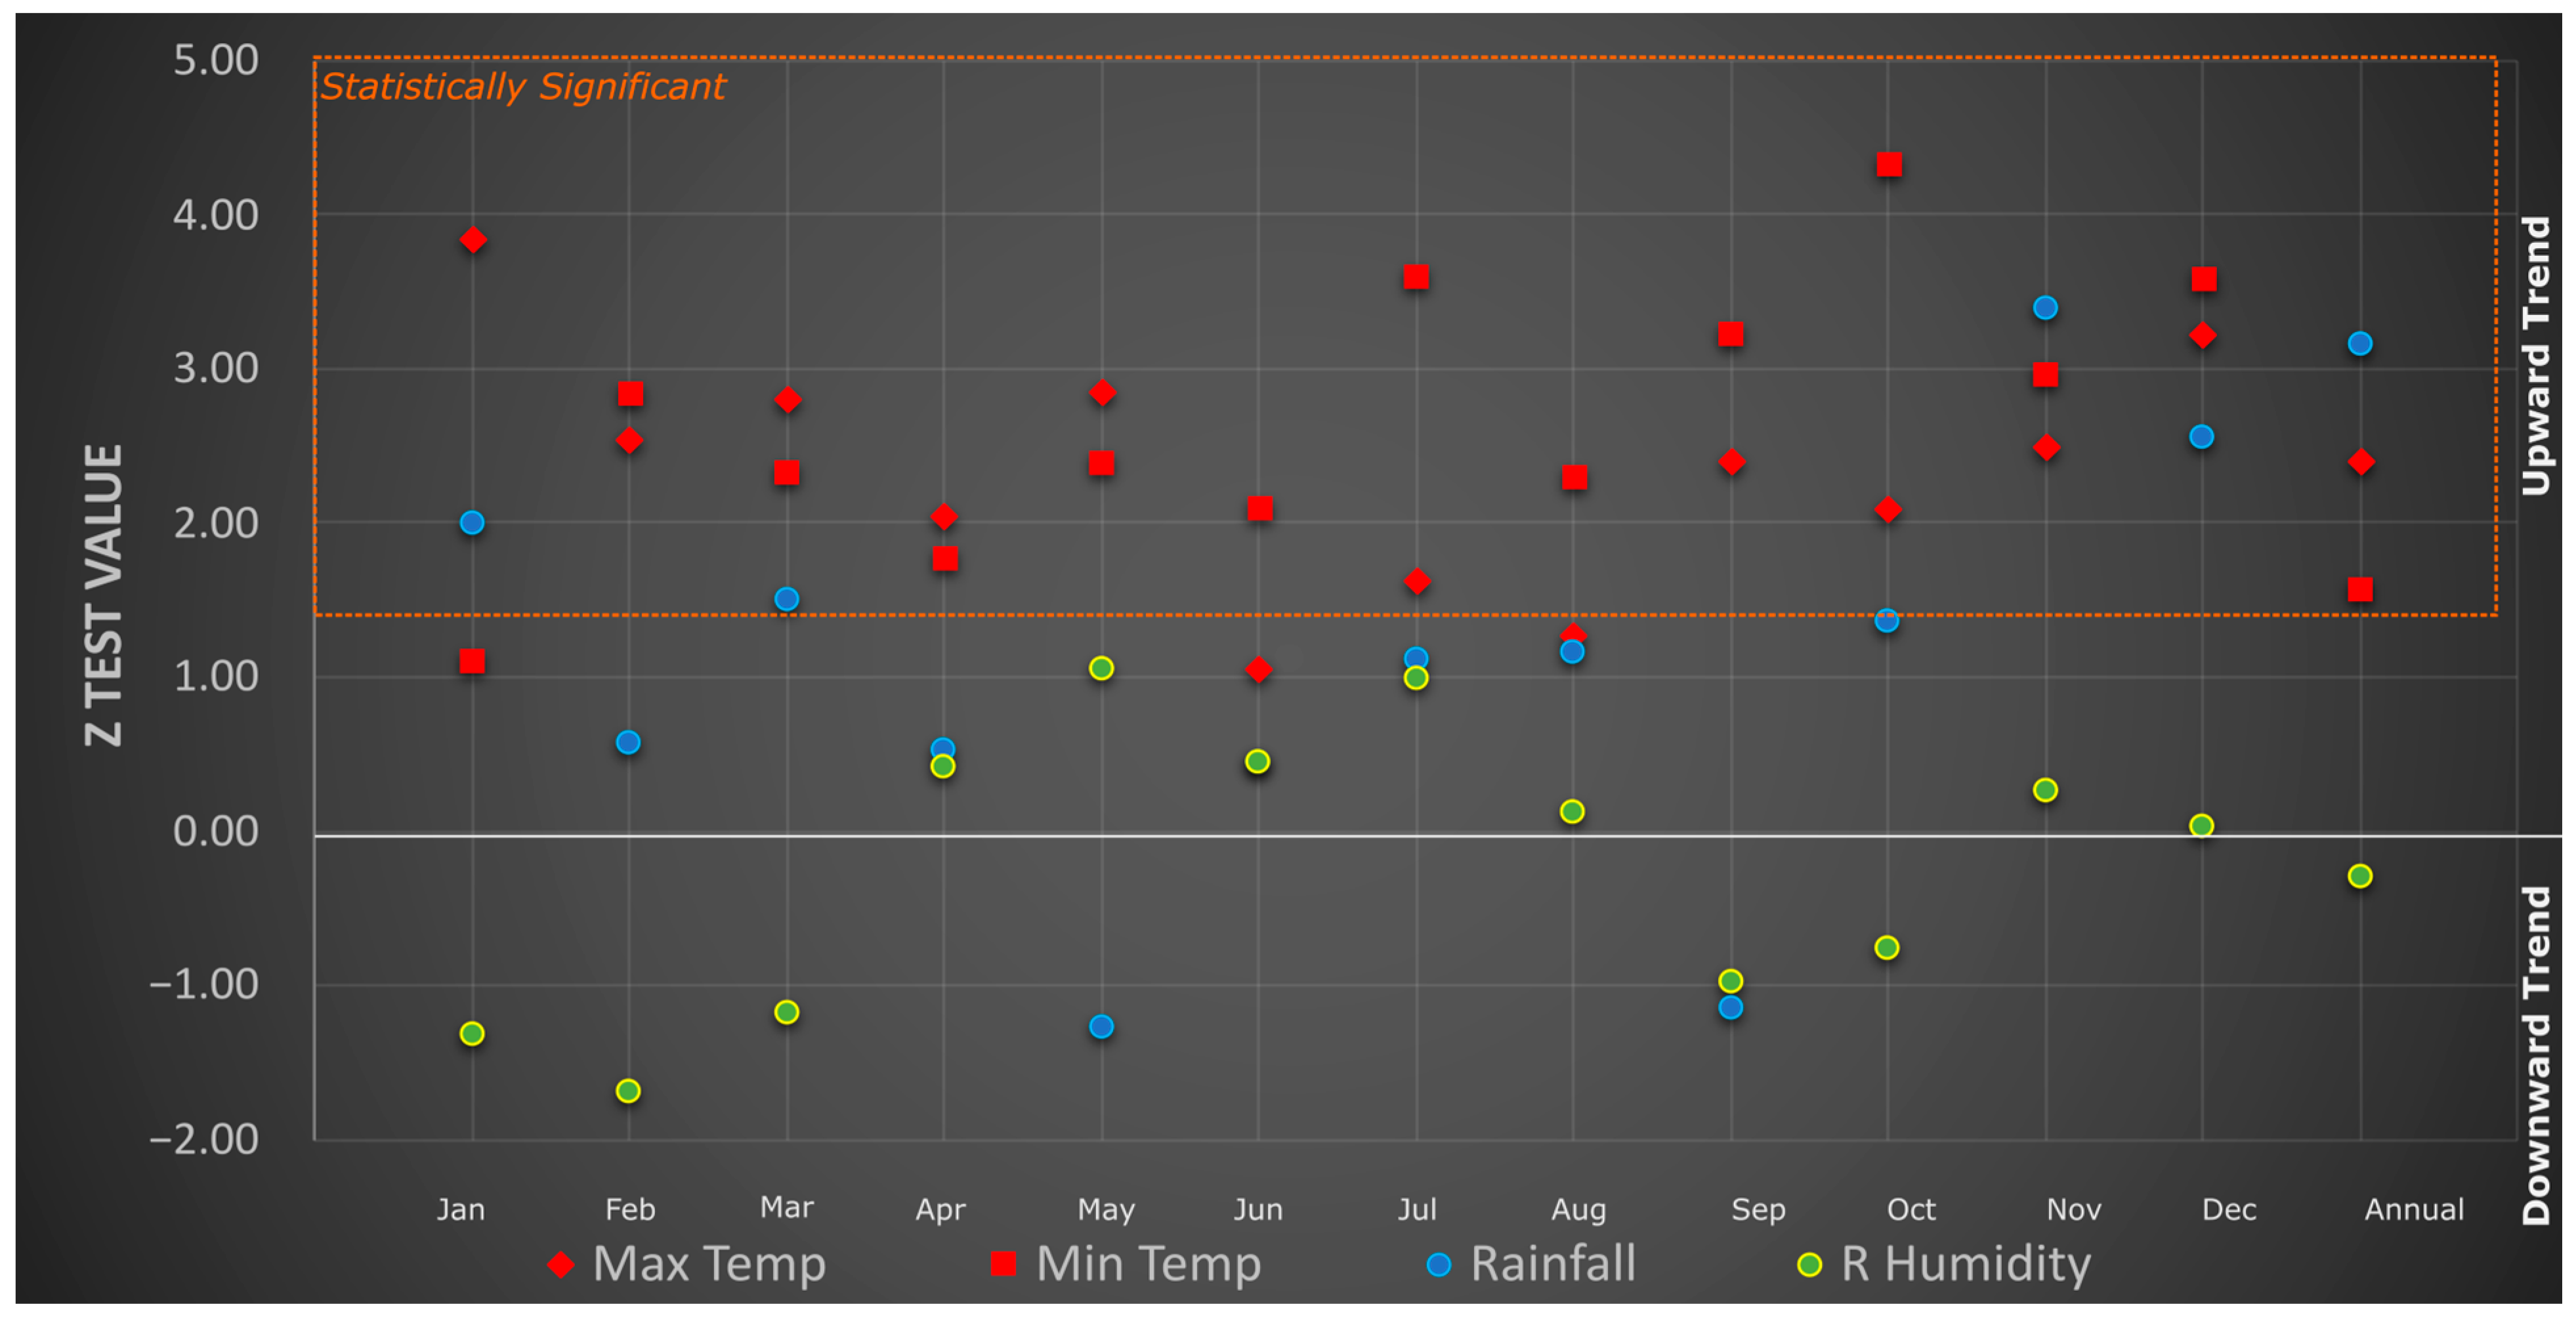
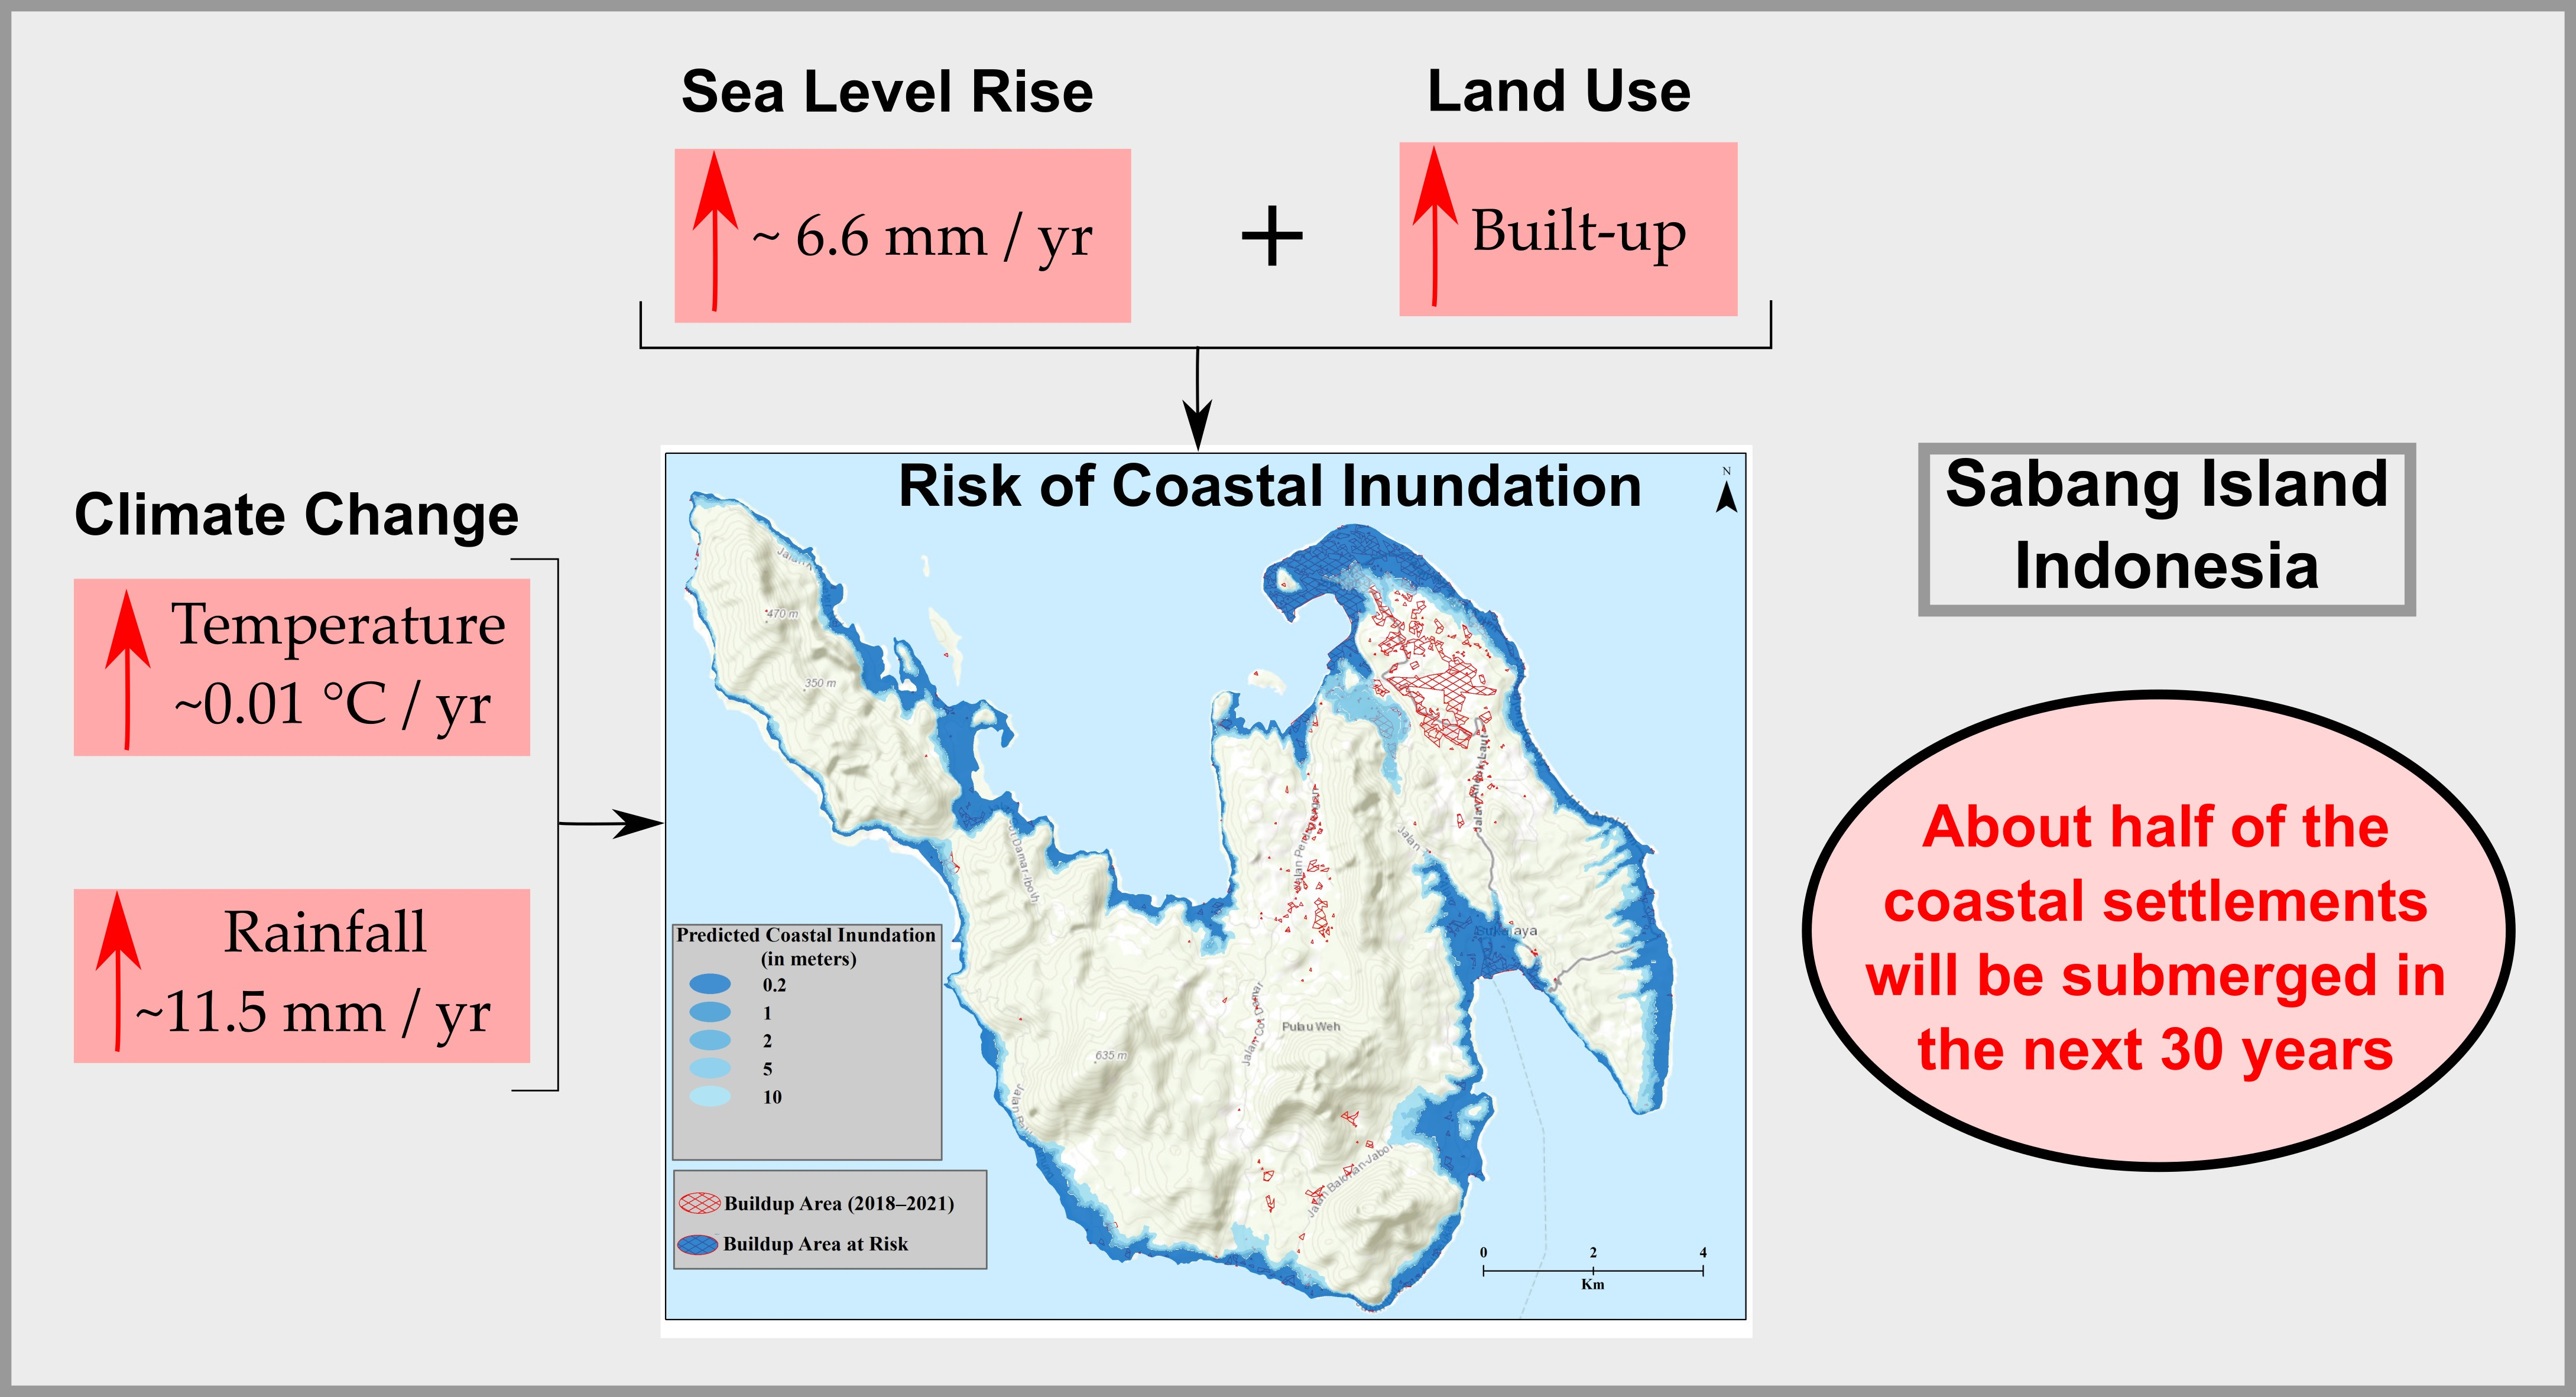
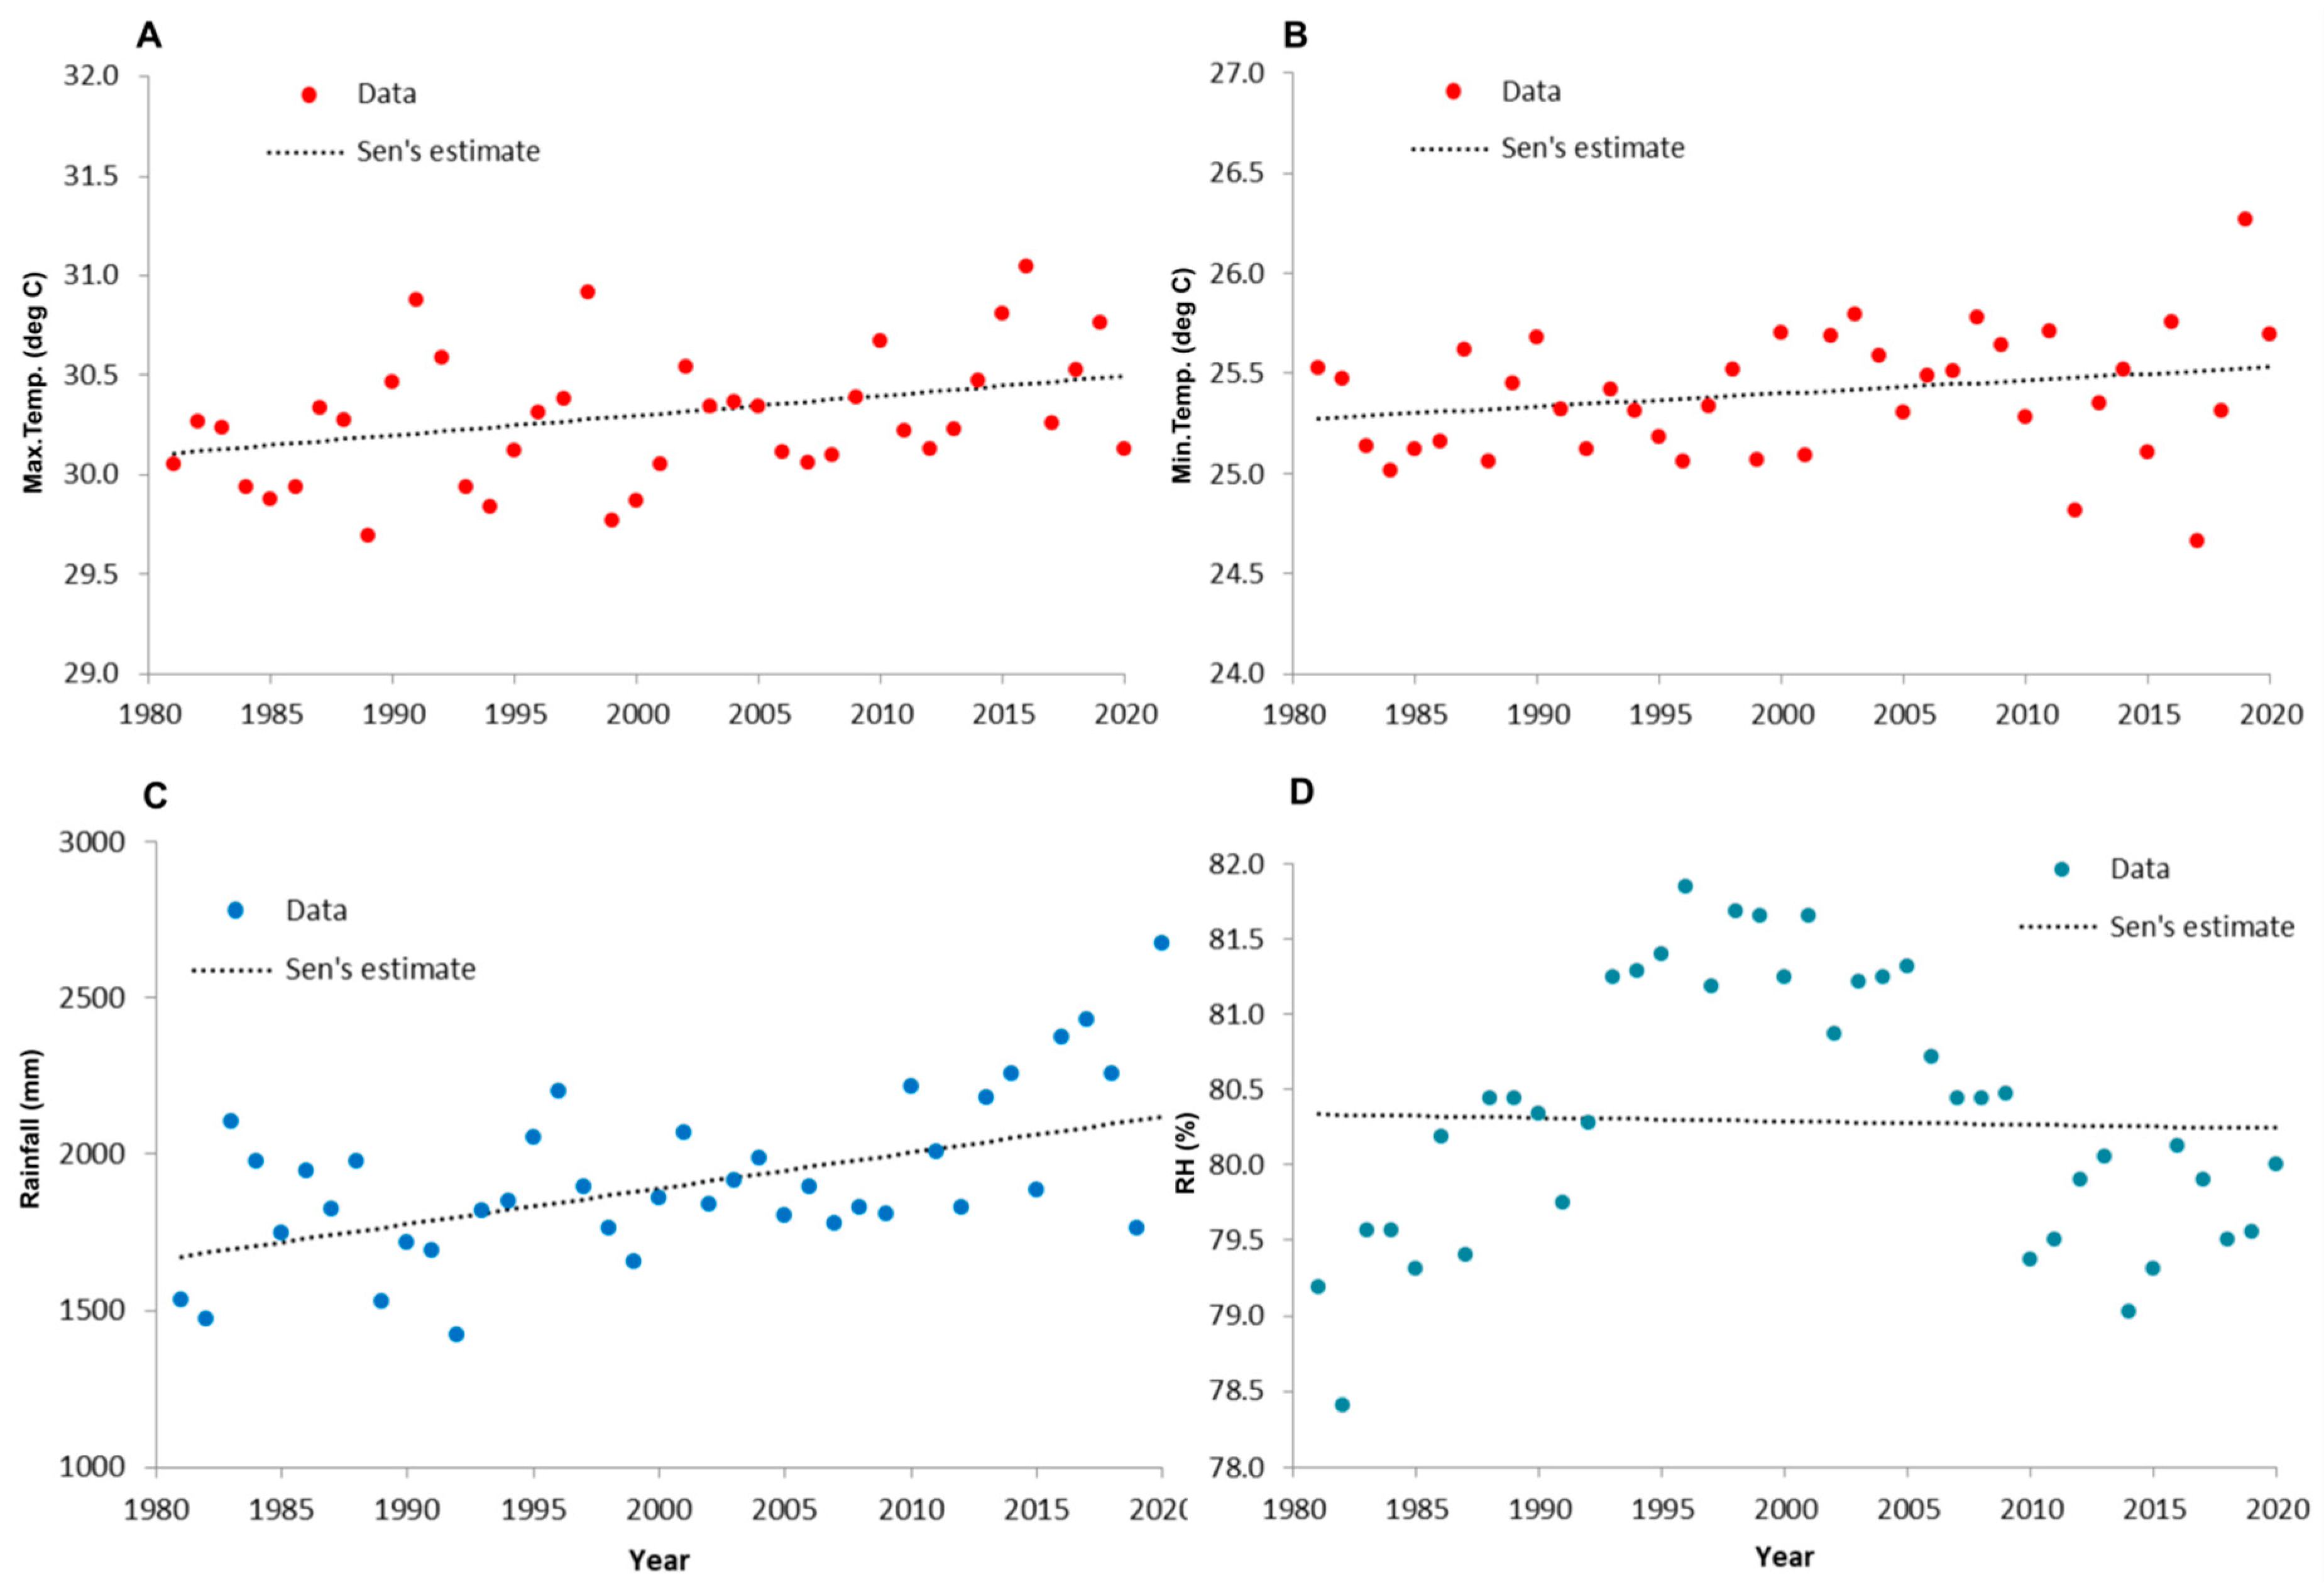
4.1. Climate Change in Sabang Island
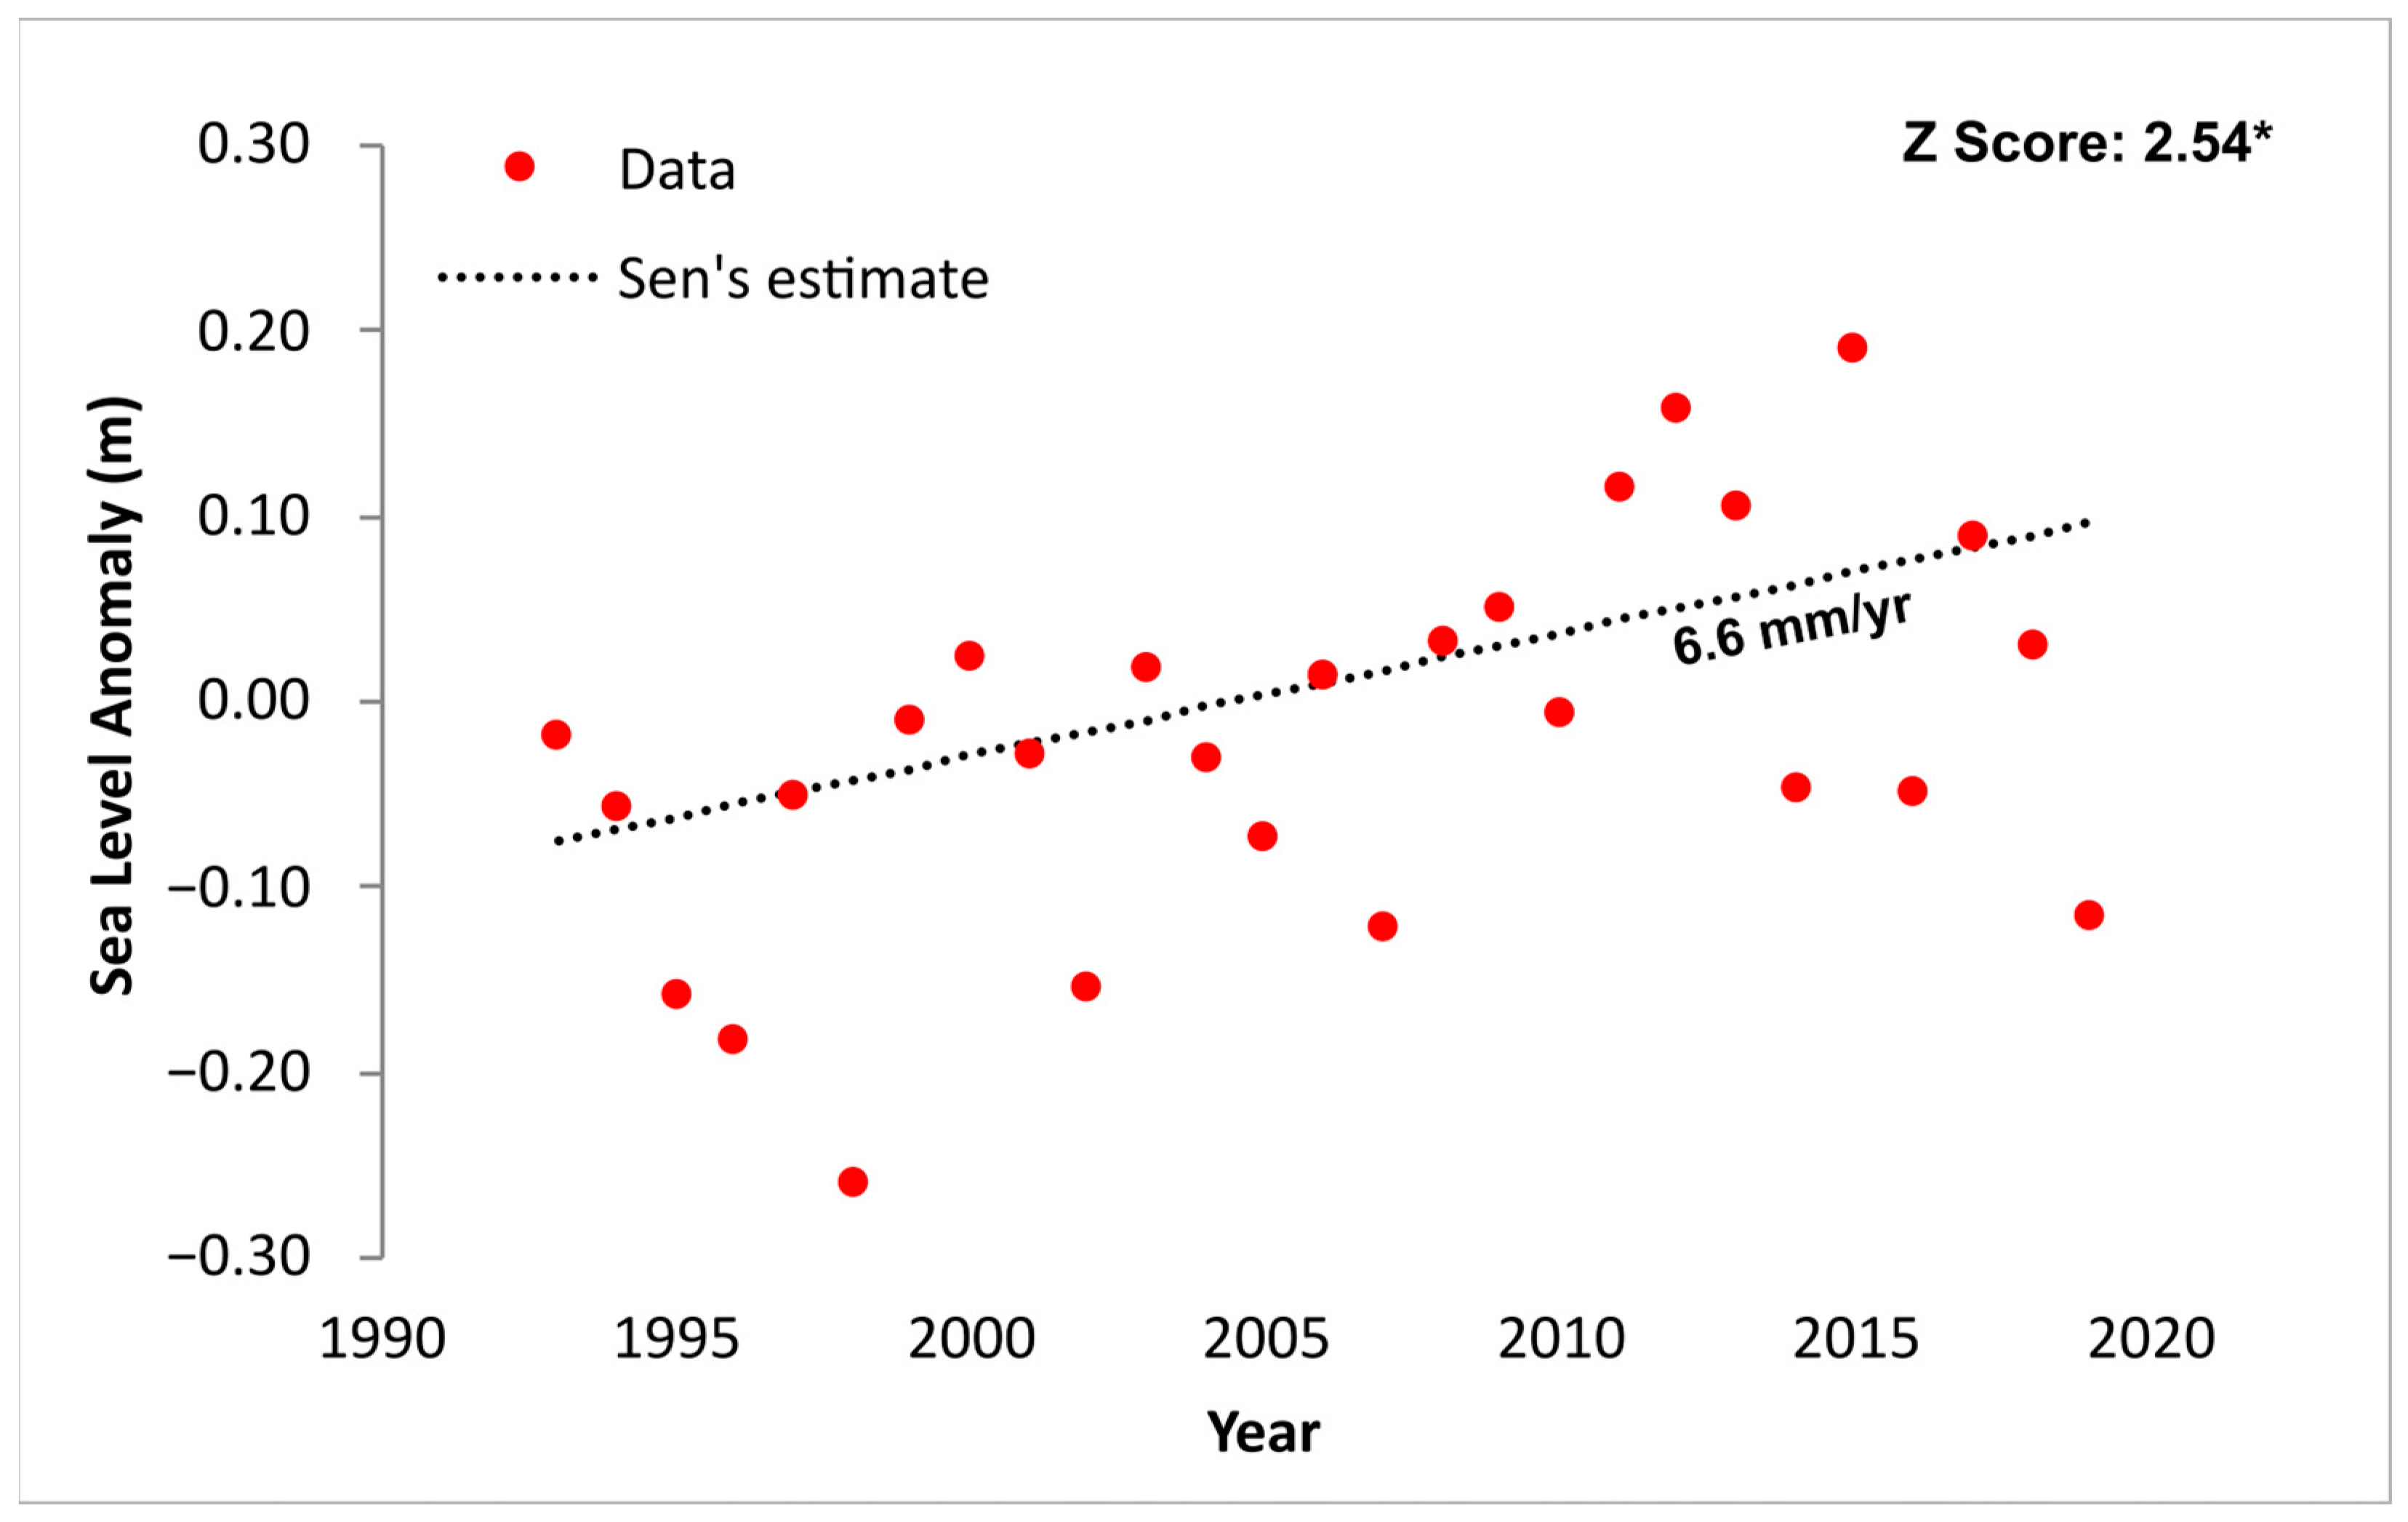
The long-term data (1981–2020) show that the average annual temperature of the case study island is 28 °C with a diurnal variation of 25–31 °C. The relative humidity is about 80%, and it is comparatively high September–December. The annual average rainfall of the island is about 2000 mm, and it is well distributed throughout the year. Except for February, all the months contribute more than 100 mm of rainfall, and the contribution is at its maximum in May and October–December (Figure 2).
The Mann-Kendall trend analysis and Sen’s slope estimate for the long-term climatic data show that the temperature of the island has a strong upward trend with a level of significance α = 0.01. The mean maximum temperature of all the months is increasing, and the annual rate of increase is 0.01 °C per year (Figure 3A). The rate of increase of the maximum temperature is much more pronounced in January (0.02 °C), with a high level of significance (α = 0.001). The minimum temperature also has an increasing trend (Figure 3B), especially in the wetter part of the year (June–December). The Mann-Kendall tests indicate that the variables of mean maximum and minimum temperatures have a positive Z score throughout all the months, with a strong statistical significance (Figure 4).
The rainfall trends in Sabang Island are cyclic but with an upward trend (Figure 3C). Sen’s slope estimate shows that rainfall on the island is increasing at a rate of 11.5 mm per year with a statistically significant level (α = 0.01) of Z score (3.16). The month-wise plotting of Z score analysis showed that the rainfall pattern follows a significant upward trend during the comparatively wet months i.e., November–December (Figure 4). This season also has a statistically significant upward trend in minimum and maximum temperature, and increasing trends of air temperature lead to more convection and rainfall during this season.
The relative humidity of the island has a slightly decreasing trend but no statistical significance. The level of decrease in relative humidity is high during February, with a statistical level of significance (α = 0.1). The decreasing trend of relative humidity is associated with air temperature, i.e., both minimum and maximum temperatures have an upward trend (Figure 4).

4.2. Sea Level Rise

The sea level changes of the island coasts were studied indirectly using the satellite altimeter datasets. The averaged sea surface height anomaly data of January over the last three decades (Figure 5) show that the sea level is increasing at a rate of 6.6 mm/year with a statistical level of significance (α = 0.05). The data show that the higher positive anomalies are significant, especially in the last decade, and such a steep rise in sea level will result in more coastal inundation.

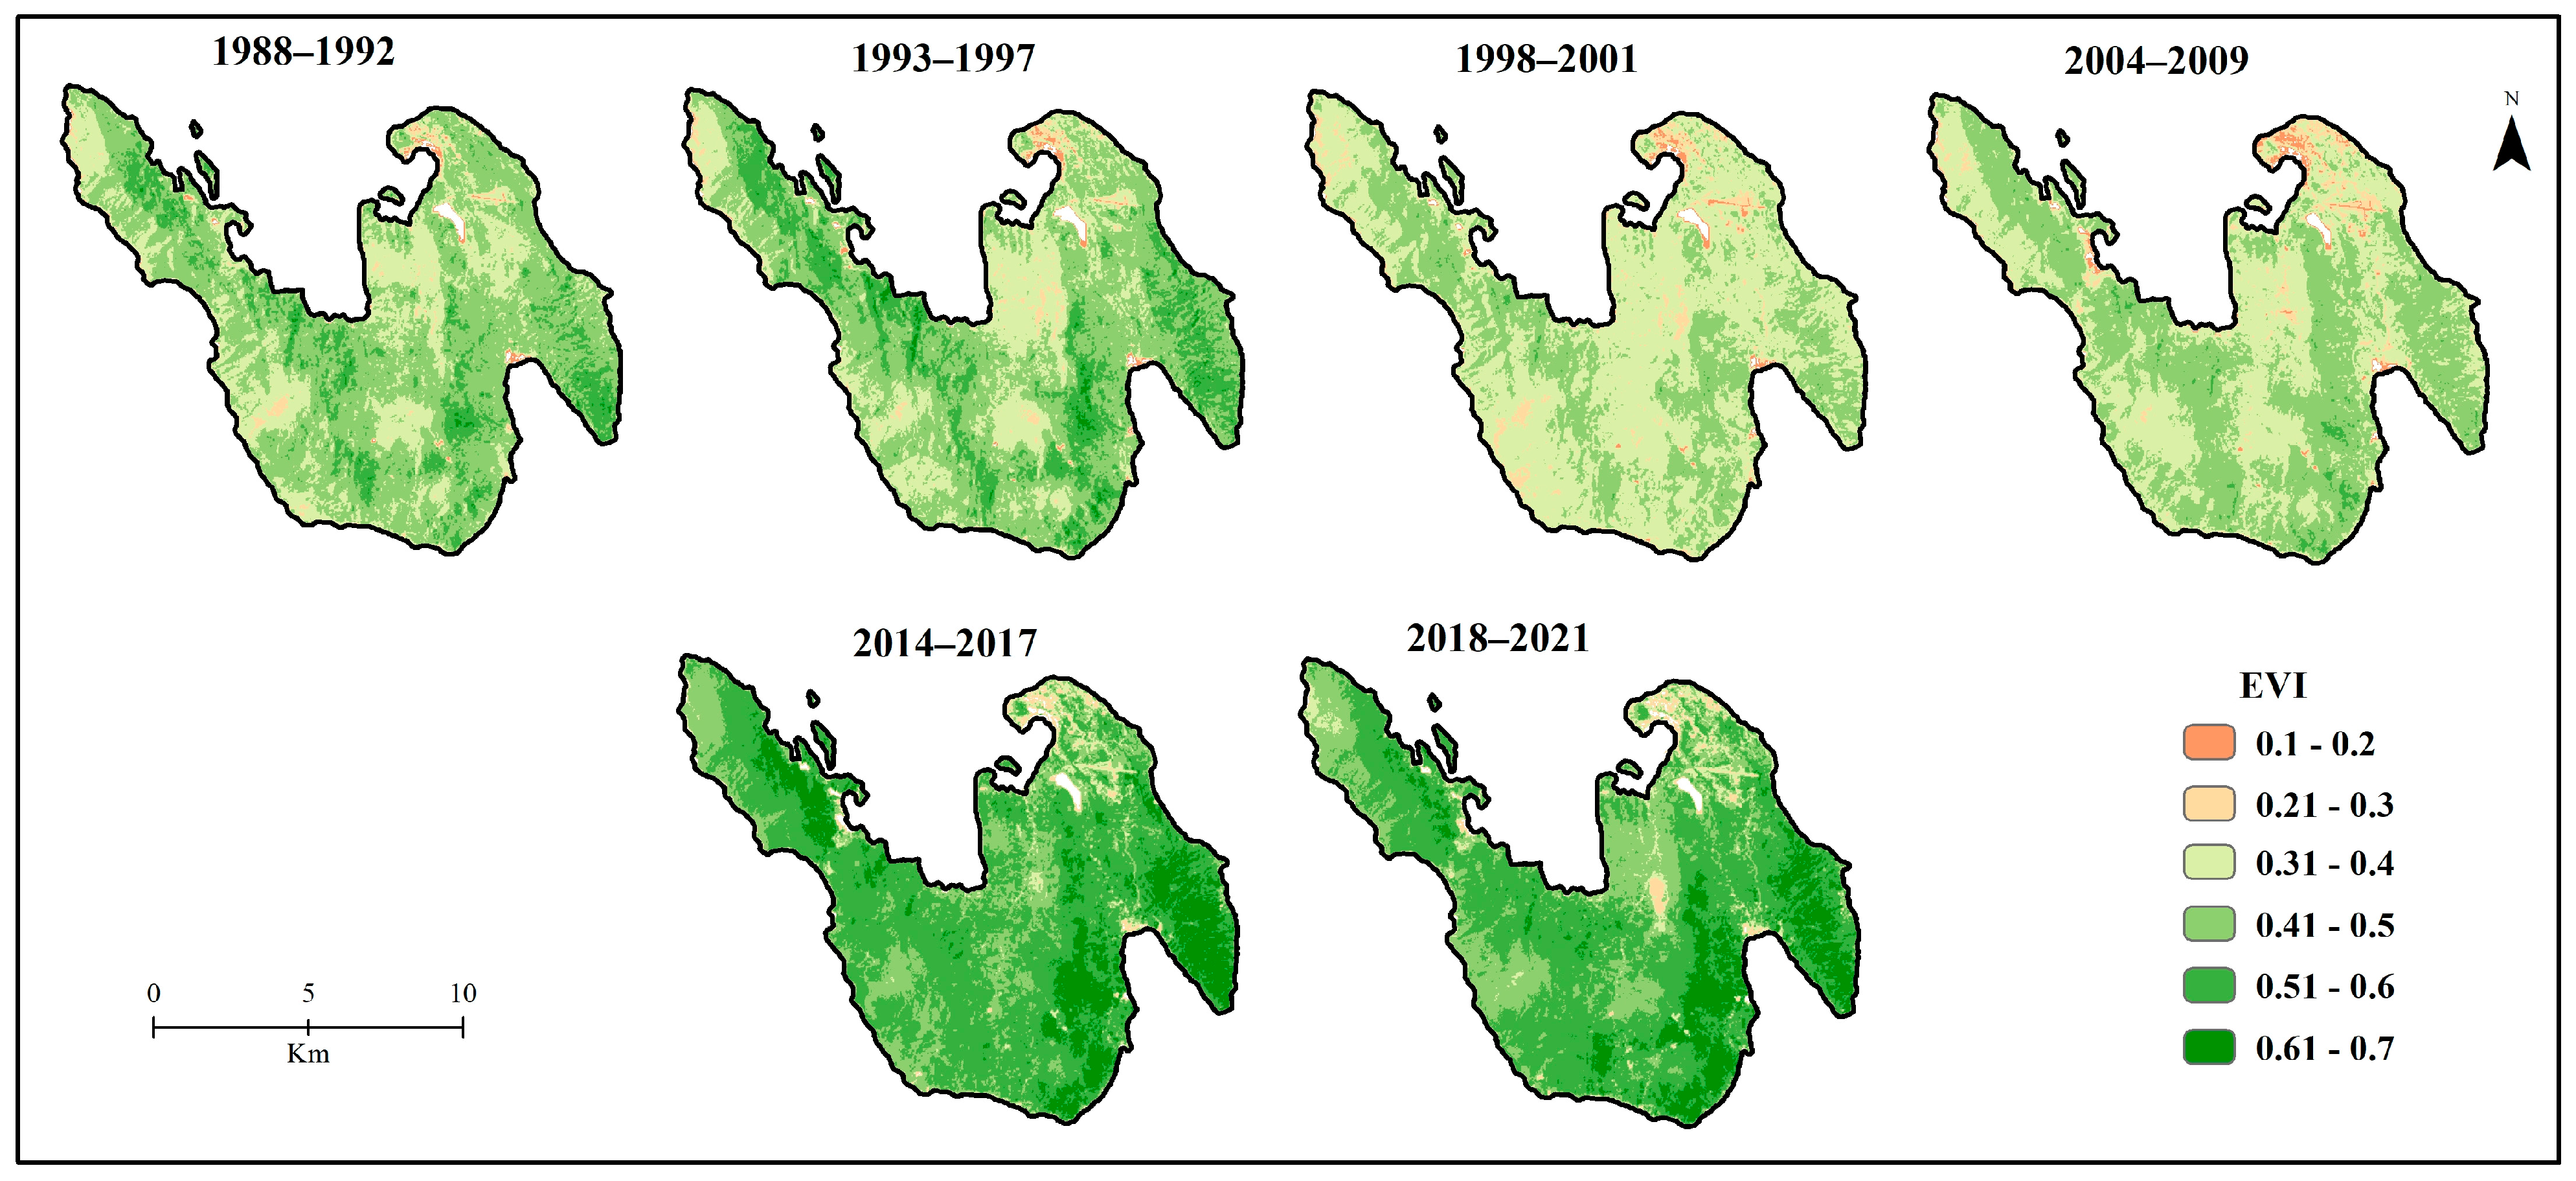
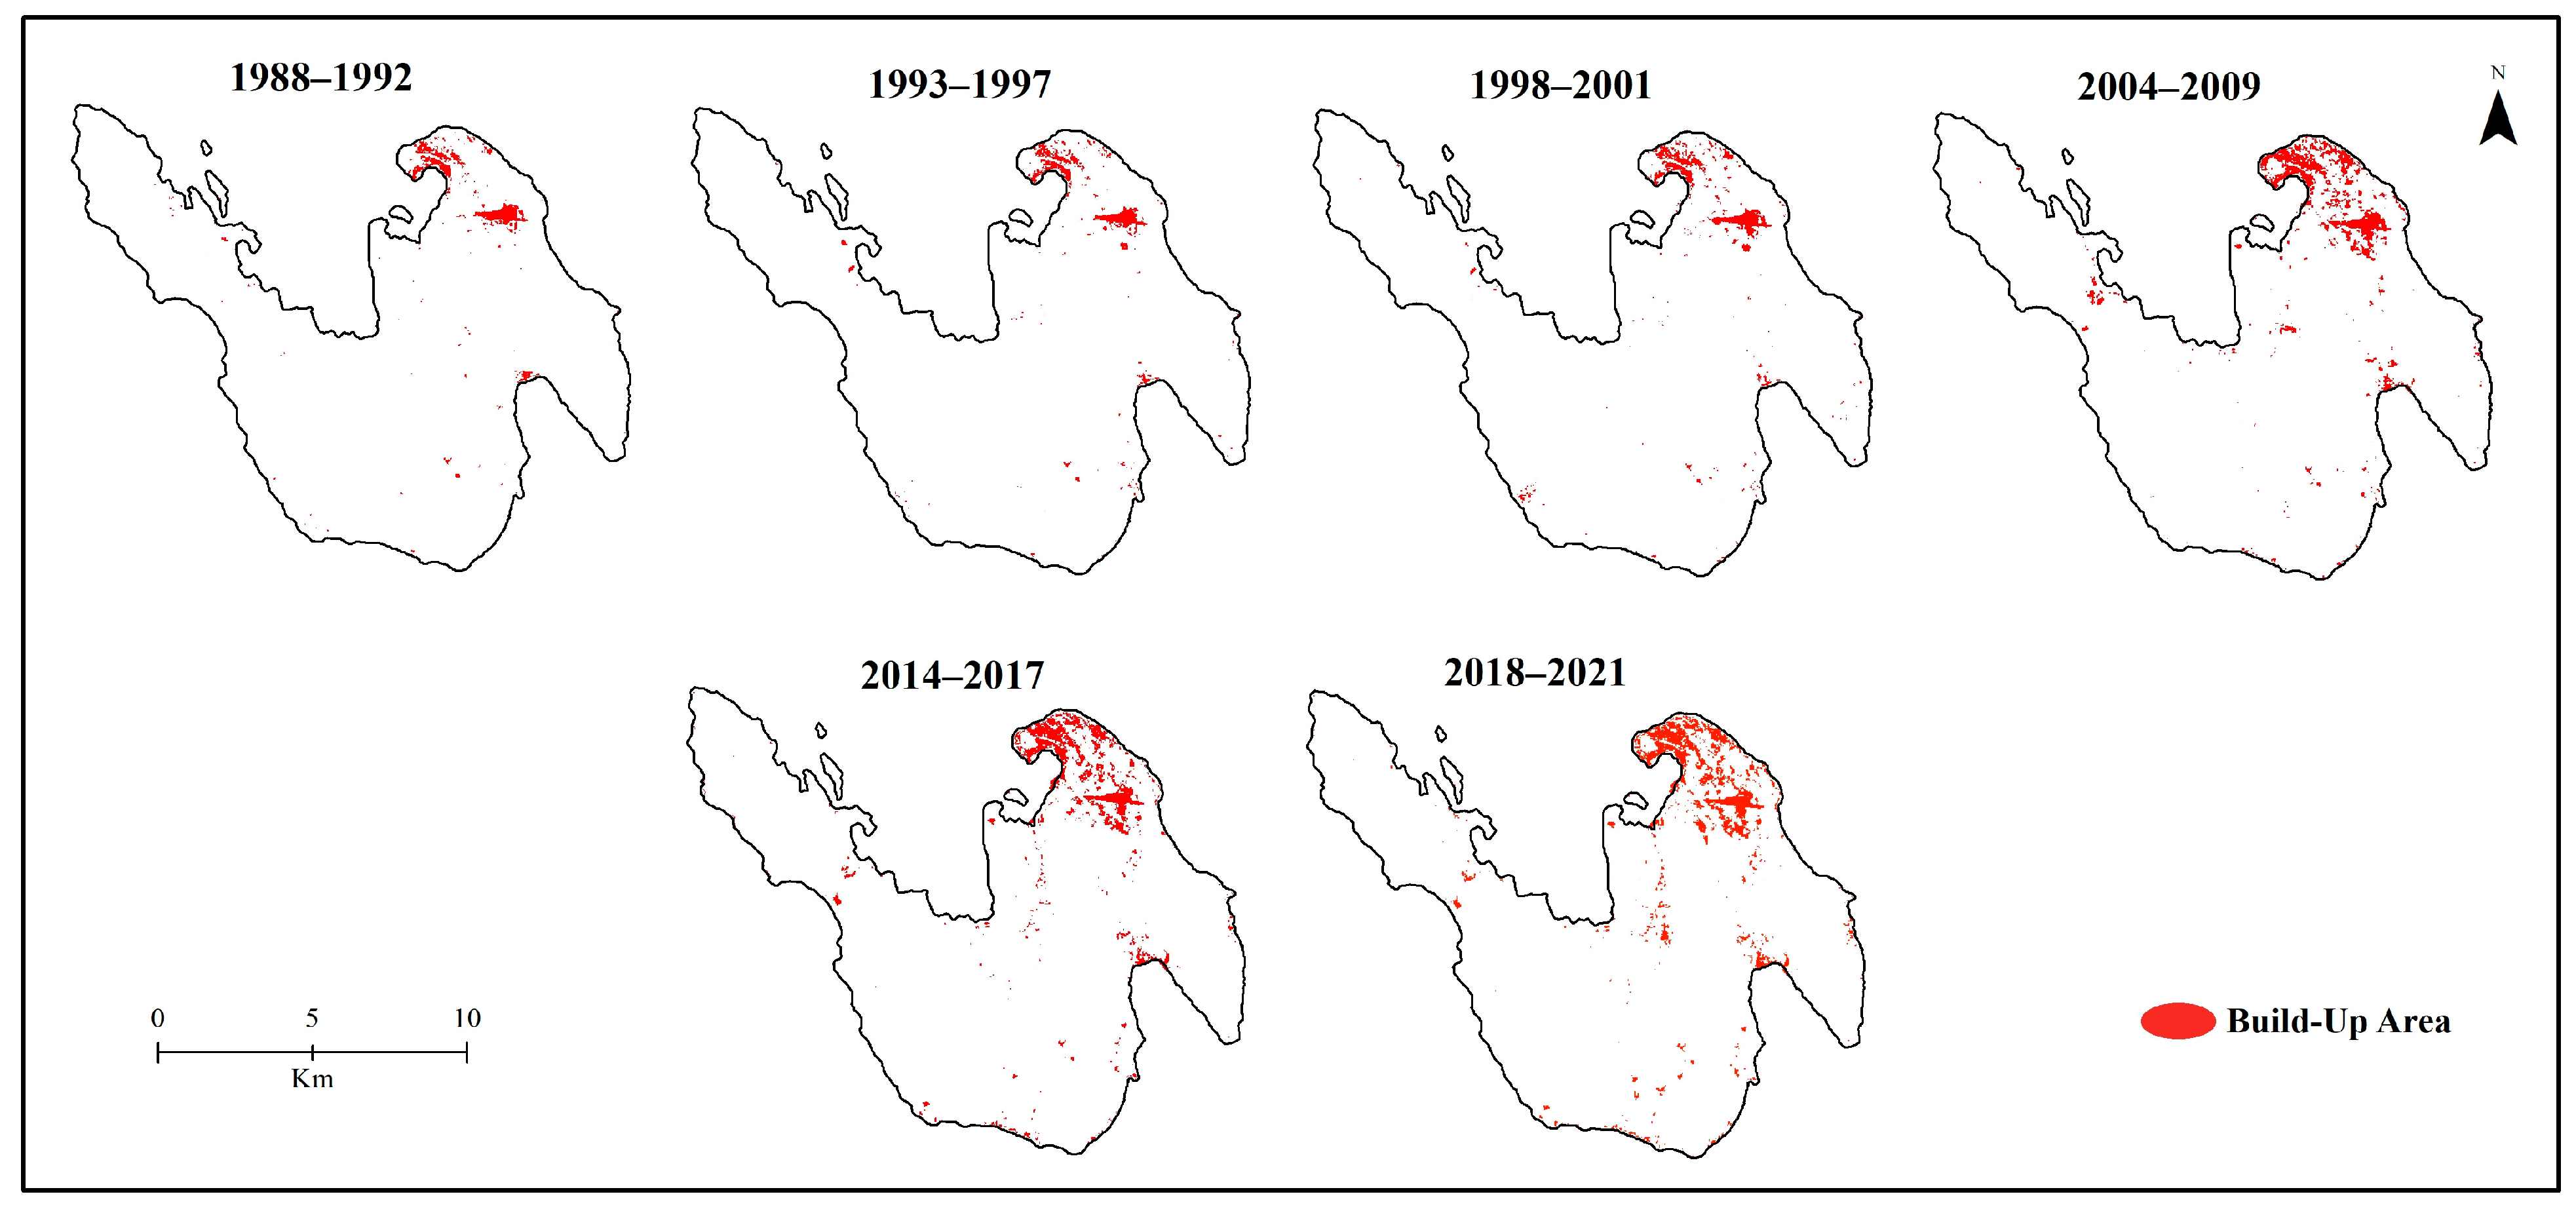
4.3. Changes in Land Use/Land Cover

The case study island is dominantly covered by dense forest and built-up land use/land cover classes. The spatio-temporal changes in these dominant classes were studied based on EVI and NDBI indices using LANDSAT datasets (Figure 6 and Figure 7). The results show that dense forest cover follows the pattern of rainfall trends, and has increased in the last decade. The areal extent of dense forest cover based on median EVI data in 1988–1992 was about 92 sq km, and it increased to 115 sq km as per the recent median EVI data (2018–2021). The other dominant land use category, that of built-up land use, gradually increased from 1.6 sq km in 1988 to 5.4 sq km in 2021, with an approximately one-fold increase in built-up cover for every decade (Table 2).

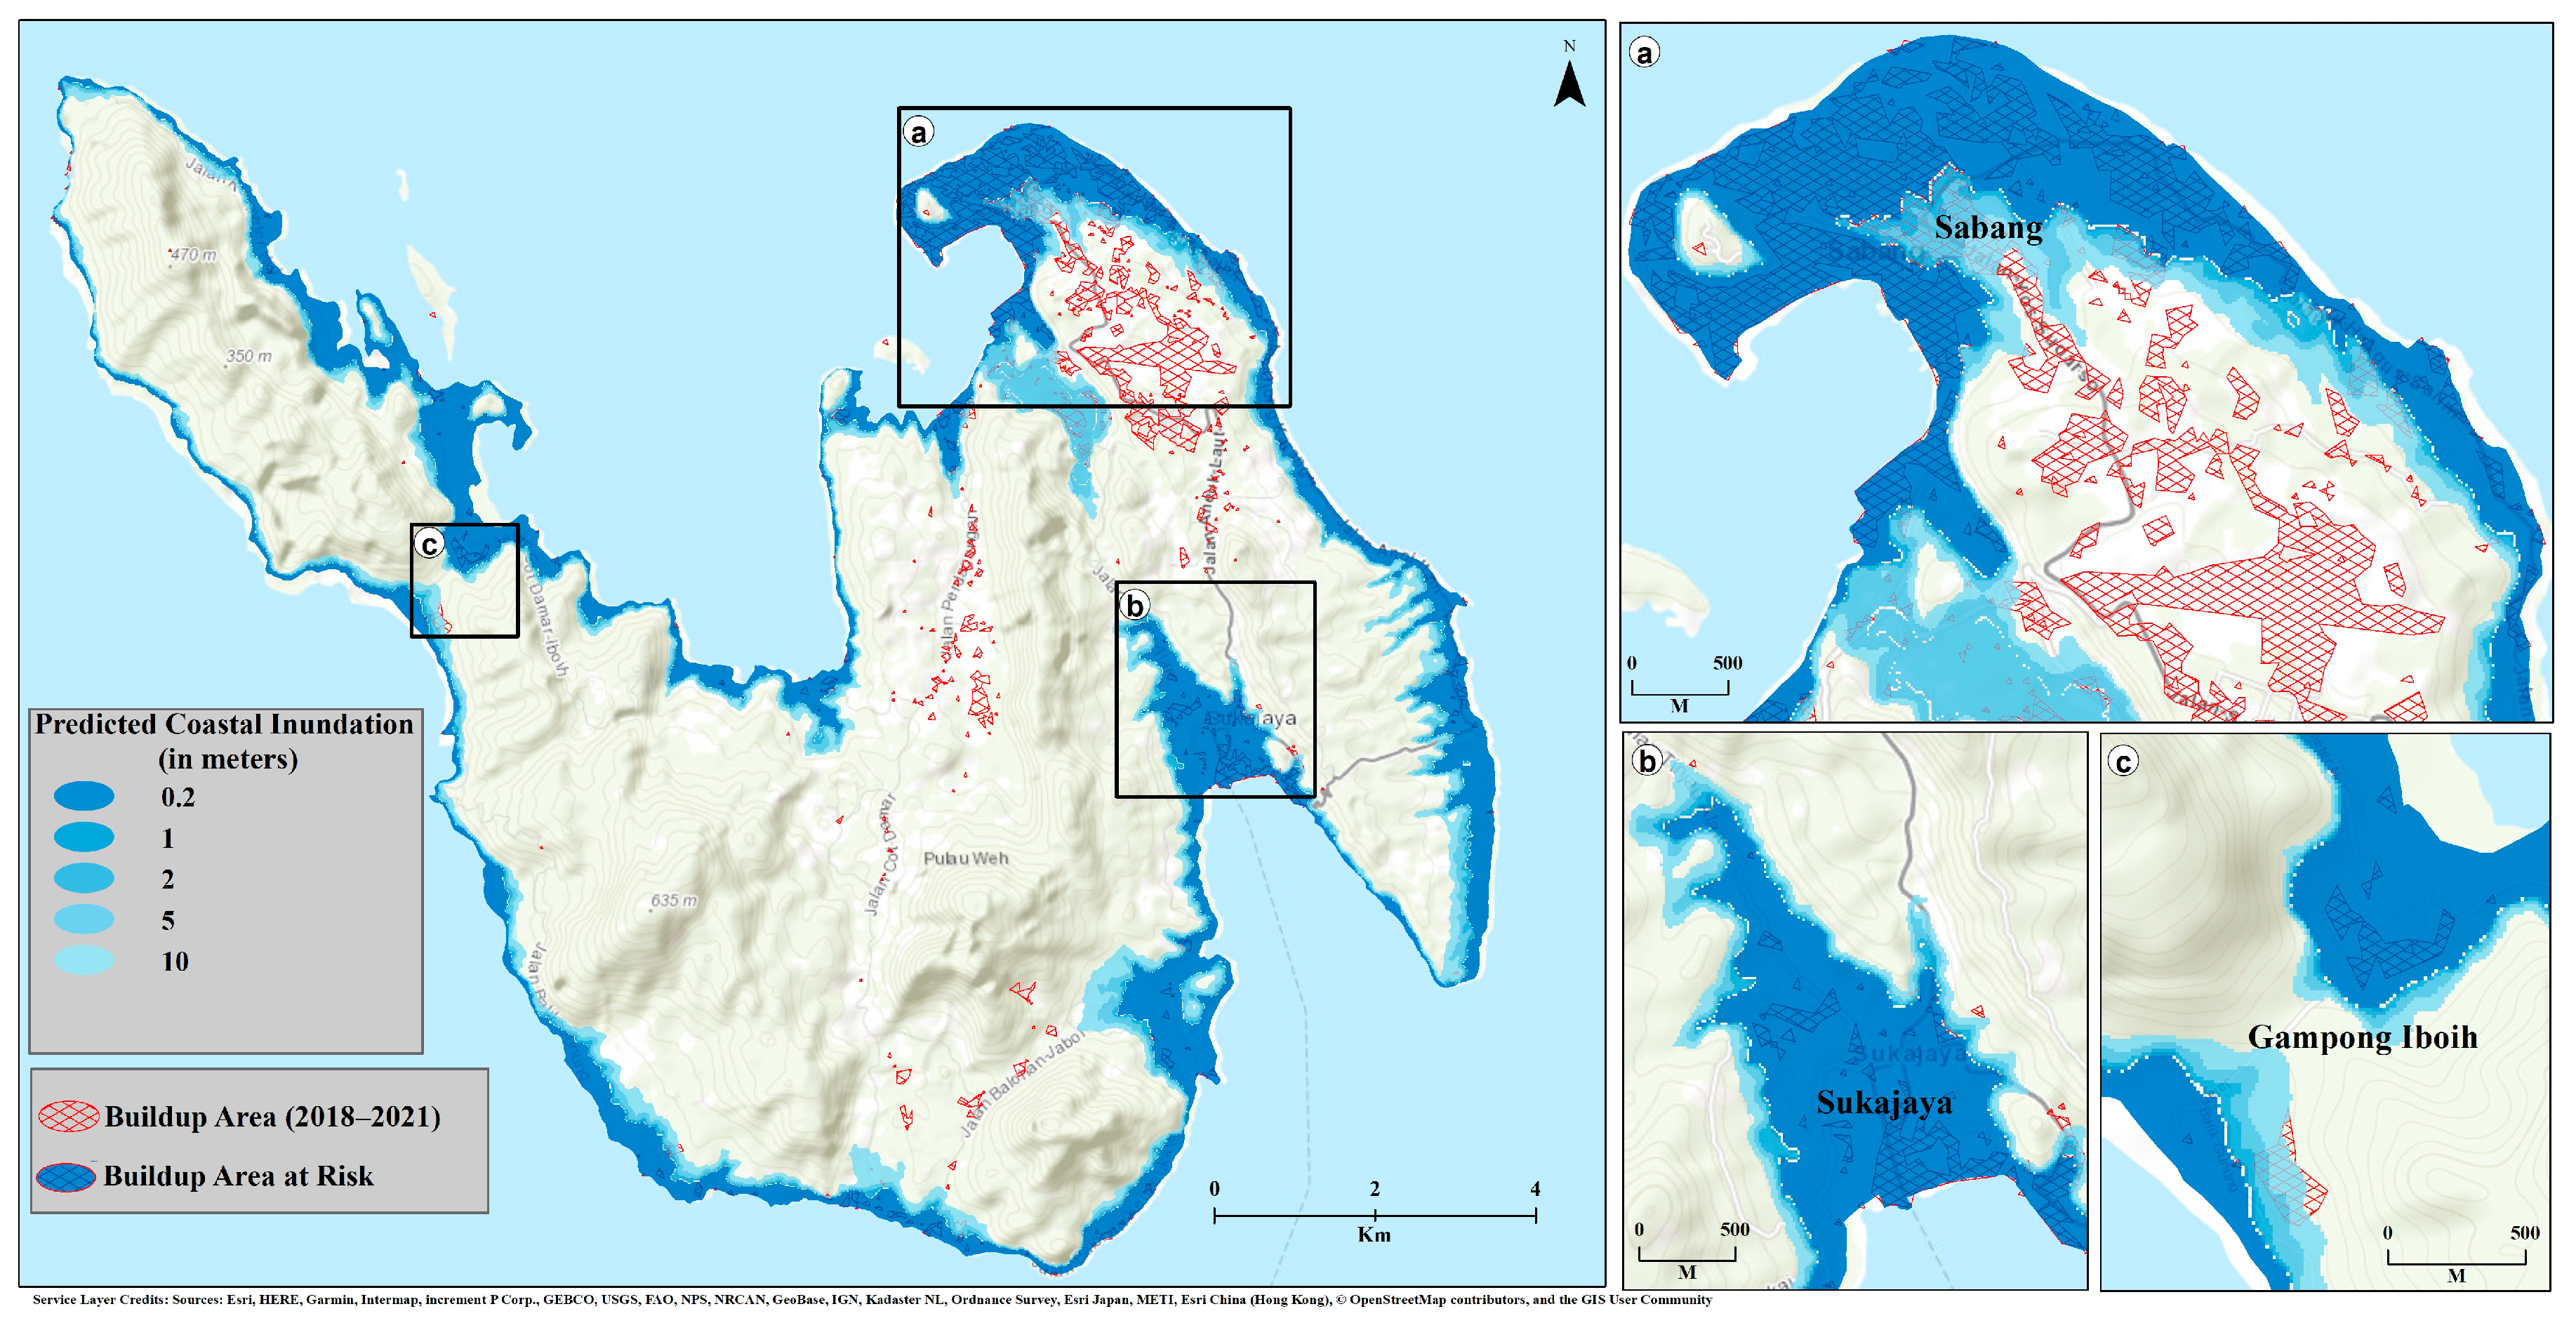
4.4. Coastal Inundation and Built-Up Areas

The coastal inundation on the island was assessed based on the present coastline, topography configuration, rate of sea level rise, and exposure to the built-up area. Although the data points were limited (only four points for the entire island), they were valuable for showing a general upward pattern of sea level with a rate of 6.6 mm/year. The water rise model was constructed based on the present coastline and DEM for two scenarios: (1) probable future sea levels, i.e., 0.2 m in 2050 and 1 m in 2100, and (2) extreme storm surge/tsunami events, i.e., a 5 m and 10 m rise of wave heights. Although the island’s slope is generally steep, the modelled results signify that about half of the coastal settlements (2.5 sq km) will be submerged due to a rise in sea level of just 0.2 m from the present coastline (Table 3). The vulnerability of coastal inundation is very significant and severe in Sabang town, the largest cluster of settlements on the island (Figure 7), due to the growth of the built-up area over the coastal plain topography (Figure 8). The other important coastal towns that have greater vulnerability to coastal inundation are Sukajaya and Ganpong Iboih. These towns are not only exposed to the risk of sea level rise but are also prone to possible storm surge/tsunami events.

5. Discussion

Rising sea levels and their subsequent effect on the coastal zone are a concern at a global level. The recent acceleration in sea level rise due to anthropogenic-induced climate change means that the negative impacts of climate-change-induced hazards are an imminent threat to coastal communities worldwide. Few studies have assessed the impact of sea level rise on low-lying parts of the Indonesian islands using historic observation records from tide gauge data and sea level anomaly altimetry satellite data [51] and secondary data integrated to form layers in the geospatial environment for inundation modelling [25,28]. Further, quantifying the impact of climate change and sea level rise on the coastal environment and ecosystems of Indonesian islands has only been attempted with coarser spatial and temporal resolution datasets. Comprehensive vulnerability assessments are required to understand the impacts of climate-change-induced hazards on small, low-lying islands to inform adaptation strategies, mitigate losses, and improve the resilience of communities to future change [52].
In previous studies, the quantification of potential risk zones was attempted, but they utilised single-term data. Rather, in this study, we utilised the long-term change of multiple environmental factors, such as minimum temperature, maximum temperature, rainfall, and forest cover, and also population dynamics for the delineation of potential risk zones for coastal inundation due to relative sea level rise. A long-term dataset was considered (1988–2021) for climatic and land use variables. It was observed that the temperature (both minimum and maximum) and rainfall of the island showed a strong upward trend (α = 0.01). The Sen’s slope estimate indicated that the maximum temperature and rainfall of the island are increasing by about 0.01 °C and 11.5 mm, respectively, per year. It was also observed that the positive trends of temperature and rainfall are closely associated with vegetative growth, and an upward trend in the dense forest was noticed through the enhanced vegetation index (EVI). The sea level dynamics of the island coasts were studied indirectly using the satellite altimeter datasets, and the results show that the sea level is increasing at a rate of 6.6 mm/year with a statistical level of significance (α = 0.05). The positive sea level anomalies are significant in recent years, resulting in more coastal inundation in the low-lying areas. From the NDBI change detection analysis, it was observed that the low-lying coastal areas are being converted into built-up areas, expanding three-fold since 1988, and possess greater risks of coastal inundation. The coastal inundation model utilising the ALOS PALSAR DEM indicated that about half of the coastal settlements (2.5 sq km) would be submerged completely within the next 30 years if the same sea level rise continues.
Through this study, we proposed an effective spatio-temporally transferable methodological framework for the impact assessment of coastal flooding in smaller islands. This study could be improved by including the in situ measurements of tidal variations and a focused group survey to understand the perspective of the local community on climate change and the prevailing issues due to sea level rise. Improved observation records of physical phenomena, including tides, pressure, rainfall, wind, and waves, would also allow for dynamic flood modelling to better understand which areas may be most vulnerable to climate-change-induced hazards [27,53,54].

6. Conclusions

In this study, we chose Sabang Island, Indonesia, to assess climate change, sea level rise, and coastal inundations. Here, we estimated the trends in climatic variables and sea level rise by utilising long-term (1988–2021), satellite-derived data products and statistical analysis. It was observed that the maximum temperature and rainfall of the island are increasing by about 0.01 °C and 11.5 mm, respectively, per year, with a statistical significance (α = 0.01). The satellite altimeter datasets showed that the sea level is increasing at a rate of 6.6 mm/year. The topographic geospatial modelling of sea level rise scenarios based on IPCC projections and local sea level trends showed that coastal inundation in low-lying areas is a serious issue on the island. About half of the coastal settlements on the islands (2.5 sq km) will be submerged completely within the next 30 years if the same trends in sea level rise continue. The study formed baseline datasets for understanding vulnerability to coastal hazards and gives an insight for stakeholders and policymakers to frame policies for sustainable coastal zone management. Further, the methodological framework we proposed through this study is spatio-temporally transferable and also utilised mainly open-source data. So, the study could be extended to other smaller islands of this region on a larger scale with reasonable accuracy.

Author Contributions

Conceptualisation, K.K. and K.B.; methodology, K.K., K.B. and K.A.P.; software, K.B., V.R. and K.A.P.; validation, K.K., D.C., C.E.L., M.N. and P.H.; formal analysis, K.K., V.R., R.R.B.P. and S.P.; investigation, K.K., K.B. and C.E.L.; resources, K.K., data curation, R.R.B.P.; writing—original draft preparation, K.K., K.B. and K.A.P.; writing—review and editing, K.K., P.R., C.E.L., K.B., K.A.P., S.P.; visualisation, K.K.; supervision, K.K.; project administration, K.K.; funding acquisition, K.K. All authors have read and agreed to the published version of the manuscript.

Funding

This research was funded by the British Council and Newton Fund Researcher Links Challenge Prize project (Grant British Council number/ref is: 711088819) “Addressing Marine Plastic Waste as a Climate Change Adaptation Priority in Indonesia” in partnership with Bangor University (UK), the Centre of Sustainable Energy and Resources Management, Universitas Nasional (Indonesia), and Aquatera (https://www.aquatera.co.uk/ (accessed on 29 April 2022)).

Data Availability Statement

Not applicable.

Conflicts of Interest

The authors declare no conflict of interest.

References

  1. Rebecca Lindsey, L.D. Climate Change: Global Temperature. Available online: https://www.climate.gov/news-features/understanding-climate/climate-change-global-temperature#:~:text=Earth’s%20temperature%20has%20risen%20by,land%20areas%20were%20record%20warm (accessed on 29 April 2022).
  2. CO2:earth. 2022 CO2.Earth. Available online: https://www.co2.earth/global-warming-update (accessed on 29 April 2022).
  3. IUCN Occean Warming. 2022 International Union for Conservation of Nature. Available online: https://www.iucn.org/resources/issues-briefs/ocean-warming#:~:text=Data%20from%20the%20US%20National,over%20the%20past%20100%20years (accessed on 29 April 2022).
  4. Lindsey, R. Climate Change: Global Sea Level. Available online: https://www.climate.gov/news-features/understanding-climate/climate-change-global-sea-level#:~:text=In%202020%2C%20global%20sea%20level,per%20year%20from%202006%E2%80%932015 (accessed on 29 April 2022).
  5. Blunden, J.; Boyer, T. State of the Climate in 2020. Bull. Am. Meteorol. Soc. 2021, 102, S1–S475. [Google Scholar] [CrossRef]
  6. Wong, P.P.; Boon-Thong, L.; Leung, M.W.H. Hot Spots of Population Growth and Urbanisation in the Asia-Pacific Coastal Region. In Global Change and Integrated Coastal Management: The Asia-Pacific Region; Harvey, N., Ed.; Springer: Dordrecht, The Netherlands, 2006; pp. 163–195. [Google Scholar] [CrossRef]
  7. Bank, W. Advancing Disaster Risk Financing and Insurance in ASEAN Member States: Framework and Options for Implementation; World Bank: Washington, DC, USA, 2012; Available online: http://hdl.handle.net/10986/12627 (accessed on 29 April 2022).
  8. Dewi, R.G. Indonesia Second National Communication under the United Nations Framework Convention on Climate Change (UNFCCC); Ministry of Environment, Republic of Indonesia: Jakarta, Indonesia, 2010. Available online: http://unfccc.int/files/national_reports/non-annex_i_natcom/submitted_natcom/application/pdf/indonesia_snc.pdf (accessed on 29 April 2022).
  9. Kurniawan, R.; Harsa, H.; Nurrahmat, M.H.; Sasmito, A.; Florida, N.; Makmur, E.E.S.; Swarinoto, Y.S.; Habibie, M.N.; Hutapea, T.F.; Sudewi, R.S.; et al. The Impact of Tropical Cyclone Seroja to The Rainfall and Sea Wave Height in East Nusa Tenggara. IOP Conf. Ser. Earth Environ. Sci. 2021, 925, 012049. [Google Scholar] [CrossRef]
  10. World Bank Population Growth (Annual%)-Indonesia. 2022 Wolrd Bank. Available online: https://data.worldbank.org/indicator/SP.POP.GROW?locations=ID (accessed on 10 April 2022).
  11. Neumann, B.; Vafeidis, A.T.; Zimmermann, J.; Nicholls, R.J. Future coastal population growth and exposure to sea-level rise and coastal flooding-a global assessment. PLoS ONE 2015, 10, e0118571. [Google Scholar] [CrossRef] [PubMed] [Green Version]
  12. Syaukat, Y. The impact of climate change on food production and security and its adaptation programs in Indonesia. J. ISSAAS 2011, 17, 40–51. [Google Scholar]
  13. Harwitasari, D.; van Ast, J.A. Climate change adaptation in practice: People’s responses to tidal flooding in Semarang, Indonesia. J. Flood Risk Manag. 2011, 4, 216–233. [Google Scholar] [CrossRef] [Green Version]
  14. Yamamoto, K.; Sayama, T. Impact of climate change on flood inundation in a tropical river basin in Indonesia. Prog. Earth Planet. Sci. 2021, 8, 1–15. [Google Scholar] [CrossRef]
  15. Kelley, L.C.; Prabowo, A. Flooding and land use change in Southeast Sulawesi, Indonesia. Land 2019, 8, 139. [Google Scholar] [CrossRef] [Green Version]
  16. Solomon, S. IPCC (2007): Climate Change the Physical Science Basis; Agu Fall Meeting Abstracts; IPCC: Geneva, Switzerland, 2007; p. U43D-01. [Google Scholar]
  17. Merten, J.; Stiegler, C.; Hennings, N.; Purnama, E.S.; Röll, A.; Agusta, H.; Dippold, M.A.; Fehrmann, L.; Gunawan, D.; Hölscher, D.; et al. Flooding and land use change in Jambi Province, Sumatra: Integrating local knowledge and scientific inquiry. Ecol. Soc. 2020, 25. [Google Scholar] [CrossRef]
  18. Dissanayake, S.; Asafu-Adjaye, J.; Mahadeva, R. Addressing climate change cause and effect on land cover and land use in South Asia. Land Use Policy 2017, 67, 352–366. [Google Scholar] [CrossRef]
  19. Turner, R.K.; Subak, S.; Adger, W.N. Pressures, trends, and impacts in coastal zones: Interactions between socioeconomic and natural systems. Environ. Manag. 1996, 20, 159–173. [Google Scholar] [CrossRef]
  20. Duvat, V.K.; Magnan, A.K.; Wise, R.M.; Hay, J.E.; Fazey, I.; Hinkel, J.; Stojanovic, T.; Yamano, H.; Ballu, V. Trajectories of exposure and vulnerability of small islands to climate change. Wiley Interdiscip. Rev. Clim. Change 2017, 8, e478. [Google Scholar] [CrossRef] [Green Version]
  21. Ballu, V.; Bouin, M.-N.; Siméoni, P.; Crawford, W.C.; Calmant, S.; Boré, J.-M.; Kanas, T.; Pelletier, B. Comparing the role of absolute sea-level rise and vertical tectonic motions in coastal flooding, Torres Islands (Vanuatu). Proc. Natl. Acad. Sci. USA 2011, 108, 13019–13022. [Google Scholar] [CrossRef] [PubMed] [Green Version]
  22. Creel, L. Ripple Effects: Population and Coastal Regions; Population Reference Bureau: Washington, DC, USA, 2003. [Google Scholar]
  23. Laurice Jamero, M.; Onuki, M.; Esteban, M.; Billones-Sensano, X.K.; Tan, N.; Nellas, A.; Takagi, H.; Thao, N.D.; Valenzuela, V.P. Small-island communities in the Philippines prefer local measures to relocation in response to sea-level rise. Nat. Clim. Change 2017, 7, 581–586. [Google Scholar] [CrossRef]
  24. Rahman, M.S.; Toiba, H.; Huang, W.-C. The Impact of Climate Change Adaptation Strategies on Income and Food Security: Empirical Evidence from Small-Scale Fishers in Indonesia. Sustainability 2021, 13, 7905. [Google Scholar] [CrossRef]
  25. Marfai, M.A.; King, L. Potential vulnerability implications of coastal inundation due to sea level rise for the coastal zone of Semarang city, Indonesia. Environ. Geol. 2008, 54, 1235–1245. [Google Scholar] [CrossRef]
  26. Case, M.; Ardiansyah, F.; Spector, E. Climate Change in Indonesia Implications for Humans and Nature 2007. Available online: http://awsassets.panda.org/downloads/inodesian_climate_change_impacts_report_14nov07.pdf (accessed on 30 April 2022).
  27. Buchori, I.; Pramitasari, A.; Sugiri, A.; Maryono, M.; Basuki, Y.; Sejati, A.W. Adaptation to Coastal Flooding and Inundation: Mitigations and Migration Pattern in Semarang City, Indonesia. Ocean. Coast. Manag. 2018, 163, 445–455. [Google Scholar] [CrossRef]
  28. Marfai, M.A. Impact of Sea Level Rise to Coastal Ecology: A Case Study on the Northern Part of Java Island, Indonesia. Quaest. Geogr. 2014, 33, 107–114. [Google Scholar] [CrossRef] [Green Version]
  29. Zikra, M.; Lukijanto, S. Climate Change Impacts on Indonesian Coastal Areas. Procedia Earth Planet. Sci. 2015, 14, 57–63. [Google Scholar] [CrossRef] [Green Version]
  30. Dewi, R.S.; Bijker, W. Dynamics of shoreline changes in the coastal region of Sayung, Indonesia. Egypt J. Remote Sens. Space Sci. 2020, 23, 181–193. [Google Scholar] [CrossRef]
  31. Syamsuddin, S.A. Geoenvironmental Study for Coastal Zone Management Using Remote Sensing and GIS in Aceh, Indonesia. Ph.D. Thesis, King Abdulaziz University, Jeddah, Saudi Arabia, 2021. [Google Scholar]
  32. Achmad, A.; Irwansyah, M.; Nizamuddin, N.; Ramli, I. Land Use and Cover Changes and Their Implications on Local Climate in Sabang City, Weh Island, Indonesia. J. Urban Plan. Dev. 2019, 145, 04019017. [Google Scholar] [CrossRef]
  33. Arif, A.A.; Machdar, I.; Achmad, A. Vulnerability factors in small islands and environmental carrying capacity by the AHP method. Case Study: Weh Island, Aceh, Indonesia. IOP Conf. Ser. Earth Environ. Sci. 2021, 630, 012012. [Google Scholar] [CrossRef]
  34. NASA the POWER Project. NASA Prediction of Worldwide Energy Resources. Available online: https://power.larc.nasa.gov/ (accessed on 18 March 2022).
  35. Rienecker, M.M.; Suarez, M.J.; Gelaro, R.; Todling, R.; Bacmeister, J.; Liu, E.; Bosilovich, M.G.; Schubert, S.D.; Takacs, L.; Kim, G.-K.; et al. MERRA: NASA’s Modern-Era Retrospective Analysis for Research and Applications. J. Clim. 2011, 24, 3624–3648. [Google Scholar] [CrossRef]
  36. Zlotnicki, V.; Qu, Z.; Willis, J. MEaSUREs Gridded Sea Surface Height Anomalies Version 1812. NASA Physical Oceanography DAAC: 2019. Available online: https://podaac.jpl.nasa.gov/dataset/SEA_SURFACE_HEIGHT_ALT_GRIDS_L4_2SATS_5DAY_6THDEG_V_JPL1812 (accessed on 29 April 2022).
  37. Dawson, A.G.; Dawson, S.; Ritchie, W. Historical climatology and coastal change associated with the ‘Great Storm’of January 2005, South Uist and Benbecula, Scottish Outer Hebrides. Scott. Geogr. J. 2007, 123, 135–149. [Google Scholar] [CrossRef]
  38. Dawson, D.; Shaw, J.; Gehrels, W.R. Sea-level rise impacts on transport infrastructure: The notorious case of the coastal railway line at Dawlish, England. J. Transport. Geogr. 2016, 51, 97–109. [Google Scholar] [CrossRef] [Green Version]
  39. NASA PODAAC: Physical Occeanography Distributed Active Archive Center.Earth Data: Jet Propulsion Laboratory California Institute of Technology. Available online: https://podaac.jpl.nasa.gov/ (accessed on 29 April 2022).
  40. Doody, J.P.; Williams, A. ‘Coastal squeeze’–an historical perspective. J. Coast. Conserv. 2004, 10, 129–138. [Google Scholar] [CrossRef]
  41. Liu, H.Q.; Huete, A. A feedback based modification of the NDVI to minimize canopy background and atmospheric noise. IEEE Trans. Geosci. Remote Sens. 1995, 33, 457–465. [Google Scholar] [CrossRef]
  42. Zha, Y.; Gao, J.; Ni, S. Use of normalized difference built-up index in automatically mapping urban areas from TM imagery. Int. J. Remote Sens. 2003, 24, 583–594. [Google Scholar] [CrossRef]
  43. Choudhury, D.; Das, K.; Das, A. Assessment of land use land cover changes and its impact on variations of land surface temperature in Asansol-Durgapur Development Region. Egypt. J. Remote Sens. Space Sci. 2019, 22, 203–218. [Google Scholar] [CrossRef]
  44. Sushant, S.; Balasubramani, K.; Kumaraswamy, K. Spatio-temporal Analysis of Rainfall Distribution and Variability in the Twentieth Century, Over the Cauvery Basin, South India. In Environmental Management of River Basin Ecosystems; Ramkumar, M., Kumaraswamy, K., Mohanraj, R., Eds.; Springer International Publishing: Cham, Switzerland, 2015; pp. 21–41. [Google Scholar] [CrossRef]
  45. Sen, P.K. Estimates of the Regression Coefficient Based on Kendall’s Tau. J. Am. Stat. Assoc. 1968, 63, 1379–1389. [Google Scholar] [CrossRef]
  46. Pörtner, H.O.; Roberts, D.C.; Adams, H.; Adler, C.; Aldunce, P.; Ali, E.; Begum, R.A.; Betts, R.; Kerr, R.B.; Biesbroek, R. Climate Change 2022: Impacts, Adaptation and Vulnerability. 2022. Available online: https://edepot.wur.nl/565644 (accessed on 29 April 2022).
  47. BalaSundareshwaran, A.; Balasubramani, K.; Kumaraswamy, K.; Rahaman, S.A. Geoinformatics As A Catalyst For Preparation Of District Disaster Risk Management Plan: A Case Of Karur District, Tamil Nadu. Disaster Risk Reduct. 2019, 94, 1–17. [Google Scholar]
  48. George, S.L.; Kantamaneni, K.; Prasad, K.A.; Shekhar, S.; Panneer, S.; Rice, L.; Balasubramani, K. A Multi-Data Geospatial Approach for Understanding Flood Risk in the Coastal Plains of Tamil Nadu, India. Earth 2022, 3, 383–400. [Google Scholar] [CrossRef]
  49. Balica, S.F.; Wright, N.G.; van der Meulen, F. A flood vulnerability index for coastal cities and its use in assessing climate change impacts. Nat. Hazards 2012, 64, 73–105. [Google Scholar] [CrossRef] [Green Version]
  50. Ward, P.J.; Marfai, M.A.; Yulianto, F.; Hizbaron, D.R.; Aerts, J.C.J.H. Coastal inundation and damage exposure estimation: A case study for Jakarta. Nat. Hazards 2011, 56, 899–916. [Google Scholar] [CrossRef] [Green Version]
  51. Djunarsjah, E.; Rahma, A.; Nusantara, C.A.D.S. Analysis of prediction of sea level rise impact based on tidal gauge and altimetry satellite on land cover area of Saparua Island, Maluku, Indonesia. IOP Conf. Ser. Earth Environ. Sci. 2021, 797, 012027. [Google Scholar] [CrossRef]
  52. Mehvar, S.; Filatova, T.; Syukri, I.; Dastgheib, A.; Ranasinghe, R. Developing a framework to quantify potential Sea level rise-driven environmental losses: A case study in Semarang coastal area, Indonesia. Environ. Sci. Policy 2018, 89, 216–230. [Google Scholar] [CrossRef]
  53. Vellinga, P.; Leatherman, S.P. Sea level rise, consequences and policies. Clim. Change 1989, 15, 175–189. [Google Scholar] [CrossRef]
  54. NOAA. NCEI/WDS Global Historical Tsunami Database, 2100 BC to Present. 2021. Available online: https://data.noaa.gov/metaview/page?xml=NOAA/NESDIS/NGDC/MGG/Hazards/iso/xml/G02151.xml&view=getDataView# (accessed on 4 June 2022).
Figure 1. Case study area—Sabang Island, Indonesia.
Remotesensing 14 02857 g001
Figure 2. Climatic diagram of Sabang Island based on long-term climate data (1981–2020). The bar graphs denote the month-wise average amount of rainfall (in mm). The dark-red line represents the average temperature (in °C), and the dotted, blue line shows monthly variations of relative humidity (%).
Remotesensing 14 02857 g002
Figure 3. Climatic trends in Sabang Island (1981–2020) of (A) annual average maximum temperature, (B) annual average minimum temperature, (C) annual average rainfall, and (D) annual average relative humidity. A statistically significant upward trend is noticed in maximum and minimum temperatures. The rainfall pattern follows a cyclic pattern with an overall increasing trend. The relative humidity follows a long-term (~15 years) cyclic trend.
Remotesensing 14 02857 g003
Figure 4. Monthly and annual distribution of Mann-Kendall test Z score. The long-term data (1981–2020) show that the maximum and minimum temperature (red symbols) of Sabang Island has an upward trend for all the months with a statistically significant Z score. Except for May and September, rainfall (blue symbols) also has an upward trend for all the months. Relative humidity (green symbols) shows an upward trend during the months April–August. The annual average data show that maximum–minimum temperature and rainfall follow an upward trend with a statistically significant Z score, while relative humidity shows a downward trend with an insignificant Z score.
Remotesensing 14 02857 g004
Figure 5. Trend of sea surface height anomaly (SSHA) on the coasts of Sabang Island (1993–2019). The analysis shows that the sea level is significantly increasing (α = 0.01) at a rate of 6.6 mm/year.
Remotesensing 14 02857 g005
Figure 6. Median values of enhanced vegetation index (EVI) from 1988 to 2021. The dark green colour denotes dense vegetation.
Remotesensing 14 02857 g006
Figure 7. Median values of normalised difference built-up index (NDBI) from 1988 to 2021. The built-up areas increased gradually from 1988 to 2021, and the changes are apparent after 2001.
Remotesensing 14 02857 g007
Figure 8. Predicted coastal inundation on Sabang Island. The blue shades represent different water level rise scenarios. The latest built-up area is overlaid to allow an understanding of the built-up elements at risk.
Remotesensing 14 02857 g008
Table 1. Sources of satellite datasets used in the study.
Sensor/ModelParametersPeriodSource
MERRA-2 and GEOS 5.12.4Minimum Temperature, Maximum Temperature, Rainfall, Relative Humidity1981–2020[37]
LANDSAT 5 and 8, MODISEnhanced Vegetation Index1988–2021[38]
LANDSAT 5 and 8Normalised Difference Built-Up Index1988–2021[38]
TOPEX/Poseidon, Jason-1, -2, and -3Sea Level Anomaly1993–2019[39]
ALOS PALSARDigital Elevation Model2015[40]
Table 2. Dynamics of built-up areas and dense forests of Sabang Island.
YearBuilt-Up Area (sq km)Dense Forest Area (sq km)
1988–19921.6291.9
1993–19971.6992.5
1998–20012.1849.5
2004–20094.3270.5
2014–20174.67116.5
2018–20215.41115.1
Table 3. The area of built-up elements at risk under different predicted coastal inundation levels.
Predicted Coastal Inundation (meters)Built-Up Are (sq km)
0.22.49
12.51
22.59
52.89
103.04
Publisher’s Note: MDPI stays neutral with regard to jurisdictional claims in published maps and institutional affiliations.

