Technical Note

Spatiotemporal Variation of Snow Cover Frequency in the Qilian Mountains (Northwestern China) during 2000–2020 and Associated Circulation Mechanisms

1
Qilian Shan Station of Glaciology and Eco-Environment, State Key Laboratory of Cryospheric Science, Northwest Institute of Eco-Environment and Resources, Chinese Academy of Sciences (CAS), Lanzhou 730000, China
2
University of Chinese Academy of Sciences, Beijing 100049, China
3
South China Sea Marine Survey and Technology Center, State Oceanic Administration (SOA), Guangzhou 510300, China
4
Lanzhou Regional Climate Center, Lanzhou 730020, China
5
Zhangye Meteorological Service, Zhangye 734000, China
6
College of Geography and Environment, Shandong Normal University, Jinan 250014, China
7
School of Foreign Languages and Literatures, Lanzhou University, Lanzhou 730000, China
*
Author to whom correspondence should be addressed.
Remote Sens. 2022, 14(12), 2823; https://doi.org/10.3390/rs14122823
Submission received: 26 April 2022 / Revised: 9 June 2022 / Accepted: 10 June 2022 / Published: 12 June 2022
(This article belongs to the Special Issue Remote Sensing of Clouds and Precipitation at Multiple Scales II)

Abstract

:
Linking snow cover frequency (SCF) and atmospheric circulation is vital for comprehension of hemispheric-scale change mechanisms and for accurate forecasting. This study combined MODIS imagery with meteorological observations to investigate the variation of annual SCFs in the Qilian Mountains. Results indicated that more than 80% of annual SCF is distributed at high elevations and mostly on northern slopes, and that SCF is greater in the west than in the east. Abrupt change in the increase in annual SCF was not detected; however, significant (0.05 confidence level) variation with quasi-3-year and quasi-5-year periods indicated potential connection with monsoons. Topographically, SCF increased at high elevations and decreased in valleys. Moreover, SCF increased significantly with a rise in slope below 23° and then decreased between 23° and 45°, and it decreased with a change in aspect from 70° to 200° and then increased from 200° to 310°. Annual SCF variation in the Qilian Mountains is dominated by precipitation rather than by temperature. In the years with high SCFs, southeasterly winds associated with an anticyclone over southeastern China and southwesterly winds associated with the cyclone over the Iranian Plateau brought warm moisture across northwestern China, favoring snowfall in the Qilian Mountains. Meanwhile, cold moisture outbreaks from the Arctic into the mid-latitudes are conducive to maintaining snow cover. However, in the years with low SCFs, the cold air might be difficultly transporting out of the Arctic region due to the strengthening polar vortex. Moreover, the water vapor was less than that of the mean state and divergence over the Qilian Mountains, which difficultly conduced snowfall over the Qilian Mountains.

Graphical Abstract

1. Introduction

Snow cover is a crucial component of the cryosphere, which has important roles on the terrestrial energy budget, hydrological cycle, ecosystem change, and human society on multiple spatiotemporal scales [1,2,3]. As an indicator of the atmospheric circulation [4,5], it is a response to the large-scale atmospheric circulation that reflects driving climatic parameters such as temperature, precipitation, wind, cloud, even teleconnection pathways at the hemispheric scale (e.g., Arctic sea ice) [5,6,7,8]. Over the past several decades, the changes in many parameters of snow cover (e.g., extent, depth, duration, onset date, end date, and snow water equivalent) on various spatiotemporal scales were investigated in China [4,6]. Among them, snow cover frequency (SCF) is used to represent the cumulative frequency of snow cover at the pixel level within a specified period, thereby reflecting the spatiotemporal variation of snow cover in detail. For regional investigation of snow cover, remote sensing imagery and numerical model simulation are regarded as optimal when combined with in situ observations for validation [9,10,11]. Moderate resolution imaging spectroradiometer (MODIS) snow products have been used widely to depict the spatiotemporal patterns of snow cover in mountainous areas [12,13] owing to their high accuracy at both regional and global scales [14,15].
Both temperature and precipitation become more influential controlling factors as elevation increases, which account for approximately one-half to two-thirds of the interannual variability of snow cover in China [16]. At ground level, temperature is the principal driver of extratropical climatic change that influences snow cover [17]. In cold regions, changes in snow cover are driven predominantly by precipitation and the effect of temperature is relatively small [18]. It is acknowledged that the Arctic Oscillation, Siberian High, East Asian winter monsoon, Pacific and Atlantic sea surface temperatures, and Arctic sea ice each have important impact on snow cover in China [19]. However, few studies have investigated the connections with accompanying anomalous atmospheric circulations, especially on extreme snow cover events [20].
Under a changing climate with warming and synoptic-scale wetting in northwestern China, recent changes in SCF in the Qilian Mountains and the role of associated atmospheric circulations require investigation to improve understanding the adaption for environmental realignment and ecological conservation. Therefore, this study used MODIS data to establish the spatiotemporal variations of SCF in the Qilian Mountains during 2000–2021, and then the climatic drivers and topographical influences were analyzed. Additionally, the atmospheric circulation mechanisms responsible for years with high/low SCFs were investigated through composite diagnostic analyses.

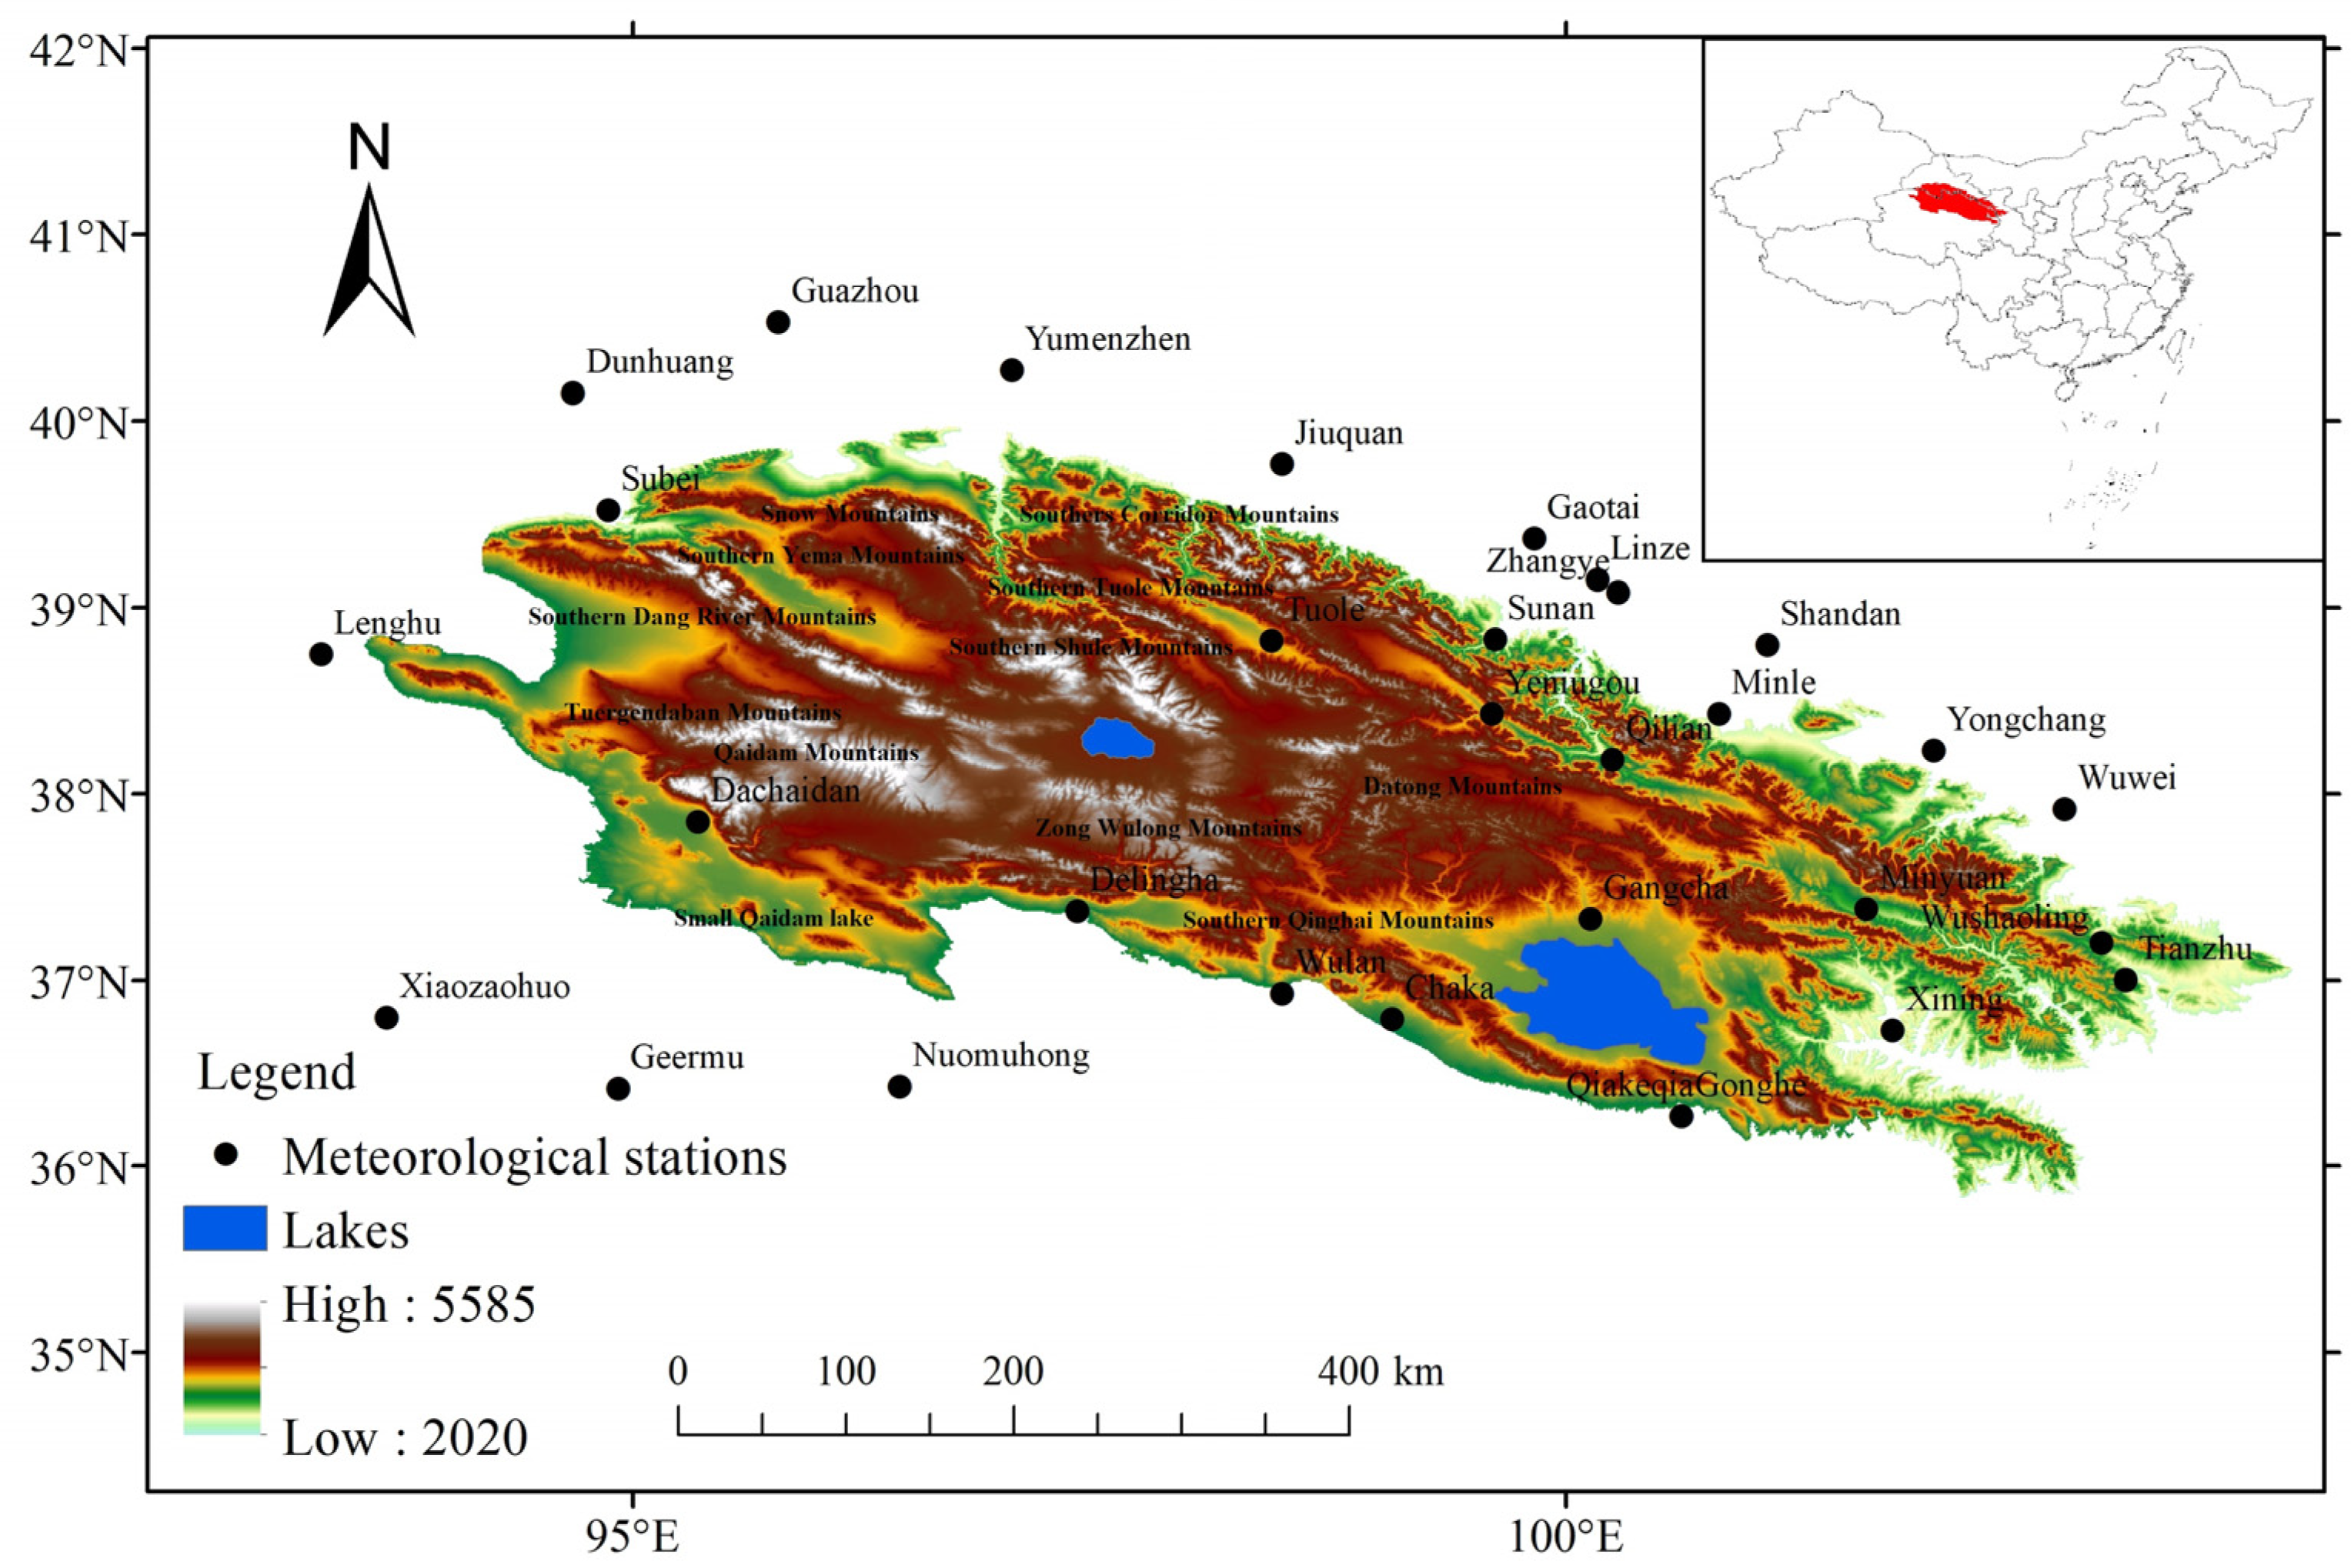
2. Description of Study Region

The Qilian Mountains are located on the northeastern edge of the Qinghai–Tibet Plateau, straddling Gansu and Qinghai provinces. The mountain range has total length of approximately 850 km and width of approximately 300 km at its greatest. The Qilian Mountains, which border Wushaoling to the east, the Dangjin Mountains to the west, the Hexi Corridor to the north, and the Qaidam Basin to the south, comprise a range of northwest–southeast-aligned parallel mountains and wide valleys with elevation that decreases from the northwest to the southeast (Figure 1). Owing to the location of the transitional zone between arid northwestern China and the Qinghai–Tibet Plateau, the region is affected by westerlies in the west, where precipitation is sparse, and by the Asian summer monsoons in the east, where precipitation is relatively abundant [21]. Annual precipitation varies from >800 mm in the Qilian Mountains to <80 mm in the deserts of the Hexi Corridor north of the mountain range, where mean annual rates of potential evapotranspiration can often exceed 2000 mm [22]. Generally, the region is characterized by low precipitation, elevated temperatures, and high evaporative demand [22], and the cryosphere that includes glaciers, permafrost, and snow cover is well developed. According to the Second Chinese Glacier Inventory, there are 2683 glaciers in the Qilian Mountains with elevation of >4000 m a.s.l., accounting for a combined area of 1597.81 km2 and an ice reserve of 84.48 km3 [23]. It should be noted that snow/ice meltwater in this mountain region represents an important source of the water supplied to inland rivers [24].

3. Data Resources and Methodology

3.1. Data Resources

3.1.1. Remote Sensing Imagery

MODIS/Terra Snow Cover 8-Day data (MOD10A2) images (track numbers: h25v05 and h25v06) with 500 m spatial resolution, covering the period from 26 February 2000 to 27 December 2020, were downloaded from the U.S. National Snow and Ice Data Center (http://nsidc.org/, accessed on 25 April 2022). Previous studies have confirmed that the MOD10A2 product has a high snow cover recognition rate and can be applied to monitoring snow cover over large spatial scales, especially in mountainous areas [25,26].

3.1.2. Digital Elevation Model

Digital elevation model data with 30 m spatial resolution were obtained from the Geospatial Data Cloud (http://www.gscloud.cn/, accessed on 25 April 2022).

3.1.3. Meteorological Data

Daily temperature and precipitation data, measured at 16 meteorological stations distributed within the Qilian Mountains (locations shown in Figure 1), were sourced from the China Meteorological Science Data Sharing Service Network (http://cdc.cma.gov.cn/, accessed on 25 April 2022) for the period from 1 January 2000 to 31 December 2020. Data quality control was performed with reference to standard international practice [27,28].

3.1.4. Reanalysis Data

This study used the fifth generation European Centre for Medium-Range Weather Forecasts reanalysis (ERA5) dataset (https://cds.climate.copernicus.eu/, accessed on 25 April 2022). A major strength of ERA5 is its much higher temporal and spatial resolutions in comparison with earlier global reanalysis products. The hourly output, 31 km horizontal resolution, and 137 vertical levels from the surface to 0.01 hPa of ERA5 capture atmospheric phenomena in much finer detail than previous, lower-resolution, global reanalysis products. Another advantage of ERA5 over the earlier ERA-Interim product is its much shorter latency, i.e., 5 d rather than 2–3 months [29]. Thus, ERA5 is appropriate for representing the large-scale variabilities of the Asian summer monsoon, westerlies, and Arctic air masses, which are the circulation patterns with greatest influence on the study region.

3.2. Methodology

The MOD10A2 products were first converted in terms of projection and format, and set to a unified longitude and latitude projection before being merged. Pixels identified as snow cover (other land use types) were extracted and their value set to 1 (0). On this basis, all identified snow pixels in each of the years were superposed to obtain the spatiotemporal variation of SCF during 2000–2020. Unified linear regression was applied to analyze the spatial variation of annual SCF, which was identified as increasing (decreasing) in the time series when the slope of the trend line was >0 (≤0) [30]. Moreover, all snow pixels at 1° intervals were extracted to calculate the correlation between SCF and slope and between SCF and aspect. Temperature and precipitation at 8 d intervals were first averaged and then interpolated using the radial basis function method to produce the same spatiotemporal resolution as the SCF data. The Pearson correlation coefficient [31] between SCF and both temperature and precipitation at corresponding pixels was calculated to investigate the climatic drivers.

4. Results and Discussion

As described in our earlier paper [32], daily meteorological observations (2010–2015) obtained in high-elevation areas of the western Qilian Mountains were selected to validate MODIS-identified snow cover, which is based on the relationship between albedo and SCF. The assessment indicated that the overall multiscore error rate was acceptable, and that the missed score rate was strongly associated with recognition accuracy, consistent with previous studies.
In this study, t-test results revealed that annual SCF is positively associated with seasonal SCF, indicating that each season makes a similar contribution to the annual scale. Considering previous analysis and the reasonably stable seasonal pattern of snow cover, we discuss only the variation of SCF at the annual scale in the following.

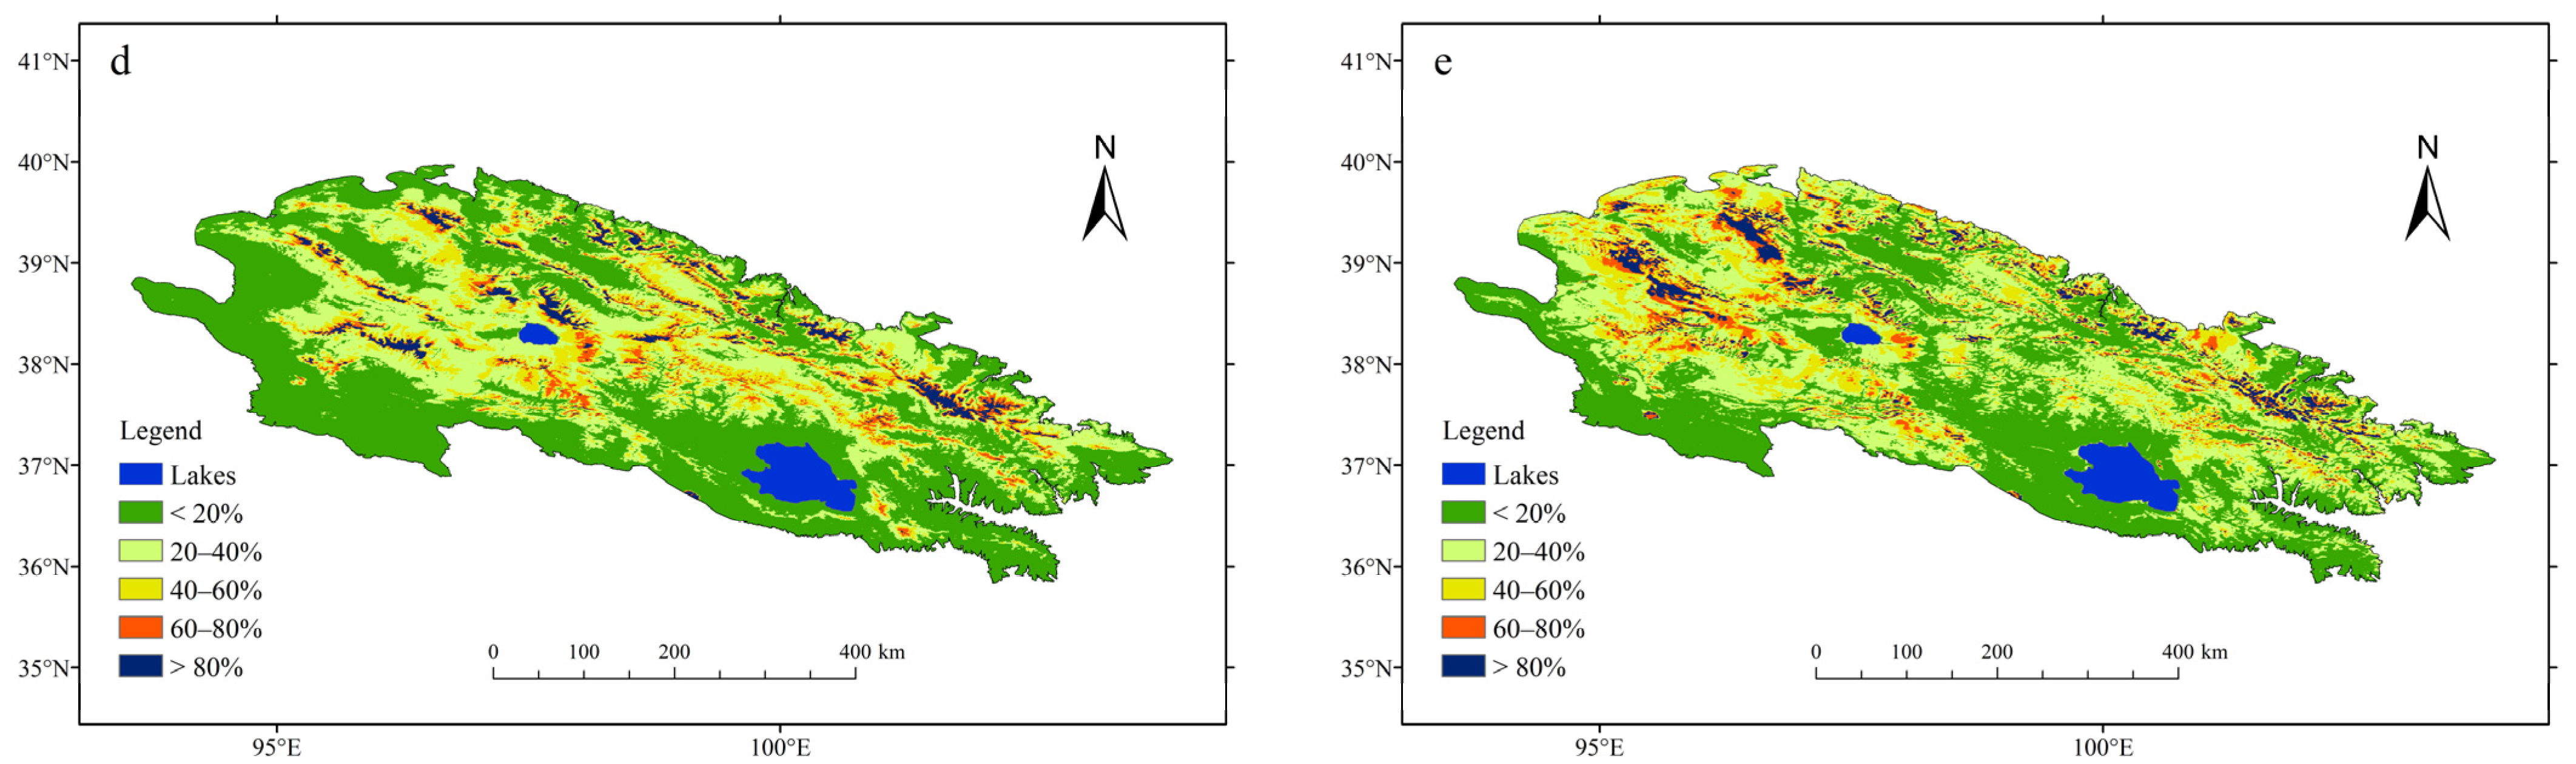
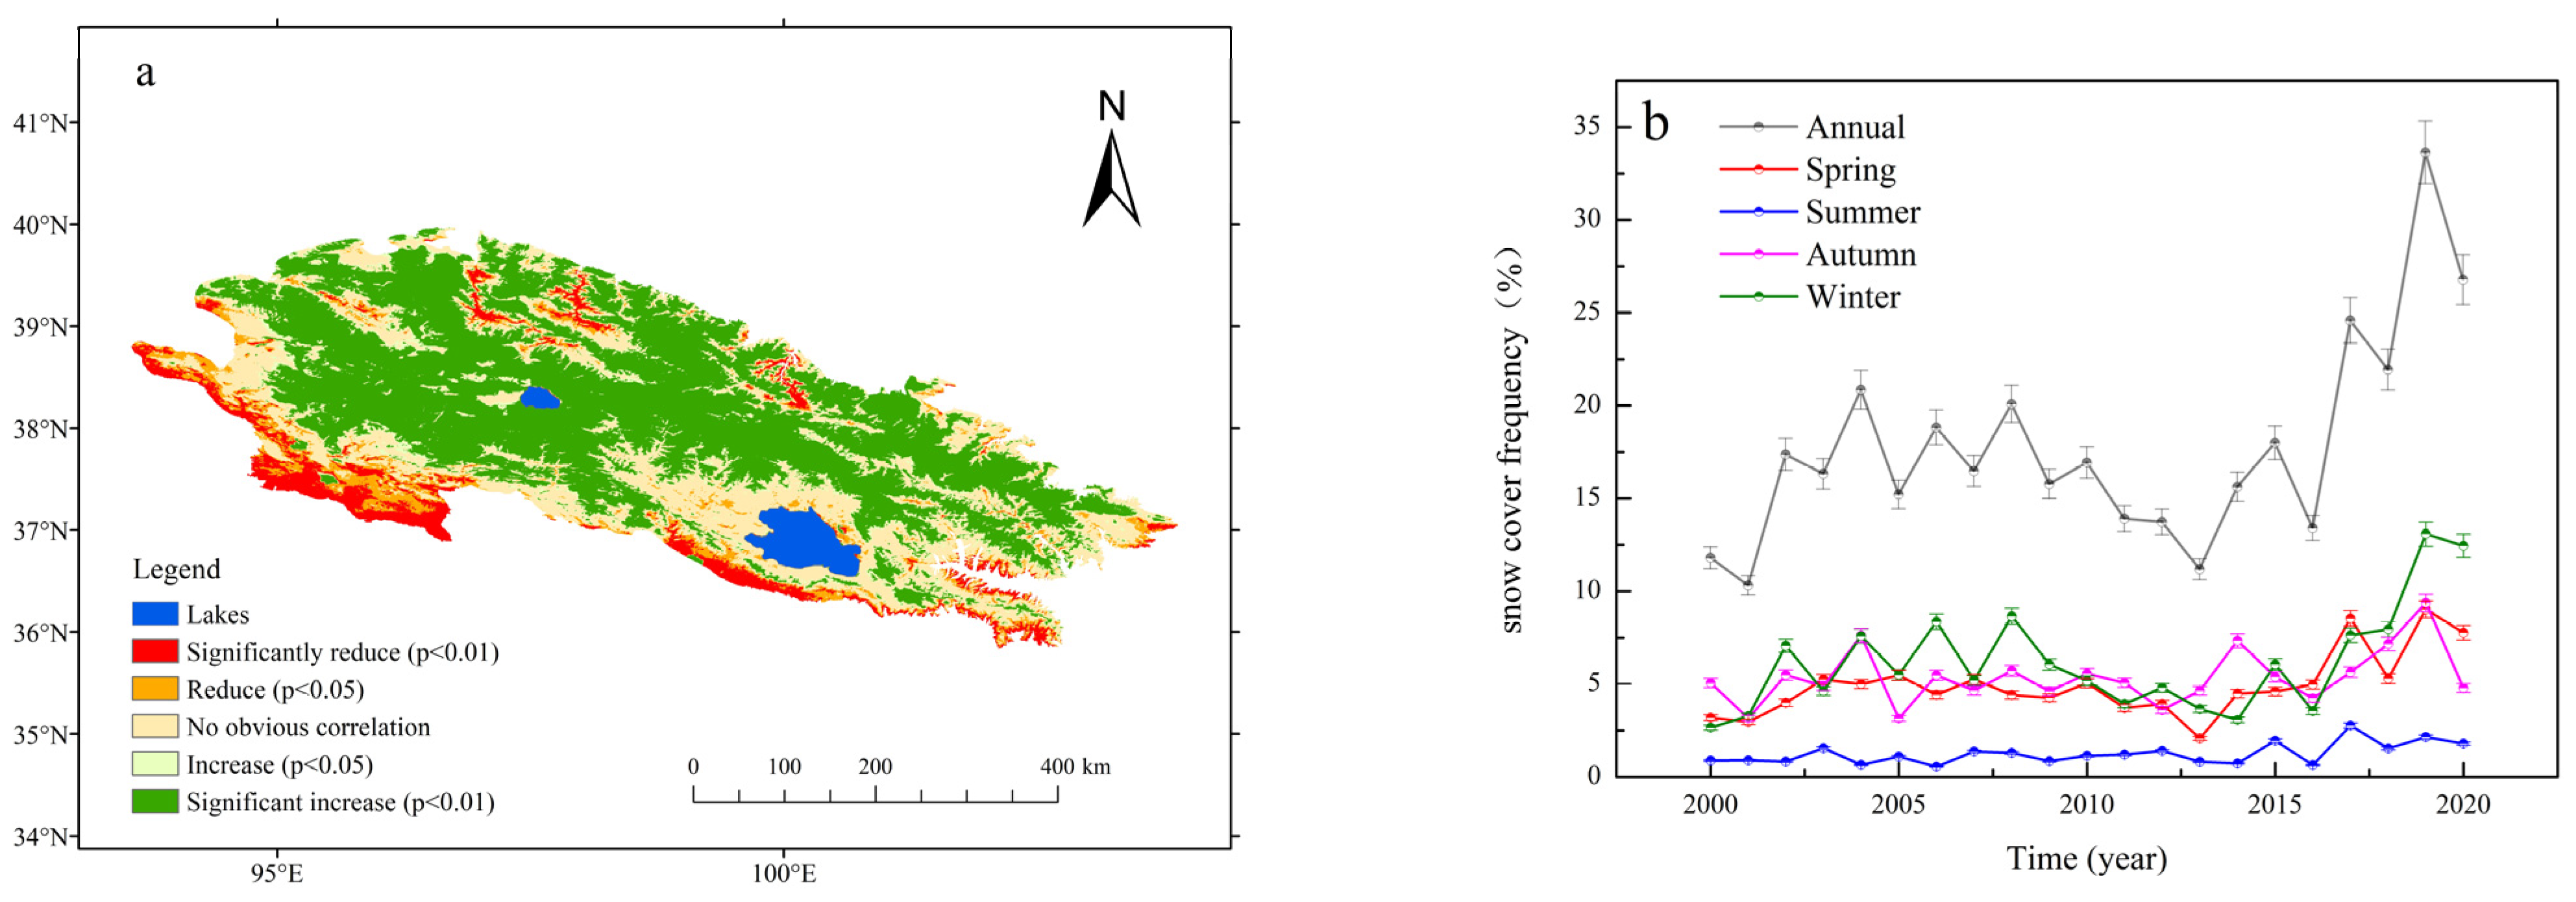
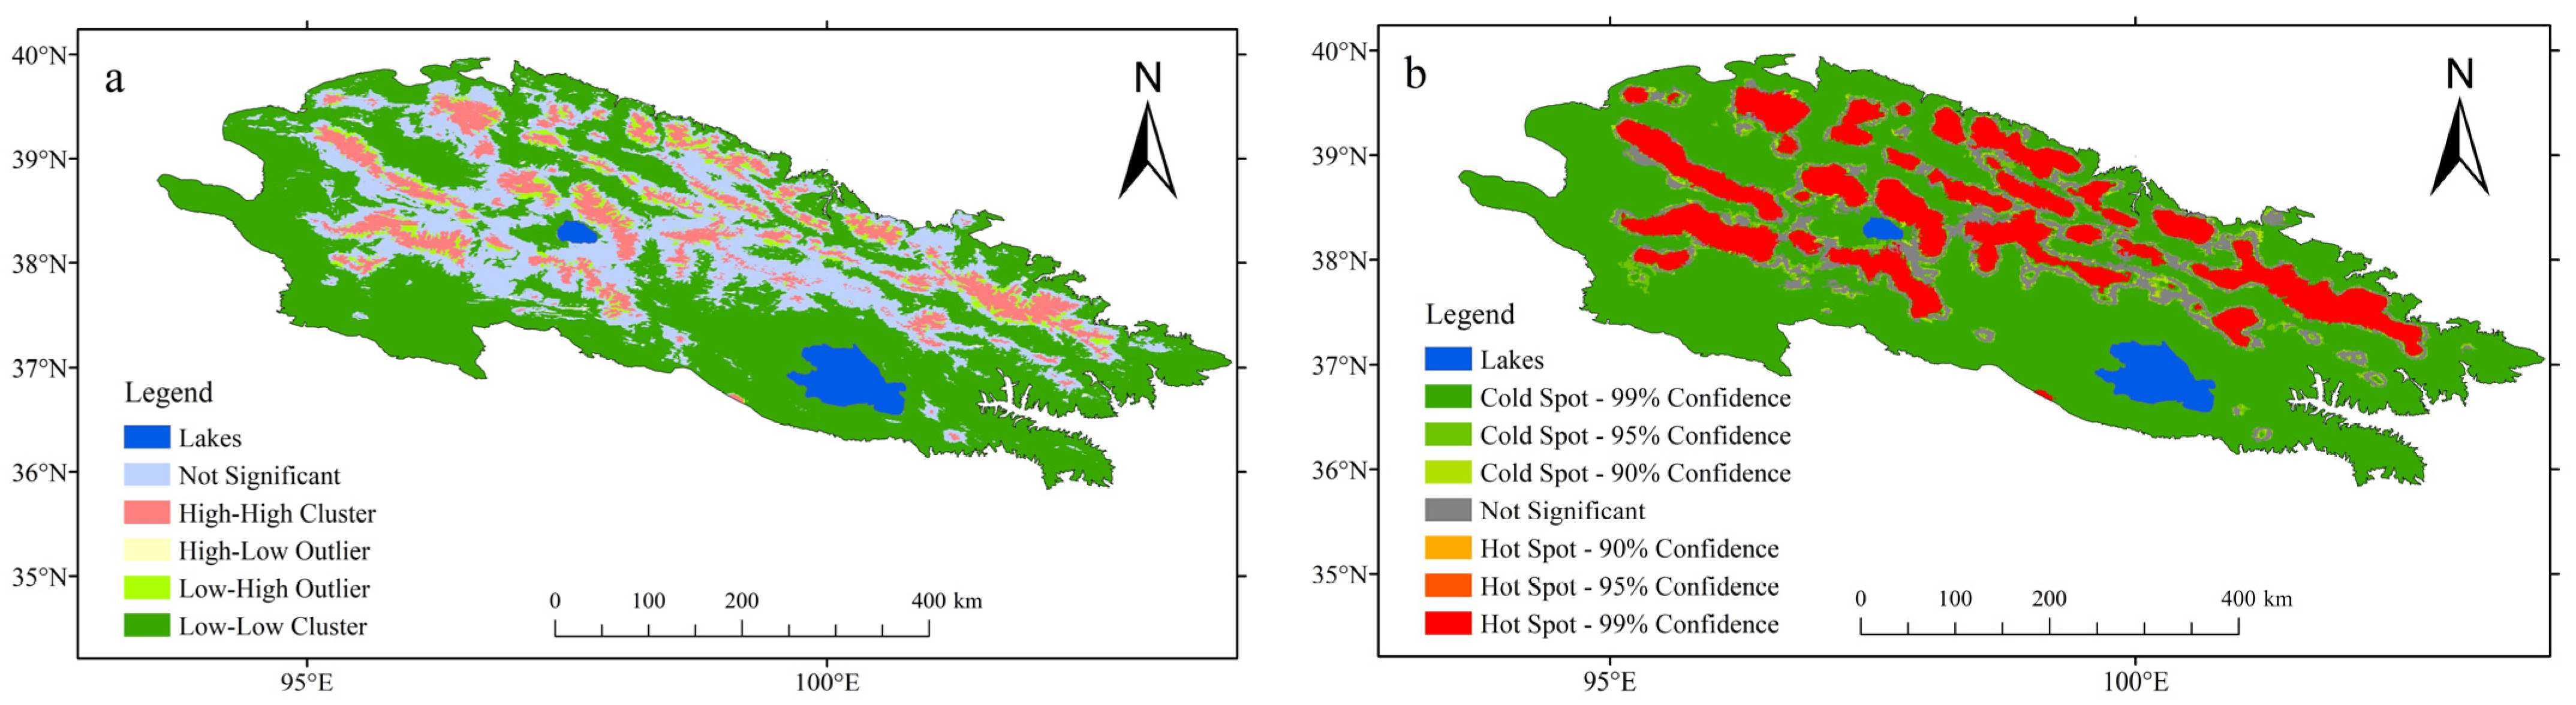
4.1. Spatiotemporal Pattern of SCF

The SCF in the Qilian Mountains during 2000–2020 was synthesized on the basis of the occurrence frequency of snow cover in each pixel (Figure 2). As shown in Figure 2, high SCF values were distributed in western Qilian Mountains in summer, while it mainly located in Yema Nsnshan, Danghe Nanshan, and Turgen Daban of western Qilian Mountains as well as Lenglongleng in eastern Qilian Mountains in winter. The SCF pattern in spring and autumn was similar to that over whole year. On annual scale, the highest SCF values in the Qilian Mountains from east to west are distributed mainly in Lenglongling, Corridor Nanshan, Daxue Shan, Tole Nanshan, Shule Nanshan, Yema Nanshan, Danghe Nanshan, and Turgen Daban Shan, i.e., in areas primarily (>80%) of high elevation and mostly on north-facing slopes (Figure 2a). It is consistent with observations of the greatest snow cover extent and largest snowfall amounts in high-elevation areas of the Qilian Mountains [22]. At high elevations, the snow onset date is earlier, the snow end date is later, and the snow cover duration is longer than at lower elevations [33], favoring maintenance of snow cover. In contrast, SCF is sporadic on high-elevation south-facing slopes. Intermediate SCF values are concentrated around the highest SCF values, most of which are mountain regions with SCF of 60–80%. Regions with lower SCF values of 40–60% are located mainly around areas with intermediate SCF values and the central Qilian Mountains, including Datong Shan and Tuolai Shan. Generally, the SCF values in western areas of the Qilian Mountains are larger than those in the east, reflecting the impact of both topography and atmospheric circulation. During autumn and winter, westerlies and the winter plateau monsoon prevail over the Qilian Mountains, which generate eastward transport over the western Qilian Mountains. Owing to the high elevation of the terrain, the airflow undergoes forced orographic ascent that results in cooling and snowfall. Consequently, because of water vapor exhaustion in relation to the foehn effect, there is less snowfall in the central Qilian Mountains. In the eastern Qilian Mountains, high pressure (i.e., the Lanzhou small high pressure area) can generate moist southeasterly winds that prevail over the southern slopes, facilitating snowfall [21].
Referencing method in Jiang’ paper [34], trend analysis was conducted. The annual ratio of SCF in the Qilian Mountains during 2000–2020 shows an overall upward trend, but there is significant heterogeneity in the spatial pattern (Figure 3). Areas in which SCF increased significantly (p < 0.05) accounted for 57.3% of the total area, and 5.8% of the total area was distributed at high elevation (significant at the 0.01 level). Meanwhile, 15.5% of the total area decreased significantly (p < 0.05), which included 8.8% of the total area (p < 0.01) in the border area of the Qilian Mountains, and in the valley regions of Shule Nanshan, Tuole Nanshan, Corridor Nanshan, and Yeniugou.

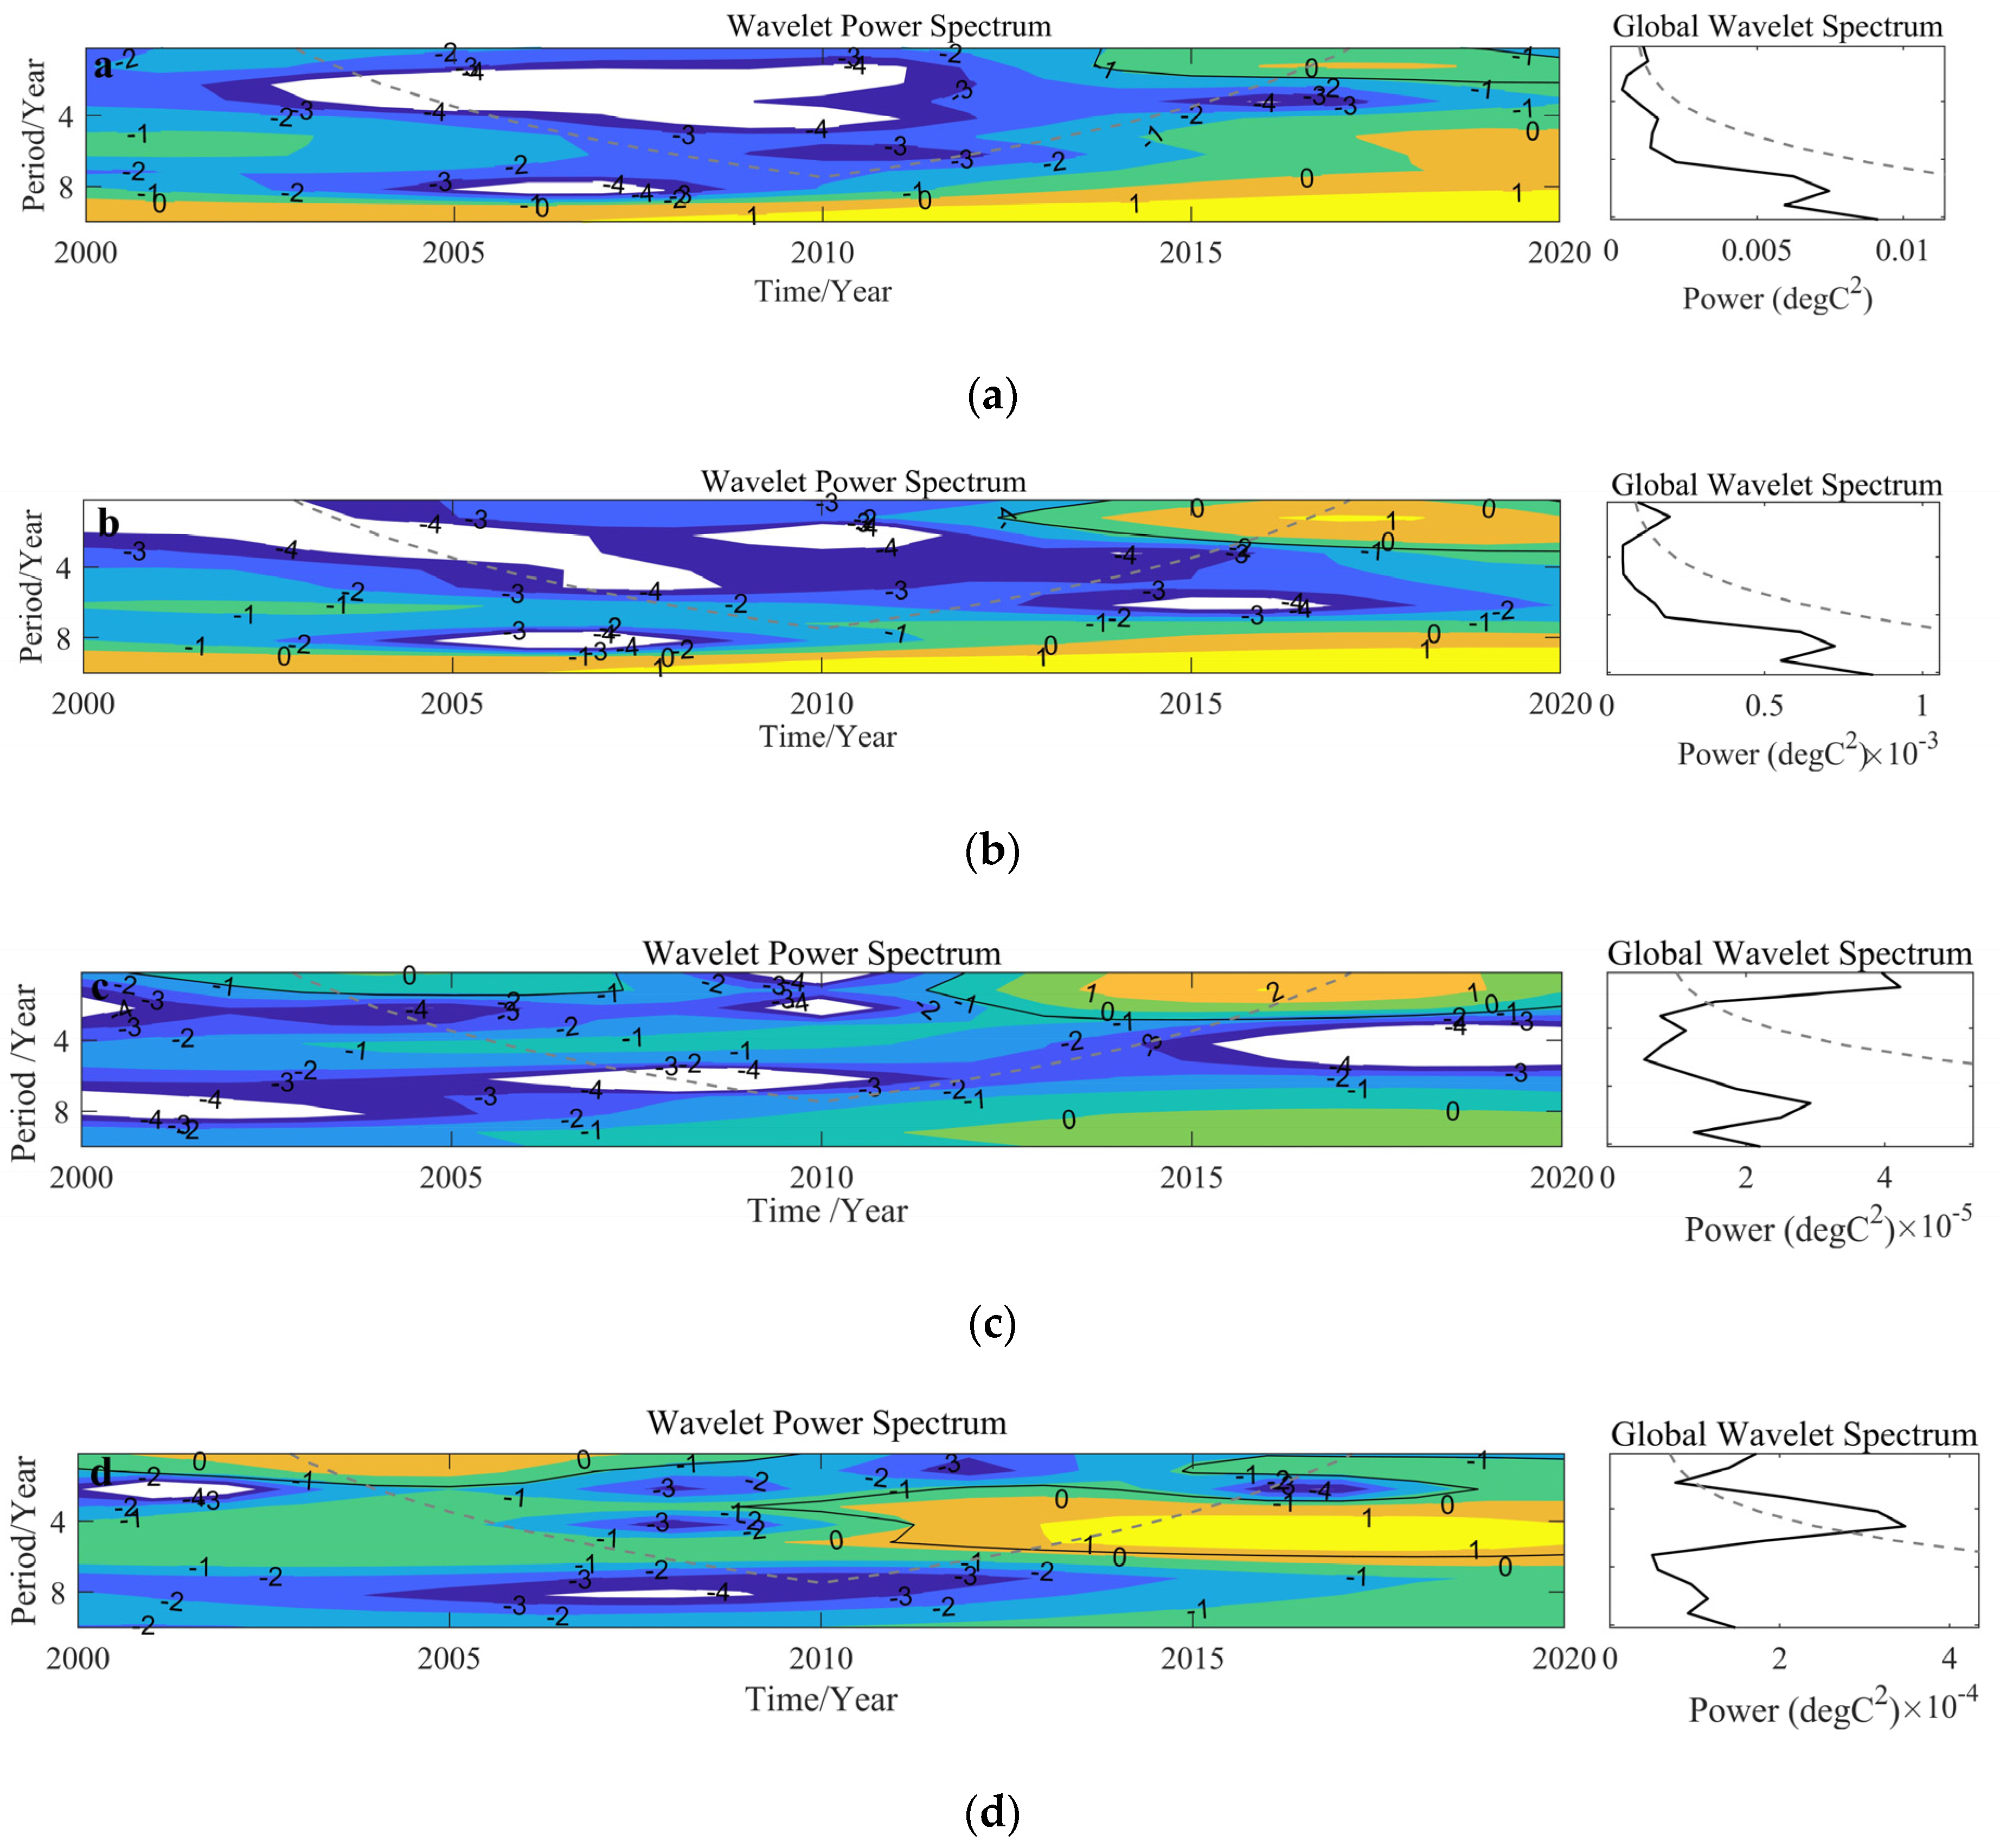
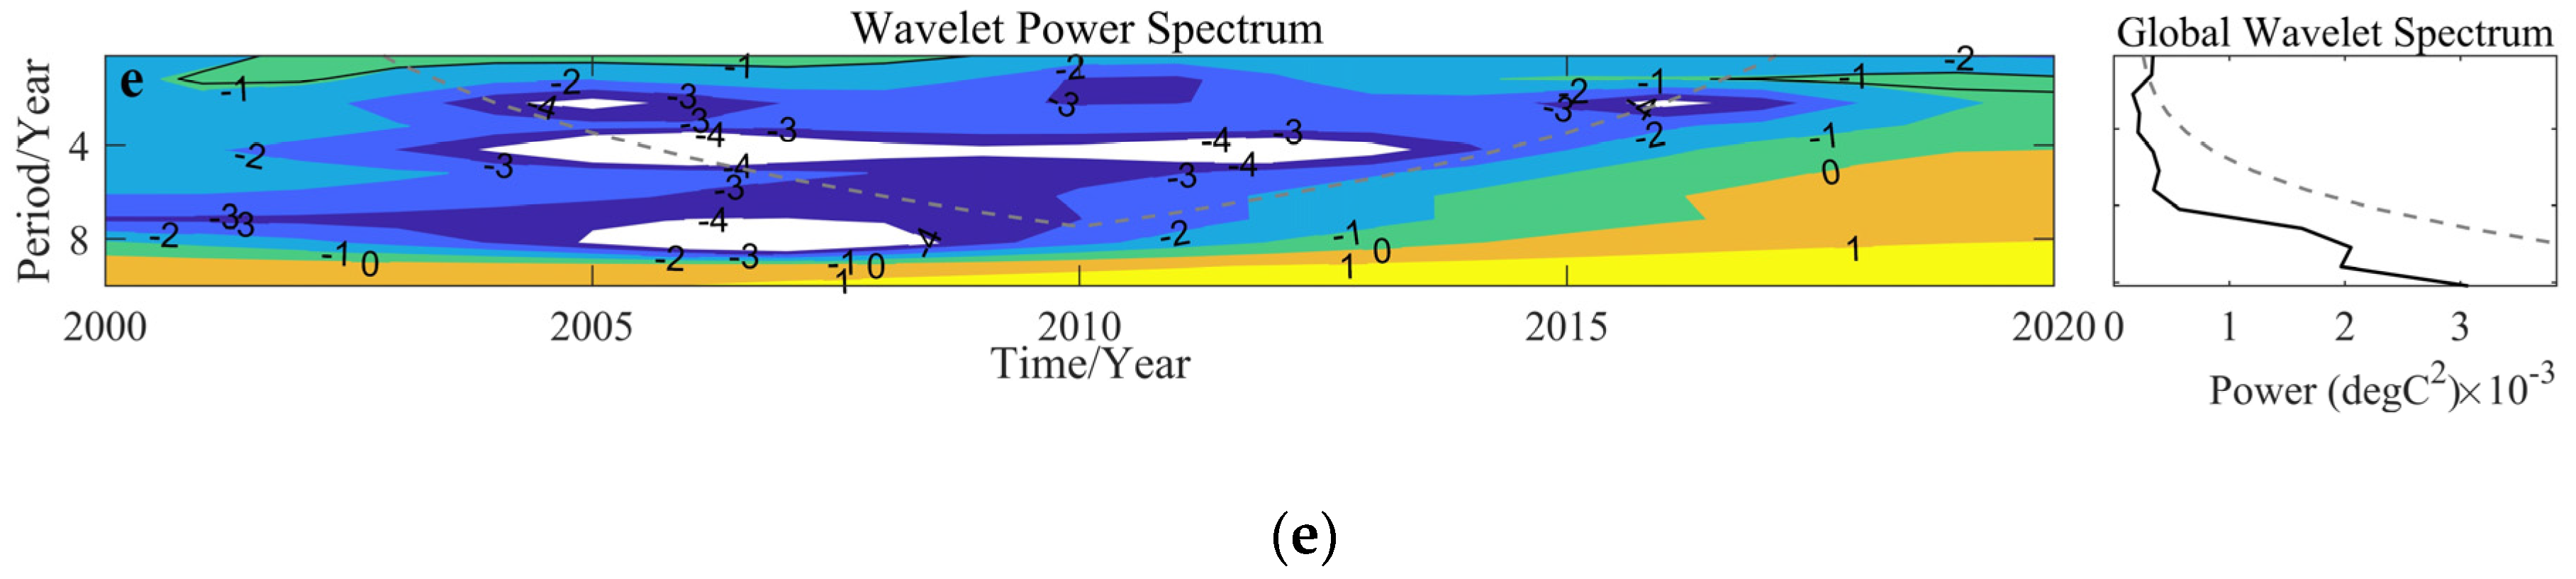
4.2. Abrupt Change, Oscillations, and Atmospheric Circulations Associated with SCF

Identification of abrupt change and oscillation in a time series is crucial to understanding the variation of change. In this study, such features in the SCF time series were detected using the Mann–Kendall test, power spectrum analysis, and wavelet spectrum analysis. No abrupt signal that passed the significance test was identified in SCF on the annual or seasonal scale (not shown), indicating that the observed variation largely reflected only fluctuation. In terms of oscillation, power spectrum analysis indicated a quasi-3-year period on annual and seasonal scales (not shown) that passed the significance test (p < 0.05). Similarly, wavelet spectrum analysis (Figure 4) indicated a common quasi-3-year period that passed the significance test on annual, spring, summer, autumn, and winter scales, which covered the periods (a) 2013–2020, (b) 2012–2020, (c) 2001–2007 and 2011–2020, (d) 2000–2010 and 2015–2020, and (e) 2001–2009 and 2017–2020, respectively. A quasi-5-year period that passed the significance test was found for autumn during 2009–2020, with a shift from shorter to longer periods; it also occurred on other seasonal scales but without passing the significance test. Additionally, a quasi-11-year period was also identified on all timescales but without passing the significance test.
Previous research on precipitation in Northwest China has shown that quasi-3-year, quasi-6-year, and quasi-11-year periods are typically associated with the classical bandwidth of the El Niño–Southern Oscillation, western Pacific subtropical high, solar activity, and Earth’s rotational velocity [3]. Because similar periods were found in the SCF time series in this study, SCF variation might also be influenced such factors. For example, the El Niño–Southern Oscillation has significant impact on snow cover in China through adjustment of the atmospheric circulation and quasi-static Rossby wave train [19,35]. Additionally, the location and intensity of the western Pacific subtropical high affect the transportation of water vapor over mainland China, which influences summer precipitation in eastern parts of Northwest China [36].

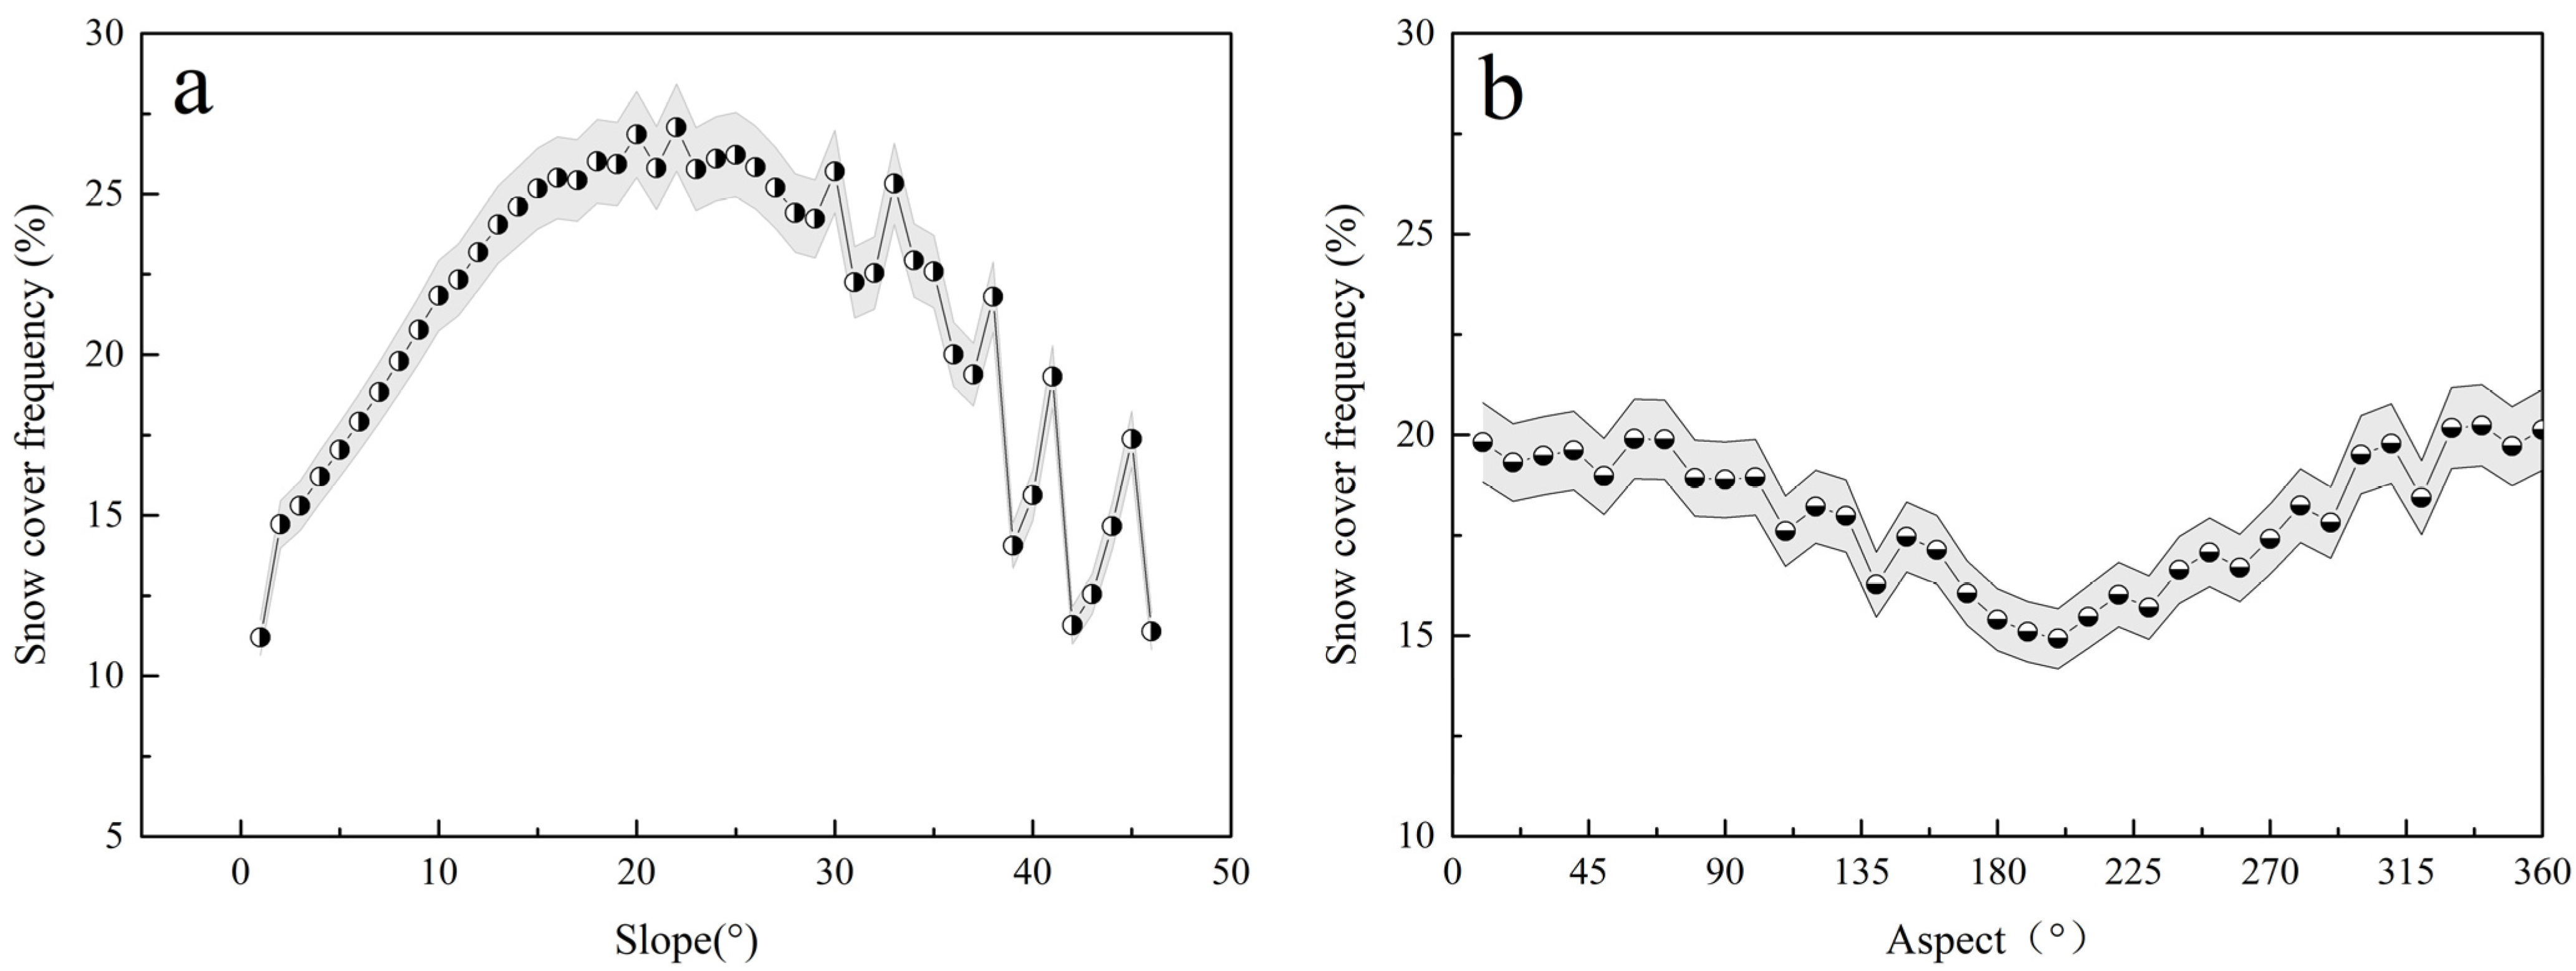
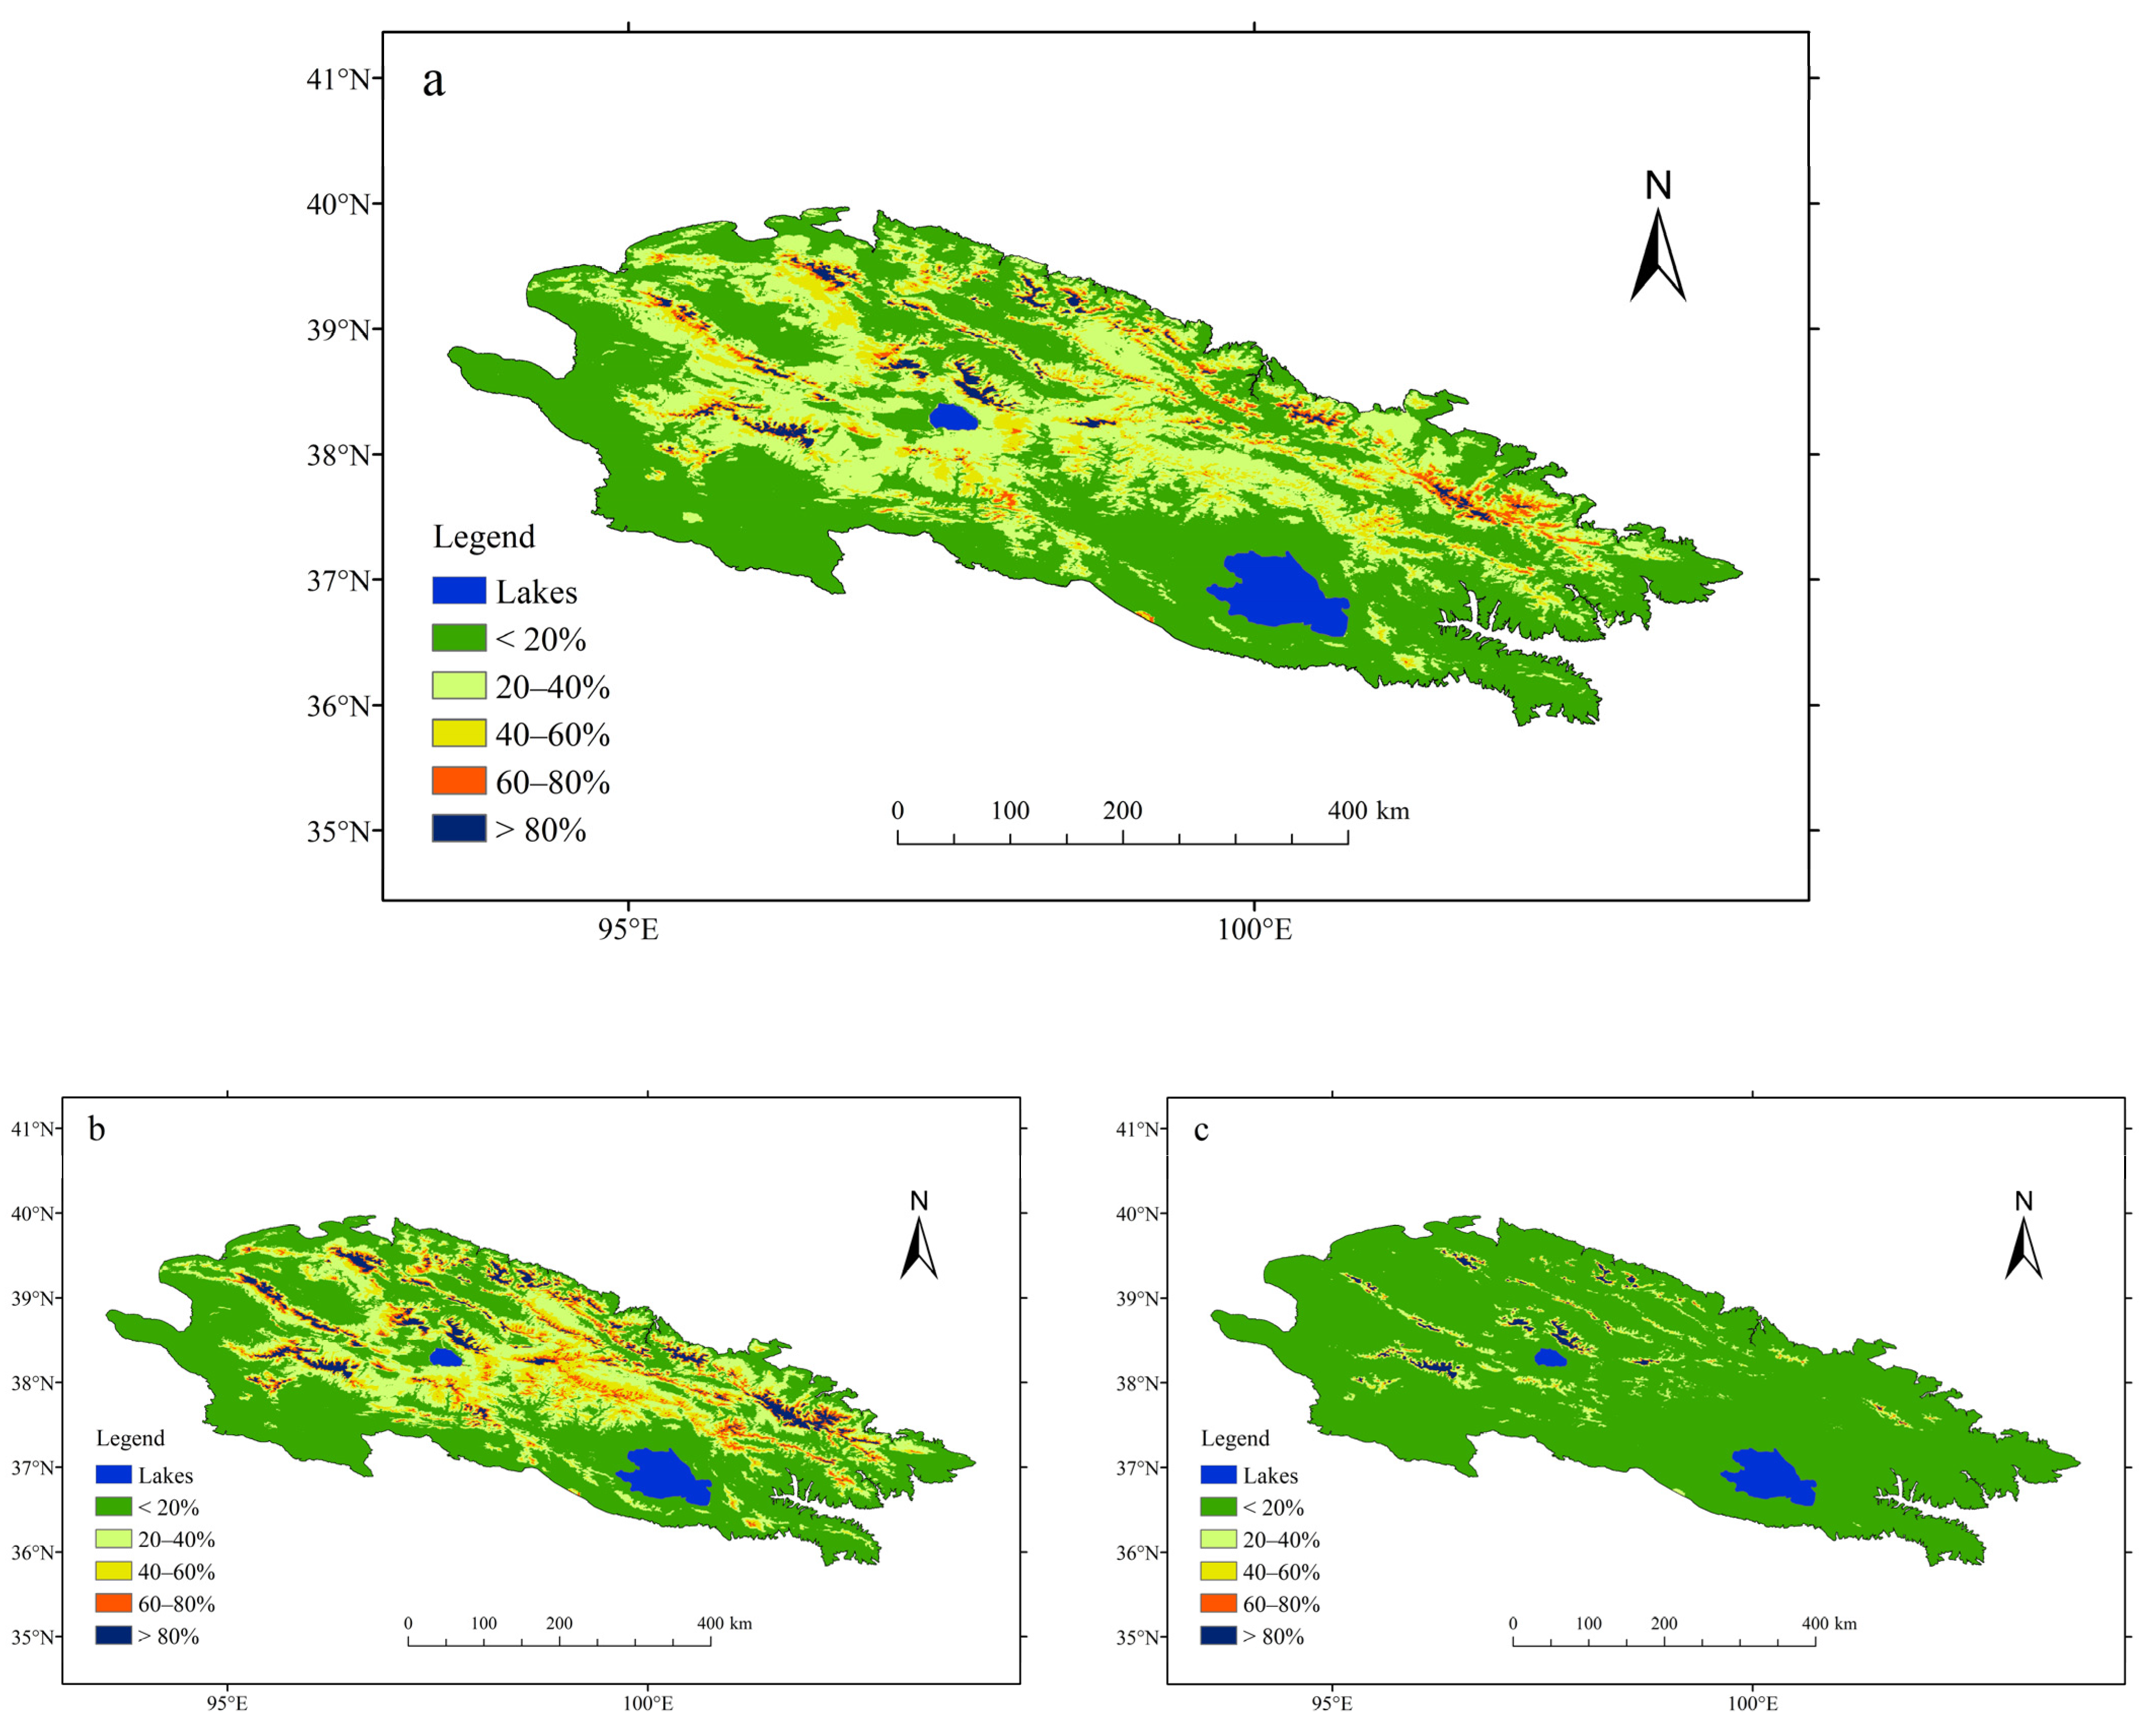
4.3. Influence of Topography on SCF

It should be expected that SCF in the Qilian Mountains would reflect a geographical response to climate warming, owing to the vast area and complex terrain of the region. In this study, the elevation, slope and aspect of the Qilian Mountains were extracted and the influence of each on the SCF was analyzed using digital elevation model data. As shown in Figure 5a, the relationship between SCF and slope in the Qilian Mountains has distinct variation. On an annual basis, it can be seen that SCF increased significantly (r = 0.964, p < 0.001) with a rise in slope from 0 to 23°, i.e., zero slope (0–5°), gentle slopes (6–15°), and ramps (16–25°). However, it decreased (r = 0.898, p < 0.001) for slopes from 23° to 45°, i.e., abrupt slopes (26–35°) and steep slopes (36–45°). Although some snow cover is retained on steeper slopes, its extent is typically decreased owing to the greater incline. For slopes >45° (i.e., dangerous steep slopes), correlation is less significant because of the scant snow cover.
The relationship between annual SCF and aspect was determined in relation to three different phases (Figure 5b). For aspect from 0° to 70° and from 310° to 360°, correlation was not obvious because north-facing shaded slopes are subject to two opposing actions regarding snow cover. Specifically, a shaded slope has little exposure to sunshine, which minimizes snow melting, and leeward slopes are less prone to receiving precipitation. For aspect between 70° and 200°, i.e., mostly south-facing sunny slopes, negative correlation was exacerbated with change in aspect from east to south and then to southwest, reflecting extended exposure to sunshine for accelerated melting, and in accordance with preferential orientation for reduced snowfall in precipitation [37]. For aspect between 200° and 310°, which represents transition from south-facing sunny slopes to north-facing shaded slopes, positive correlation was exacerbated with change in aspect from southwest to northwest, reflecting reduced exposure to sunshine that suppresses melting, and in accordance with preferential orientation for enhanced snowfall in precipitation [38]. Additionally, the amplitude of variation of SCF on northern slopes is more dramatic than that on southern slopes.

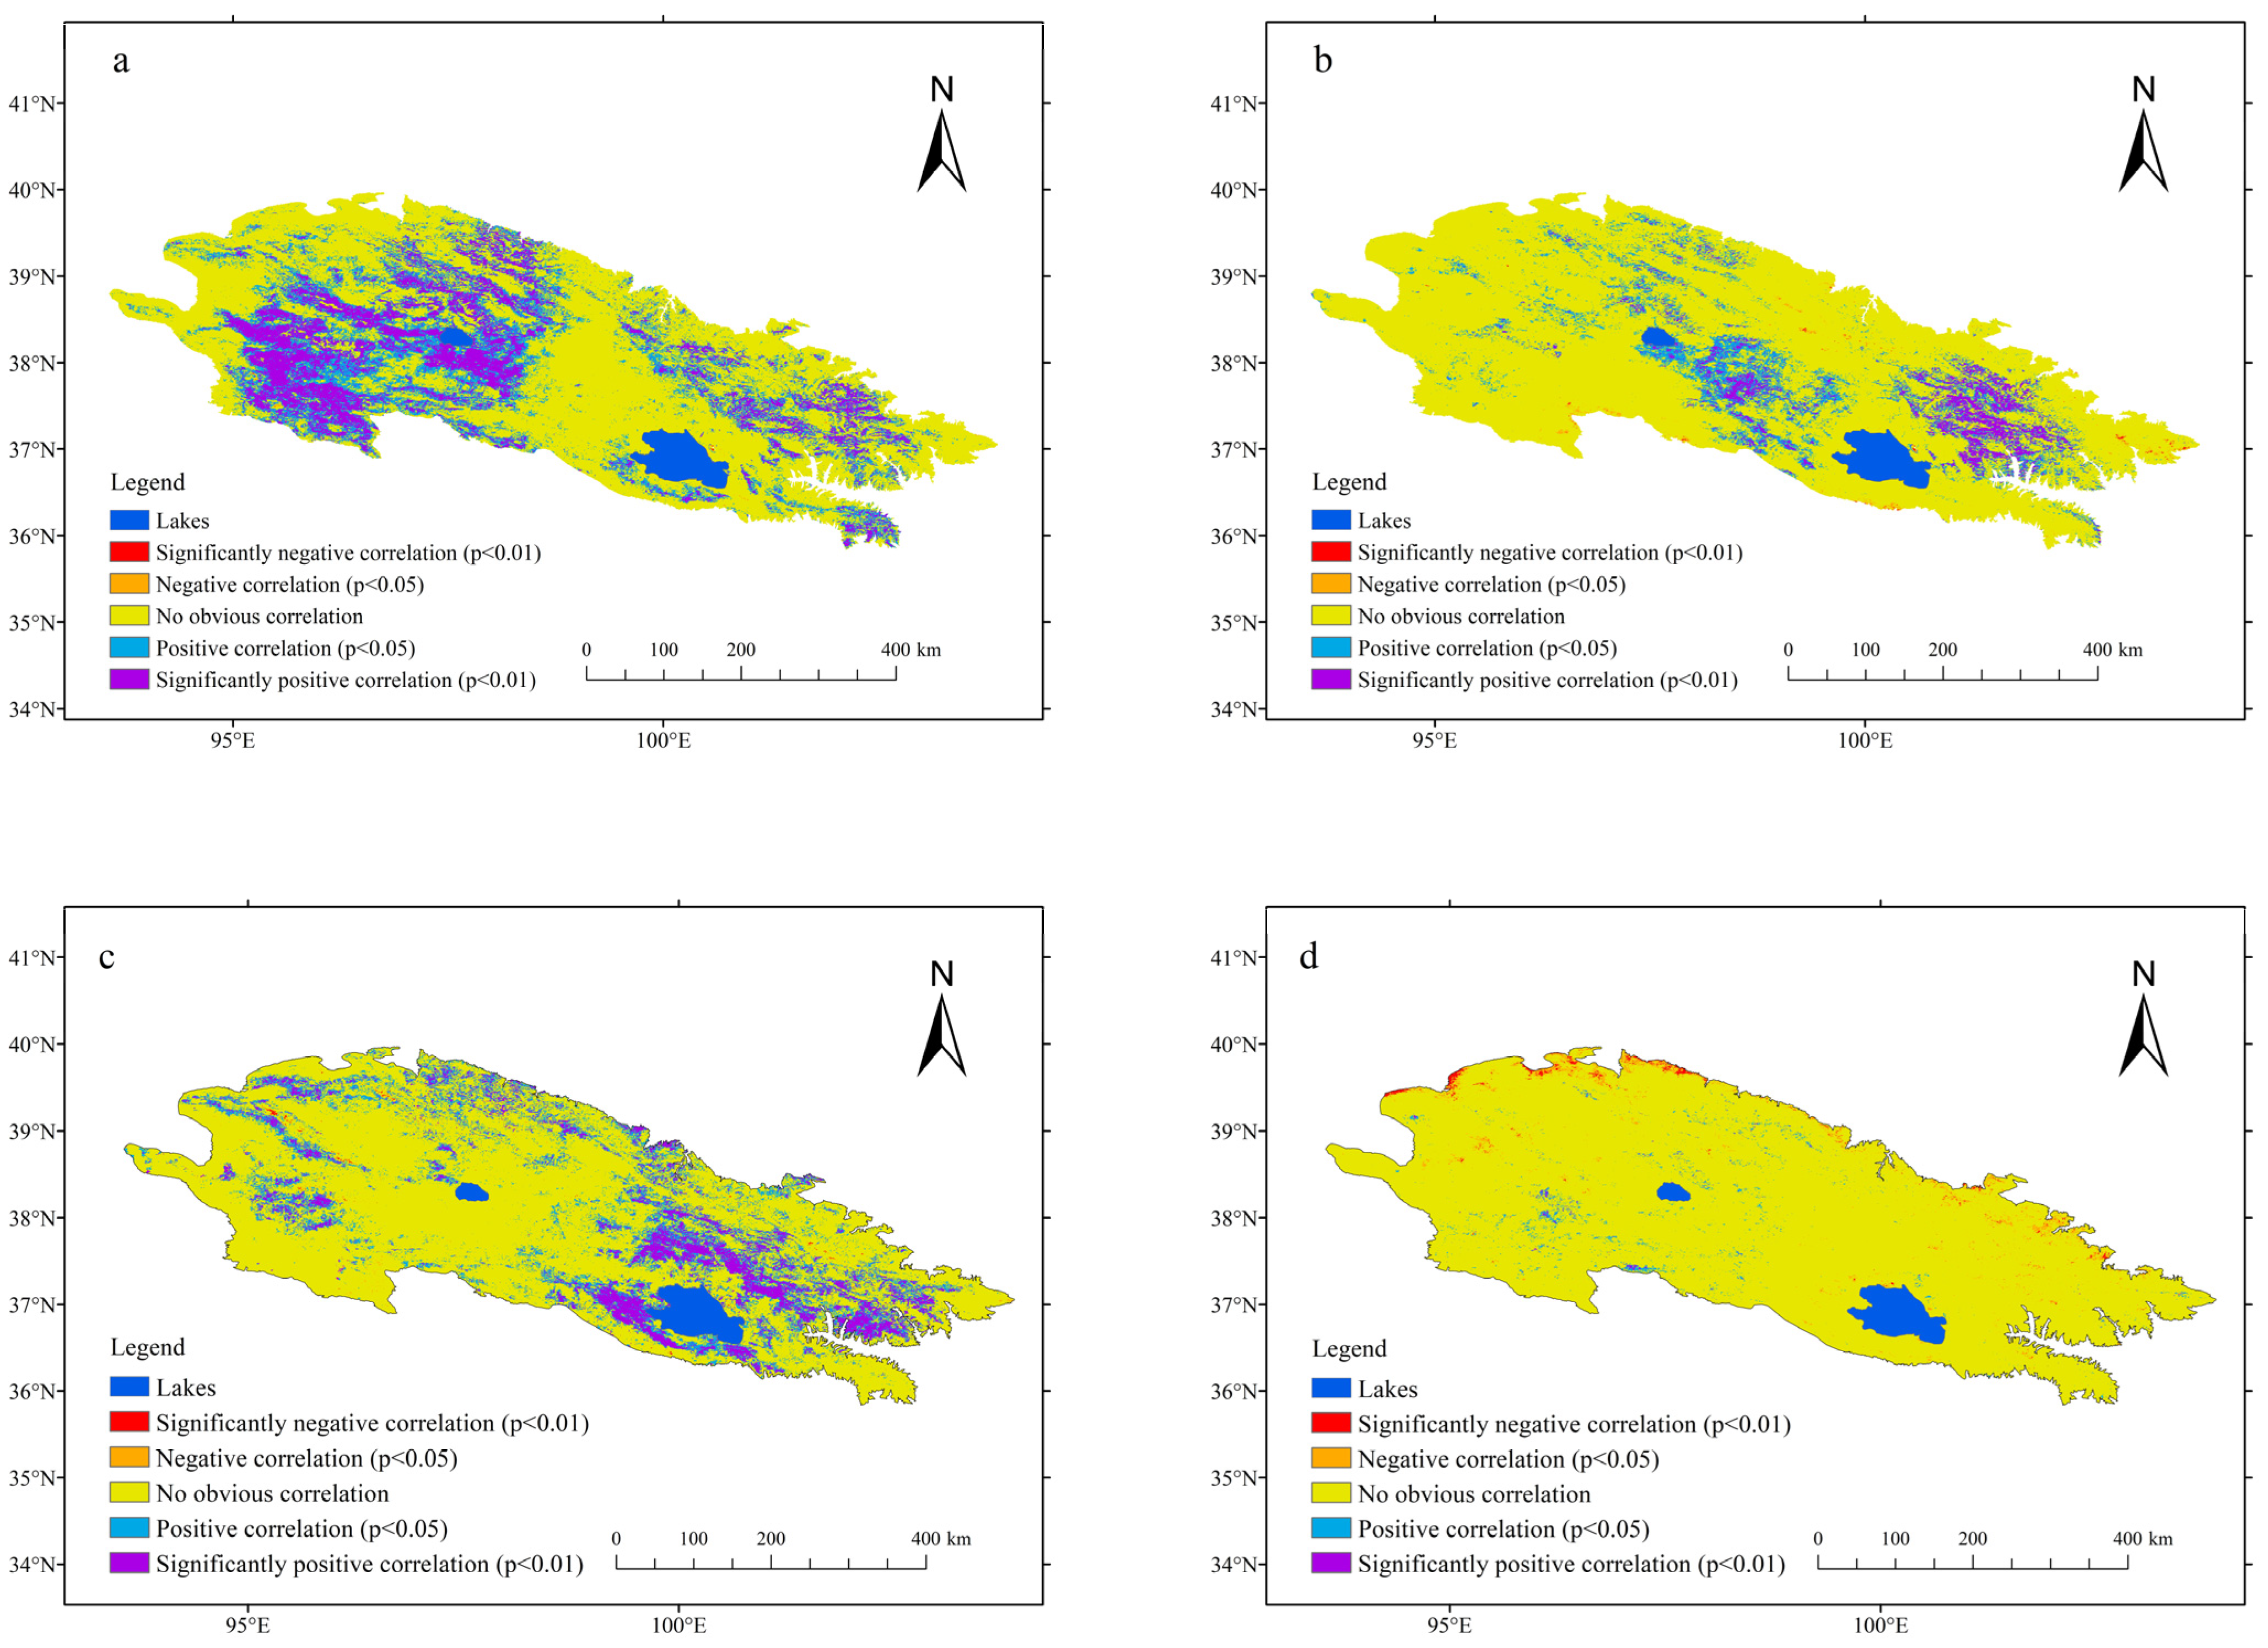
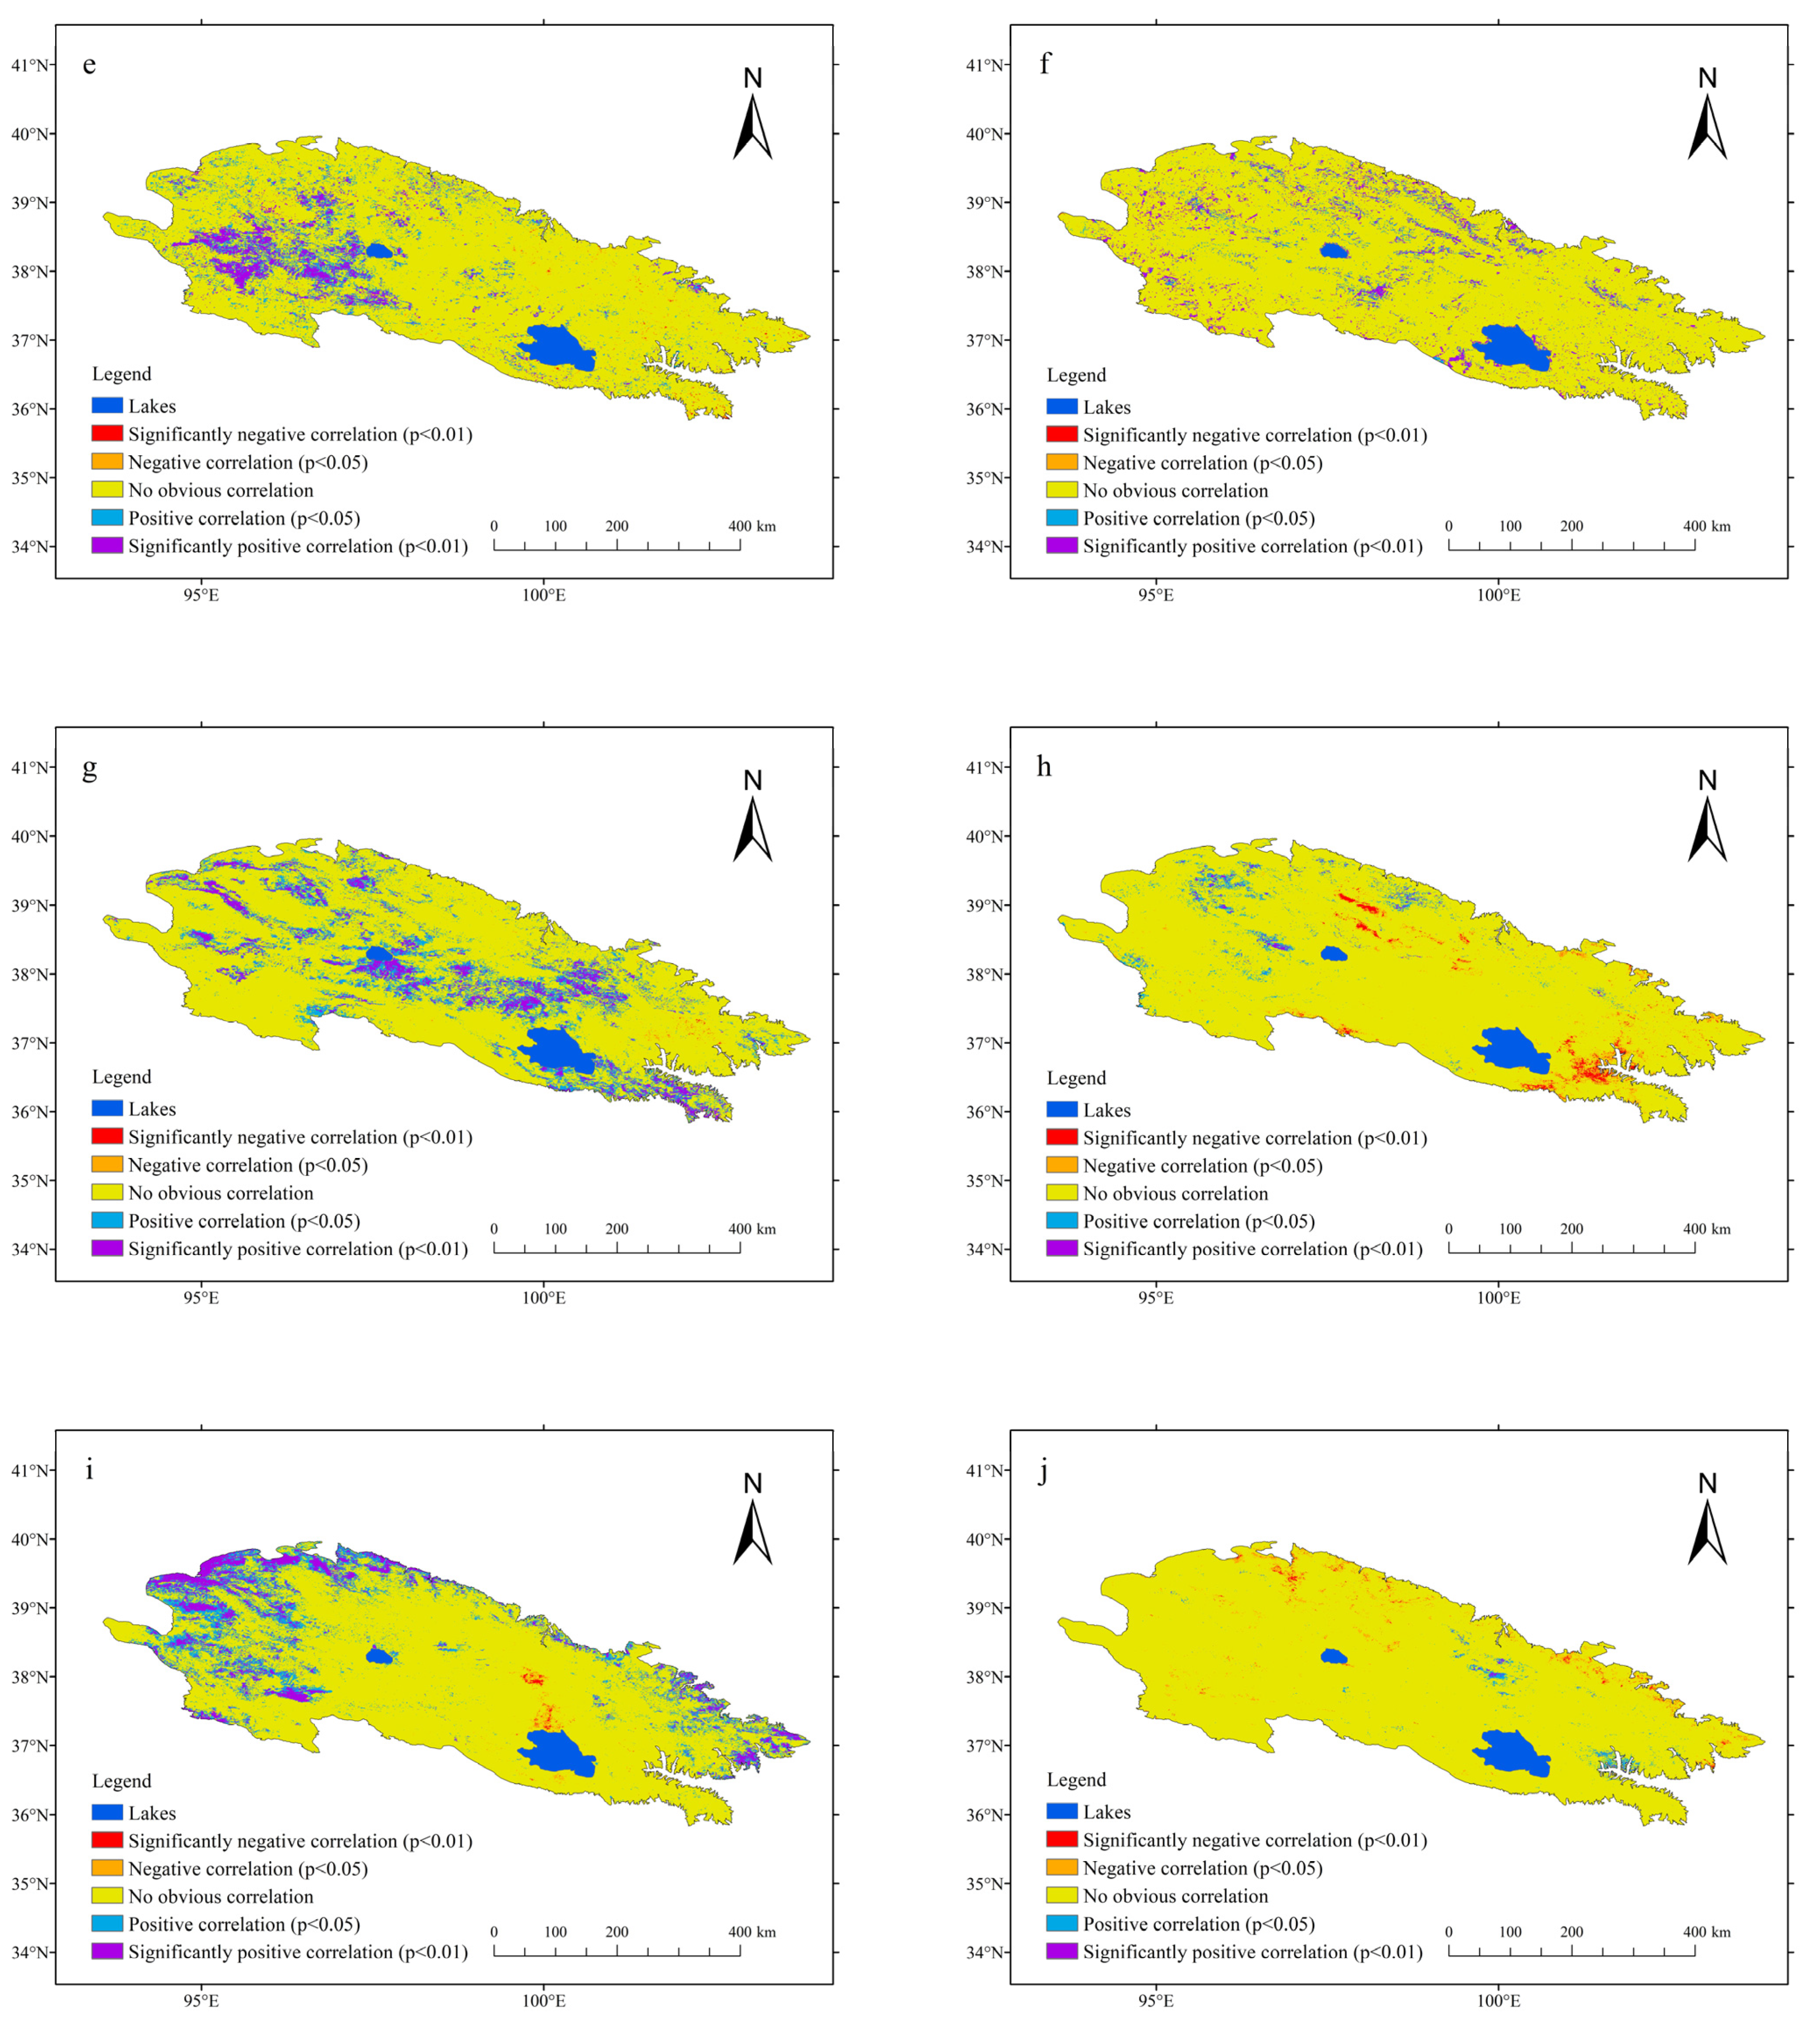
4.4. Influence of Air Temperature and Precipitation on SCF

Generally, SCF variations were positively correlated with precipitation amount by means of impact on incoming mass, but it was differently correlated with air temperature at the different season owing to influence of melting and precipitation amount/form through strengthening water cycle. Anselin Local Moran’s I and Getis-Ord Gi* in autocorrelation analysis were conducted on average SCF during 2000–2020 [39]. As shown in Figure 6a, High–High clusters were mainly distributed in regions with higher SCF of 60%, accounting for 6.35% of the total area. While Low–Low clusters were mainly distributed in regions with lower SCF of 20%, accounting for 49.27% of the total area. No obvious clusters were distributed in regions with SCF from 20% to 60%, accounting for 8.91% of the total area. As shown in Figure 6b, the hot spot (passing the 99% confidence test) was mainly distributed in the High–High cluster regions, accounting for 8.21% of the total area, while the cold spot (passing the 99% confidence test) was mainly distributed in region with the lower SCFs of 20%, accounting for 52.31% of the total area. The significantly positive correlation (p < 0.05) with precipitation amount was distributed over the east part, west part, and north border of central part in spring (Figure 7a, 23.48% of total area in Qilian Mountains), west part in summer (Figure 7c, 13.55%), west part, central part and southeast region of east part in autumn (Figure 7e, 19.31%), as well as the border of west and east part, and southeast region of east part in winter (Figure 7g, 18.38%), respectively. In addition, the correlation between SCF variations and air temperature was significantly negative over sporadic region of east and west part, north border in spring (Figure 7b, 2.45%), west part in autumn (Figure 7f, 3.81%), and north border of west and east part in winter (Figure 7h, 2.4%) but was significantly positive over west region of central part in spring (Figure 7b, 1.31%), west and east part especially in north border in summer (Figure 7d, 8.67%), southeast region of east part and north region of central part in autumn (Figure 7f, 3.05%).
On the annual scale, this study found that the variation of SCF in the Qilian Mountains during 2000–2020 was determined primarily by precipitation rather than by temperature, consistent with Qin et al. [40]. Specifically, positive correlation between SCF and precipitation amount was detected (Figure 7i). Areas with significant positive correlation (p < 0.05) accounted for 16.8% of the total area, of which 7.3% of the total area (at the 0.01 level) represents major snow cover areas distributed mainly in the high mountains of the western Qilian Mountains, and the Lenglongling and Datong mountains in the east of the Qilian Mountains. Areas with negative correlation accounted for only 0.04% of the total area. However, approximately 80% of the total area showed no obvious correlation, which might reflect the sporadic seasonal snow cover at low elevations and increasing amounts of precipitation in the form of rain. Correlation between annual SCF and air temperature (Figure 7j) was found not significant in most areas, except for some areas in the eastern Qilian Mountains, which might be ascribed to the sporadic distribution of seasonal snow cover at low elevations. The area with negative correlation accounted for only 0.2% of the total area, whereas areas with significant positive correlation accounted for 6.8% (p < 0.05), of which 2.2% of total area (at the 0.01 level) was distributed mainly in the Lenglongling and Menyuan areas of the eastern Qilian Mountains, eastern parts of Datong Hezong, and northern parts of Wulong Mountain. Nevertheless, the sparse distribution of meteorological observations at high elevations must be supplemented to improve meteorological description using reanalysis data and to promote deeper understanding.

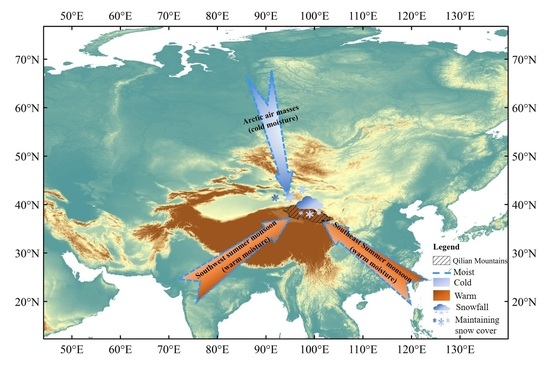
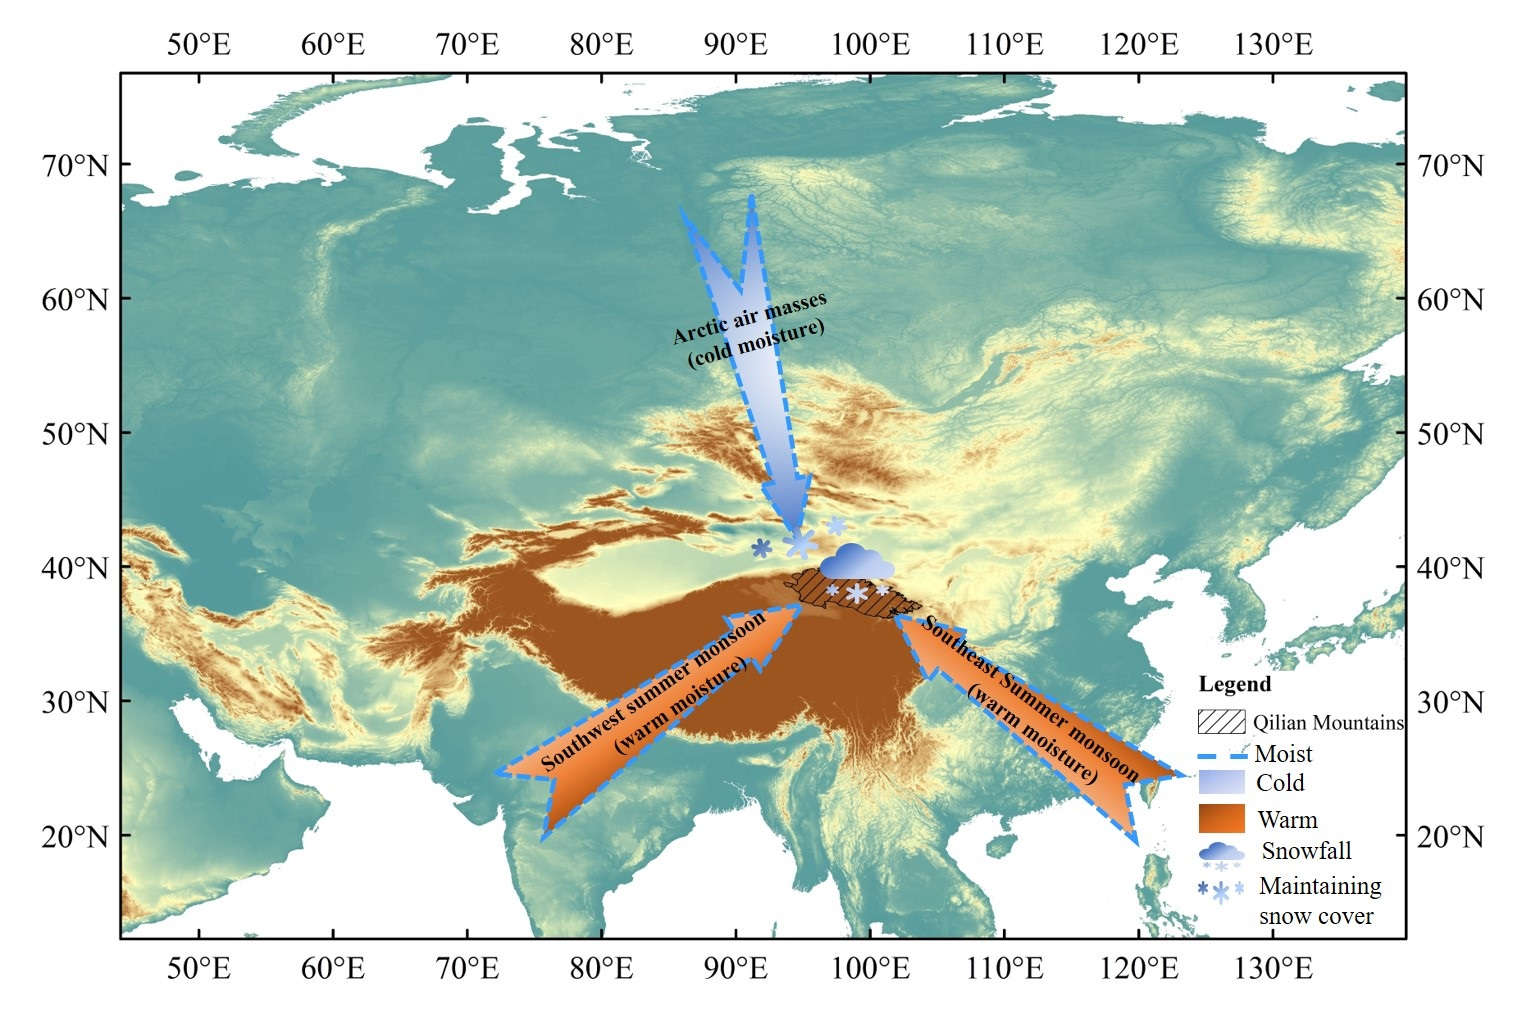
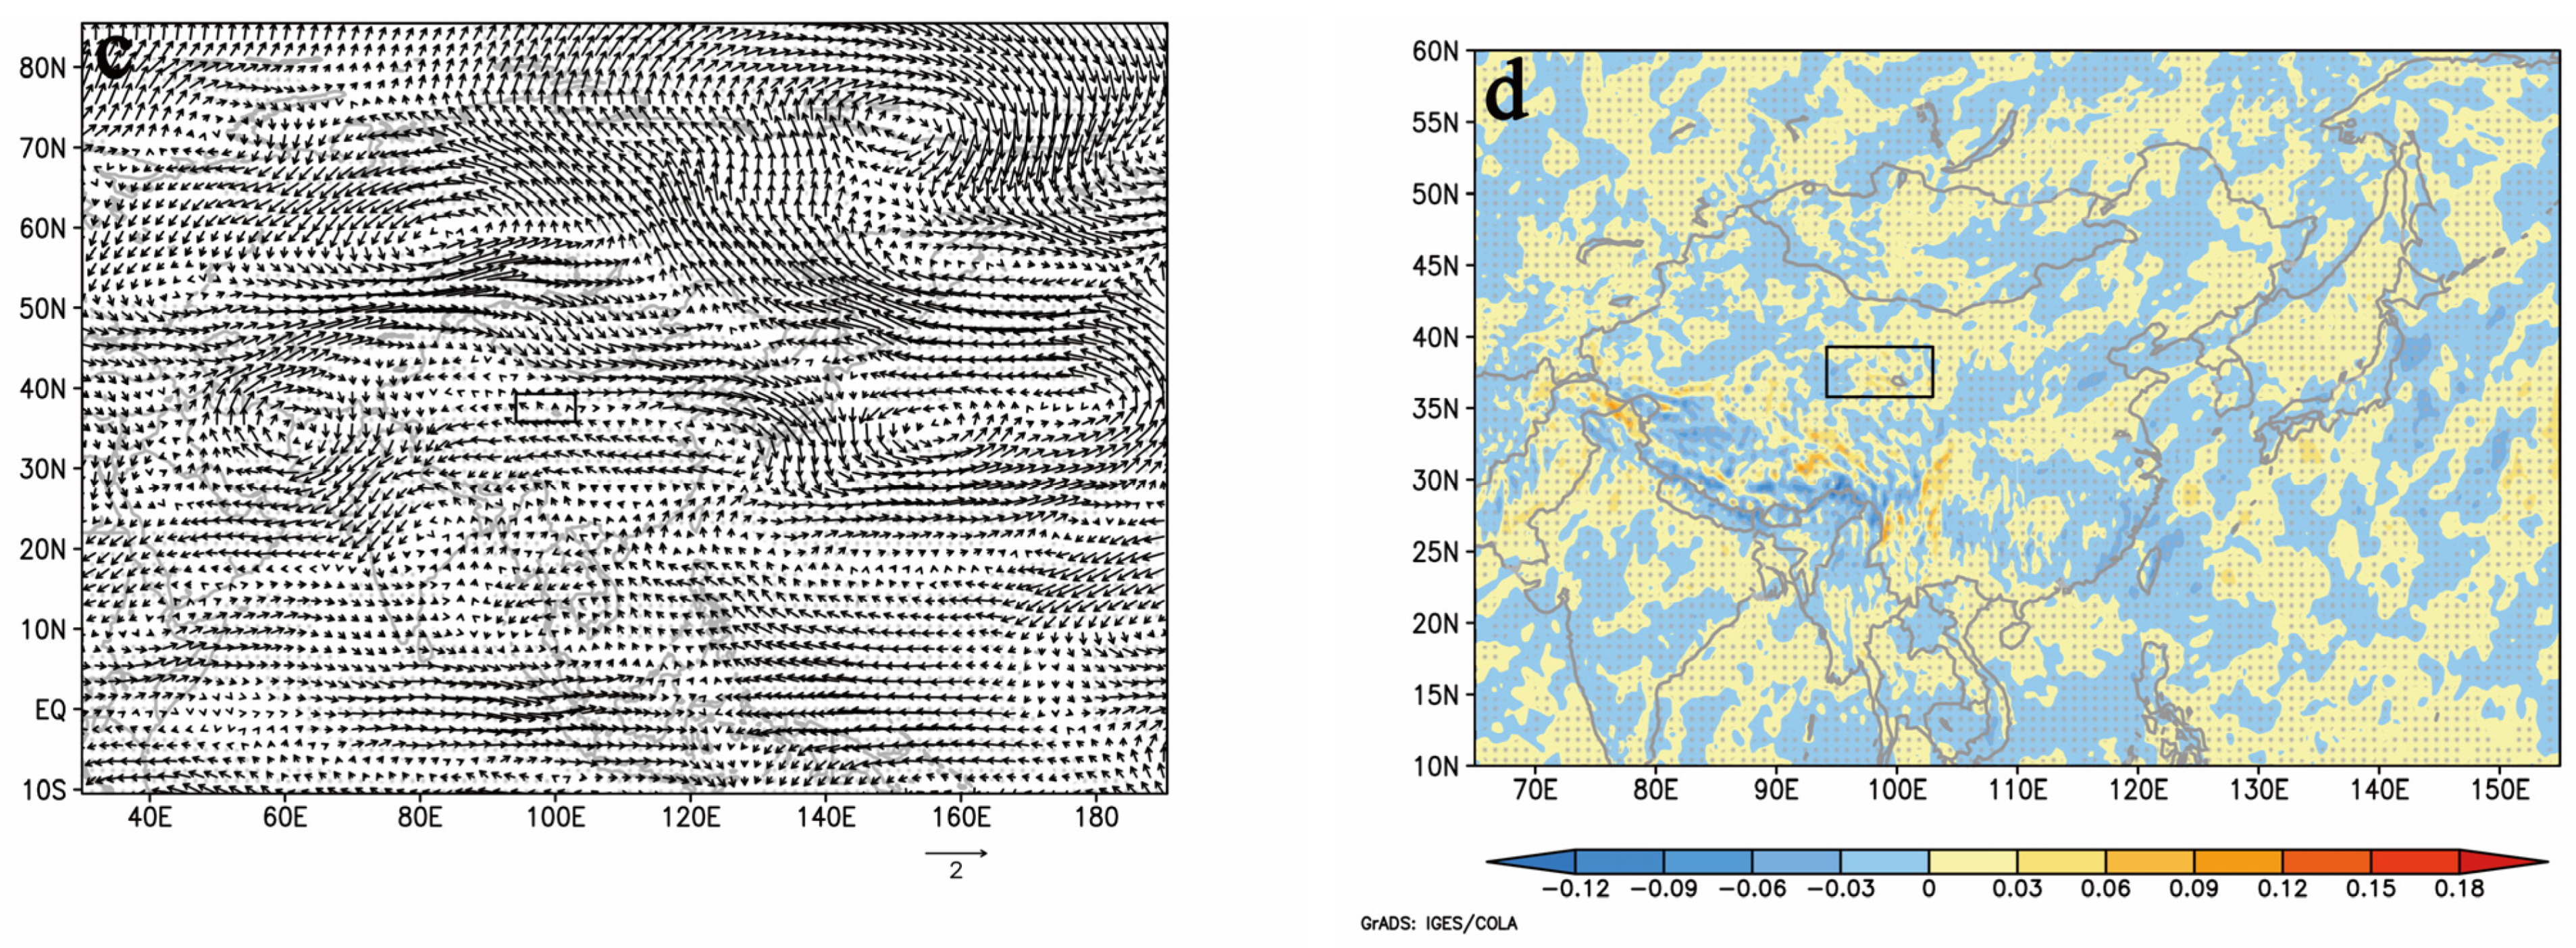
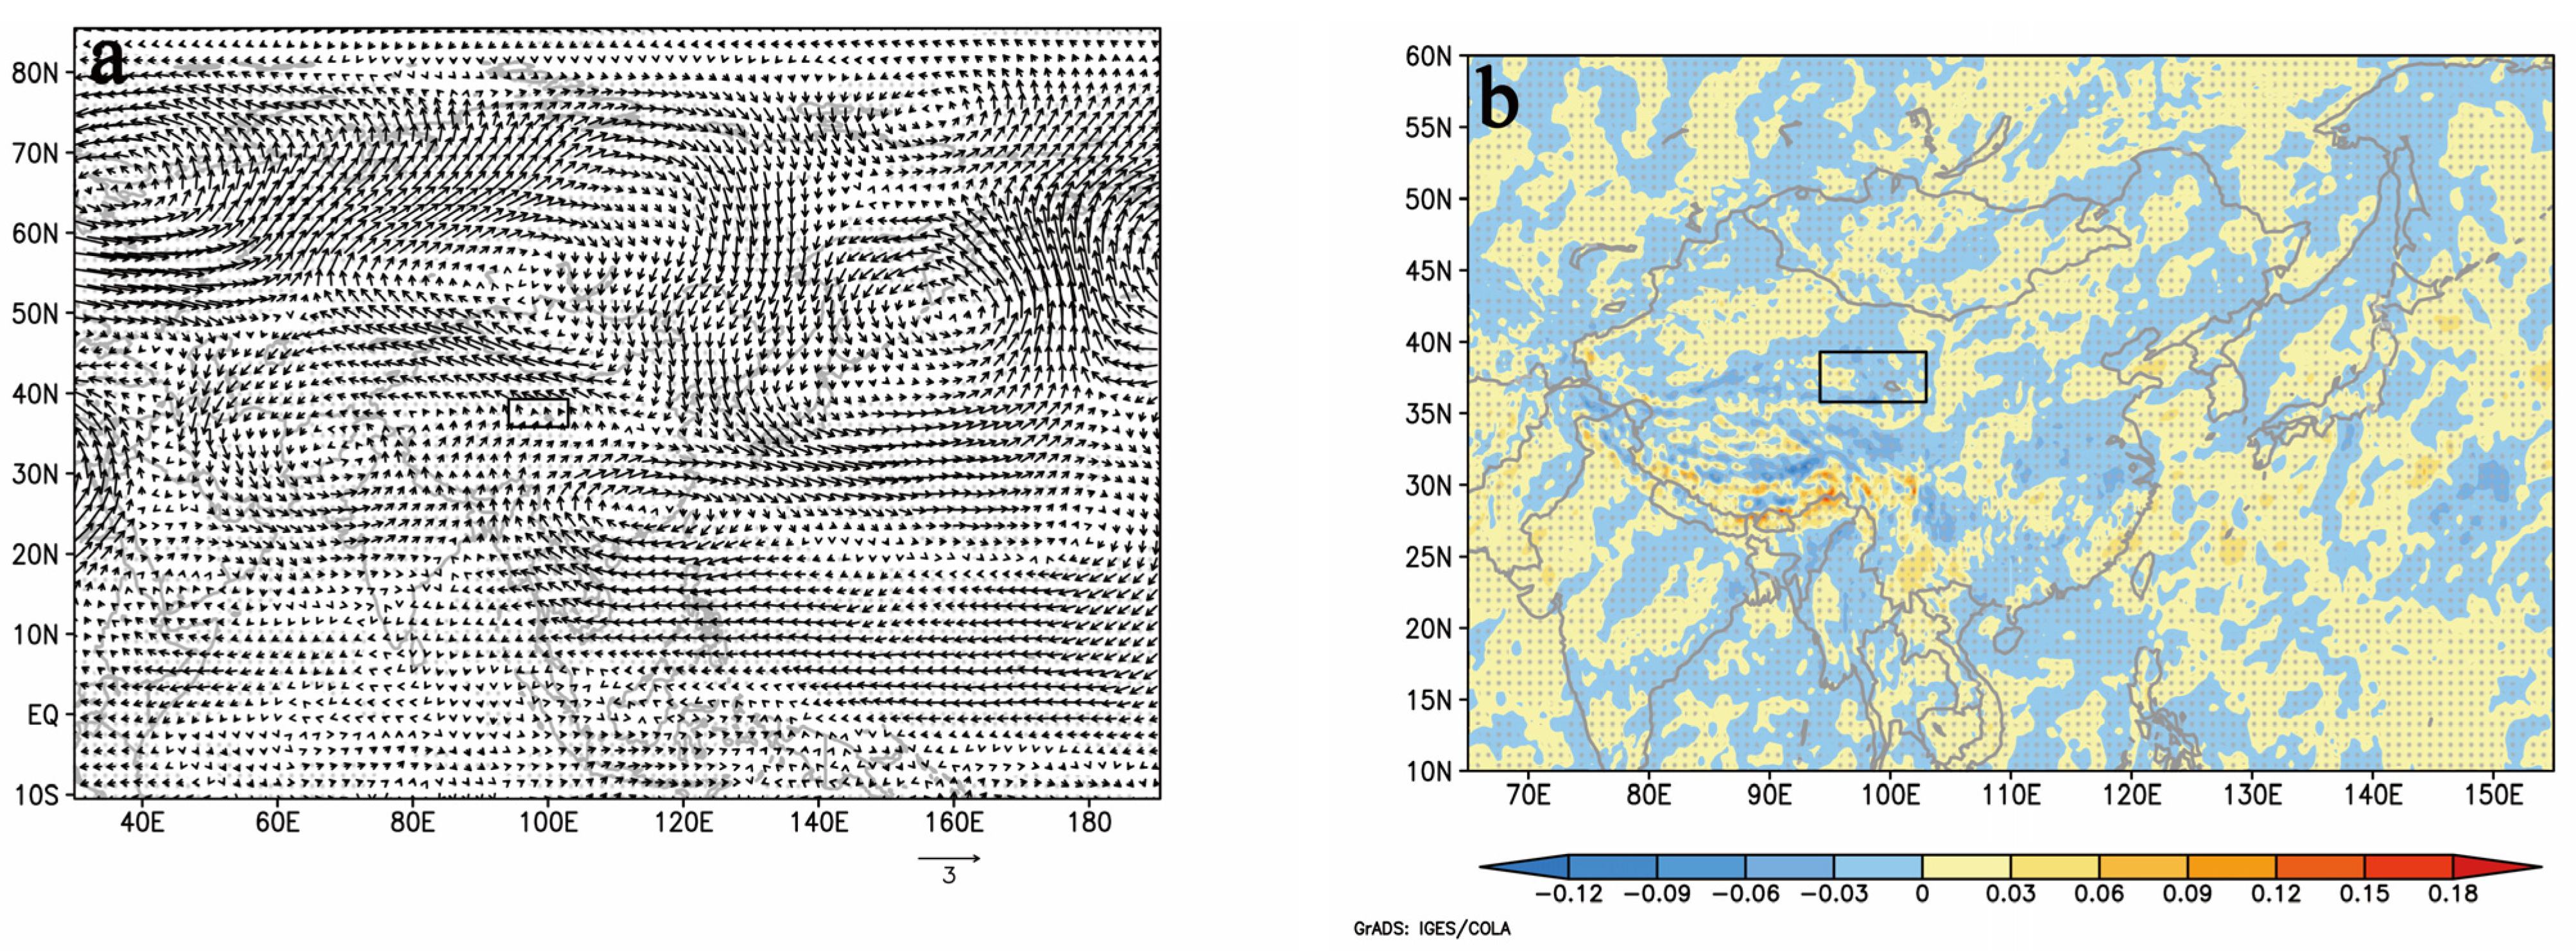
4.5. Atmospheric Circulation Mechanisms of Years with High/Low SCFs

Variability in atmospheric circulation patterns or teleconnections cause regional variation in SCF by altering meteorological parameters such as temperature and precipitation, and modifying the dynamic and thermal effects of the atmosphere [41]. However, the effects of circulation patterns are too complex to be explained by a single climatic atmospheric circulation; rather, the circulation patterns interact and jointly influence SCF variation [3]. In this study, years with high/low variation were determined on the basis of whether the annual SCF was high/low than the sum/difference between the mean state and one standard deviation during 2000–2020. Analysis identified 2017, 2019, and 2020 as the years with high SCFs; 2000, 2001, and 2013 were identified as the years with low SCFs. We calculated annual and seasonal 500 hPa anomalies of geopotential height, wind, atmospheric temperature, water vapor flux, and divergence, through comparison with their mean values during 2000–2020, to investigate potential driving atmospheric circulation mechanisms.
In the years with high SCFs (Figure 8a,b), anticyclones with positive geopotential height anomalies were evident at 500 hPa over the Lake Baikal and southeastern China, reflecting the blocking high over the Lake Baikal was much stronger than the mean state, which enhances cold advection downstream and pushes cold air outbreaks into the mid-latitudes [42,43]. Moreover, cyclones with negative geopotential height anomalies were over the Barents–Kara seas, and the Okhotsk Sea, meaning that cold air might be transported out of the Arctic region. Thus, cold air carried by the north winds associated with the anticyclone over Lake Baikal moved southward to Qilian Mountains. Meanwhile, southwesterly winds associated with the cyclone over the Iranian Plateau merged with the southeasterly winds associated with the anticyclone over southeastern China, resulting in the warm air moving to Qilian Mountains. Thus, the cold and warm air intersection to conducive to snowfall over the Qilian Mountains. This atmospheric pattern is also verified by the positive anomalies of temperature and water vapor flux, as well as negative divergence, warm moisture was transported by the strong southeasterly winds and converged in this region, conducive to snowfall over the Qilian Mountains. All of the above atmospheric circulation systems combine to create a configuration that favors the persistence of snow cover.
In the years with low SCFs (Figure 8c,d), geopotential height over the Arctic region was more negative than that of the mean state, which is favorable for maintaining the polar vortex, meaning that cold air might be hard to transport out of the Arctic region. Moreover, geopotential height over the Qilian Mountains was less than that of the northwestern Pacific, thus it resulted in enhanced easterly winds over the Qilian Mountains, forming a westward water vapor band. However, the water vapor flux and temperature were less than that of the mean state, indicating the cold-dry air was transported by the easterly winds to Qilian Mountains, while water vapor was divergence over the Qilian Mountains, which was hard to conduce snowfall over the Qilian Mountains. Therefore, all of the above atmospheric circulation systems combine to result in the low SCFs.

5. Conclusions

Snow cover in the Qilian Mountains has previously been investigated through consideration of various parameters such as extent, depth, duration, onset date, end date, and snow water equivalent at different scales over different periods. However, it remains of concern because of its effect on the terrestrial energy budget, hydrological cycle, eco-environmental change, and human society, especially in a changing climate. The SCF represents a parameter suitable for analyzing variations in snow cover and for further discussion regarding controlling atmospheric circulation mechanisms. By combining MODIS (MOD10A2) imagery with in situ meteorological observations in high-elevation areas of the Qilian Mountains, this study analyzed the spatiotemporal variation, abrupt changes, oscillations, topographic influences, climatic drivers, and atmospheric circulation patterns associated with SCF. The principal results are as follows. More than 80% of annual SCF is distributed at high elevations and primarily on northern slopes. Moreover, the SCF is greater in the west than in the east. Significant abrupt signals were not identified in the time series of annual SCF, indicating that the observed variation was largely a reflection of fluctuation. Significant quasi-3-year and quasi-5-year periods (at the 0.05 confidence level) indicated potential connection with monsoons. Topographically, annual SCF increased at high elevations and decreased in valleys. Annual SCFs increased significantly (decreased) with a rise in slope below 23° (between 23° and 45°). Moreover, annual SCF decreased with a change in aspect between 70° and 200° and increased with a change in aspect between 200° and 310°; the former was associated mostly with south-facing sunny slopes, and the latter was associated mostly with transition from south-facing sunny slopes to north-facing shaded slopes. On northern slopes, the amplitude of SCF variation was more dramatic than that on southern slopes. On the annual scale, SCF variation in the Qilian Mountains is dominated by precipitation rather than by temperature. In the year with high SCFs (2017, 2019, and 2020), southeasterly winds associated with an anticyclone over southeastern China and southwesterly winds associated with the cyclone over the Iranian Plateau brought warm moisture across northwestern China, favoring snowfall in the Qilian Mountains. Meanwhile, cold moisture outbreaks from the Arctic into the mid-latitudes are conducive to maintaining snow cover. However, in the years with low SCFs (2000, 2001, and 2013), the cold air might be difficultly transporting out of the Arctic region due to the strengthening polar vortex. Moreover, the water vapor was less than that of the mean state and divergence over the Qilian Mountains, which was hard to conduce snowfall over the Qilian Mountains.

Author Contributions

S.K. and W.D. conceived the idea and designed the research framework. J.C., Z.X., W.S. (Weijun Sun) and X.Q. collected meteorological data. L.Q., Y.J. and W.S. (Wenxuan Sun) carried out the data preprocessing. W.D. and L.Q. undertook data analysis and manuscript preparation. S.K. and X.C. contributed to manuscript refinement. All authors have read and agreed to the published version of the manuscript.

Funding

This work is jointly supported by the following research projects: Supported by National Natural Science Foundation of China (42071018, 42101139), State Key Laboratory of Cryosphere Science, Northwest Institute of Eco-Environment and Resources, Chinese Academy Sciences (Grant Number: SKLCS-ZZ-2022); and CAS “Light of West China” Program, Innovation and Development Project of China Meteorological Administration (CXFZ2022J039); Natural Science Foundation of Gansu Province (20JR10RA453).

Data Availability Statement

The data that support the findings of this study are available from the corresponding author upon reasonable request.

Conflicts of Interest

The authors declare no conflict of interest.

References

  1. Liston, G.E. Interrelationships among snow distribution, snowmelt, and snow cover depletion: Implications for atmospheric, hydrologic, and ecologic modeling. J. Appl. Meteorol. Climatol. 1999, 38, 1474–1487. [Google Scholar] [CrossRef]
  2. Ye, T.; Liu, W.; Mu, Q.; Zong, S.; Li, Y.; Shi, P. Quantifying livestock vulnerability to snow disasters in the Tibetan Plateau: Comparing different modeling techniques for prediction. Int. J. Disaster Risk Reduct. 2020, 48, 101578. [Google Scholar] [CrossRef]
  3. Wu, X.; Wang, X.; Liu, S.; Yang, Y.; Xu, G.; Xu, Y.; Jiang, T.; Xiao, C. Snow cover loss compounding the future economic vulnerability of western China. Sci. Total Environ. 2021, 755, 143025. [Google Scholar] [CrossRef] [PubMed]
  4. Qin, D.; Yao, T.; Ding, Y.; Ren, J. An Introduction to Cryosphere Science; China Science Publishing & Media Ltd.: Beijing, China, 2017; pp. 13–26. (In Chinese) [Google Scholar]
  5. Li, W.; Qiu, B.; Guo, W.; Zhu, Z.; Hsu, P. Intraseasonal variability of Tibetan Plateau snow cover. Int. J. Climatol. 2020, 40, 3451–3466. [Google Scholar] [CrossRef] [Green Version]
  6. You, Q.; Wu, T.; Shen, L.; Pepin, N.; Zhang, L.; Jiang, Z.; Wu, Z.; Kang, S.; AghaKouchak., A. Review of snow cover variation over the Tibetan Plateau and its influence on the broad climate system. Earth-Sci. Rev. 2020, 201, 103043. [Google Scholar] [CrossRef]
  7. Zhang, T.; Wang, T.; Zhao, Y.; Xu, C.; Feng, Y.; Liu, D. Drivers of Eurasian Spring Snow-Cover Variability. J. Clim. 2021, 34, 2037–2052. [Google Scholar] [CrossRef]
  8. Handorf, D.; Jaiser, R.; Dethloff, K.; Rinke, A.; Cohen, J. Impacts of Arctic sea ice and continental snow cover changes on atmospheric winter teleconnections. Geophys. Res. Lett. 2015, 42, 2367–2377. [Google Scholar] [CrossRef] [Green Version]
  9. Huang, X.; Deng, J.; Ma, X.; Wang, Y.; Feng, Q.; Hao, X.; Liang, T. Spatiotemporal dynamics of snow cover based on multi-source remote sensing data in China. Cryosphere 2016, 10, 2453–2463. [Google Scholar] [CrossRef] [Green Version]
  10. Ke, C.Q.; Li, X.C.; Xie, H.; Ma, D.H.; Liu, X.; Kou, C. Variability in snow cover phenology in China from 1952 to 2010. Hydrol. Earth Syst. Sci. 2016, 20, 755–770. [Google Scholar] [CrossRef] [Green Version]
  11. Jiang, Y.; Chen, F.; Gao, Y.; He, C.; Barlage, M.; Huang, W. Assessment of uncertainty sources in snow cover simulation in the Tibetan Plateau. J. Geophys. Res. Atmos. 2020, 125, e2020JD032674. [Google Scholar] [CrossRef]
  12. Zhang, H.; Zhang, F.; Che, T.; Wang, S. Comparative evaluation of VIIRS daily snow cover product with MODIS for snow detection in China based on ground observations. Sci. Total Environ. 2020, 724, 138156. [Google Scholar] [CrossRef] [PubMed]
  13. Wang, X.; Xie, H.; Liang, T.; Huang, X. Comparison and validation of MODIS standard and new combination of Terra and Aqua snow cover products in northern Xinjiang, China. Hydrol. Process. Int. J. 2009, 23, 419–429. [Google Scholar] [CrossRef]
  14. Hall, D.K.; Riggs, G.A. Accuracy assessment of the MODIS snow products. Hydrol. Process. Int. J. 2007, 21, 1534–1547. [Google Scholar] [CrossRef]
  15. Aghelpour, P.; Guan, Y.; Bahrami-Pichaghchi, H.; Mohammadi, B.; Kisi, O.; Zhang, D. Using the MODIS sensor for snow cover modeling and the assessment of drought effects on snow cover in a mountainous area. Remote Sens. 2020, 12, 3437. [Google Scholar] [CrossRef]
  16. Wang, X.; Wu, C.; Wang, H.; Gonsamo, A.; Liu, Z. No evidence of widespread decline of snow cover on the Tibetan Plateau over 2000–2015. Sci. Rep. 2017, 7, 14645. [Google Scholar] [CrossRef]
  17. Ma, A.; Zhao, J.; Cai, L.; Dong, Z.; Yang, R. Potential links between wintertime snow cover in central Europe and precipitation over the low—Latitude highlands of China in May. Atmos. Sci. Lett. 2021, 22, e1063. [Google Scholar] [CrossRef]
  18. Brown, R.D.; Mote, P.W. The response of Northern Hemisphere snow cover to a changing climate. J. Clim. 2009, 22, 2124–2145. [Google Scholar] [CrossRef]
  19. Xuejin, T.; Zhenni, W.; Xingmin, M.; Peng, G.; Guangju, Z.; Wenyi, S.; Chaojun, G. Spatiotemporal changes in snow cover over China during 1960–2013. Atmos. Res. 2019, 218, 183–194. [Google Scholar] [CrossRef]
  20. Ding, R.; Li, J.; Wang, S.; Ren, F. Decadal change of the spring dust storm in northwest China and the associated atmospheric circulation. Geophys. Res. Lett. 2005, 32, L02808. [Google Scholar] [CrossRef] [Green Version]
  21. Liu, Q. Spatiotemporal Snow Pattern in the Qilian Mountains from 2001 to 2018. Master’s Dissertation, Delft University of Technology, Delft, The Netherlands, 2020; pp. 1–63. [Google Scholar]
  22. Bourque, C.; Mir, M. Seasonal snow cover in the Qilian Mountains of Northwest China: Its dependence on oasis seasonal evolution and lowland production of water vapour. J. Hydrol. 2012, 454, 141–151. [Google Scholar] [CrossRef]
  23. Sun, M.; Liu, S.; Yao, X.; Guo, W.; Xu, J. Glacier changes in the Qilian Mountains in the past half-century: Based on the revised First and Second Chinese Glacier Inventory. J. Geogr. Sci. 2018, 28, 206–220. [Google Scholar] [CrossRef] [Green Version]
  24. Zhao, Q.; Ye, B.; Ding, Y.; Zhang, S.; Yi, S.; Wang, J.; Shangguan, D.; Zhao, C.; Han, H. Coupling a glacier melt model to the Variable Infiltration Capacity (VIC) model for hydrological modeling in north-western China. Environ. Earth Sci. 2013, 68, 87–101. [Google Scholar] [CrossRef]
  25. Zhou, X.; Xie, H.; Hendrickx, J. Statistical evaluation of remotely sensed snow-cover products with constraints from streamflow and SNOTEL measurements. Remote Sens. Environ. 2005, 94, 214–231. [Google Scholar] [CrossRef]
  26. Tahir, A.; Chevallier, P.; Arnaud, Y.; Ahmad, B. Snow cover dynamics and hydrological regime of the Hunza River basin, Karakoram Range, Northern Pakistan. Hydrol. Earth Syst. Sci. 2011, 15, 2275–2290. [Google Scholar] [CrossRef] [Green Version]
  27. Feng, S.; Hu, Q.; Qian, W. Quality control of daily meteorological data in China, 1951–2000: A new dataset. Int. J. Climatol. 2004, 24, 853–870. [Google Scholar] [CrossRef]
  28. Zahumenský, I. Guidelines on quality control procedures for data from automatic weather stations. World Meteorol. Organ. Switz. 2004, 955, 1–20. [Google Scholar]
  29. Hersbach, H.; Bell, B.; Berrisford, P.; Hirahara, S.; Horányi, A.; Muñoz-Sabater, J.; Nicolas, J.; Peubey, C.; Radu, R.; Schepers, D.; et al. The ERA5 global reanalysis. Q. J. R. Meteorol. Soc. 2020, 146, 1999–2049. [Google Scholar] [CrossRef]
  30. Stow, D.; Daeschner, S.; Hope, A.; Douglas, D.; Petersen, A.; Myneni, R.; Zhou, L.; Oechel, W. Variability of the seasonally integrated normalized difference vegetation index across the north slope of Alaska in the 1990s. Int. J. Remote Sens. 2003, 24, 1111–1117. [Google Scholar] [CrossRef]
  31. Li, Y.; Pan, X.; Wang, C.; Liu, Y.; Zhao, Q. Changes of vegetation net primary productivity and its driving factors from 2000 to 2011 in Guangxi, China. Acta Ecol. Sin. 2014, 34, 5220–5228. (In Chinese) [Google Scholar]
  32. Jiang, Y.; Du, W.; Chen, J.; Sun, W. Spatiotemporal Variations in Snow Cover and Hydrological Effects in the Upstream Region of the Shule River Catchment, Northwestern China. Remote Sens. 2021, 13, 3212. [Google Scholar] [CrossRef]
  33. Ma, N.; Yu, K.; Zhang, Y.; Zhai, J.; Zhang, Y.; Zhang, H. Ground observed climatology and trend in snow cover phenology across China with consideration of snow-free breaks. Clim. Dyn. 2020, 55, 2867–2887. [Google Scholar] [CrossRef]
  34. Jiang, Y.; Du, W.; Chen, J.; Wang, C.; Wang, J.; Sun, W.; Chai, X.; Ma, L.; Xu, Z. Climatic and Topographical Effects on the Spatiotemporal Variations of Vegetation in Hexi Corridor, Northwestern China. Diversity 2022, 14, 370. [Google Scholar] [CrossRef]
  35. Wang, C.; Deser, C.; Yu, J.; DiNezio, P.; Clement, A. El Niño and southern oscillation (ENSO): A review. In Coral Reefs of the Eastern Tropical Pacific; Springer: Dordrecht, The Netherlands, 2017; pp. 85–106. [Google Scholar]
  36. Wang, L.; Wang, W.; Du, H.; Wu, Z.; Shen, X.; Ma, S. Decreasing precipitation occurs in daily extreme precipitation intervals across China in observations and model simulations. Clim. Dyn. 2020, 54, 2597–2612. [Google Scholar] [CrossRef]
  37. Cheng, P.; Luo, H.; Liu, Q.; Li, B.; Cao, Y.; Shang, Z. Characters of precipitable water vapor in Qilian Mountains based on ground-based GPS data. Meteor Mon 2021, 47, 1135–1145. (In Chinese) [Google Scholar]
  38. Zhao, C.; Ding, Y.; Yao, S. The variation of precipitation and rain days for different intensity classes during the rainy season in the Qilian Mountains, Northwest China. Theor. Appl. Climatol. 2021, 144, 163–178. [Google Scholar] [CrossRef]
  39. Wilks, D. “The stippling shows statistically significant grid points”: How research results are routinely overstated, over interpreted, and what to do about it. Bull. Am. Met. Soc. 2016, 97, 2263–2273. [Google Scholar] [CrossRef]
  40. Qin, D.; Liu, S.; Li, P. Snow cover distribution, variability, and response to climate change in western China. J. Clim. 2006, 19, 1820–1833. [Google Scholar]
  41. Seager, R.; Kushnir, Y.; Nakamura, J.; Ting, M.; Naik, N. Northern Hemisphere winter snow anomalies: ENSO, NAO and the winter of 2009/10. Geophys. Res. Lett. 2010, 37, L14703. [Google Scholar] [CrossRef] [Green Version]
  42. Cheung, H.; Zhou, W.; Mok, H.; Wu, M. Relationship between Ural–Siberian blocking and the East Asian winter monsoon in relation to the Arctic Oscillation and the El Niño–Southern Oscillation. J. Clim. 2012, 25, 4242–4257. [Google Scholar] [CrossRef]
  43. Pithan, F.; Svensson, G.; Caballero, R.; Chechin, D.; Cronin, T.; Ekman, A.; Neggers, R.; Shupe, M.; Solomon, A.; Tjernström, M.; et al. Role of air-mass transformations in exchange between the Arctic and mid-latitudes. Nat. Geosci. 2018, 11, 805–812. [Google Scholar] [CrossRef]
Figure 1. Location and topography of the study region (elevation given in meters above sea level).
Remotesensing 14 02823 g001
Figure 2. Spatial pattern of mean snow cover frequency in the Qilian Mountains (2000–2020). (a) annual; (b) spring; (c) summer; (d) autumn; (e) winter.
Remotesensing 14 02823 g002aRemotesensing 14 02823 g002b
Figure 3. Temporal variation of annual SCF during 2000–2020: (a) temporal variation of spatial pattern and (b) variation of annual SCF.
Remotesensing 14 02823 g003
Figure 4. Wavelet spectrum analysis of SCF (2000–2020) on (a) annual, (b) spring, (c) summer, (d) autumn, and (e) winter scales.
Remotesensing 14 02823 g004aRemotesensing 14 02823 g004b
Figure 5. Correlation between annual SCF and (a) slope and (b) aspect during 2000–2020.
Remotesensing 14 02823 g005
Figure 6. Anselin Local Moran’s I (a) and Getis-Ord Gi* (b) in autocorrelation analysis.
Remotesensing 14 02823 g006
Figure 7. Statistical significance of correlation between SCF and precipitation (a,c,e,g,i) and air temperature (b,d,f,h,j) during 2000–2020. (a,b) spring; (c,d) summer; (e,f) autumn; (g,h) winter; (i,j) annual.
Remotesensing 14 02823 g007aRemotesensing 14 02823 g007b
Figure 8. The 500 hPa anomalies of wind (a,c), and divergence (b,d) in the years with high and low SCFs. (a,b) high SCFs; (c,d) low SCFs.
Remotesensing 14 02823 g008aRemotesensing 14 02823 g008b
Publisher’s Note: MDPI stays neutral with regard to jurisdictional claims in published maps and institutional affiliations.

