Article

Examining Impact of Speed Recommendation Algorithm Operating in Autonomous Road Signs on Minimum Distance between Vehicles

by
Andrzej Sroczyński
1,*,
Adam Kurowski
2,
Szymon Zaporowski
2 and
Andrzej Czyżewski
2
1
TSTRONIC Sp. z o.o., Benzynowa 19, 83-011 Gdansk, Poland
2
Multimedia Systems Department, Faculty of Electronics, Telecommunications and Informatics, Gdansk University of Technology, Narutowicza 11/12, 80-233 Gdansk, Poland
*
Author to whom correspondence should be addressed.
Remote Sens. 2022, 14(12), 2803; https://doi.org/10.3390/rs14122803
Submission received: 3 May 2022 / Revised: 3 June 2022 / Accepted: 8 June 2022 / Published: 10 June 2022
(This article belongs to the Special Issue Integrating Remote Sensing Data for Transportation Asset Management)

Abstract

:
An approach to a new kind of recommendation system design that suggests safe speed on the road is presented. Real data obtained on roads were used for the simulations. As part of a project related to autonomous road sign development, a number of measurements were carried out on both local roads and expressways. A speed recommendation model was created based on gathered traffic data employing the traffic simulator. Depending on the traffic volume and atmospheric conditions prevailing on the road, as well as the surface conditions, the proposed system recommends the safe speed for passing vehicles by influencing the distance from the preceding vehicle to prevent collisions. The observed effect of the system application was an increase in the minimal distance between vehicles in most simulations.

Graphical Abstract

1. Introduction

An estimated 1.2 million people are killed in road crashes each year, and as many as 50 million are injured. Most accidents occur on the roads of rural areas or driveways of cities, representing about 54% of all accidents. As many as 71% of accidents occurred on dry surfaces [1].
According to a European Parliament resolution, 92% of road accidents are caused by human error. The use of cooperative intelligent transport systems (C-ITS) technology is important for the smooth functioning of some driver assistance systems. Considering the age of the vehicle fleet, it is essential to take the persistently large number of vehicles that are not part of the system into account and ensure that connected and automated vehicles coexist with traditional unconnected vehicles, so that road safety is not compromised [2].
The European Road Transport Research Advisory Council (ERTRAC) is the European technology platform (ETP) for road transport. ERTRAC is recognized and supported by the European Commission. As a European technology platform, ERTRAC gathers experts from industry, research, and public authorities, regularly updating its roadmap on connected, cooperative, and automated mobility (CCAM), delivering a common stakeholder view of the long-term development of CCAM in Europe.
According to the mentioned roadmap, in 2050, vehicles will have 100% real-time connectivity regarding the relevant road network, and the transport management system will have the appropriate quality of service level and remote operation [3].
Currently, the EU is funding a vast number of projects in the CCAM area, so the list is too long to cite here. A complete and up-to-date list of all EU-funded projects is available through the online CAD knowledge base [4]. European test sites can be found in the same database at [5].
In the USA, by 2021, 56 different companies tested their highly automated vehicles on the roads; just in California, circa two million miles have been driven without a driver. In June 2020, the National Highway Safety Administration (NHTSA) launched the AV-TEST initiative, a voluntary platform for AV testers to share information regarding their testing activities. NHSA acts as a clearinghouse for that information [6].
In Japan, the government has established the Strategic Innovation Promotion Program (SIP), where an automated driving system for universal service (adus) is considered to be one of the 12 priority themes. Additionally, 29 organizations, including the vehicle manufacturers and automotive suppliers BMW, Valeo, Honda, Nissan, Suzuki, Volkswagen, Bosch, and Mitsubishi, are working together in the CAD field operational test in the Tokyo waterfront area (FOT).
According to SIP, fully automated driving (SAE level 4) will be achieved on expressways by around 2025 [7].
In China, in December 2020, the Chinese Ministry of Transport announced its focus on the development of critical technologies for CAD, mainly considering the smart road infrastructure and cooperative systems between the vehicles and infrastructure. The industrialized application of autonomous driving technologies is meant to be deployed by 2025 in China [8]. The State Council of China also announced that a cloud-based pilot area for self-driving vehicles was planned to built in the Beijing Economic–Technological Development Area by the end of 2021. The area known as E-Town, which is 60 km2, is the first high-level automated driving demonstration area and China’s first pilot zone for cloud-based self-driving vehicle policies [9].
The above brief overview shows that, currently, the work is still in the research or testing stage, and a transitional state is underway, in which the connected vehicles are in the vast minority. This fact has led the authors to address a topic in this area, combining traditional vehicles with those that may appear in the future.
Preventing road accidents requires a variety of traffic analyses. A road with its signage and users can be thought of as a discrete event system. Petri nets have become a useful tool in this context [10]. An interesting example of using Petri nets for traffic modeling was presented in the literature [11].
Transport safety should use intelligent transport systems that may be improved by, e.g., adjusting the speed for road, traffic, and pavement conditions and detecting dangerous events, e.g., objects on the road, broken vehicles, or accidents. The development of intelligent transportation systems (ITS) places higher demands on all components, e.g., the microwave radar used to detect objects involved in traffic. Progress in this area, particularly the improvement of the constant false alarm rate (CFAR) detectors, is vital [12]. An essential aspect of intelligent traffic analysis is vehicle behavior recognition. Based on the deep learning technique, an interesting method is presented in the literature [13].
Intelligent transport systems perform several functions, such as acquiring traffic-related statistics or the maximization of safety-related metrics [14,15,16]. In our work, we focus on the latter aspect and present the results of simulations, in which we tested an algorithm to calculate recommended vehicle velocity based on a traffic density tracker. By changing the recommended speed, it is assumed that this will improve the safety measured by maintaining the distance between consecutive vehicles, thus enabling efficient braking in an emergency.
Keeping a safe distance is described in many publications on improving road safety [17,18,19]. There are quite a few approaches to this issue. The best-known is the two-second rule of keeping a safe distance from the vehicle ahead within 2 s of driving [20]. Another known rule or model is the Gipps model, which consists of maintaining a distance that allows for emergency braking in the event of a breakdown or other event in which the preceding vehicle could be subjected [21]. Many articles describe the so-called safe distance car-following model [17,22]. In the case discussed in this paper, the authors wanted to show the possibility of the created model improving safety by manipulating the speed limit based on the number of vehicles (i.e., the traffic volume), thus recommending a safe speed and increasing the distance between vehicles. In the literature, one can also find more sophisticated approaches based upon fuzzy logic or neural networks; however, their complexity makes their application challenging, in regard to embedded or distributed traffic control systems. In the case of such applications, hardware platforms have to be power-efficient, and algorithms that are implemented on them are most often executed by small devices that are capable of being mounted inside the intelligent road sign. In such a case, it is desirable to choose more straightforward and easier methods of calculating the recommended velocity (or intravehicular distance) employed in stimulus–response, leader-following, or collision avoidance models [23,24,25,26,27]. An example of a collision avoidance model is the aforementioned Gipps model, which also provides equations for the estimation of saving minimal distance between vehicles [23]. It should also be noted that classic models that do not employ methods based upon artificial intelligence can also become complicated if complex methods for the detection of lane changes are employed [28]. Our model for calculating the recommended vehicle velocity utilizes the equations proposed in the Gipps model. It is a relatively simple and computationally effective method of obtaining a value for the safe distance between vehicles, which can be converted into a safe maximum vehicle speed recommended for the given road fragment. Our experiment tested how those equations behave if they are fed estimated data, such as mean vehicle velocity or mean vehicle length, obtained by the intelligent road sign in just one point of measurement.
Data obtained from test installations implemented under the “INZNAK: Intelligent Road Signs with V2X Interface for Adaptive Traffic Controlling” project were employed to prepare the environment for the simulation of our model and safe maximum speed calculation [29]. The developed intelligent road sign communicates the speed calculated, concerning the information received from a sequence of similar variable content signs distributed along a highway, which are connected via a wireless network. A unique feature of road signs is the possibility of their autonomous operation, as the speed limit communicated by the signs is the result of their traffic measurements. The recommended speed is communicated by displaying it on a variable message sign, and it is transmitted wirelessly to vehicles equipped with the V2X interface (interface to electronic communication system: vehicle infrastructure) [29].
In our project, we not only ran simulations but also built experimental autonomous traffic signs, on which we have already published articles previously [30,31,32,33,34,35,36,37,38,39,40,41,42]. They contain several sensors: microwave radar, lidar, intensity acoustic probe, cameras, Bluetooth scanner, light intensity sensor, temperature sensor, and precipitation sensor. The goal of the research described in this paper is to fill the gap via the selection of an algorithm to determine the speed displayed on these road signs.
Using the collected sensor data to create a model based on the traffic simulator allows for estimating safe speed values for various pavement states, based on the simulation of real traffic volumes obtained, thanks to the testing installations. It has been proven in several papers related to the INZNAK project that the use of sensors, such as acoustic probes, allows for estimating both vehicle speed and type, as well as the surface condition [30,31,32,33] and traffic intensity [34,35]. Additionally, it is possible to indicate which lane the vehicle is moving in [35,36].
The objective of the simulated system is to select such values of recommended speed, which will statistically increase the minimal distance between vehicles in the simulated environment. The experiment proposed in our manuscript allows for finding out whether the method used for estimating safe velocity in the model can be used by the system that autonomously monitors the local traffic state on the given road fragment to estimate the velocity. In turn, it may lead to an increase in the time that drivers react to unexpected events on the road, as it would be guaranteed that the minimal distance between vehicles is sufficient for the driver to react to the dangerous situation and stop the vehicle completely, thus avoiding collision with the preceding vehicle.
A similar approach was presented in the literature [43]. According to the authors, previous research presents an inconclusive assessment of the impact of VLSLs on safety and traffic performance; therefore, this paper attempts to quantify the impact of selected VSLS control strategies on safety and traffic flow using a section of an urban highway in North America. The research undertaken differed from that reported in the literature, in that the VSLS control strategies evaluated were designed for practical implementation by providing a dynamic response directly to loop detector data at 20-second intervals, as well as adhering to the typical design standards concerning maximum speed limits, similar in structure to those already in use in the UK and Netherlands. Simulations of the designed algorithm showed that the effect of VSLS on safety and traffic flow strongly depends on the traffic volume. The improvement of both parameters is pronounced during high traffic intensity (peak) and negligible off-peak. The negative effect of the tested algorithm was a corresponding increase in travel time—significant during peak, insignificant during off-peak. A strategy that could provide a consistent and positive impact on safety and travel time at all congestion levels was not identified, but the analysis provided evidence that significant improvements could be achieved.

2. Material and Methods

First, the results were obtained utilizing computer simulation in the SUMO traffic simulator. It is an open-source environment that is mainly used for educational purposes, but it has several capabilities that allow for a fairly precise simulation of road traffic [44]. SUMO uses the Krauss car-following model, which can be described as a safe distance-based model. It tries to maintain a safe distance between preceding vehicles, and it has settings that allow us to interfere with the simulated behavior of drivers and comply with their speed limits [45]. In addition, there are scientific works in which SUMO was successfully used to simulate urban traffic; otherwise, improved frameworks for simulation were built [46,47].
The first tests were conducted on a local, two-way road that included two lanes of traffic. This is a non-urban road, on which vehicles reach quite high speeds, on the order of 90 km/h. This road was chosen for the tests because the traffic is too irregular and slow in the city, and testing the new designs and algorithms on freeways at high speeds would be too dangerous to begin with.
The speed limit assigned to this road fragment is 90 km/h. The traffic volume values utilized as input parameters for the simulations are based on data obtained from the test installation. Traffic measurement using a specially constructed data acquisition module from an intelligent road sign lasted 128 days (in the spring and summer seasons, between May and September). Based on the analysis of the collected data, average traffic volume values were obtained by averaging out the influence of the time of day, weather conditions, and other factors, such as the day of the week or impact of random events. The use of simulation, instead of a real-life experiment, allowed us to test multiple possible scenarios of system application, as well as to estimate its performance for various road traffic types. More details regarding the testing scenarios are provided in the subsequent part of the manuscript. Outcomes of simulations were used to evaluate the anticipated influence of the proposed system on the traffic parameters in the place of its application. Values of typical traffic intensity and statistical parameters, such as mean time between events of a vehicle entering, were derived from the measurement of those parameters in the real world. Additionally, the percentage of vehicle classes, i.e., trucks, cars, and motorcycles, were estimated based on measurement results. This information was used for selecting test cases, as well as for the calibration of the Krauss model to reflect the intensity and structure of vehicle classes observed in the real-world measurement place. The length of the road fragment used to design the simulation environment was approximately 2.5 km. The visualization of road fragment geometry used for the simulation is shown in Figure 1.
The system interacts with vehicles moving between the entry and exit points, as shown in Figure 1. At the beginning of the simulated road section, the system applies a speed limit that depends on information regarding the average speed, number, and length of vehicles passing the point in the middle of the selected road section. In the simulation, we assumed that vehicle drivers completely respect the speed limit set by our algorithm. This way of simulation reflects the situation in which the system takes all traffic measurements near the recommended speed indicator.
Equations used to calculate the maximum recommended (safe) velocity in our proposed system were similar to those applied in the Gipps model [23]. Our goal was to calculate the value of the maximum recommended vehicle velocity ( v r e c ) at which vehicles would be able to stop completely over the minimal distance between vehicles ( d m ) that are moving on the analyzed fragment of the road. We should take the distance covered by a vehicle during the phase of slowing down until the vehicle stops ( d b r ) into account, but it is also necessary to take the distance covered by the vehicle during the reaction time of the driver ( t r ) into account. We denote this distance as ( d r ). The following equation may describe this situation:
d b r + d r = d m
We can derive the final equation used for obtaining the recommended velocity (2) after the application of simple transformations that include the calculation of dbr; the formula is applied for obtaining a distance covered by the linearly decelerating object. A substitution of dr with the formula for obtaining a distance covered by the object moving with the constant speed was made. We assumed, with regard to the above context, that the initial velocity of the vehicle is equal to the recommended velocity of v r e c . The discussed equation adopts the following form:
V r e c 2 2 a d e c + t r v r e c d m = 0
where:
  • v r e c is recommended safe vehicles velocity on the simulated road fragment,
  • a d e c denotes deceleration of the vehicle while braking,
  • t r is the reaction time of a driver and the vehicle, and
  • d m is the mean distance between vehicles.
The solution of Equation (2), concerning v r e c , results in the following formula, which is used for calculating the recommended vehicle velocity, being used for our simulation as a speed limit:
v r e c = ( a d e c 2 t r 2 + 2 a d e c d m ) a d e c t r
If the speed of vehicles is equal to or less than the threshold value of v r e c , the vehicles are guaranteed to be able to stop over a distance dm. Therefore, the speed limit equal to the value of the recommended velocity vrec, which is applied automatically for each vehicle entering the simulated road fragment.
Value of a d e c was set to 3.2 m/s2. The system calculates the dm value from the following formula:
d m = v m e a n q L
where v m e a n is the mean velocity of vehicles calculated from information provided by the SUMO software (mean of vehicle velocities at the beginning of the simulated road fragment),   q is the local estimate of mean traffic intensity (in vehicles per hour) calculated via the algorithm, and L is the estimated mean length of the vehicle, which was also acquired from the SUMO software.
Calculations were performed for three values of drivers’ reaction times t r , namely 850, 1150, and 1500 ms, as well as three values of traffic intensity q : 400, 800, and 1200 vehicles per hour. Thus, 9 experiments were carried out for each possible reaction time and traffic intensity. The selected values were consistent with the reaction time values appearing in the literature [48,49,50]. Data, which were input to the formula (4), mimicked the structure of data obtained from the sensors of the InZnak intelligent road sign. The mean length of vehicles was obtained by analysis of the vehicle types structure. Mean intensity and speed were obtained by measuring the speed of passing vehicles, which was obtained from sensors based on LIDAR, Doppler, and an acoustic vector sensor in the real application.
Implementing the recommended speed was the subject of a separate series of experiments conducted using the traffic simulator. Attention was focused on the issue of a local, i.e., not extensive, traffic control system. Such a system would consist of a small number of intelligent, interconnected road signs deployed along a critical road section, where the probability of traffic incidents is relatively high.
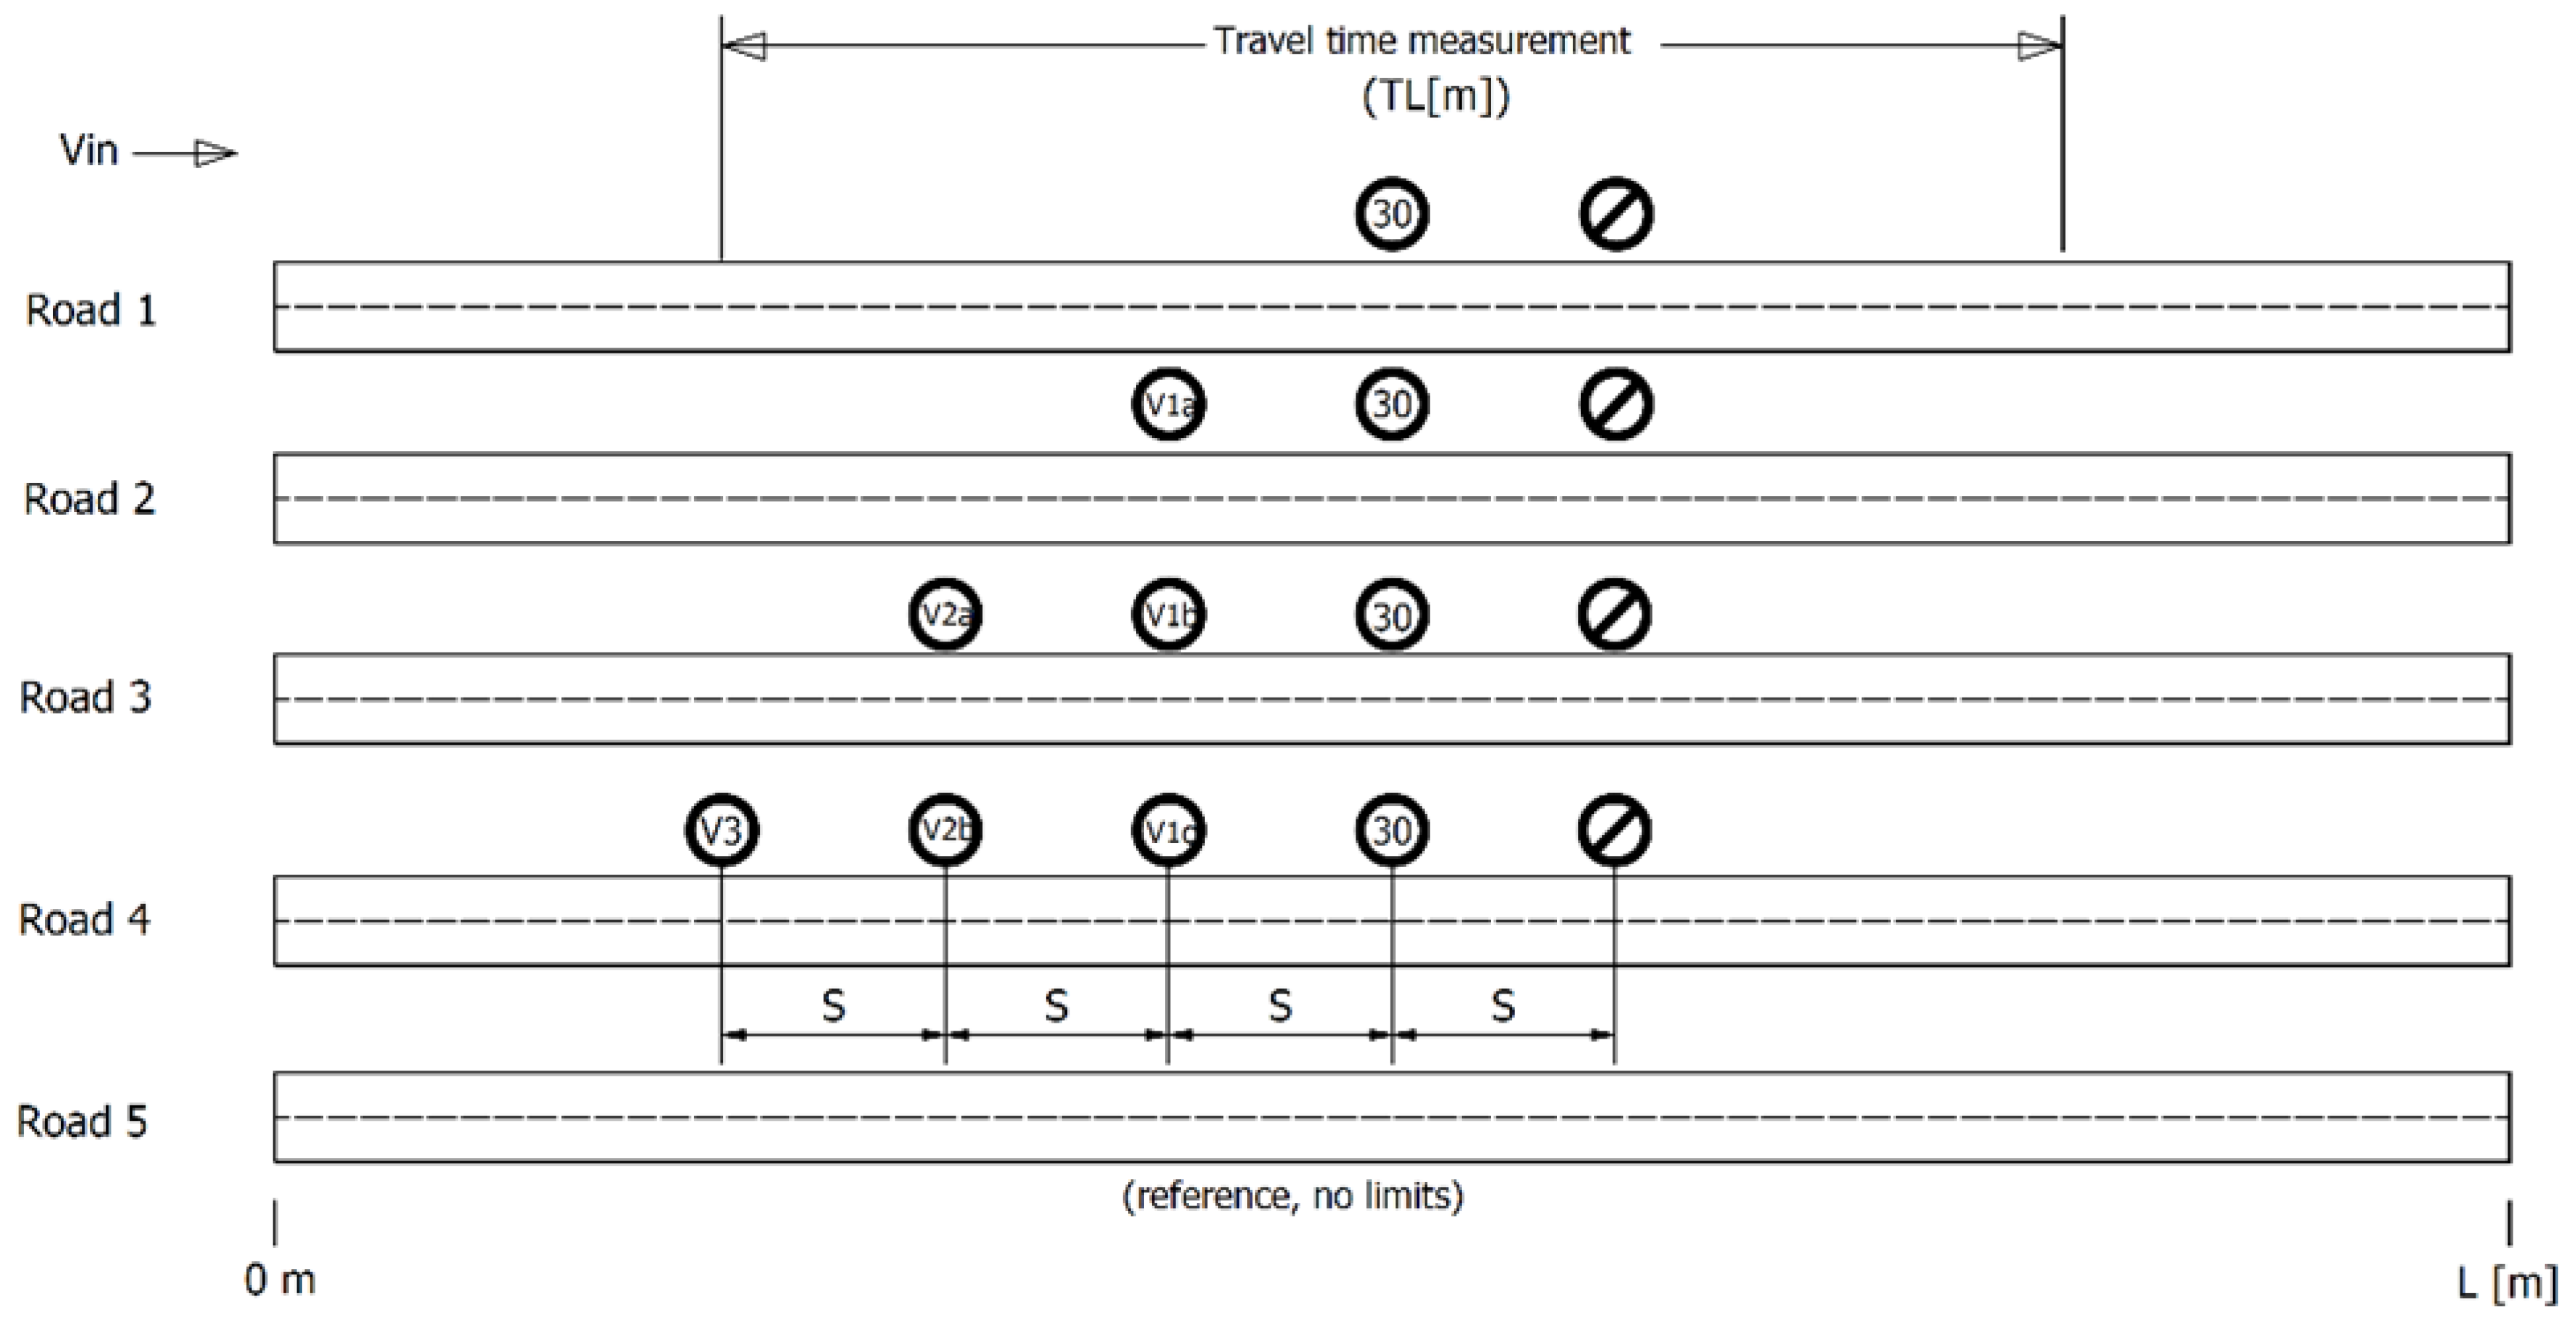
The experiments used the model shown in Figure 2. This model consists of five road sections of identical length, differing in the number of variable message signs installed. Road number 5 does not contain any speed limits (within the allowed range, defined at the beginning of all sections) and is the reference section.
The following denotations were adopted:
  • Vin—the permitted speed, depending on the road class;
  • TL(m)—the length of the test section for time measurement, expressed in meters;
  • S—distance between variable message traffic signs in meters (assumed to be the same for all signs);
  • L(m)—total length of the modeled road sections in meters.
The experiments were conducted for several variations of the model shown in Figure 2:
-
variant 1: L = 1000 m, S = 100 m, TL = 600 m;
-
variant 2: L = 2000 m, S = 200 m, TL = 1600 m;
-
variant 3: L = 2000 m, S = 300 m, TL = 1600 m.
The simulations were conducted for four technical classes of roads, as specified in the national regulations in Poland. These classes differ in traffic intensity and allowed speeds. The results of the measurements of travel times of the test sections were normalized, concerning the average value obtained for road No. 5 (reference road), on which the traffic took place without any obstacles. Depending on the tested road class, two models of drivers’ behavior were used in the simulation: Wiedemann 74 [51] and Wiedemann 99 [52]. Under normal traffic conditions, the maximum deceleration is assumed to be 3.2 m/s2 to 3.5 m/s2 [53], and this was assumed in the simulation. The maximum deceleration for emergency braking is approximately 1 g, i.e., 9.81 m/s2 [54].

3. Results

3.1. Speed Recommendation Involving Traffic Simulator

Simulations related to the recommended traffic speed were conducted for two cases. In the first one, the system for calculating and enforcing the recommended speed was turned off, and combinations of the three previously mentioned vehicle traffic volumes and response times were tested. Then, the same situations were analyzed, but with the system turned on. The output of the simulation was a set of statistical descriptors reflecting the distance between vehicles in each simulated scenario. The minimal, maximal, median, and mean value of the distance between the vehicles was collected. Such a set of parameters was obtained for each of the 40 repetitions of the simulations. Each repetition contained a traffic example, which was affected by the proposed system for the automatic control of the speed limit, as well as an example of a situation in which the system was turned off. Therefore, it was possible to calculate the change in the statistical properties of the distance between the vehicles for each considered case.
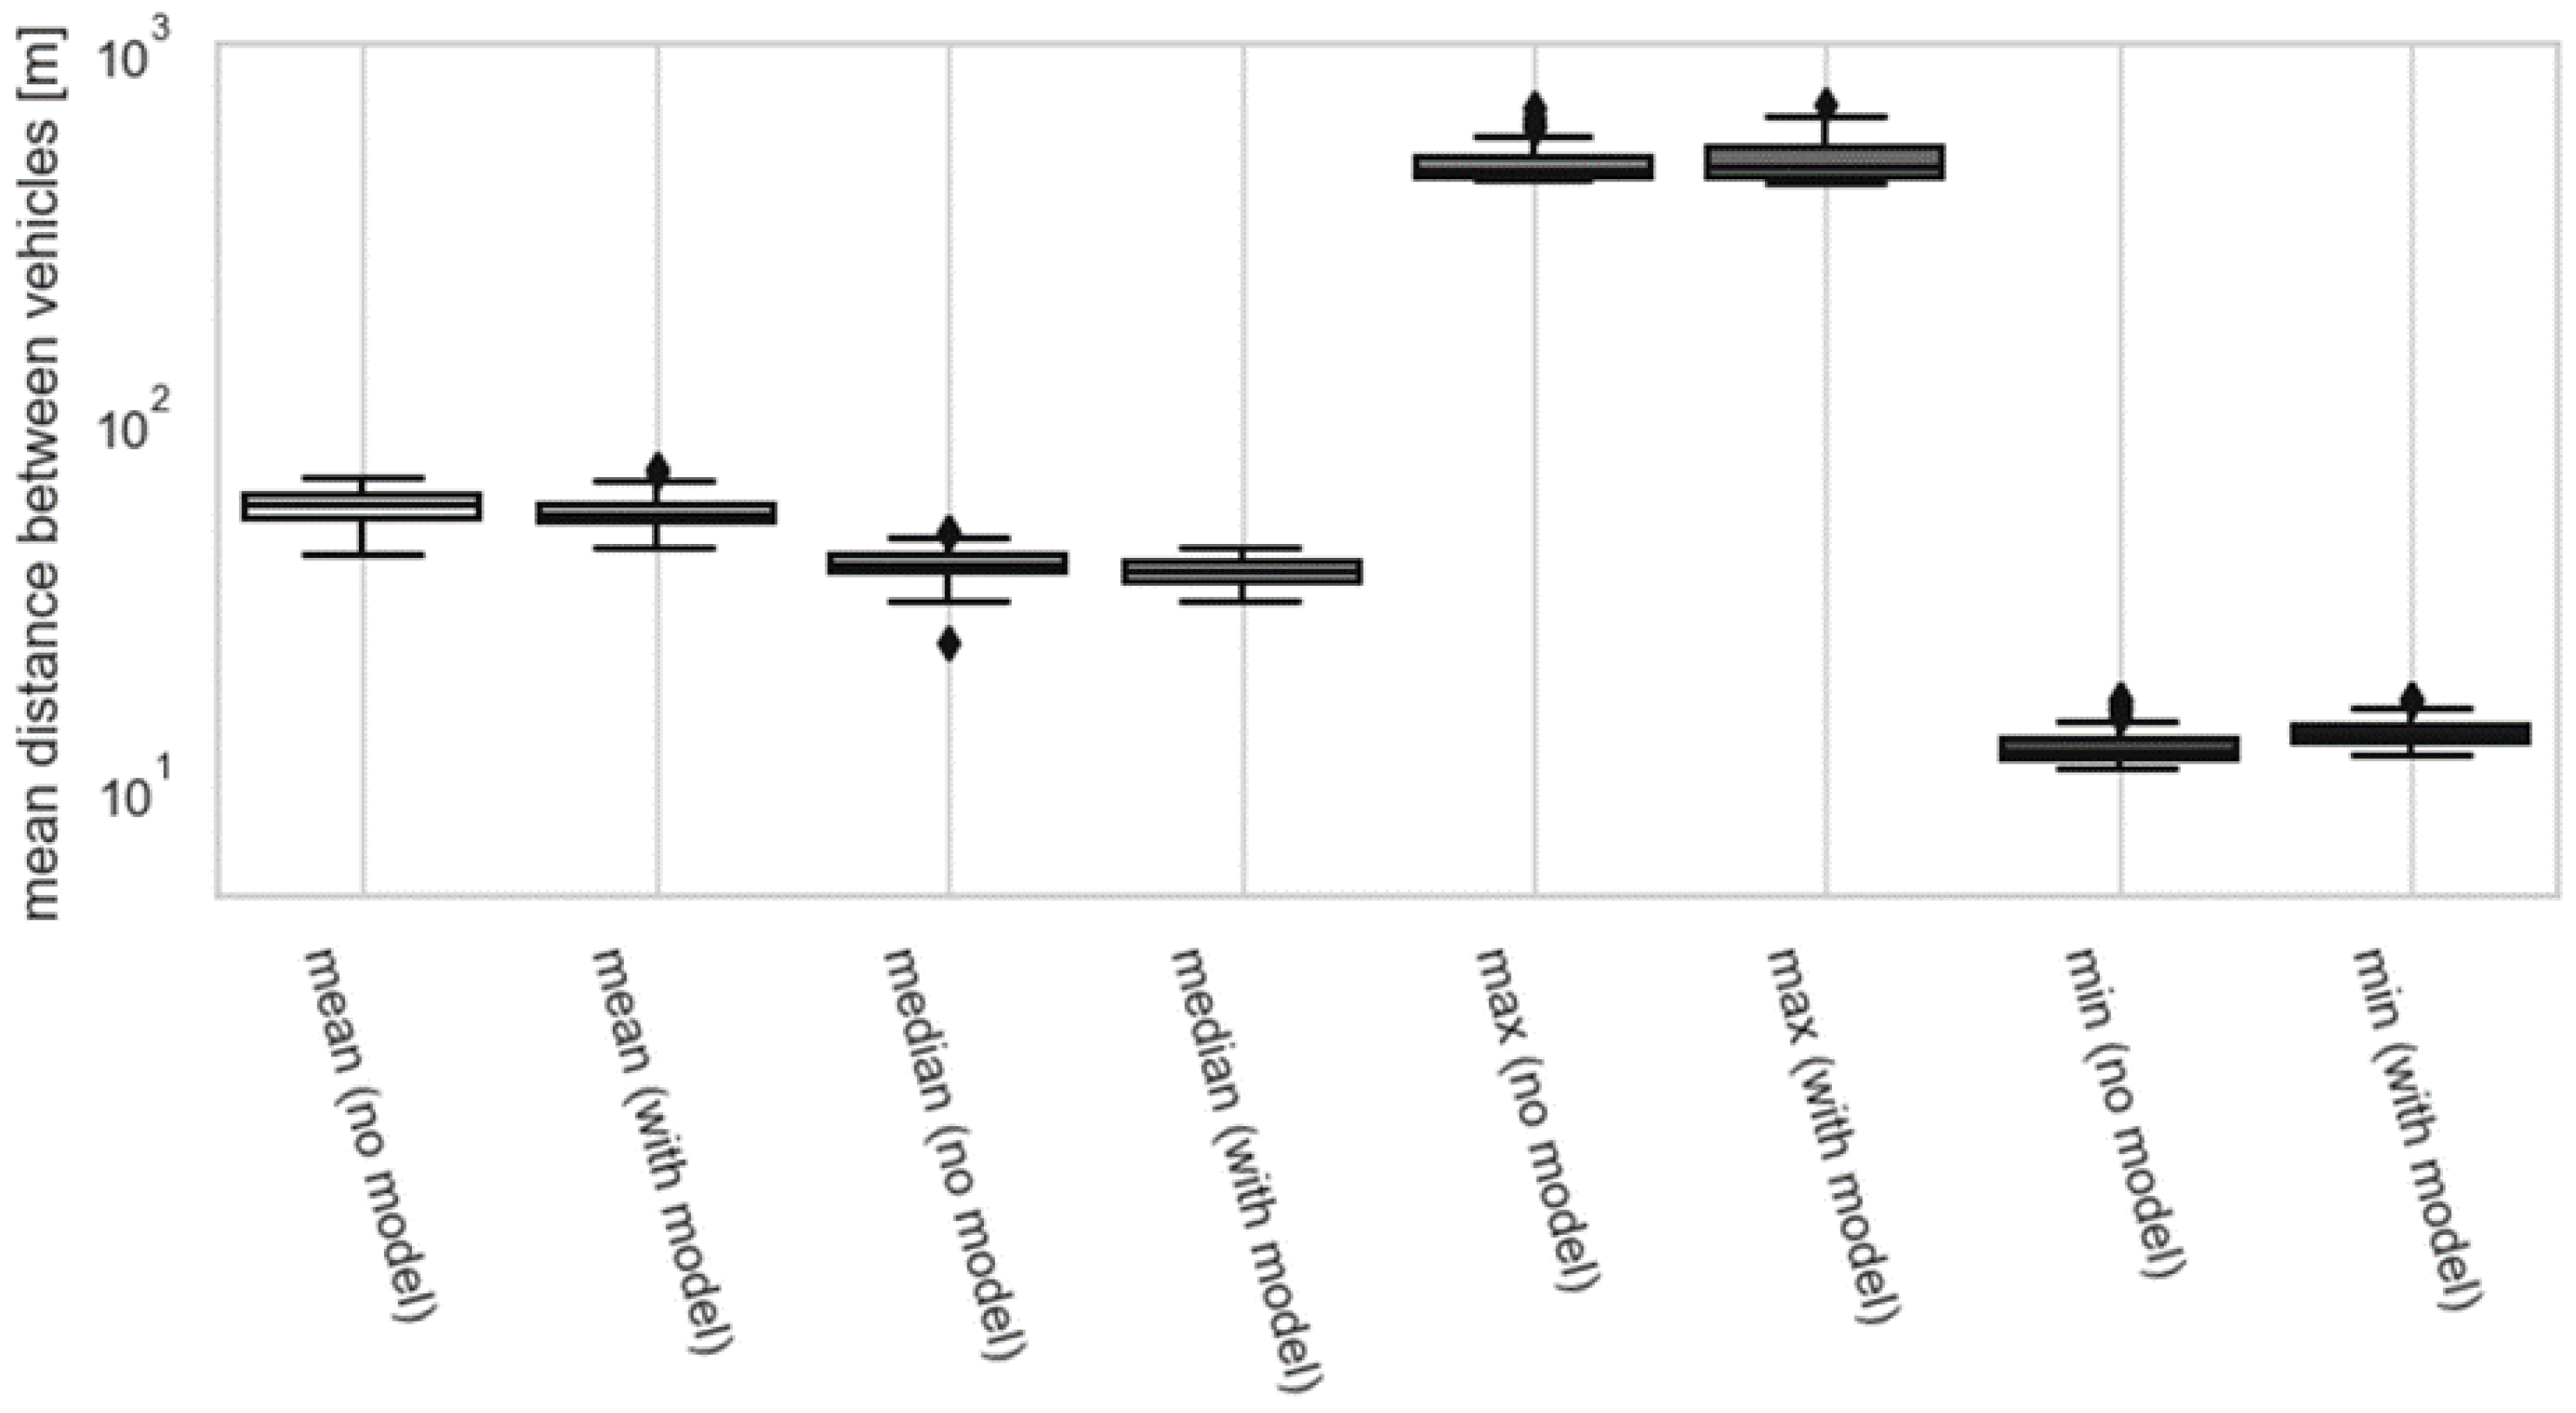
Boxplots illustrating the statistical properties obtained for the drivers’ reaction time, equal to 850 ms and a traffic intensity of 400 vehicles per hour, are presented in Figure 3.
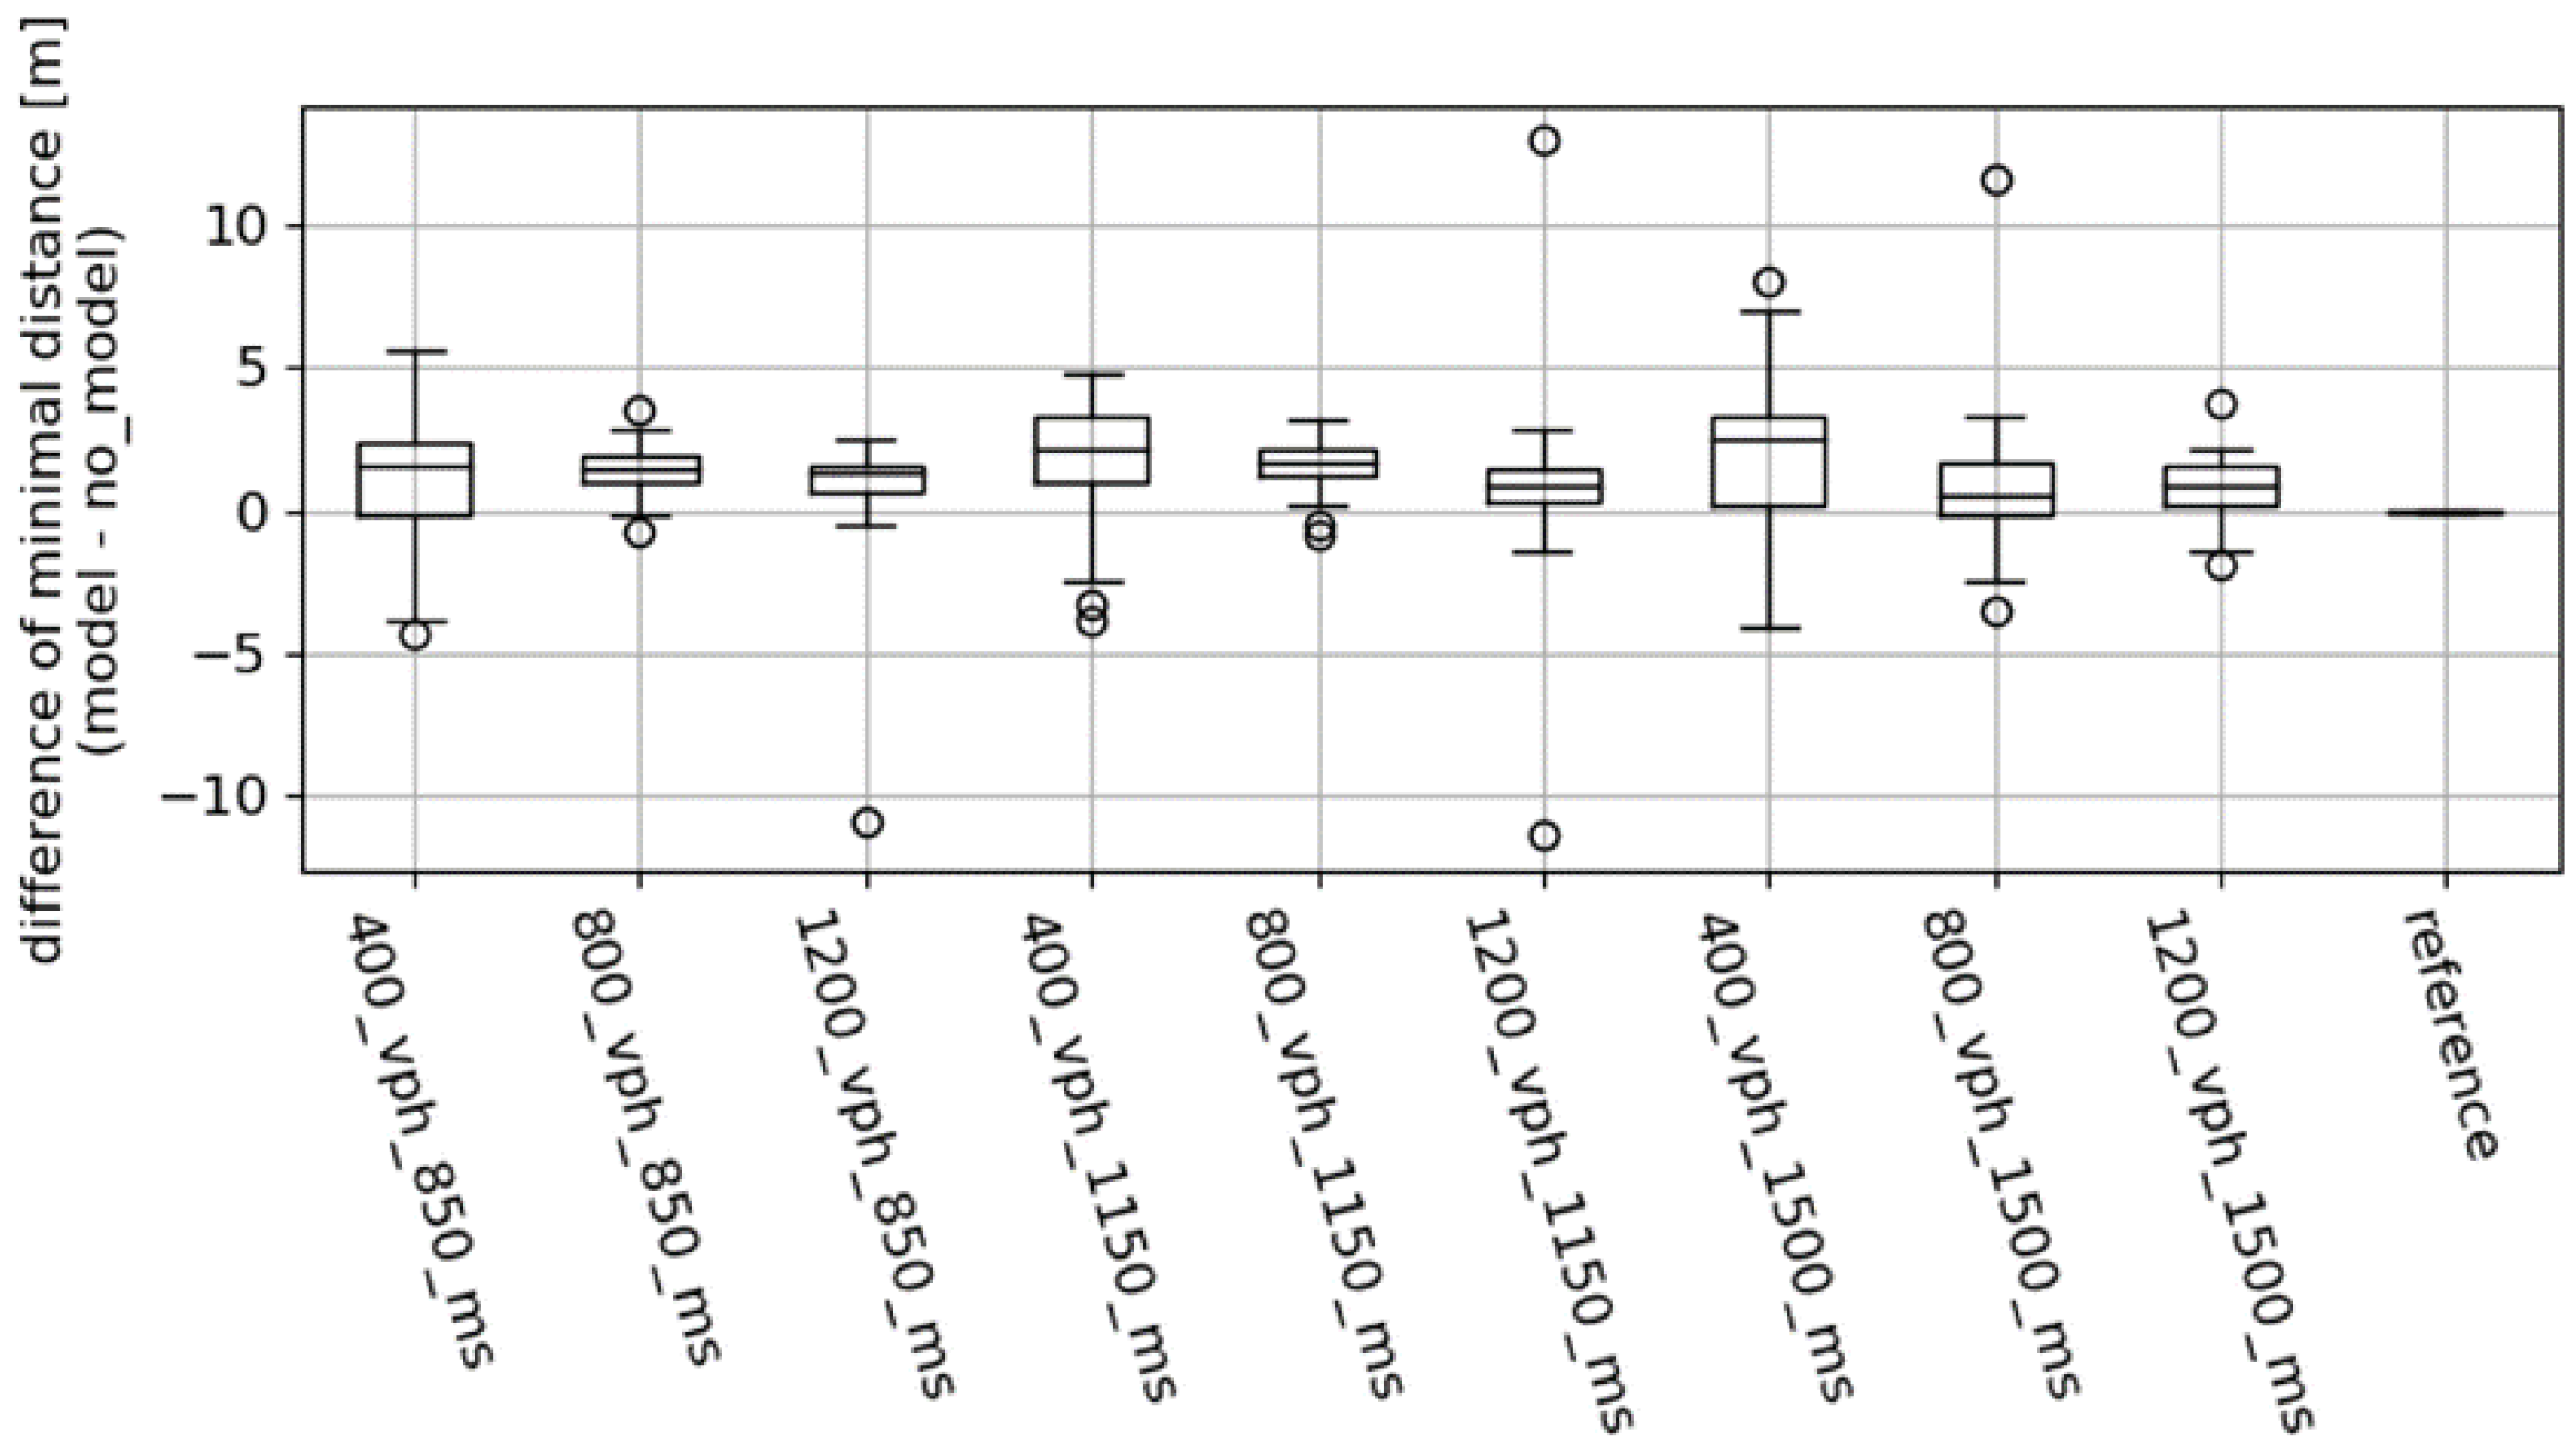
The most important chosen descriptor from all four considered variables is the minimal mean distance between the vehicles, as obtained for the whole run of each simulation. This value determines how fast the traffic can move, with each vehicle able to come to a complete stop without colliding with the preceding vehicle. From values of minimal distances between vehicles, in case the system was turned on, we subtracted the value of minimal distance for the case with the system turned off. Thus, the positive value identifies an improvement introduced by the system, as well as an improvement of the safety of driving on the fragment of the simulated road with the proposed speed management system turned on. The results are shown in Figure 4. The boxplot also contains a box related to a reference sequence of fourty zeros. This artificial sequence was added to perform a statistical comparison, in order to find out whether the medians of increase in minimal distance between vehicles were statistically significantly greater than zero.
The x-axis shows the simulation conditions. The convention adopted was: <number of vehicles per hour>_<drivers reaction time in milliseconds>.
We can observe an increase in the minimal observed distance between vehicles for each traffic intensity and driver reaction time. As the variances of all variables from Figure 4 are not equal, due to the addition of this artificial sequence of zeros, a requirement of equality of variances of all variables is not fulfilled. Thus, an ANOVA test cannot be applied to find out whether the differences between the variables are statistically significant. Instead, we used a Kruskal–Wallis test. The value of the test statistic is equal to 79.29, and this means that the p-value of the test is less than 10 6 . Thus, we can conclude that, for a significance level of 0.05, differences between at least two variables from Figure 4 are statistically significant. This outcome provides us the information that at least one pair of minimal distance sets, depicted as boxes in Figure 3, have medians that differ statistically. To further investigate the statistical significance of the differences between the values of the variables associated with the boxes in Figure 3, we performed a Dunn post hoc test, which is one of the common statistical post hoc tests used together with the Kruskal–Wallis test. It analyses the differences between all possible pairs of distance sets and returns information regarding comparisons in the form of p-values. The test is designed to minimize the possibility of errors that are caused by the multiple comparisons problem [55,56]. Such calculations are shown in Table 1 in the form of a matrix.

3.2. Travel Time Measurement Involving Vissim Traffic Simulator

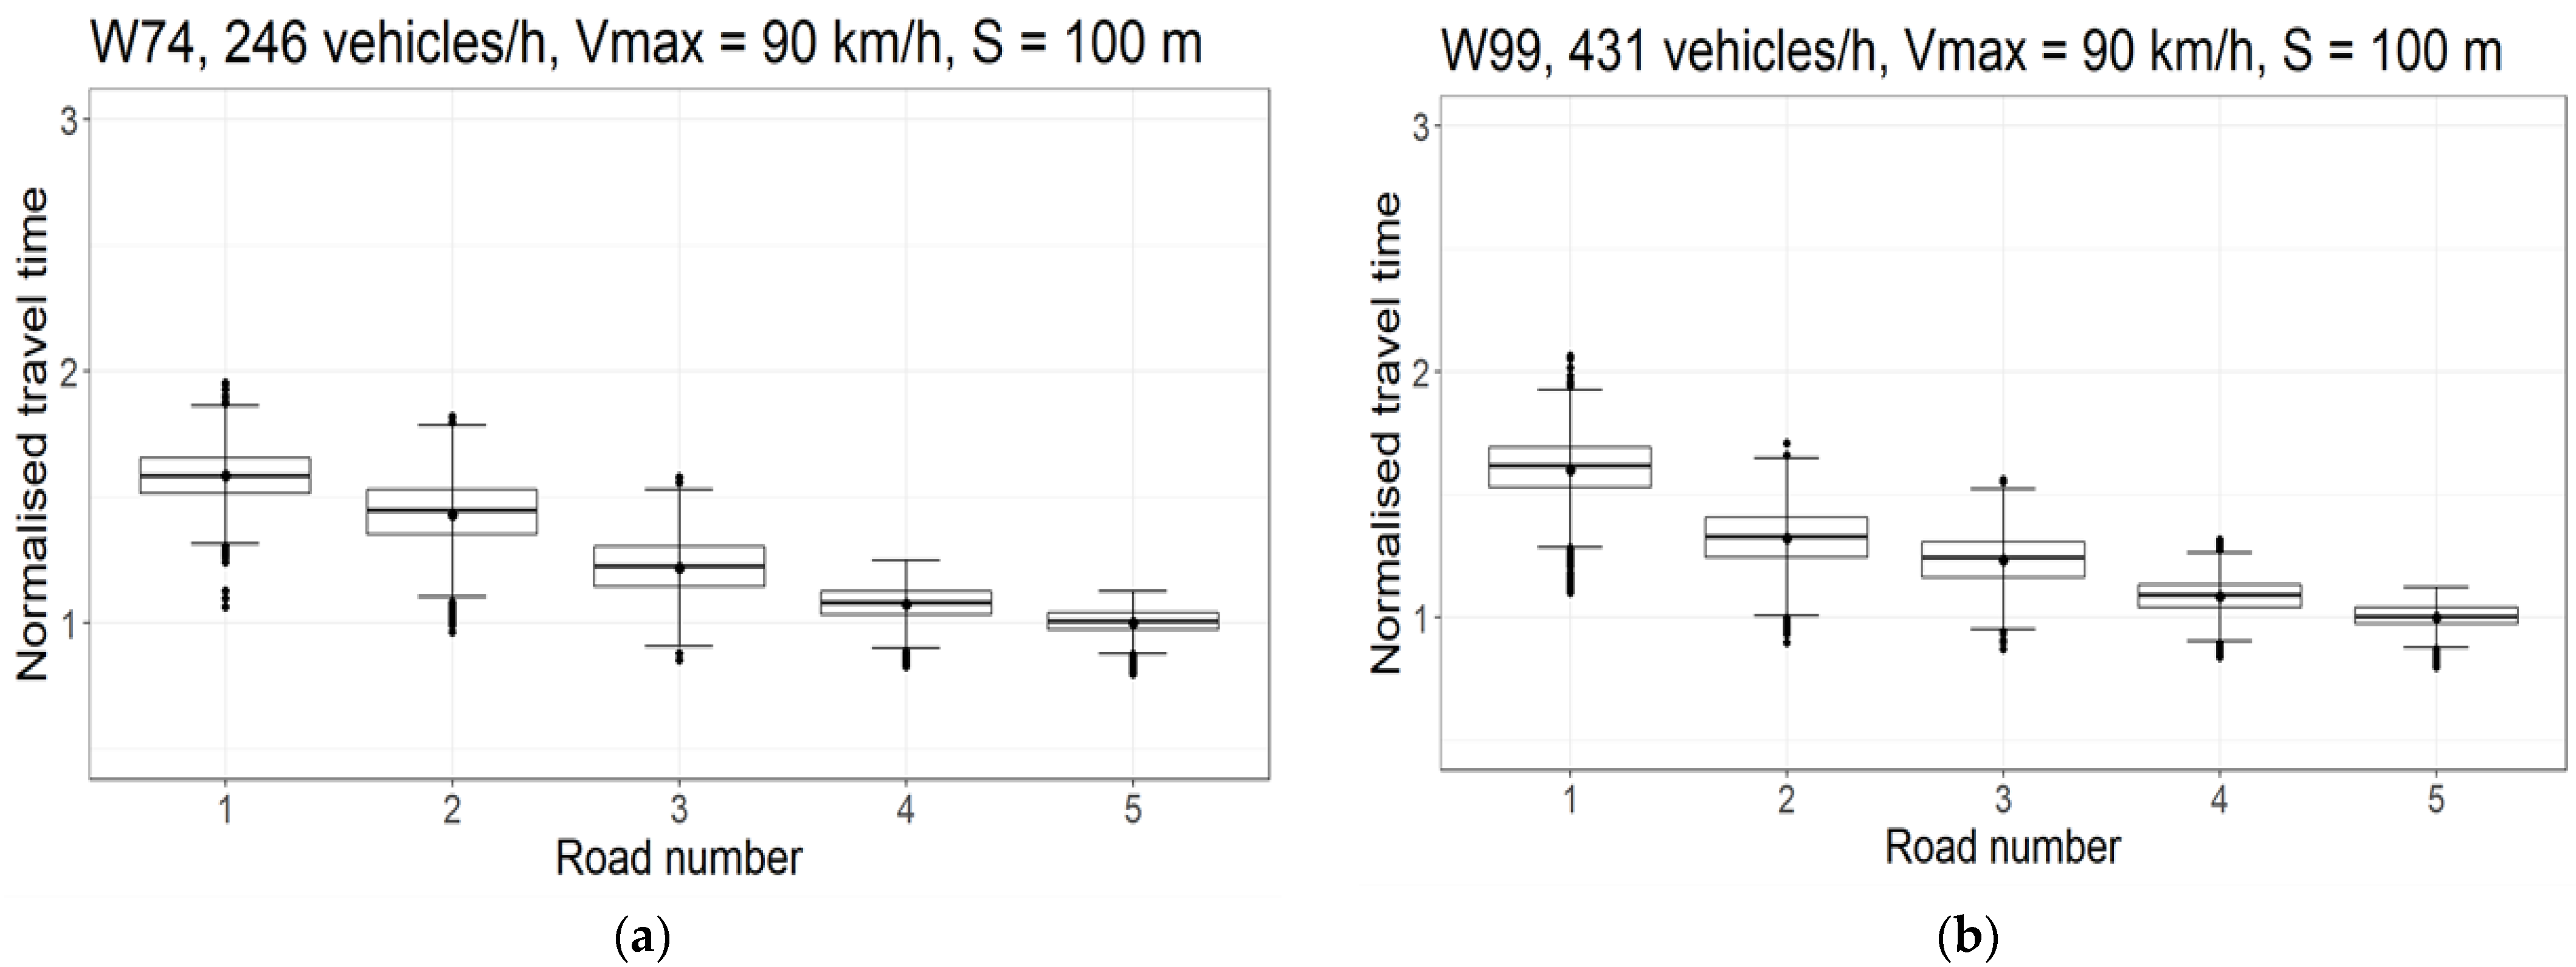
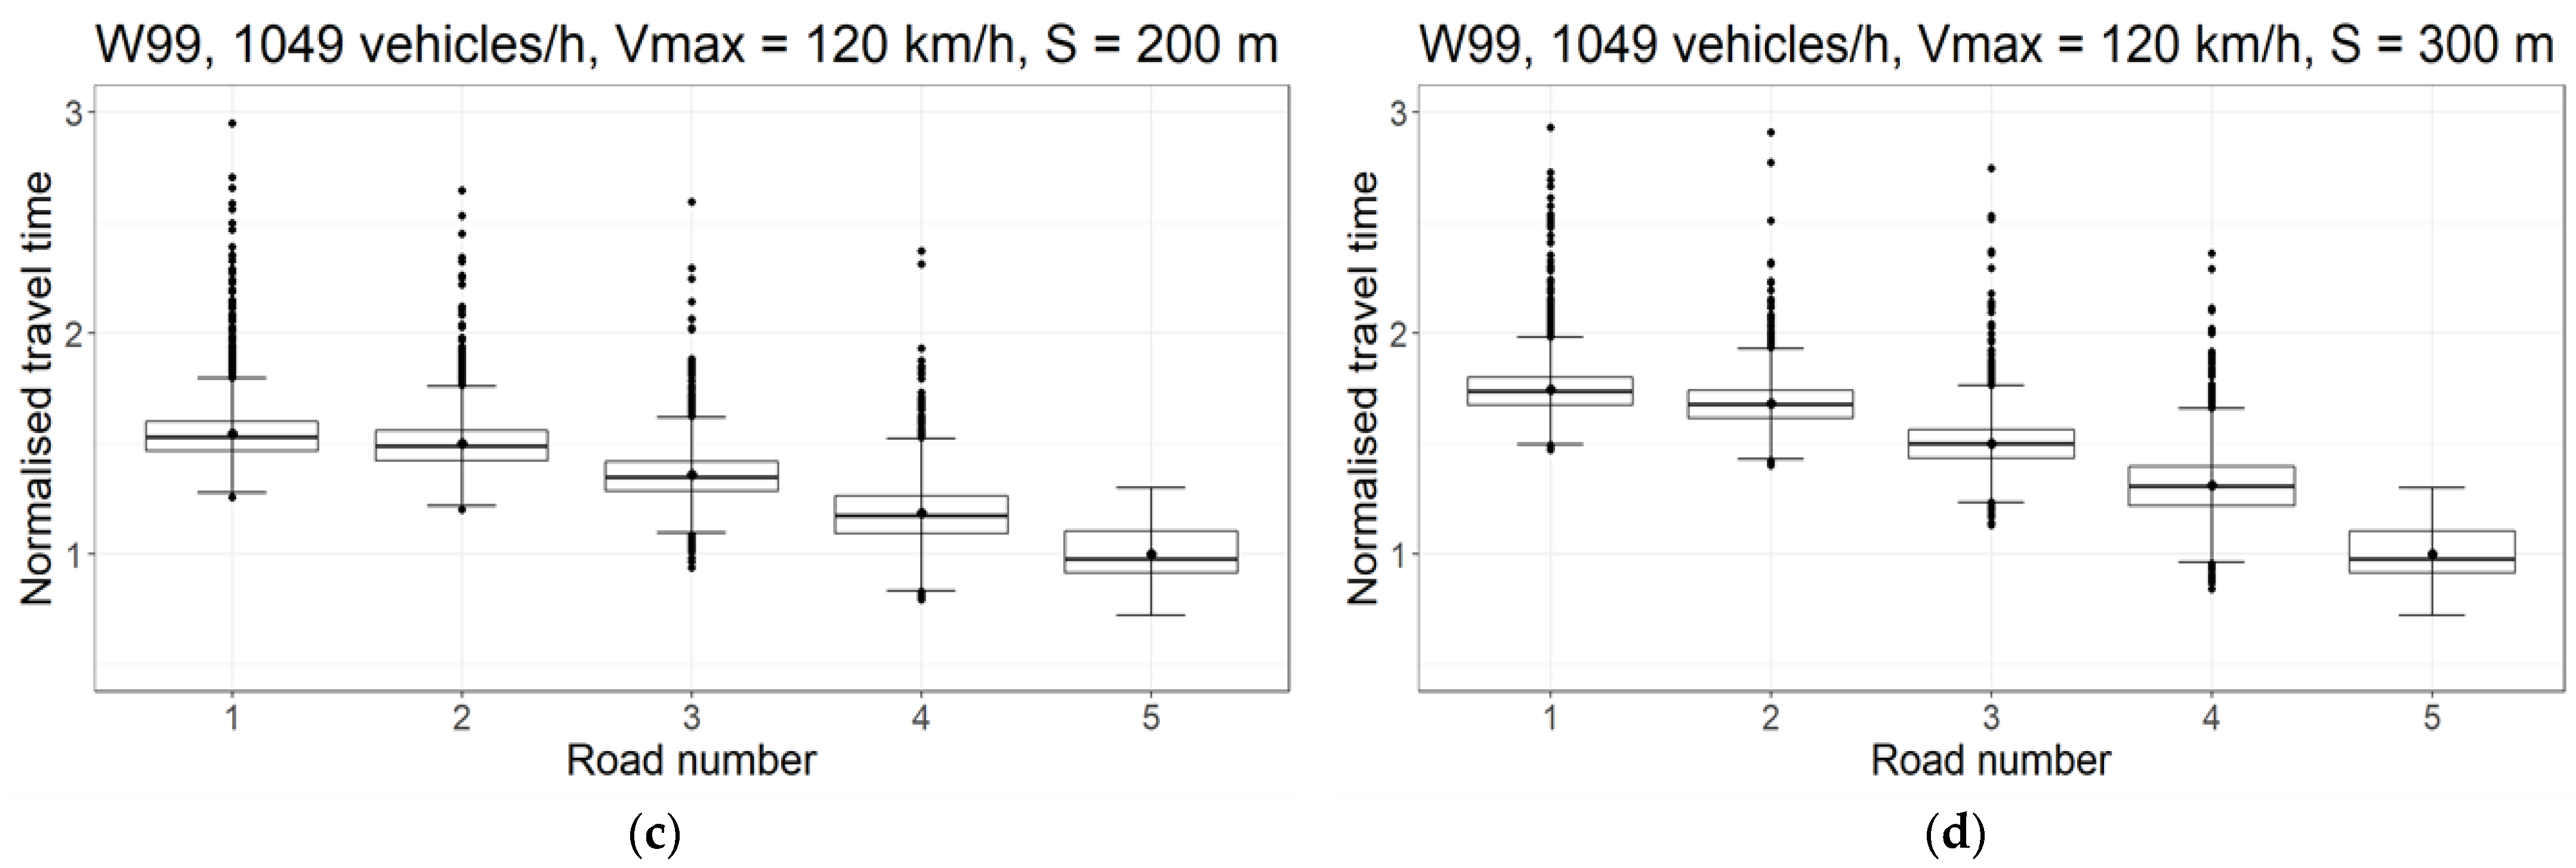
The results of the travel time measurement experiments are shown in Figure 5.
The following denotations were adopted:
  • Road G—the main road;
  • Road GP—main road of accelerated traffic;
  • Road S—express road;
  • W74, W99—driver behavior models (Wiedemann’s models 74 and 99);
  • S—the distance between signs;
  • L—total length of the test road section;
  • TL—length of the driving time measurement section.
The experiments showed that grading in speed limitation causes a reduction of travel time through the test section. This trend is independent of the road category, although it can also be seen that increased traffic volumes are associated with traffic flow disruptions. Increasing the distance between the signs resulted in a noticeable increase in travel time.

4. Discussion

The analysis of the results is carried out in this chapter separately for both types of simulations performed.

4.1. Speed Recommendation Algorithm

As it can be seen in Table 1, the increase in the mean distance between vehicles was found to be statistically significant. All p-values obtained from comparisons of the minimum distance increase and reference sequence of zeros were less than 10 3 . Therefore, for both the significance level of 0.05 and even more restrictive levels of significance, such as 10 3 , we found the observed increase in distance statistically significant. It should be taken into account that the results obtained by employing simulations, as well as the model implemented in the SUMO software, may not reflect all the nuances and phenomena that occur on the road. However, the example provided in our experiment may serve as a proof of concept for further research. On the other hand, we analyzed the increase in the minimal distance between the vehicles in our experiment. Such a measure is calculated by subtracting the distance between the vehicles that was obtained from the state in which our system was not active from the analogous distance obtained from the state in which our system was active. Both cases were simulated with the use of the same model. Therefore, there is a chance that at least some error sources were cancelled, due to the aforementioned subtraction of the results. However, one has to remember that error can still be introduced to the outcomes of such a simulation, i.e., due to the inaccuracies related to the reaction of vehicles to the speed limit imposed by the system.
An additional interesting observation is the fact that the system, which was set to control traffic with drivers with a larger value of reaction time, was more vulnerable to changes in traffic intensity. The performance decreased for larger values of traffic intensity. The trend was statistically significant in some cases, as can be seen by both analyzing Figure 3 and Table 1 content. This may be an important observation, so it should be taken into account while designing systems capable of handling large values of traffic intensity.
Our experiment is based upon information regarding a single place of measurement; thus, it is derived from possibly locally-biased acquired data. Data acquired in such a way was later used to estimate the proposed system’s anticipated behavior to calculate recommended velocity. This means that more research is needed, in order to determine how the performance of the model tested in this study changes before it is applied to other system placement locations.

4.2. Implementation Method for Recommended Speed Limits vs. Travel Time

Experiments related to travel time measurements showed a clear impact of both multiple speed limit gradations and the distance between the signs on the parameter studied.
The most orderly situation can be seen in Figure 5a. Low traffic volumes and relatively slow speeds caused the measurement points to line up regularly. An increase in traffic volume to 431 vehicles per hour, while maintaining the speed (Figure 5b, i.e., 90 km/h), did not cause significant changes. However, the first signs of disturbance on road No. 1 can be observed, which manifested in an increased number of outliers. Doubling the traffic volume and increasing the speed to 120 km/h, as in Figure 5c,d, caused an apparent increase in the number of vehicles, for which the travel time was significantly longer. The formation of queues manifests this. Comparing Figure 5c,d, it can also be seen that increasing the distance between traffic signs resulted in a clear increase in travel time.

5. Conclusions

The presented research results can be used directly by existing traffic control systems and taken into account when designing new road sections, including forecasting safety indices [57]. However, measurements and comparative studies can only assess the actual impact on the road safety potential (SAPO) index in operation. Therefore, more extensive studies could make one of the following stages of our research. It is also necessary to note that, although our outcomes were statistically significant and the input data fed into the Krauss model implemented in the SUMO software were obtained from a real place, our results and conclusions are derived from the outcomes of a computer simulation.
Under normal road conditions, it seems obvious to qualify the introduction of a single large speed limit, e.g., from 120 to 30 km/h, as an erroneous procedure. However, it should be noted that this is a common situation in the event of, for example, a traffic collision. Therefore, introducing adaptive local systems capable of multi-stage speed reduction on sections exposed to an exceptionally high risk of sudden traffic disruption could significantly improve traffic safety.
The next step in our research should be implementing our models to predict and assess the recommended vehicle speed under real traffic conditions.

Author Contributions

Conceptualization, A.C.; Formal analysis, A.S. and A.K.; Investigation, A.S., A.K. and S.Z.; Methodology, A.S., A.K. and S.Z.; Project administration, A.C.; Supervision, A.C.; Visualization, A.S. and A.K.; Writing—original draft, A.S., A.K. and S.Z.; Writing—review & editing, A.C. All authors have read and agreed to the published version of the manuscript.

Funding

The project was financed by the Polish National Centre for Research and Development (NCBR) from the European Regional Development Fund, No. POIR.04.01.04-00-0089/16, entitled “INZNAK: Intelligent Road Signs with V2X Interface for Adaptive Traffic Controlling”, and co-funded by the “Implementation Doctorate” program of the Ministry of Science and Higher Education.

Data Availability Statement

Not applicable.

Conflicts of Interest

The authors declare no conflict of interest.

References

  1. European Road Safety Observatory. Annual Accident Report 2020. 2020. Available online: https://ec.europa.eu/transport/road_safety/system/files/2021-07/asr2020.pdf (accessed on 9 April 2022).
  2. European Parliament Resolution of 13 March 2018 on a European Strategy on Cooperative Intelligent Transport Systems (2017/2067(INI)). Available online: https://op.europa.eu/pl/publication-detail/-/publication/323ad5ec-7b1f-11e9-9f05-01aa75ed71a1/language-en/format-PDF/source-258638371 (accessed on 30 May 2022).
  3. ERTRAC Connected, Cooperative and Automated Mobility Roadmap. 2022. Available online: https://www.ertrac.org/uploads/documentsearch/id82/ERTRAC%20CCAM%20Roadmap%20V10.pdf (accessed on 30 May 2022).
  4. CAD Knowledge Base-Projects. Available online: https://www.connectedautomateddriving.eu/projects/findproject/ (accessed on 30 May 2022).
  5. CAD Knowledge Base–Test-Sities. Available online: https://www.connectedautomateddriving.eu/test-sites/ (accessed on 30 May 2022).
  6. Intelligent Transportation Systems Joint Program Office. Strategic Plan 2020–2025. Available online: https://www.its.dot.gov/stratplan2020/ITSJPO_StrategicPlan_2020-2025.pdf (accessed on 30 May 2022).
  7. Cross-Ministerial Strategic Innovation Promotion Program (SIP). Automated Driving for Universal Services. R & D Plan. Available online: https://en.sip-adus.go.jp/sip/file/sip_2020_plan_en_s-1.pdf (accessed on 30 May 2022).
  8. Xu, W. Policy to Promote Autonomous Driving. Available online: http://english.www.gov.cn/policies/policywatch/202101/05/content_WS5ff39f9fc6d0f725769433b4.html (accessed on 30 May 2022).
  9. Beijing to Build Pilot Zone for Self-Driving Vehicles. Available online: http://english.www.gov.cn/news/topnews/202009/22/content_WS5f6a06d4c6d0f7257693c7a2.html (accessed on 30 May 2022).
  10. Kombe, T.; Ele, P.; Florence, O.; Miasse, H.O. Modelling an interactive road signs system, using Petri nets. Transp. Telecommun. 2017, 18, 34. [Google Scholar] [CrossRef]
  11. Riouali, Y.; Benhlima, L.; Bah, S. Extended batches petri nets based system for road traffic management in WSNs. J. Sens. Actuator Netw. 2017, 6, 30. [Google Scholar] [CrossRef]
  12. Yang, B.; Hua, Z. A CFAR Algorithm Based on Monte Carlo Method for Millimeter-Wave Radar Road Traffic Target Detection. Remote Sens. 2022, 14, 1779. [Google Scholar] [CrossRef]
  13. Zhu, J.; Sun, K.; Sen, J.; Lin, W.; Hou, X.; Liu, B.; Qiu, G. Bidirectional long short-term memory network for vehicle behavior recognition. Remote Sens. 2018, 10, 887. [Google Scholar] [CrossRef]
  14. Pauer, G. Development potentials and strategic objectives of intelligent transport systems improving road safety. Transp. Telecommun. 2017, 18, 15–24. [Google Scholar] [CrossRef]
  15. Janušová, L.; Silvia, Č. Improving safety of transportation by using intelligent transport systems. In Transbaltica 2015, Proceedings of the 9th International Scientific Conference, Vilnius, Lithuania, 7–8 May 2015; Vilnius Gediminas Technical University: Vilnius, Lithuania, 2015. [Google Scholar]
  16. Sjöberg, K.; Andres, P.; Buburuzan, T. Cooperative intelligent transport systems in Europe. IEEE Veh. Technol. Mag. 2017, 12, 89–97. [Google Scholar] [CrossRef]
  17. Yang, D.; Jin, P.; Pu, Y.; Ran, B. Safe distance car-following model including backward-looking and its stability analysis. Eur. Phys. J. B 2013, 86, 92. [Google Scholar] [CrossRef]
  18. Pan, D.; Zheng, Y.; Qiu, J.; Zhao, L. Synchronous control of vehicle following behavior and distance under the safe and efficient steady-following state: Two case studies of high-speed train following control. IEEE Trans. Intell. Transport. Syst. 2018, 19, 1445–1456. [Google Scholar] [CrossRef]
  19. Wang, C.; Quddus, M.; Ison, S. The effect of traffic and road characteristics on road safety: A review and future research direction. Saf. Sci. 2013, 57, 264–275. [Google Scholar] [CrossRef]
  20. Uribe, D. Multi-agent approach to the two-second driving rule. J. Comput. 2018, 13, 168–175. [Google Scholar] [CrossRef]
  21. Gipps, P. A behavioural car-following model for computer simulation. Transport. Res. Part B Methodol. 1981, 15, 105–111. [Google Scholar] [CrossRef]
  22. Yang, D.; Zhu, L.-L.; Yu, D.; Yang, F.; Pu, Y. An enhanced safe distance car-following model. J. Shanghai Jiaotong Univ. Sci. 2014, 19, 115–122. [Google Scholar] [CrossRef]
  23. Treiber, M.; Arne, K. Traffic Flow Dynamics: Data, Models and Simulation; Springer: Berlin/Heidelberg, Germany, 2013. [Google Scholar]
  24. Aghabayk, K.; Sarvi, M.; Young, W. A state-of-the-art review of car-following models with particular considerations of heavy vehicles. Transp. Rev. 2015, 35, 82–105. [Google Scholar] [CrossRef]
  25. Kanagaraj, V.; Asaithambi, G.; Kumar, C.; Naveen, S.; Karthik, K.; Sivanandan, R. Evaluation of different vehicle following models under mixed traffic conditions. Procedia-Soc. Behav. Sci. 2013, 104, 390–401. [Google Scholar] [CrossRef]
  26. Jordanoska, V.; Gjurkov, I.; Danev, D. Comparative analysis of car following models based on driving strategies using simulation approach. Mobil. Veh. Mech. 2018, 44, 1–11. [Google Scholar] [CrossRef]
  27. Nagahama, A.; Yanagisawa, D.; Nishinari, K. Impact of next-nearest leading vehicles on followers’ driving behaviours and traffic stability in mixed traffic. J. Traffic Transp. Eng. Engl. Ed. 2020, 7, 42–51. [Google Scholar] [CrossRef]
  28. Chen, C.; Liu, L.; Du, X.; Pei, Q.; Zhao, X. Improving driving safety based on safe distance design in vehicular sensor networks. Int. J. Distrib. Sens. Netw. 2012, 2012, 469067. [Google Scholar] [CrossRef]
  29. InZnak-Intelligent Road Signs for Adaptative Roat Traffic Control Employing V2X Communication. Available online: http://Multimed.Biz/Inznak/ (accessed on 29 May 2020). (In Polish).
  30. Kotus, J.; Szwoch, G. Calibration of acoustic vector sensor based on mems microphones for doa estimation. Appl. Acoust. 2018, 141, 307–321. [Google Scholar] [CrossRef]
  31. Kurowski, A.; Marciniuk, K.; Kostek, B. Separability assessment of selected types of vehicle-associated noise. In Multimedia And Network Information Systems; Zgrzywa, A., Choroś, K., Siemiński, A., Eds.; Springer International Publishing: Cham, Switzerland, 2017; pp. 113–121. ISBN 978-3-319-43982-2. [Google Scholar]
  32. Marciniuk, K.; Szczodrak, M.; Czyzewski, A. An application of acoustic sensors for the monitoring of road traffic. In 2018 Signal Processing: Algorithms, Architectures, Arrangements, and Applications; SPA: New York, NY, USA, 2018; pp. 208–212. [Google Scholar]
  33. Kotus, J. Determination of the vehicles speed using acoustic vector sensor. In 2018 Signal Processing: Algorithms, Architectures, Arrangements, and Applications; SPA: New York, NY, USA, 2018; pp. 64–69. [Google Scholar]
  34. Kurowski, A.; Czyżewski, A.; Zaporowski, S. Automatic labeling of traffic sound recordings using autoencoder-derived features. In 2019 Signal Processing: Algorithms, Architectures, Arrangements, and Applications; SPA: New York, NY, USA, 2019; pp. 38–43. [Google Scholar]
  35. Czyżewski, J.; Kotus, G.S. Estimating traffic intensity employing passive acoustic radar and enhanced microwave Doppler radar sensor. Remote Sens. 2019, 1, 110. [Google Scholar] [CrossRef]
  36. Czyżewski, A.; Kurowski, A.; Zaporowski, S. Application of autoencoder to traffic noise analysis. In Proceedings of the Meetings on Acoustics, San Diego, CA, USA, 2–6 December 2019; Volume 39, p. 55003. [Google Scholar] [CrossRef]
  37. Cygert, S.; Czyżewski, A. Style transfer for detecting vehicles with thermal camera. In Proceedings of the 23nd International Conference on Signal Processing Algorithms, Architectures, Arrangements, and Applications SPA, Poznan, Poland, 18–20 September 2019. [Google Scholar] [CrossRef]
  38. Czyżewski, A.; Cygert, S.; Szwoch, G.; Kotus, J.; Weber, D.; Szczodrak, M.; Koszewski, D.; Jamroz, K.; Kustra, W.; Sroczyński, A.; et al. Comparative study on the effectiveness of various types of road traffic intensity detectors. In Proceedings of the 2019 6th International Conference on Models and Technologies for Intelligent Transportation Systems (MT-ITS), Krakow, Poland, 5–7 June 2019; pp. 1–7. [Google Scholar] [CrossRef]
  39. Szwoch, G. Combining road network data from openstreetmap with an authoritative database. J. Transport. Eng. Part A Syst. 2019, 2, 29. [Google Scholar] [CrossRef]
  40. Grabowski, D.; Czyżewski, A. System for monitoring road slippery based on CCTV cameras and convolutional neural networks. J. Intell. Inform. Syst. 2020, 10, 6. [Google Scholar] [CrossRef]
  41. Cygert, S.S.; Czyżewski, A. Vehicle detection with self-training for adaptative video processing embedded platform. Appl. Sci. 2020, 10, 5763. [Google Scholar] [CrossRef]
  42. Czyżewski, A. Comparing traffic intensity estimates employing passive acoustic radar and microwave Doppler radar sensor. J. Acoust. Soc. Am. 2020, 148, 2454. [Google Scholar] [CrossRef]
  43. Allaby, P.; Hellinga, B.; Bullock, M. Variable speed limits: Safety and operational impacts of a candidate control strategy for freeway applications. IEEE Trans. Intell. Transport. Syst. 2007, 8, 671–680. [Google Scholar] [CrossRef]
  44. Maciejewski, M. A comparison of microscopic traffic flow simulation. Transp. Probl. 2010, 5, 4. [Google Scholar]
  45. Song, J.; Wu, Y.; Xu, Z.; Lin, X. Research on car-following model based on sumo. In Proceedings of the 7th IEEE/International Conference on Advanced Infocomm Technology, Fuzhou, China, 14–16 November 2014; pp. 47–55. [Google Scholar]
  46. Codecá, L.; Härri, J. Towards multimodal mobility simulation of C-Its: The Monaco Sumo Traffic Scenario. In Proceedings of the 2017 IEEE Vehicular Networking Conference (VNC), Torino, Italy, 27–29 November 2017; pp. 97–100, ISBN 2157-9865. [Google Scholar]
  47. Codeca, L.; Frank, R.; Engel, T. Luxembourg sumo traffic (lust) scenario: 24 hours of mobility for vehicular networking research. In Proceedings of the 2015 IEEE Vehicular Networking Conference (VNC), Kyoto, Japan, 16–18 December 2015; pp. 1–8, ISBN 2157-9865. [Google Scholar]
  48. Droździel, P.; Tarkowski, S.; Rybicka, I.; Wrona, R. Drivers’ reaction time research in the conditions in the real traffic. Open Eng. 2020, 10, 35–47. [Google Scholar] [CrossRef]
  49. Jurecki, R.S.; Zdanowicz, P. Driver’s reaction time under emergency braking a car. Transport 2012, 14, 295–301. [Google Scholar]
  50. Jurecki, R.; Stańczyk, T.; Jaśkiewicz, M. Driver’s reaction time in a simulated, complex road incident. Transport 2017, 32, 44–54. [Google Scholar] [CrossRef]
  51. Higgs, B.; Montasir, A.; Medina, A. Analysis of the Wiedemann car following model over different speeds using naturalistic data. Procedia RSS Conf. 2011. Available online: https://onlinepubs.trb.org/onlinepubs/conferences/2011/RSS/3/Higgs,B.pdf (accessed on 9 April 2022).
  52. Chaudhari, A.A.; Karthik, K.; Chilukuri, B.R.; Treiber, M.; Okhrin, O. Calibrating Wiedemann-99 model parameters to trajectory data of mixed vehicular traffic. Transport. Res. Rec. 2022. [Google Scholar] [CrossRef]
  53. Rahmi, A.; Besley, M. Acceleration and deceleration models. In Proceedings of the 23rd Conference of Australian Institutes of Transport Research (CAITR 2001); Monash University: Melbourne, Australia, 2001; Voume 10. Available online: https://www.researchgate.net/profile/Rahmi-Akcelik/publication/238778191_Acceleration_and_deceleration_models/links/004635328134528aaa000000/Acceleration-and-deceleration-models.pdf (accessed on 9 April 2022).
  54. Kudarauskas, N. Analysis of emergency braking of a vehicle. Transport 2007, 22, 154–159. [Google Scholar] [CrossRef]
  55. Dunn, J. On multiple tests and confidence intervals. Commun. Stat. 1974, 3, 101–103. [Google Scholar] [CrossRef]
  56. Lee, S.; Lee, D. What is the proper way to apply the multiple comparison test? Korean J. Anesthesiol. 2018, 71, 353–360. [Google Scholar] [CrossRef] [PubMed]
  57. Ragnoli, A.; Corazza, M.V.; Di Mascio, P. Safety ranking definition for infrastructures with high PTW flow. J. Traffic Transport. Eng. 2018, 5, 406–416. [Google Scholar] [CrossRef]
Figure 1. The geometry of the road used for the simulation.
Remotesensing 14 02803 g001
Figure 2. The model of road sections adopted in the travel time simulation.
Remotesensing 14 02803 g002
Figure 3. The result obtained for drivers reaction time, equal to 850 ms and traffic intensity of 400 vehicles per hour.
Remotesensing 14 02803 g003
Figure 4. Boxplot visualization illustrates increase in the vehicles’ minimal distance for each simulation scenario.
Remotesensing 14 02803 g004
Figure 5. Normalised travel time, depending on traffic volume and road signs distance. (a) Road G: L = 1 km, TL = 600 m; (b) Road GP: L = 1 km, TL = 600 m; (c) Road S: L = 2 km, TL = 1600 m; (d) Road S: L = 2 km, TL = 1600 m.
Remotesensing 14 02803 g005aRemotesensing 14 02803 g005b
Table 1. Results of Dunn post hoc test carried out for acquired values of minimal distance increase after turning on the traffic management system.
850 ms1150 ms1500 ms-
400 vph800
vph
1200
vph
400 vph800
vph
1200
vph
400 vph800
vph
1200
vph
Ref.
850 ms400
vph
-0.420.680.040.140.150.110.070.14 < 10 3
800
vph
0.42-0.220.210.520.020.420.010.02 < 10 3
1200
vph
0.680.22-0.010.060.310.040.160.28 < 10 3
1150 ms400
vph
0.040.210.01-0.55 < 10 3 0.66 < 10 3 < 10 3 < 10 3
800
vph
0.140.520.060.55- < 10 3 0.88 < 10 3 < 10 3 < 10 3
1200
vph
0.150.020.31 < 10 3 < 10 3 - < 10 3 0.710.96 < 10 3
1500 sm400
vph
0.110.420.040.660.88 < 10 3 - < 10 3 < 10 3 < 10 3
800
vph
0.070.010.16 < 10 3 < 10 3 0.71 < 10 3 -0.75 < 10 3
1200
vph
0.140.020.28 < 10 3 < 10 3 0.96 < 10 3 0.75- < 10 3
-Ref. < 10 3 < 10 3 < 10 3 < 10 3 < 10 3 < 10 3 < 10 3 < 10 3 < 10 3 -
Publisher’s Note: MDPI stays neutral with regard to jurisdictional claims in published maps and institutional affiliations.