Abstract
The article presents the results of satellite railway track position measurements performed by a multidisciplinary research team, the members of which represented Gdansk University of Technology and Gdynia Maritime University. Measuring methods are described which were used for reconstructing the railway track axis position and diagnosing railway track geometry deformations. As well as that, the description of the novel method developed by the authors to perform mobile GNSS measurements is included. The reported research aimed at assessing the uncertainty of railway track axis reconstruction making use of the dynamic GNSS method. To assess the applicability of this method, the obtained results were compared with those from the stationary measurement method used in railway business. The data used for comparison was recorded on the same railway track section during several measurement campaigns. In these campaigns, different types of GNSSs with different position recording frequencies (1–100 Hz) were used at different measurement speeds (5–70 km/h). The performed analysis has shown that the accuracy of railway track axis reconstruction making use of mobile GNSS measurements is sufficient for using this methodology in railway business.
1. Introduction
Railway transport plays a significant role in developed societies. Public expectations concerning the competitiveness of railway transport continue to increase, which reflects a growing awareness about the effect of transport means on the environment [1,2,3] and threats related with traffic safety [4,5].
Due to dynamic effects that take place at contact points between the train wheels and the rails, which then are transmitted to the wagon bodywork, the geometry of the railway track and its deformations are decisive for permissible train speed [6,7]. The time of journey, as well as the comfort and safety of passengers, are the basic measures of railway transport competitiveness [8,9].
The effective and safe railway traffic operation requires maintaining an extremely high quality of track geometry. Building and further maintenance of the railway track are among basic factors in the lifetime of a rail investment project [10]. The frequencies and ranges of track maintenance activities depend on a number of variables, such as amount of transport, train speeds, type of surface, location, geometry, etc. [11,12,13].
From the point of view of their geometry, the designed railway tracks have a precisely defined general shape, the so-called macrogeometry. This macrogeometry is implemented in field conditions when the track is built. During both the railway-track-building process and its further operation, certain differences appear between the designed and real geometry, which bear the name of microgeometry. The relationship between track macro- and microgeometry is shown in Figure 1.
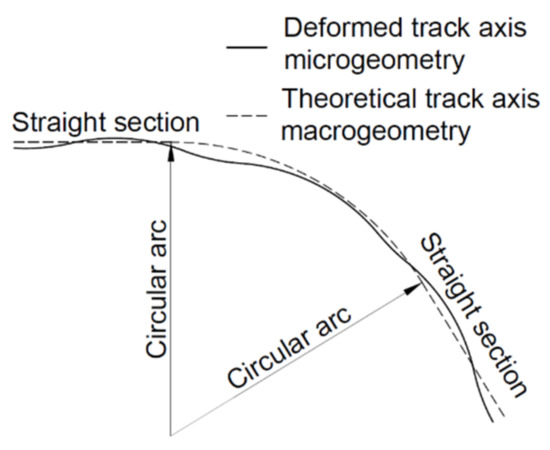
Figure 1.
Relationship between railway track macro- and microgeometry.
The railway track position can be measured using different methods. Classic measurements allow for the reproduction of geometries in local reference systems—most frequently associated with the railway track itself (involute methods) or with control marks situated in its vicinity [14]. The involute methods enable very precise detection of local cases of track unevenness, but they do not provide track co-ordinates in the global co-ordinate system, which is necessary for reconstructing macrogeometry deformations. Additionally, the measurement is made locally, which makes both determining an accurate position of the detected deformation and maintaining good repeatability of measurement extremely difficult [15]. The same is true for railway track axis measurements making use of classic control marks. In this case, the person making the measurement can calculate differences of the position of the railway track in operation with respect to the new one, but is still unable to calculate deformations of railway track macrogeometry, as the track could already have been built in a defective manner.
A modification of the classic measurement method consists of making use of railway geodetic networks and existing track axis control marks as measuring marks. A sufficiently high density of distribution of points with co-ordinates known in the global co-ordinate system has made it possible to determine (using a tacheometer and the polar method) co-ordinates of points situated along the track axis. This modified classic method is nowadays used by the majority of railway infrastructure managers [16,17,18,19,20]. The measurements are performed using high-class tacheometers which work in a free stationing mode [21]. This approach makes it possible to determine track co-ordinates with arbitrary density, as a result of which the local accuracy of measurement reaches the level of several millimeters. Globally, the measurement can be burdened with a systematic error resulting from the uncertainty of setting the geodetic network itself. In Poland, such measurements make use of points constituting the Special Railway Control Network (KOS) [22,23,24].
The basic disadvantage of measurements performed in free stationing mode is their low efficiency, comparable with that of methods making use of classic track axis control marks, which allow for the measuring of a track section of up to several hundred meters in length to be completed in one hour. Moreover, this method requires a measuring team of a few people, which considerably increases the cost of survey performed throughout the entire railway network. Hence, attempts are made to find more precise and effective methods to identify the geometry of the railway track and its deformations. The standards that are presently in force in Europe define the following measurements and the applied methods [25,26]:
- Involute measurements—track microgeometry measurement based on measurement of sagittas (static, making use of a pushed track gauge or a measuring trolley) [27,28].
- Inertial measurements—determining the quality of track geometry by measuring the effects of motion of the measuring trolley or vehicle on the deformed track [29,30,31].
- Tacheometric measurements—determining track axis co-ordinates in relation to the railway control network (static or making use of trolleys and robotic devices) [32].
- Additionally, the following groups of methods are being developed now:
- GNSS measurements—determining track axis co-ordinates from the results obtained using GNSS positioning techniques (static RTK, or mobile) [33,34,35,36];
- MLS measurements—determining track axis co-ordinates based on laser scanning [37,38];
- Methods combining some of the abovenamed measurement solutions [39,40,41,42].
All these measurement methods make it possible to reconstruct track micro- or macrogeometry, but their efficiency differs considerably. In general, methods based on measuring local track parameters allow for the achievement of very good results of track microgeometry measurement and are very efficient. On the other hand, measurements making use of geodetic networks enable reconstructing of the track macrogeometry, but their efficiency is low, and they require the presence of an expensive and troublesome surveying grid. That is why many hopes rest on GNSS-technique-based methods, as they offer track macrogeometry measurements which are highly efficient and do not require an expensive surveying grid. However, it is still questionable whether these methods can be effectively used for assessing track microgeometry. Figure 2 presents a collation of typical measurement methods used in railway business.
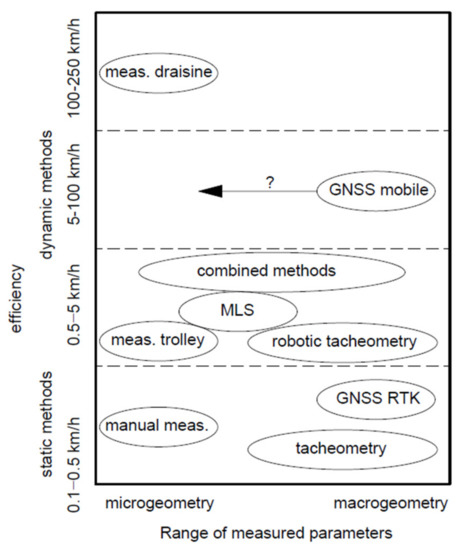
Figure 2.
Comparing efficiency and usefulness of typical measurement methods. Own elaboration based on [27].
This article compares the results of track macro- and microgeometry measurements made using different methods to check whether the present stage of development of GNSS-based measurement methods allows them to be used for analyzing railway track axis deformations.
The presented measurements and the analysis of their results were made as part of the work carried out in the InnoSatTrack project (BRIK project).
2. Materials and Methods
2.1. Mobile Satellite Measurements of Railway Tracks
Satellite measurements of railway tracks are not considered innovative solutions any longer. Attempts to implement GNSS measurements in the railway business started almost directly after switching off the Selective Availability system for GPS, which took place on 2 May 2000 [43]. Since then, the satellite system has become available for civil geodetic applications.
However, performing precise measurements using GNSS techniques still requires taking into account many components that affect the accuracy of determining the position. In applications where the centimeter-level accuracy (or even more precise) is required, it is crucial to effectively reduce or eliminate errors such as: inaccuracy of broadcast satellite orbits, error in the synchronization of satellite and receiver clocks, and errors of signal propagation in the Earth’s atmosphere [44]. In geodetic practice, differential measurements, especially double differences, are most often used, which enables, most of all, to eliminate errors related to satellites [45]. With shorter vectors (the length depends on the current atmosphere conditions), this technique also allows for the reduction of the ionosphere and troposphere effect [46]. However, over longer distances, it is necessary to implement more advanced techniques. Regarding the ionospheric delay, the combination of multifrequency observations can be used to reduce the first-order ionospheric delay (representing 99% of the total delay) [47,48]. The application of various models allows, on the other hand, for the reduction of the tropospheric delay [49]. Nevertheless, in precision positioning, the delay value is estimated along with the position and correction of the receiver clock. The latter value is critical in determining the receiver’s position and allows synchronization of the receiver’s clock with the GPS time. In addition to the discussed issues, it is also worth mentioning that it is important to take into account the model of the antenna phase center and conduct observations under favorable conditions [44]. Above all, the environment which can strengthen the multipath effect must be avoided. The multipath effect is not reduced by differential measurements. Furthermore, it is important to avoid the unfavorable conditions occurring in the ionosphere, for instance during geomagnetic storms when accuracy of precise GNSS measurements can be drastically decreased [50].
The first measurement systems used physical base stations for improving the accuracy of determining the receiver’s position [51]. The base station, having the form of an additional GPS situated above a point with known co-ordinates, was used to pass observations to the receiver (rover) measuring the track co-ordinates. The disadvantages of the abovementioned error-reduction method making use of a roving receiver included the need to connect to a physical geodetic network. The measurement accuracy decreases with the increasing distance from the physical reference station. In good measurement conditions, the measurement could be made at a radius of several hundred meters around the base receiver due to the increasing measurement uncertainty [51]. The scheme of GNSS measurement making use of two receivers is shown in Figure 3a.
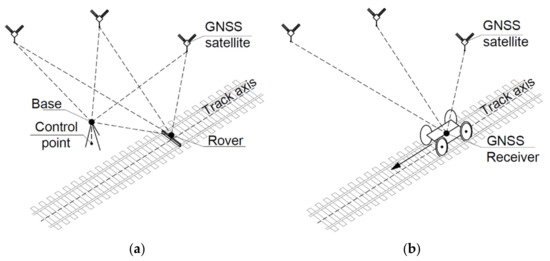
Figure 3.
Measurement of railway track axis co-ordinates with two GNSS receivers (a) and MSM technique (b).
In subsequent years, various networks of reference stations were activated, which allowed for the ability of performing GNSS measurements while taking into account network corrections delivered in real time by a computation center. A physical base receiver was replaced by a Virtual Reference Station (VRS). For railway applications, this was a breakthrough, as measuring long, linear track segments could be conducted now using a single GNSS receiver. Since the area between the reference stations was covered with the vector correction field, the position of the moving receiver did not affect the value of the position determination error much.
In 2009, the interdisciplinary research team of Gdansk University of Technology and Gdynia Maritime University started the research which aimed at investigating and then implementing mobile satellite measurements to railway activities. The Mobile Satellite Measurement (MSM) technique consists of the use of a rail vehicle as a measuring platform on which high-quality GNSS receivers are mounted. These receivers record discrete co-ordinates with a high frequency when the platform moves along the track, and thus determine the track axis position. The measuring platform can be self-propelled or pulled (pushed) by a motor vehicle. A scheme of the measurement making use of MSM technique is shown in Figure 3b.
During the research, various motor vehicles and measuring platforms were used. The measurements were conducted on standard and narrow-gauge railway lines, and on tram routes. The number, settings, and arrangement of GNSS receivers were modified to find an optimal configuration of measuring instruments [52,53]. The performed tests confirmed the usefulness of the method, high repeatability of the obtained results, and extremely high accuracy which allowed for the measuring and assessing of some groups of track-geometry defects [54,55,56]. However, the question is still open of how to increase the certainty of measurements performed in difficult conditions (for instance, in the situation of insufficient visibility of satellites) and what methods can be used to support the measurement in places where the GNSS signal is lost (e.g., under viaducts or in tunnels). Hence, the next measuring sessions included testing-support solutions which aimed at increasing the reliability of the MSM system.
To compare the uncertainty level of the measurement which can be reached using classic measurement methods and those making use of GNSS techniques, a number of comparison tests were performed. For this purpose, a fragment of railway track was selected which represented a typical track geometry consisting of a straight section, a circular arc, and a transition curve. Then, the track-position measurements were made using classic and GNSS-technique-based methods. In both cases, the obtained uncertainty level of measurement was assessed in such a way as to enable the comparison of these two methods.
2.2. Characteristic of the Test Segment
The railway track selected for measurement-system comparison tests was the railway line no. 211 (Chojnice-Kościerzyna) situated in Northern Poland. The measurements were conducted in a number of measuring campaigns on the test segment between stations Chojnice (kilometre 0 + 000) and Brusy (kilometre 26 + 600). The repeatability of track geometry reconstruction was tested on its shorter fragment between kilometers 5 + 600 and 12 + 000. The railway line on the test segment comprised both renovated sections and those expecting maintenance works. The entire test segment comprised the contactless railway track on a gravel ballast bed.
Due to relatively small traffic on railway line no. 211 (2 pairs of trains composed of light diesel trainsets SA-109), the geometry degradation during 2 years after the most recent maintenance works was expected to be negligibly small, and it could be assumed that in the next measurements the test segment would exhibit the same defects (the same macro- and microgeometry). The geographical location of the measured test segment is shown in Figure 4.
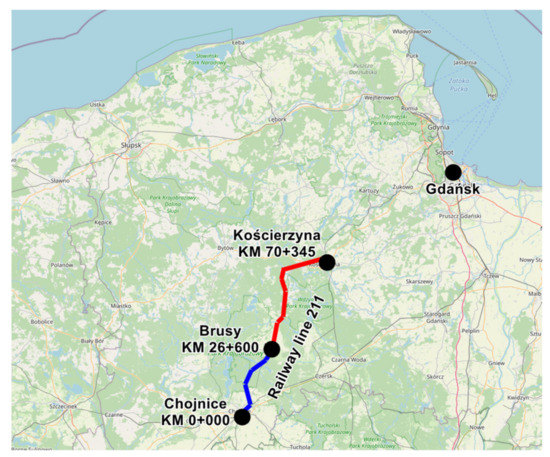
Figure 4.
Geographical location of the test segment (marked in blue).
2.3. Measuring Campaigns
The track segment selected for the reported tests (between kilometers 9 + 600 and 12 + 000) was part of the track on which one of the past control measurements was made in July 2019 (Measuring campaign no. 1) [57]. The next mobile measurement campaigns were conducted in December 2019 (Measuring campaign no. 2 and in March 2020 (Measuring campaign no. 3). During the campaign no.3, the data from a total of 8,327,280 measuring points was recorded.
The parameters recorded during mobile GNSS measurements described the track position in two planes, which allowed reconstructing the track geometry and its deformations. However, the measured co-ordinates contained errors resulting from both the applied measurement method and the obstacles deforming or blocking the satellite signal. Consequently, the detected railway track geometry deformations from the designed shape could reflect either the existing real defects (horizontal and vertical unevenness, settlement, etc.), or result from erroneous reading of co-ordinates by the receiver. Two measuring campaigns were planned which aimed at assessing the compatibility of the track axis co-ordinates obtained using the measuring methods being alternatives for each other, i.e., satellite GNSS measurement vs. polar method combined with trigonometric levelling to the KOS network. The first static measuring campaign was planned for December 2019, and the second for December 2020. The test segments in these two campaigns covered fragments of railway line no. 211 between kilometers 9 + 600 and 12 + 000 (December 2019) and between 9 + 600 and 5 + 600 (December 2020).
2.4. Characteristic of the Test Segment
The measurement was performed using a measuring unit consisting of a motor vehicle (draisine DH-350.11), an optional buffer trolley, and a measuring trolley. A flatcar 401Z was used as the measuring trolley on which measuring instruments and supporting devices were mounted in specially prepared universal rails.
The measurements were repeated several times using the following GNSS receivers:
- Leica Viva GS-18;
- Trimble R10;
- Trimble Alloy.
The GNSS receivers were mounted over the bogie pivot pins and in the lateral axis passing through the pivot pin. The configuration of the measuring instruments is shown in Figure 5, and their sample assembly in universal rails in Figure 6.
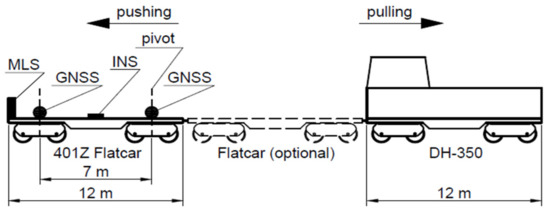
Figure 5.
Configuration of the measuring unit used in Mobile Satellite Measurements.
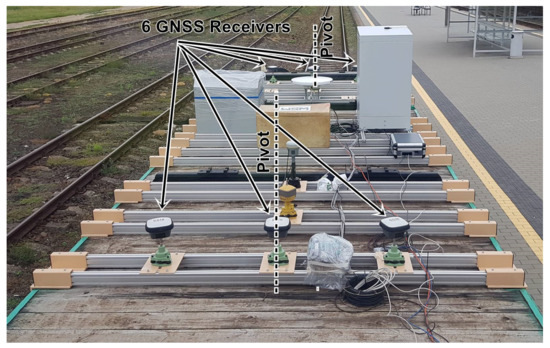
Figure 6.
Measuring instruments mounted in universal rails.
Static measurement:
The static measurement was performed using two measuring units.
Unit 1 comprised:
- Track gauge Graw TEC 1435 with a tripod for envelope measurement;
- GNSS receiver Trimble R10 or Leica Viva GS-16 installed on the tripod;
- Surveying prism Leica GPR121 installed on the tripod.
Unit 2 comprised:
- A horizontal measuring bar made of aluminum profiles and a small table for mounting a GNSS receiver or a surveying prism;
- GNSS receiver Leica Viva GS-16 installed on the table;
- Surveying prism Leica GPR121 installed on the table.
The measurement of railway track axis co-ordinates using the polar method combined with trigonometric levelling was made with a single tacheometer Leica TCRP 1201 or a set of two tacheometers Leica TCRP 1201 and Leica TM50. These two measuring units are shown in Figure 7.
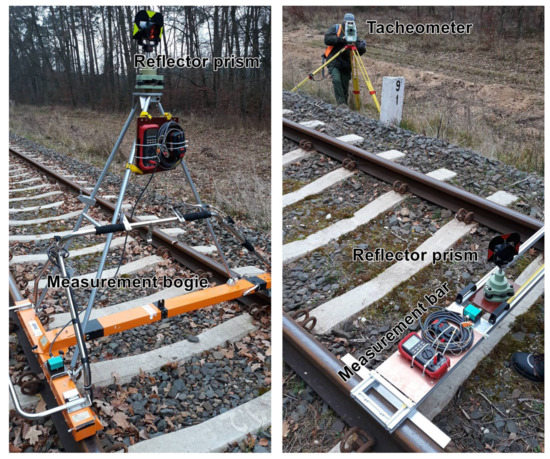
Figure 7.
Measuring units used in static measurements.
The measurement of co-ordinates of the KOS control points was performed using 4 GNSS receivers mounted on tripods (Figure 8):
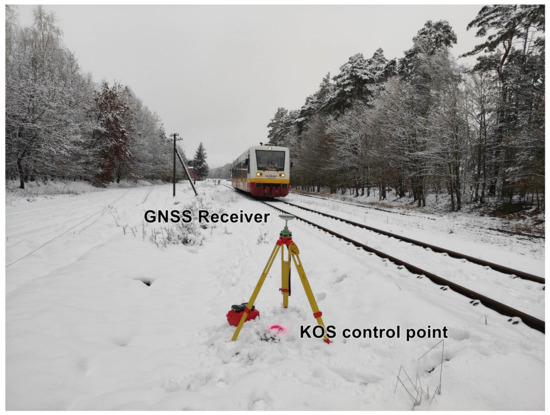
Figure 8.
GNSS receiver during the measurement of KOS co-ordinates.
- Leica Viva GS-16;
- Leica GS07—2 pieces;
- Leica ATX1230+.
3. Results
3.1. Limitations of the Methodology Used
The preliminary analyses of the recorded measurement signal have shown that on the track segment measured statically in 2020, clear differences between signals recorded using the dynamic methods and the tacheometric methods can be observed. Particularly puzzling was the fact that the GNSS signal recorded during three mobile measuring campaigns coincided with that recorded during the campaign with tacheometer.
Two possibilities were considered:
- The appearance of repeatable measurement errors when passing the Powałki passenger stop;
- Incorrect determination of KOS co-ordinates.
Since the 3D resection did not exhibit errors in connecting to the railway control network, the first possibility seemed more likely. Eventually, a decision was made to perform an additional control measurement to check the correctness of determining KOS co-ordinates along the section on which the above differences were recorded. It turned out that the offset of co-ordinates increased steadily to reach the maximum value of about 0.09 m in the middle of a segment between pairs of points whose co-ordinates were measured using the static GNSS method. Since the change of KOS co-ordinates progressed gradually, it was practically imperceptible when analyzing the 3D resection made to determine co-ordinates of tacheometric stations.
During the first measuring campaign, 27 co-ordinates were recorded using the RTK method, 2116 using the mobile 1 Hz method (with the receiver fixed to the moving track gauge), and 264 using the tacheometric method.
During the second measuring campaign, 20 co-ordinates were recorded using the method of short static measurements, 2418 using the mobile 1 Hz method, 433 using the tacheometric method and a prism mounted on the track gauge, and 101 using the tacheometric method and a prism mounted on the measuring staff.
The mobile GNSS measurements consist of recording co-ordinates in given time intervals during the motion of the measuring trolley with a given speed. Hence, the distances between successive measuring points and the measured track position depend on the data recording frequency (in the reported research, the measuring frequencies were 1 Hz, 20 Hz, and 100 Hz) and the measuring trolley speed (5–70 km/h). Since not all configurations were utilized, the distances between points measured using the GNSS methods can vary:
- Up to 1.5 m for 1 Hz measurements on the manually pushed track gauge;
- From 0.14 m to 0.76 m for 20 Hz measurements;
- From 0.05 m to 0.19 m for 100 Hz measurements.
For static methods, the measuring step varied from approximately 10 m to 50 m, depending on the applied measurement method.
The performed comparison analysis has shown that due to different methodologies applied, finding co-ordinates measured using different methods which would coincide with each other is extremely difficult. Therefore, the compliance of the reconstructed track axis position as a whole with the real track location was selected as the basis for assessing the applicability of an individual measurement method.
The most severe problem in measuring railway infrastructure in operation is that the measured real track axis does not coincide with its designed position due to the existing horizontal and vertical unevenness. Therefore, using the design as the reference for the measurement methods should be limited only to a very general assessment of compliance of the obtained results. Based on the experience gained from past analyses [57], a decision was made to perform the compliance analysis of track axis position using the results obtained from static tacheometric measurements as the reference for comparison with the remaining methods. It is noteworthy here that static measurement is used in railway practice as the basic tool for reconstructing track axis co-ordinates; however, its usefulness depends on the correctness of determining railway geodetic network co-ordinates.
Another problem to be solved when using the mobile GNSS measurement methods refers to difficulties with the proper mounting of measuring instruments with respect to the track structure and finding a procedure for correct track axis reconstruction from the recorded data. According to the definition, the track axis is the line on the railhead plane situated parallel to the reference rail and distant from it by half of the nominal track width. The reference rail is most often the outer rail on an arc, and the nominal track width is 1435 mm, as measured 14 mm below the railhead plane. In real measurement conditions, the GNSS receivers, surveying prisms, and other measuring instruments are mounted above the railhead plane and with some offset in the horizontal plane. The vertical elevation results from the physical shape and dimensions of the vehicle used for measuring. For the measuring instruments mounted on the track gauge and on measuring trolleys, the vertical elevation is approximately 1.5 m above the railhead plane. The horizontal offset for the track gauge is about 0.2 m. For the receivers mounted above the pivot pins, the horizontal offset results solely from the inaccuracy of assembly, while for the receivers mounted in the lateral axis it is 0.75 m. The horizontal offset of the measuring instruments mounted in the trolley axis beyond the horizontal plane of pivot pins results only from the inaccuracy of assembly when the measuring trolley moves on a straight track segment. When on an arc, additional offset appears which is caused by trolley adaptation to the arc.
Moreover, when the trolley moves on the tracks segment situated on a cant, another additional horizontal offset appears which is caused by the inclination of the measuring unit. Figure 9 shows shifts of measurement signals recorded using different methods.
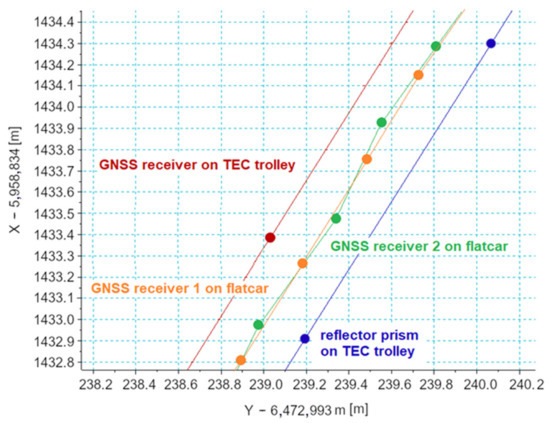
Figure 9.
Horizontal differences between co-ordinates recorded using different measurement techniques.
Due to the presence of the above offsets, the results of track axis measurement need to be reduced to the track axis position. Figure 10 shows schematically the horizontal and vertical offsets of the measured position with respect to the track axis.
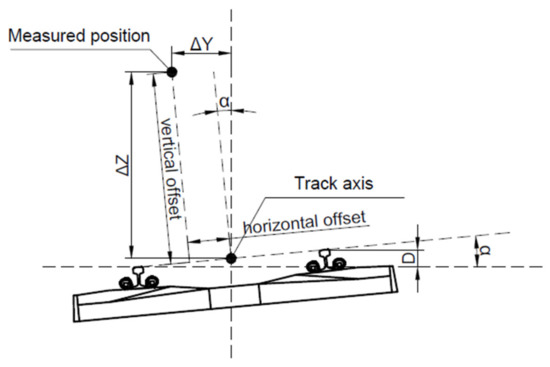
Figure 10.
Scheme of offsets of the measured position with respect to track.
To analyse problems concerning position measurements beyond the track axis, additional measurements were performed during which the surveying prism was mounted to a very low position on a measuring staff for the measured position to coincide as much as possible with the real position of the track axis.
3.2. Determining Uncertainty of Track Axis Position Measurement
Determining the track axis co-ordinates reduced to the railhead plane is calculated using the following formulas:
where: X, Y—co-ordinates obtained from GNSS receiver, h—GNSS receiver height above railhead, e—lateral displacement of the trolley with respect to track axis, α—roll angle, β—pitch angle, and δ—orientation angles in 2D space (heading/yaw).
Each of the above quantities is determined with some measurement uncertainty, which originates from certain characteristics of the measuring instruments (h, e, α, β, and δ) and/or from the current configuration of satellites and the current topography of the area in the vicinity of the railway track (co-ordinates Y, X). To assess the measurement uncertainty for a given quantity (here Y′, X′ co-ordinates), calculations should be performed in accordance with the uncertainty propagation law.
Assuming that the used system consists of six receivers, the co-ordinates of each measuring platform pivot pin are determined from the co-ordinates of two groups of three receivers situated, respectively, above the first and second bogie. The below-presented analysis was performed for the receivers situated above the first measuring bogie, assuming that each receiver in the group generates high-quality results. In this situation, the pivot-pin axis co-ordinates are calculated from the formula:
The standard uncertainty of determining co-ordinates YA, XA is given as:
The standard uncertainties of partial measurements are expressed by the values of the coefficient CQ2D, being the standard deviation of determining co-ordinates on a 2D plane.
The uncertainties of measurement of railway track axis co-ordinates reduced to the railhead plane are given by the following formulas:
After calculating and substituting partial derivatives, we have:
After obtaining the standard uncertainty values, the expanded uncertainty was calculated using the coverage factor k = 2. For this value of k, the result of measurement is given with the confidence level of 95%, which means that in 95% of cases, the real value of the measured quantity (co-ordinates) is within the range: result ± extended uncertainty.
Additionally, the analysis was performed for real differences between track axis co-ordinates reconstructed using the mobile vs. static methods. In this case, the reference axis was that which was determined in stationary measurements. It was assumed that between the co-ordinates measured using the stationary methods, the track axis had the form of either a straight line or a constant-radius arc. This assumption could be assumed for stationary measurements performed approximately every 10 m, as the horizontal unevenness on the measured railway line had the form of arcs with extremely large radii, whose sagitta on the chord of 10 m was negligibly small. The applied methodology of analysis was described in more detail in [57].
4. Analysis of Differences and Assessment of Trajectory Measurement Uncertainty
4.1. Assessing the Uncertainty of GNSS Trajectory Measurement
It was stated that the maintenance condition of the examined track segment is very good and well-adapted to the permissible speed limit (120 km/h). On macrogeometrical track sections (straight line, arc), the effect of microgeometrical imperfections could be observed, usually at the level of several tens of millimeters.
The measurements performed using a tacheometer, KOS network, and GNSS receivers mounted on the measuring staff and on the track gauge, along with the correction method applied to GNSS results, (RTK, post-processing) have made the basis for assessing the extended measurement uncertainty for static measurements, which amounted to:
- 10 mm for very good quality of GNSS signal;
- 20 mm (most often recorded) for medium quality of GNSS signal;
- 40 mm for poor quality of GNSS signal (especially for track section km 10 + 250–10 + 400).
The accuracy of measurement depended on the quality of the GNSS signal, as well as on the corrections received from the reference stations (for 1 Hz signal in RTK measurement) and used in postprocessing (20 Hz signal).
4.2. Analysis of Differences in the Reconstructed Track Axis Position
Figure 11 and Figure 12 present the analysis of a selected part of the recorded measurement results. Different colors were used to mark aggregate results of multiple receivers obtained for mobile measurements making use of GNSS techniques:
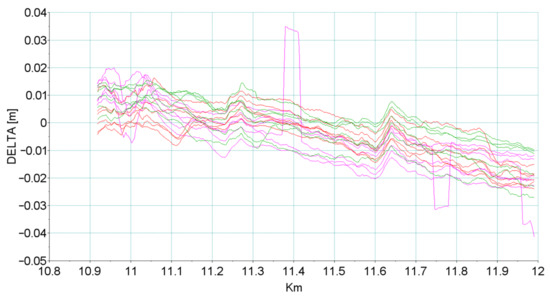
Figure 11.
Deviations of the reconstructed track axis in horizontal plane for particular measuring instruments with respect to static measurement.
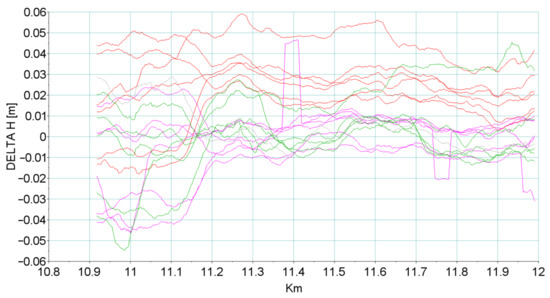
Figure 12.
Deviations of the reconstructed track axis in vertical plane for particular measuring instruments with respect to static measurement.
- GNSS 07.2019: 20 Hz—green;
- GNSS 17.12.2019: 20 Hz—purple;
- GNSS 10.03.2020: 100 Hz—red.
Table 1 and Figure 13 and Figure 14 show statistical parameters (median MED and standard deviation STD) describing differences in the track axis reconstructed in successive measuring campaigns using particular receivers. These parameter values made the basis for assessing the quality of track axis reconstruction using the MSM method.

Table 1.
Statistical values describing the reconstructed measurement signal.
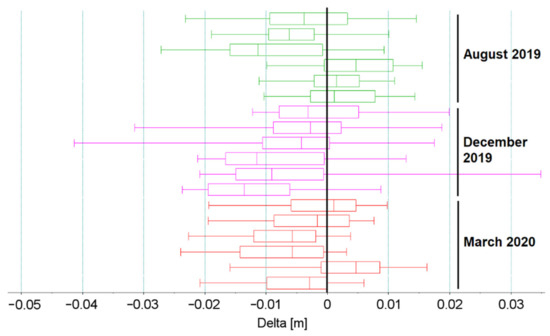
Figure 13.
Box plot of deviations of the track axis reconstructed in horizontal plane using different measuring instruments with respect to the static measurement.
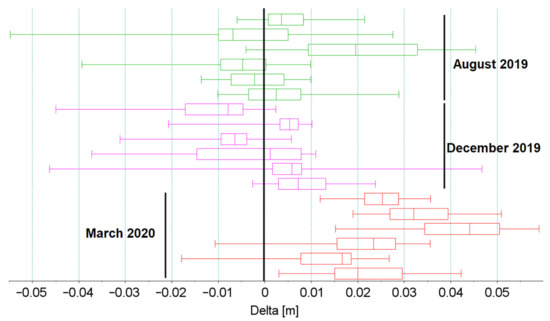
Figure 14.
Box plot of deviations of the track axis reconstructed in vertical plane using different measuring instruments with respect to the static measurement.
The obtained empirical distributions of measurement uncertainty for MSM in comparison to the classical measurement methods show their mutual convergence at the level of a couple to several millimeters. This level of measurement uncertainty is acceptable for measurements with the use of railway geodetic networks, so it is possible to conclude that the measurements performed with the use of MSM methods enable the correct reproduction of at least the track macrogeometry.
Figure 15 presents a comparison of the results obtained for particular measurement systems, along with the corresponding uncertainty levels. As can be seen in Figure 15a, the GNSS measurements performed in good conditions provide results which comply with those obtained from the static method, as the areas defined by the expanded uncertainty levels for these two methods overlap each other. In Figure 15b, presenting the measurement results obtained in less favorable conditions, the compliance of the track axis position reconstructed using the two methods is still observed, although the expanded uncertainty level is higher in this case.
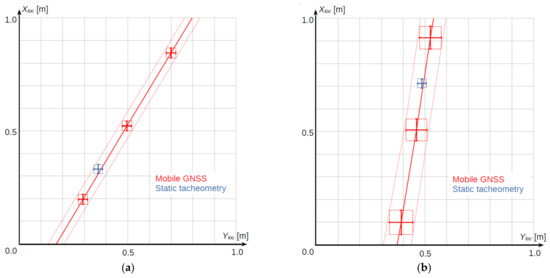
Figure 15.
Comparing the results obtained from GNSS system and from static method: (a) good conditions, (b) unfavorable conditions.
The results presented in Figure 15 confirm that it is possible to determine the position of the railway track axis using the MSM method with the level of uncertainty as for stationary measurements. At the same time, MSM offer many times greater measurement efficiency, which is a new quality in conducting inventory works on railway lines. Obtaining a low level of uncertainty for MSM is possible under the condition of high availability of the GNSS satellite signal.
5. Conclusions
Based on the performed analyses we can conclude that, assuming good measurement conditions (appropriate constellation of satellites and no natural obstacles), the version of the mobile GNSS system with six receivers provides results of railway track axis position measurement with the expanded uncertainty ranging from ±22 mm to ±27 mm. This result makes it possible to carry out inventory activities at the accuracy level close to that offered by stationary systems, at much higher efficiency.
The basic advantage of mobile measurement methods is their high efficiency. The methods making use of tacheometric measurement of co-ordinates in relation to the KOS network offer the efficiency at the level of 0.2–0.5 km/h. The highest efficiency recorded during the performed measurements was 0.4 km/h. It was achieved by the measuring team consisting of eight people and making use of two tacheometers and the surveying prism mounted on a track gauge trolley. At the same time, the RTK measurement method with the GNSS receiver mounted on the track-gauge trolley allowed for the performing of measurements with an efficiency of about 2.5 km/h, when track co-ordinates were measured every 100 m. In turn, the mobile GNSS measurement with the GNSS receiver mounted on the track gauge trolley allowed for the performing of measurements with efficiency of about 5 km/h. Finally, when the GNSS receivers were mounted on the measuring wagon, this efficiency increased even more and varied from 10 km/h to 70 km/h depending on the adopted measuring speed.
The quality of the KOS network varies significantly. The GNSS measurement made it possible to detect large errors in determining the position of the KOS control points on a section of the measured track.
The measurement of the total station in relation to the KOS control points must be performed by a team of at least six people, equipped with two total stations. A smaller number of people or only one total station causes very long breaks in the measurement due to the time spent on moving the free station.
The main disadvantage of mobile measurement methods is the time needed for data processing. In the reported case, this time was about 3 weeks and resulted from the specific nature of post-processing of GNSS data using ASG-EUPOS or HxGN SmartNet active geodetic networks’ raw data and SP3 precise orbits, in which accurate satellite trajectories are available only after 21 days. The co-ordinates recorded during the measurement can only be recalculated after obtaining this data. Such a long waiting time limits the use of the method to planned measurements in which the essential parameter is efficiency, while the time between the measurement journey and obtaining final results is less important. For unplanned and working measurements, they can also be made without precise information about satellite trajectories, but this deteriorates the accuracy of determination of railway track axis co-ordinates.
Author Contributions
Conceptualization, J.S. (Jacek Szmagliński) and A.W.; methodology, J.S. (Jacek Szmagliński), W.K., P.C. and J.S. (Jacek Skibicki); software, J.S. (Jacek Szmagliński), A.W., P.C. and M.M.; validation, J.S. (Jacek Szmagliński), J.S. (Jacek Skibicki), K.M.-J. and T.W.; formal analysis, J.S. (Jacek Szmagliński) and J.S. (Jacek Skibicki); investigation, J.S. (Jacek Szmagliński), K.K., P.C., S.G., S.J., R.L., K.M.-J. and T.W.; resources, K.M.-J. and T.W.; data curation, J.S. (Jacek Szmagliński), A.W., K.K., J.S. (Jacek Skibicki), S.J. and M.M.; writing—original draft preparation, J.S. (Jacek Szmagliński), K.K., J.S. (Jacek Skibicki) and K.M.-J.; writing—review and editing, A.W. and W.K.; visualization, J.S. (Jacek Szmagliński) and J.S. (Jacek Skibicki); supervision, A.W. All authors have read and agreed to the published version of the manuscript.
Funding
The results of the research work presented in this article are a summary of one of the research stages being carried out as part of the research project No POIR.04.01.01-00-0017/17 entitled “Development of an innovative method for determining the precise trajectory of a railborne vehicle” by a consortium of the Gdansk University of Technology and the Gdynia Maritime University. The study was funded by the National Centre for Research and Development (Narodowe Centrum Badań i Rozwoju, NCBiR) and PKP Polskie Linie Kolejowe S.A.
Institutional Review Board Statement
Not applicable.
Informed Consent Statement
Not applicable.
Data Availability Statement
Not applicable.
Conflicts of Interest
The authors declare no conflict of interest.
References
- Brtnický, M.; Pecina, V.; Baltazár, T.; Galiová, M.V.; Baláková, L.; Bes, A.; Radziemska, M. Environmental impact assessment of potentially toxic elements in soils near the runway at the international airport in Central Europe. Sustainability 2020, 12, 7244. [Google Scholar] [CrossRef]
- Szmagliński, J.; Nawrot, N.; Pazdro, K.; Walkusz-Miotk, J.; Wojciechowska, E. The fate and contamination of trace metals in soils exposed to a railroad used by Diesel Multiple Units: Assessment of the railroad contribution with multi-tool source tracking. Sci. Total Environ. 2021, 798, 149300. [Google Scholar] [CrossRef] [PubMed]
- Yan, G.; Mao, L.; Liu, S.; Mao, Y.; Ye, H.; Huang, T.; Li, F.; Chen, L. Enrichment and sources of trace metals in roadside soils in Shanghai, China: A case study of two urban/rural roads. Sci. Total Environ. 2018, 631–632, 942–950. [Google Scholar] [CrossRef] [PubMed]
- Budzynski, M.; Szmaglinski, J.; Jamroz, K.; Birr, K.; Grulkowski, S.; Wachnicka, J. Assessing tram infrastructure safety using the example of the City of Gdansk. J. KONBiN 2019, 49, 293–322. [Google Scholar] [CrossRef]
- Jamroz, K.; Budzynski, M.; Romanowska, A.; Zukowska, J.; Oskarbski, J.; Kustra, W. Experiences and challenges in fatality reduction on polish roads. Sustainability 2019, 11, 959. [Google Scholar] [CrossRef]
- Esveld, C. Modern Railway Track; MRT Productions: Zaltbommel, The Netherlands, 2001; pp. 35–53, 107–170. [Google Scholar]
- Kardas-Cinal, E. Selected problems in railway vehicle dynamics related to running safety. Arch. Transp. 2014, 31, 37–45. [Google Scholar] [CrossRef]
- Su, M.; Luan, W.; Yuan, L.; Zhang, R.; Zhang, Z. Sustainability Development of High-Speed Rail and Airline—Understanding Passengers’ Preferences: A Case Study of the Beijing–Shanghai Corridor. Sustainability 2019, 11, 1352. [Google Scholar] [CrossRef]
- Loulova, M.; Suchanek, A.; Harusinec, J. Evaluation of the Parameters Affecting Passenger Riding Comfort of a Rail Vehicle. Manuf. Technol. 2017, 17, 224–231. [Google Scholar] [CrossRef]
- Domenico Gattuso, D.; Restuccia, A. A Tool for Railway Transport Cost Evaluation. Proc.-Soc. Behav. Sci. 2014, 111, 549–558. [Google Scholar] [CrossRef]
- Macchi, M.; Garetti, M.; Centrone, D.; Fumagalli, L.; Pavirani, G.P. Maintenance management of railway infrastructures based on reliability analysis. Reliab. Eng. Syst. Saf. 2012, 104, 71–83. [Google Scholar] [CrossRef]
- Odolinski, K.; Boysen, H.E. Railway line capacity utilisation and its impact on maintenance costs. J. Rail Transp. Plan. Manag. 2019, 9, 22–33. [Google Scholar] [CrossRef]
- Kasraei, A.; Zakreri, J.A. Effective time interval for railway track geometry inspection. Arch. Transp. 2020, 53, 53–65. [Google Scholar] [CrossRef]
- Lenda, G. Determining the Geometrical Parameters of Exploited Rail Track Using Approximating Spline Functions. Arch. Civ. Eng. 2014, 60, 295–305. [Google Scholar] [CrossRef]
- Khosravi, M.; Soleimanmeigouni, I.; Ahmadi, A.; Nissen, A. Reducing the positional errors of railway track geometry measurements using alignment methods: A comparative case study. Measurement 2021, 178, 109383. [Google Scholar] [CrossRef]
- 883.2000; DB_REF-Festpunktfeld; German Railway Standard. DB Netz AG: Frankfurt, Germany, 2016.
- 883.9010; Begriffe und Definitionen, Richtlinie, Version 7.0; German Railway Standard. DB Netz AG: Frankfurt, Germany, 2018.
- Meinck, M. Die neue Vermessungsrichtlinie Ril 883.2000 DB_REF-Festpunktfeld. In Proceedings of the Seminar Gleisbau 2017—Planung Und Vermessung, Berlin, Germany, 3–4 March 2017. [Google Scholar]
- NR/L2/TRK/3201; Network Rail—Management of Tight Clearances and Track Position; British Railway Standard. Network Rail: London, UK, 2010.
- NR/L3/TRK/0030; NR_Reinstatement of Absolute Track Geometry (WCRL Routes); British Railway Standard. Network Rail: London, UK, 2008.
- Bitterer, L.; Hodas, S. Geodetic Surveying of Railway Objects. WIT Trans. Built Environ. 1998, 34, 3–12. [Google Scholar] [CrossRef]
- Ig-6; Polish Railway Standard, Wytyczne dla Osadzania Znaków Regulacji Osi Toru na Konstrukcjach Wsporczych (Słupach) Sieci Trakcyjnej. PKP Polskie Linie Kolejowe S.A.: Warsaw, Poland, 2011.
- Ig-7; Polish Railway Standard, Standard Techniczny Określający Zasady i Dokładności Pomiarów Geodezyjnych dla Zakładania Wielofunkcyjnych Znaków Regulacji Osi Toru. PKP Polskie Linie Kolejowe S.A.: Warsaw, Poland, 2012.
- THRTR13000ST; Australian Railway Standard, Standard Railway Surveying. State of NSW: Sydney, NSW, Australia, 2016.
- EN 13848-2; CEN (European Committee for Standardization). Railway Applications–Track–Track Geometry Quality–Part 2: Measuring Systems–Track Recording Vehicles. CEN: Brussels, Belgium, 2008.
- EN 13848-4; CEN (European Committee for Standardization). Railway Applications–Track–Track Geometry Quality–Part 4: Measuring Systems–Manual and Lightweight Devices. CEN: Brussels, Belgium, 2011.
- Glaus, R. The Swiss Trolley: A Modular System for Track Surveying; Schweizerische Geodätische Kommission: Zürich, Switzerland, 2006. [Google Scholar]
- Yoshimura, A.; Naganuma, Y. A new method to reconstruct the track geometry from versine data measured in the curved track using the Monte Carlo Particle Filter. In Proceedings of the 12th International Conference and Exhibition Railway Engineering, London, UK, 10–11 July 2013. [Google Scholar]
- Odashima, M.; Azami, S.; Naganuma, Y.; Mori, H.; Tsanashima, H. Track geometry estimation of a conventional railway from car-body acceleration measurement. Mech. Eng. J. 2017, 4, 16–29. [Google Scholar] [CrossRef]
- Mori, H.; Tsanashima, H.; Kojima, T.; Matsumoto, A.; Mizuma, T. Condition Monitoring of Railway Track Using In-service Vehicle. J. Mech. Syst. Tran. Log. 2010, 3, 154–165. [Google Scholar] [CrossRef]
- Weston, P.F.; Ling, C.S.; Goodman, C.J.; Roberts, C.; Li, P.; Goodall, R.M. Monitoring lateral track irregularity from in-service railway vehicles. Proc. Inst. Mech. Eng. Part F J. Rail Rapid Transit 2007, 221, 89–100. [Google Scholar] [CrossRef]
- Izvoltova, J.; Villim, A.; Kozák, P. Determination of Geometrical Track Position by Robotic Total Station. Procedia Eng. 2014, 91, 322–327. [Google Scholar] [CrossRef]
- Koc, W.; Chrostowski, P.; Specht, C. Finding Deformation of the Straight Rail Track by GNSS Measurements. Annu. Navig. 2012, 19, 91–104. [Google Scholar] [CrossRef][Green Version]
- Koc, W.; Specht, C.; Chrostowski, P.; Palikowska, K. The accuracy assessment of determining the axis of railway track basing on the satellite surveying. Arch. Transp. 2012, 24, 307–320. [Google Scholar] [CrossRef]
- Beugin, J.; Marais, J. Simulation-Based evaluation of dependability and safety properties of satellite technologies for railway localization. Transp. Res. Part C Emerg. Technol. 2012, 22, 42–57. [Google Scholar] [CrossRef]
- Chen, X.; Landau, H.; Vollath, U. New Tools for Network RTK Integrity Monitoring. In Proceedings of the 6th International Technical Meeting of the Satellite Division of The Institute of Navigation, Portland, OR, USA, 9–12 September 2003. [Google Scholar]
- Zhang, S.; Wang, C.; Yang, Z.; Chen, Y.; Li, J. Automatic railway power line extraction using mobile laser scanning data. ISPRS–Int. Arch. Phot. Rem. Sens. Spat. Inf. Sci. 2016, 41, 615–619. [Google Scholar] [CrossRef]
- Qingquan, L.; Zhipeng, C.; Qingwu, H.; Liang, Z. Laser-Aided INS and Odometer Navigation System for Subway Track Irregularity Measurement. J. Surv. Eng. 2017, 143, 04017014. [Google Scholar] [CrossRef]
- Akpinar, B.; Gülal, E. Multisensor Railway Track Geometry Surveying System. IEEE Trans. Instrum. Meas. 2011, 61, 190–197. [Google Scholar] [CrossRef]
- Crespillo, O.G.; Heirich, O.; Lehner, A. Bayesian GNSS/IMU tight integration for precise railway navigation on track map. In Proceedings of the IEEE/ION PLANS 2014, Monterey, CA, USA, 5–8 May 2014. [Google Scholar] [CrossRef]
- Zhu, F.; Zhou, W.; Zhang, Y.; Duan, R.; Lv, X.; Zhang, X. Attitude variometric approach using DGNSS/INS integration to detect deformation in railway track irregularity measuring. J. Geod. 2019, 93, 1571–1587. [Google Scholar] [CrossRef]
- Shankar, S.; Roth, M.; Schubert, L.A.; Verstegen, J.A. Automatic Mapping of Center Line of Railway Tracks using Global Navigation Satellite System, Inertial Measurement Unit and Laser Scanner. Remote Sens. 2020, 12, 411. [Google Scholar] [CrossRef]
- Data from the First Week without Selective Availability. Available online: https://www.gps.gov/systems/gps/modernization/sa/data/ (accessed on 7 January 2022).
- Hofmann-Wellenhof, B.; Lichtenegger, H.; Wasle, E. GNSS–Global Navigation Satellite Systems: GPS, GLONASS, Galileo, and More; Springer: Wien, Austria; New York, NY, USA, 2008. [Google Scholar]
- Teunissen, P.J.G.; Montenbruck, O. (Eds.) Springer Handbook of Global Navigation Satellite Systems; Springer International Publishing AG: Cham, Switzerland, 2017. [Google Scholar] [CrossRef]
- Wielgosz, P.; Kashani, I.; Grejner-Brzezinska, D. Analysis of long-range network RTK during a severe ionospheric storm. J. Geod. 2005, 79, 524–531. [Google Scholar] [CrossRef]
- Kaplan, E.D.; Hegarty, C.J. Understanding GPS: Principles and Applications, 2nd ed.; Artech House Inc.: London, UK, 2006. [Google Scholar]
- Hernández-Pajares, M.; Juan, J.M.; Sanz, J.; Orús, R. Second-order ionospheric term in GPS: Implementation and impact on geodetic estimates. J. Geophys. Res. 2007, 112, B08417. [Google Scholar] [CrossRef]
- Zhou, F.; Li, X.; Li, W.; Chen, W.; Dong, D.; Wickert, J.; Schuh, H. The Impact of Estimating High-Resolution Tropospheric Gradients on Multi-GNSS Precise Positioning. Sensors 2017, 17, 756. [Google Scholar] [CrossRef]
- Poniatowski, M.; Nykiel, G. Degradation of Kinematic PPP of GNSS Stations in Central Europe Caused by Medium-Scale Traveling Ionospheric Disturbances During the St. Patrick’s Day 2015 Geomagnetic Storm. Remote Sens. 2020, 12, 3582. [Google Scholar] [CrossRef]
- Szwilski, T.B. Determining rail track movement trajectories and alignment using HADGPS. In Proceedings of the AREMA Conference, Chicago, IL, USA, 9–12 September 2003. [Google Scholar]
- Specht, C.; Koc, W.; Chrostowski, P.; Szmaglinski, J. Accuracy Assessment of Mobile Satellite Measurements Relation to the Geometrical Layout of Rail Tracks. Metrol. Meas. Syst. 2019, 26, 309–321. [Google Scholar] [CrossRef]
- Specht, C.; Koc, W.; Chrostowski, P.; Szmagliński, J. The Analysis of Tram Tracks Geometric Layout Based on Mobile Satellite Measurements. Urban Rail Transit 2017, 3, 214–226. [Google Scholar] [CrossRef][Green Version]
- Wilk, A.; Koc, W.; Specht, C.; Skibicki, J.; Judek, S.; Karwowski, K.; Chrostowski, P.; Szmagliński, J.; Dąbrowski, P.; Czaplewski, K.; et al. Innovative mobile method to determine railway track axis position in global coordinate system using position measurements performed with GNSS and fixed base of the measuring vehicle. Measurement 2021, 175, 109016. [Google Scholar] [CrossRef]
- Specht, M.; Specht, C.; Wilk, A.; Koc, W.; Smolarek, L.; Czaplewski, K.; Karwowski, K.; Dąbrowski, P.S.; Skibicki, J.; Chrostowski, P.; et al. Testing the Positioning Accuracy of GNSS Solutions during the Tramway Track Mobile Satellite Measurements in Diverse Urban Signal Reception Conditions. Energies 2020, 13, 3646. [Google Scholar] [CrossRef]
- Wilk, A.; Specht, C.; Koc, W.; Karwowski, K.; Skibicki, J.; Szmagliński, J.; Chrostowski, P.; Dabrowski, P.; Specht, M.; Zienkiewicz, M.; et al. Evaluation of the Possibility of Identifying a Complex Polygonal Tram Track Layout Using Multiple Satellite Measurements. Sensors 2020, 20, 4408. [Google Scholar] [CrossRef]
- Specht, C.; Wilk, A.; Koc, W.; Karwowski, K.; Dąbrowski, P.; Specht, M.; Grulkowski, S.; Chrostowski, P.; Szmagliński, J.; Czaplewski, K.; et al. Verification of GNSS Measurements of the Railway Track Using Standard Techniques for Determining Coordinates. Remote Sens. 2020, 12, 2874. [Google Scholar] [CrossRef]
Publisher’s Note: MDPI stays neutral with regard to jurisdictional claims in published maps and institutional affiliations. |
© 2022 by the authors. Licensee MDPI, Basel, Switzerland. This article is an open access article distributed under the terms and conditions of the Creative Commons Attribution (CC BY) license (https://creativecommons.org/licenses/by/4.0/).